Chart Color Schemes
This analysis uses ABS Statistical Areas Level 2 (SA2) boundaries, which can materially differ from Suburbs and Localities (SAL) even when sharing similar names.
SA2 boundaries are defined by the Australian Bureau of Statistics and are designed to represent communities for statistical reporting (e.g., census and ERP).
Suburbs and Localities (SAL) represent commonly-used suburb/locality names (postal-style areas) and may use different geographic boundaries. For comprehensive analysis, consider reviewing both boundary types if available.
est. as @ -- *
ABS ERP | -- people | --
2021 Census | -- people
Sales Activity
Curious about local property values? Filter the chart to assess the volume and appreciation (including resales) trends and regional comparisons, or scroll to the map below view this information at an individual property level.
Find a Recent Sale
Sales Detail
Population
An assessment of population growth drivers in Beenleigh reveals an overall ranking slightly below national averages considering recent, and medium term trends
Beenleigh's population was approximately 8,947 as of November 2025. This figure represents an increase of 522 people, a 6.2% rise from the 2021 Census which recorded a population of 8,425. The change is inferred from the estimated resident population of 8,938 in June 2024 and additional validated new addresses since the Census date. This results in a population density ratio of 1,166 persons per square kilometer, comparable to averages seen across locations assessed by AreaSearch. Beenleigh's growth rate of 6.2% since the census is within 2.7 percentage points of the national average of 8.9%, indicating competitive growth fundamentals. Overseas migration contributed approximately 57.9% of overall population gains during recent periods, driving primary growth in the area.
AreaSearch adopts ABS/Geoscience Australia projections for each SA2 area, released in 2024 with a base year of 2022. For areas not covered by this data and years post-2032, Queensland State Government's SA2 area projections are adopted, released in 2023 based on 2021 data. However, these state projections do not provide age category splits, so AreaSearch applies proportional growth weightings in line with the ABS Greater Capital Region projections for each age cohort, released in 2023 using 2022 data as the base year. Looking ahead, demographic trends project an above median population growth for Australian statistical areas. Beenleigh is expected to expand by 1,629 persons by 2041 based on the latest annual ERP population numbers, reflecting an increase of 18.1% in total over the 17 years.
Frequently Asked Questions - Population
Development
AreaSearch analysis of residential development drivers sees Beenleigh recording a relatively average level of approval activity when compared to local markets analysed countrywide
Beenleigh has recorded approximately 26 residential properties granted approval annually over the past five financial years, totalling 134 homes. As of FY-26, 57 approvals have been recorded. Each year, an average of 2.8 new residents is gained per dwelling built between FY-21 and FY-25. The average construction cost for new homes in Beenleigh is $240,000, below the regional average, indicating more affordable housing options.
This financial year has seen $54.6 million in commercial approvals, suggesting strong commercial development momentum compared to Greater Brisbane, where construction levels are 70.0% higher per person. Beenleigh's limited new supply generally supports stronger demand and values for established properties. The area's new development consists of 32.0% detached houses and 68.0% attached dwellings, marking a significant shift from the current housing pattern of 62.0% houses. This location has approximately 364 people per dwelling approval, reflecting an established area with population forecasts indicating a gain of 1,620 residents by 2041. Should current construction levels persist, housing supply may lag behind population growth, potentially intensifying buyer competition and underpinning price growth.
Population forecasts indicate Beenleigh will gain 1,620 residents through to 2041 (from the latest AreaSearch quarterly estimate). Should current construction levels persist, housing supply could lag population growth, likely intensifying buyer competition and underpinning price growth.
Frequently Asked Questions - Development
Infrastructure
Beenleigh has moderate levels of nearby infrastructure activity, ranking in the top 50% nationally
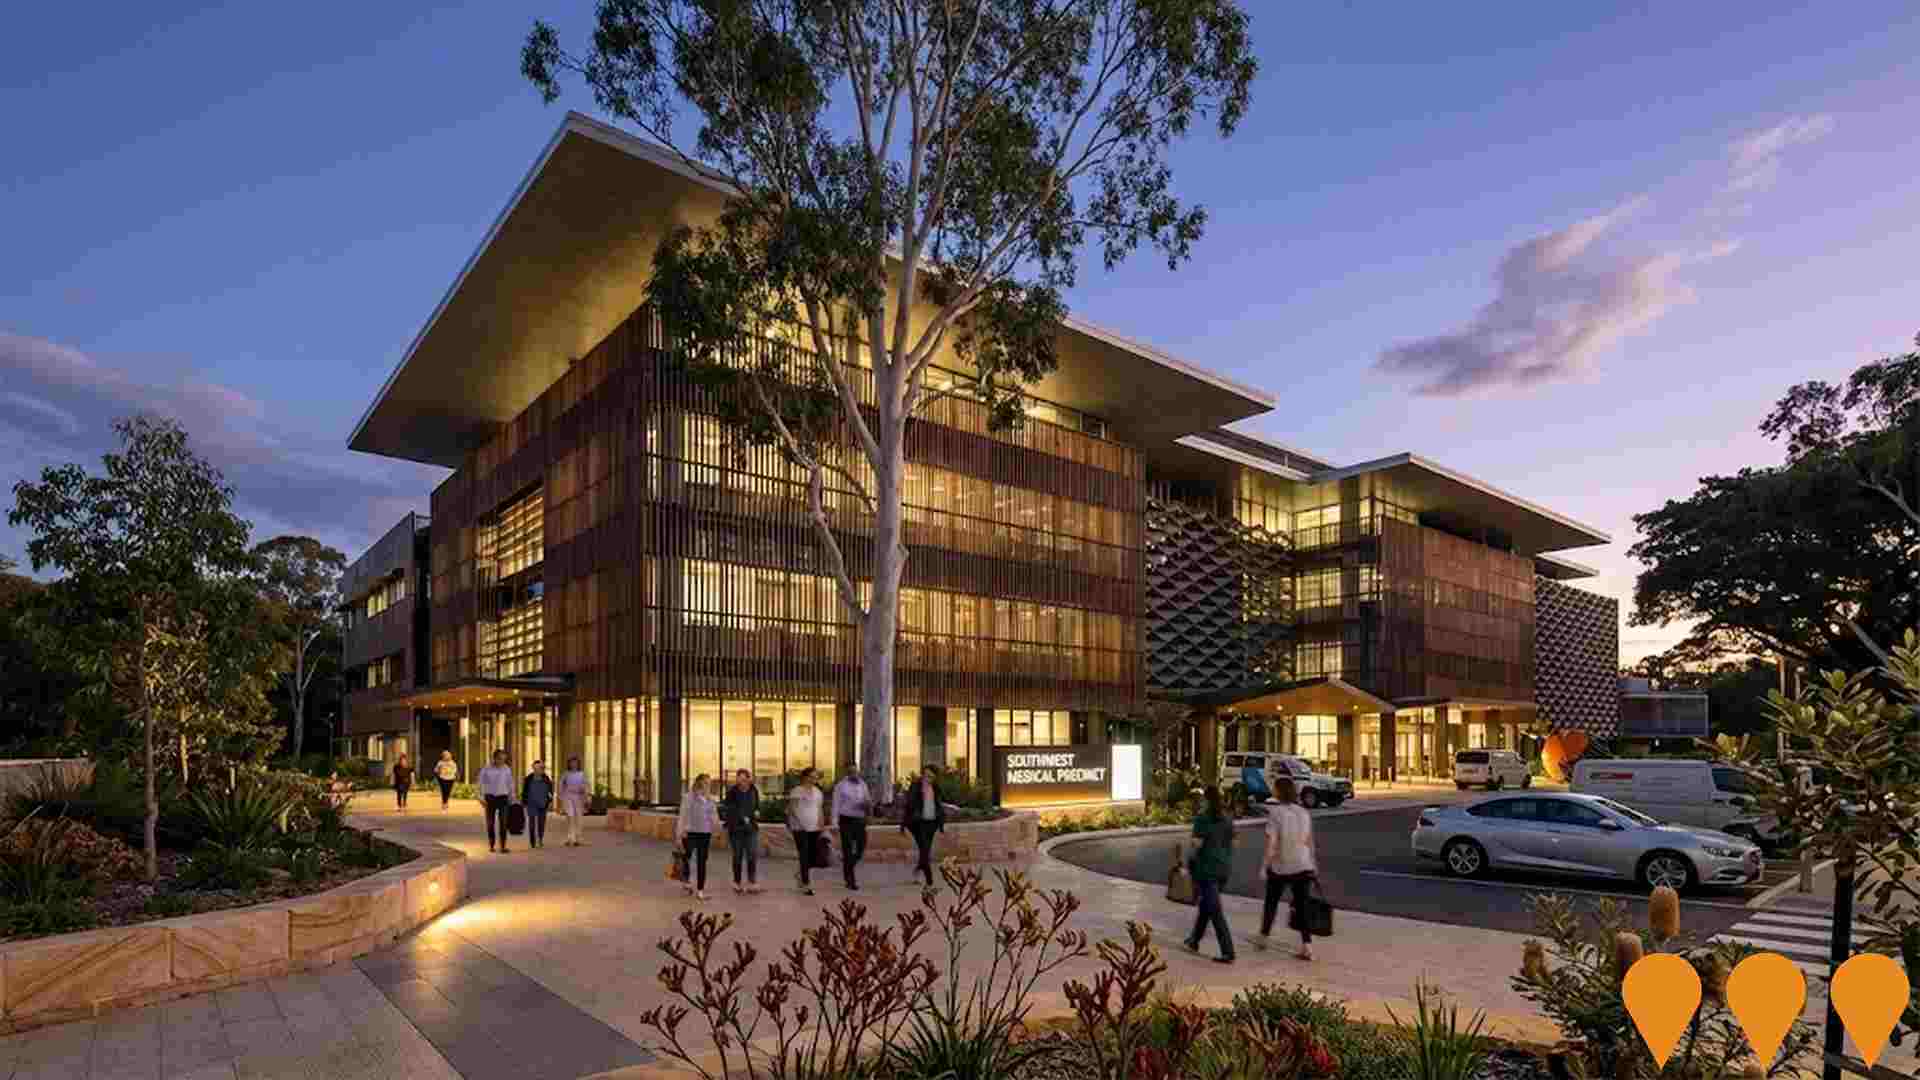
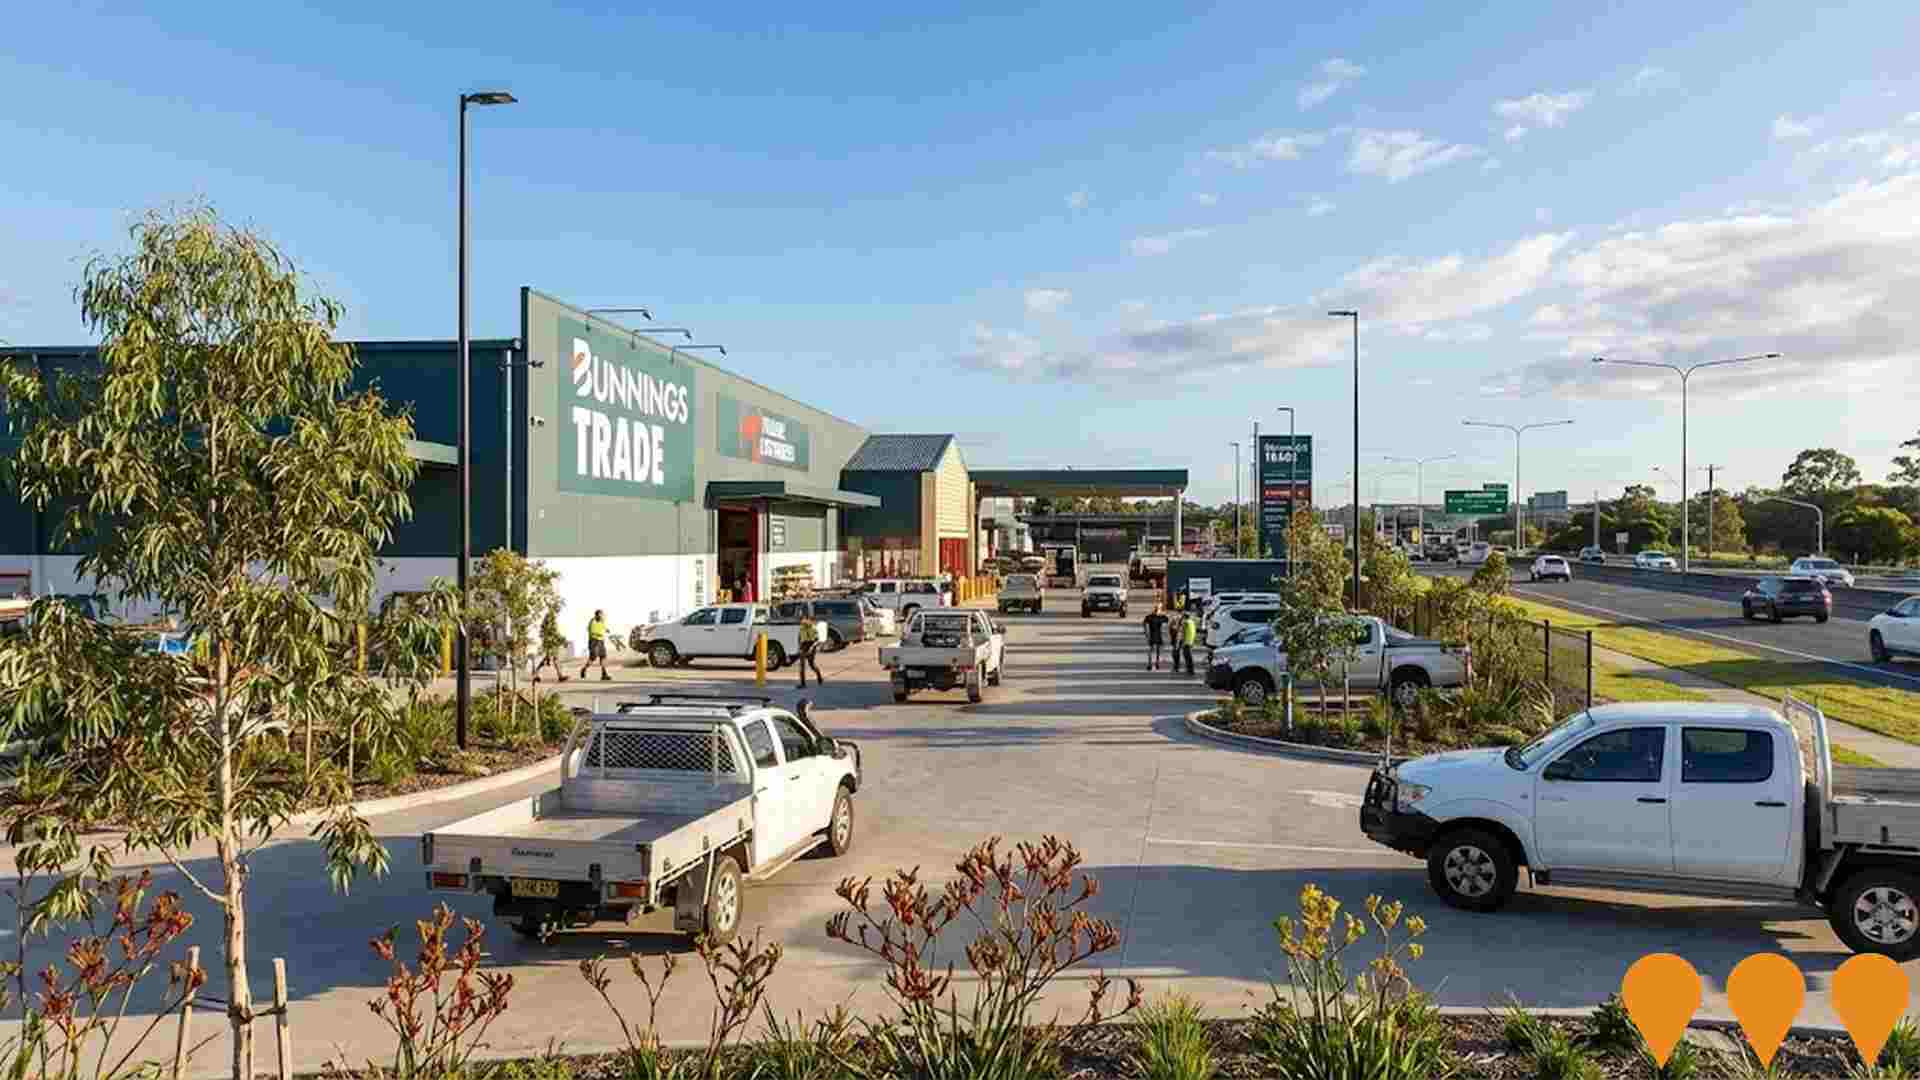
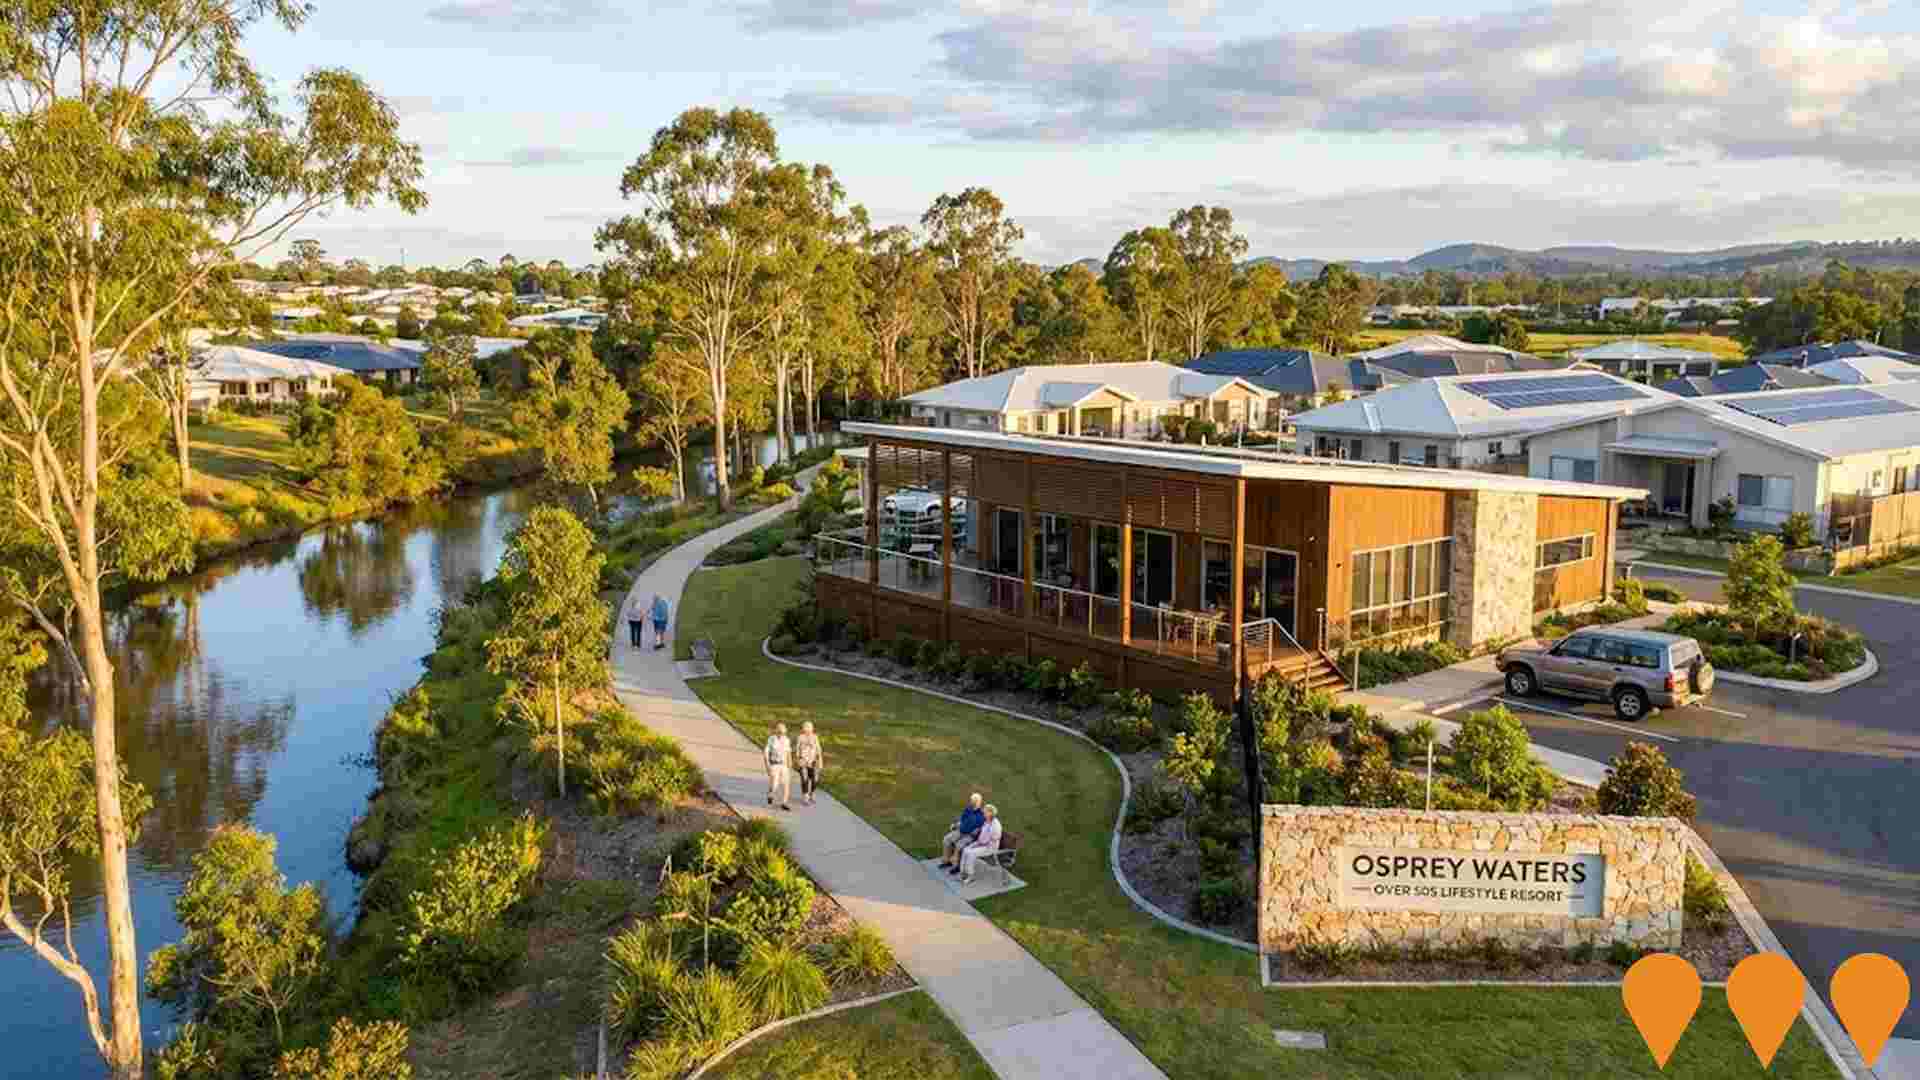
Infrastructure changes significantly influence an area's performance. AreaSearch has identified 23 projects likely impacting the region. Notable projects include Beenleigh Marketplace Enhancement, Holmview Shopping Centre Expansion, Beenleigh Community Hub, and Osprey Waters Retirement Village. The following list details those considered most relevant.
Professional plan users can use the search below to filter and access additional projects.
INFRASTRUCTURE SEARCH
 Denotes AI-based impression for illustrative purposes only, not to be taken as definitive under any circumstances. Please follow links and conduct other investigations from the project's source for actual imagery. Developers and project owners wishing us to use original imagery please Contact Us and we will do so.
Frequently Asked Questions - Infrastructure
Yarrabilba Town Centre
Mixed-use town centre for the Yarrabilba masterplanned community, delivering approximately 30,000 mý of retail and commercial floorspace, civic facilities, higher-density residential apartments and improved east-west road connections. Forms the central hub of the 2,222-hectare Yarrabilba Priority Development Area.

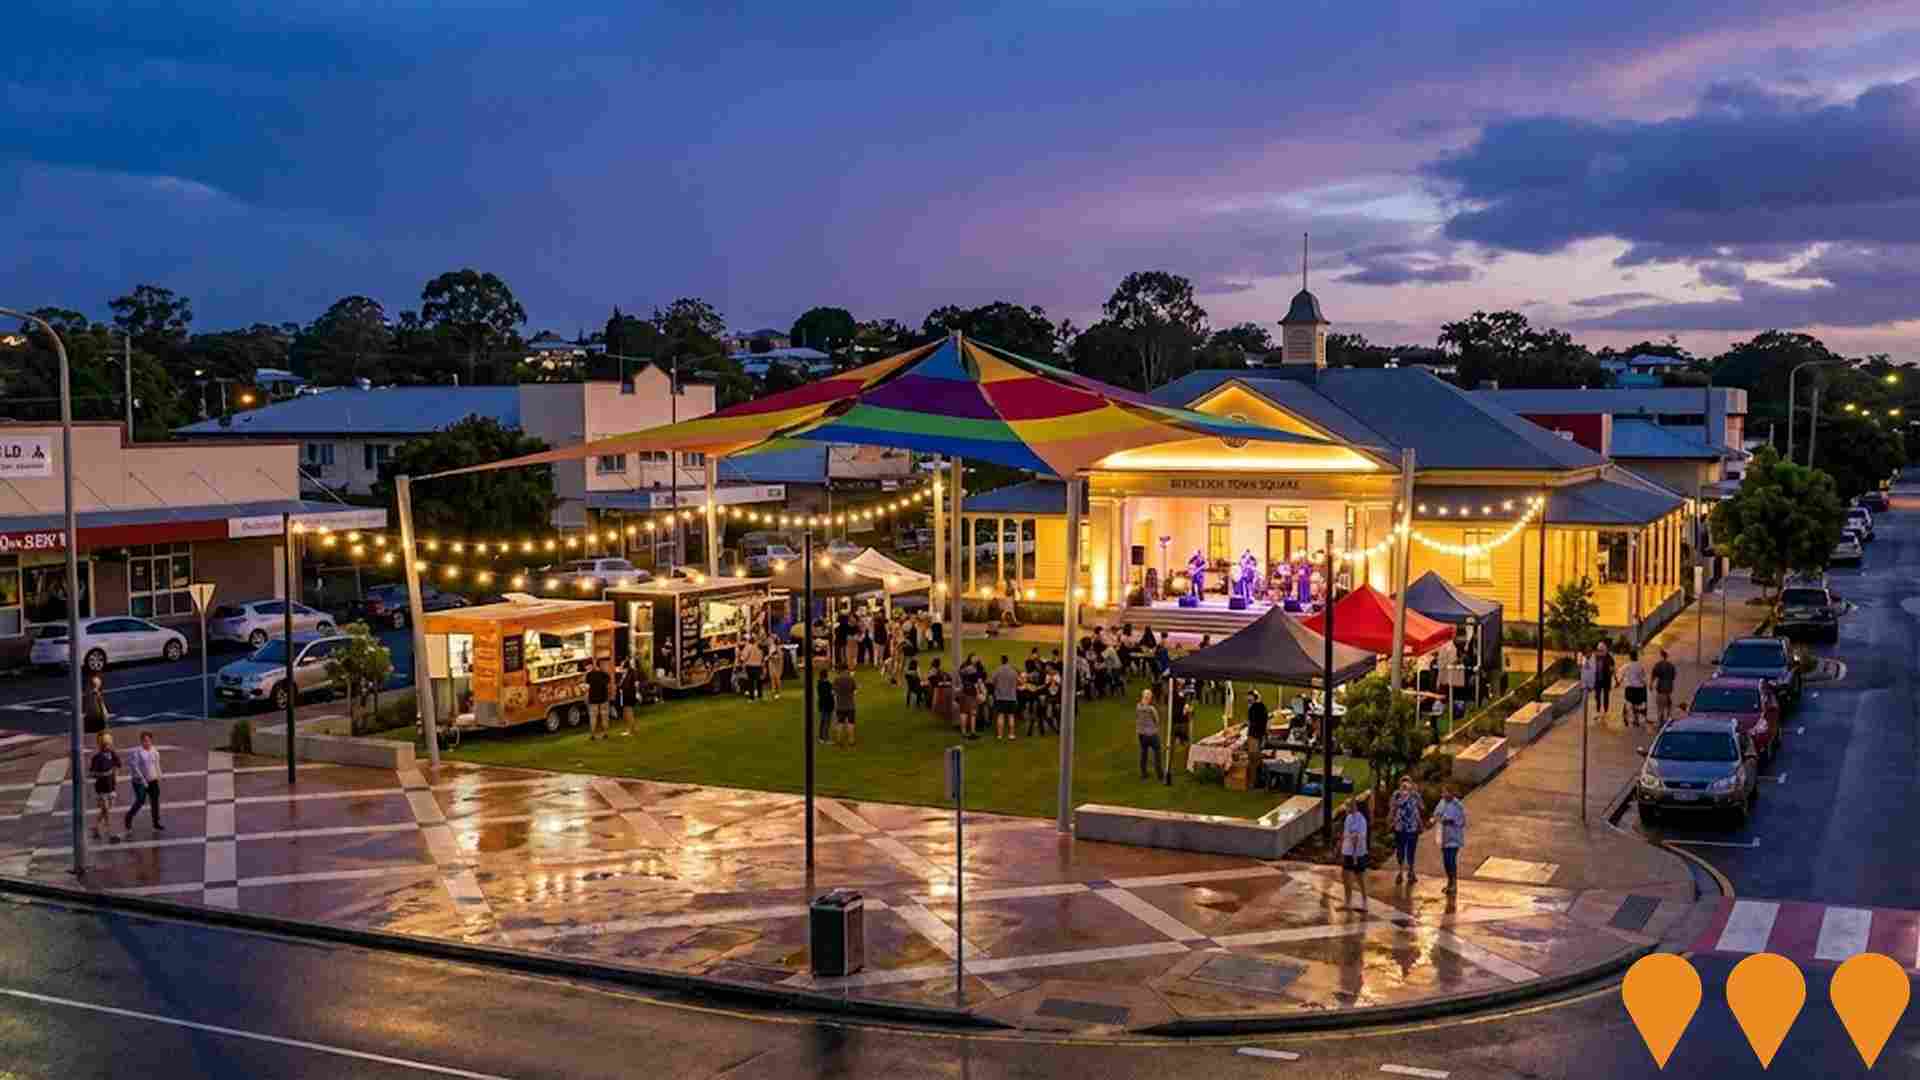
Beenleigh Town Square
Completed town centre urban renewal project in the heart of Beenleigh that has transformed a former six way roundabout into a flexible civic plaza and community gathering space. The square includes a civic platform, pavilion structure that could accommodate a future cafe, event lawns, dedicated market space, public amenities, power and water services, and improved pedestrian connections to the wider Beenleigh Town Centre. It now regularly hosts markets, festivals and concerts and acts as a catalyst for broader Beenleigh streetscape upgrades, with construction works completed in early 2022 under the leadership of Logan City Council. Sources: Logan City Council Beenleigh Town Square project information, venue hire pack and internal record and category mapping. :contentReference[oaicite:0]{index=0} :contentReference[oaicite:1]{index=1}:contentReference[oaicite:2]{index=2}
Distillery Road Market (DRM) Precinct Expansion
Completed expansion of the Distillery Road Market food, drink and entertainment precinct in Eagleby, anchored by the Zarraffas Coffee headquarters, The F.E.D. food and entertainment district, Perentie Brewing Co, covered market hall and outdoor entertainment spaces. The project delivers around 17,000 square metres of retail, hospitality and event space next to the Beenleigh Artisan Distillery, creating a regional destination between Brisbane and the Gold Coast with a regular program of markets, festivals and live music.

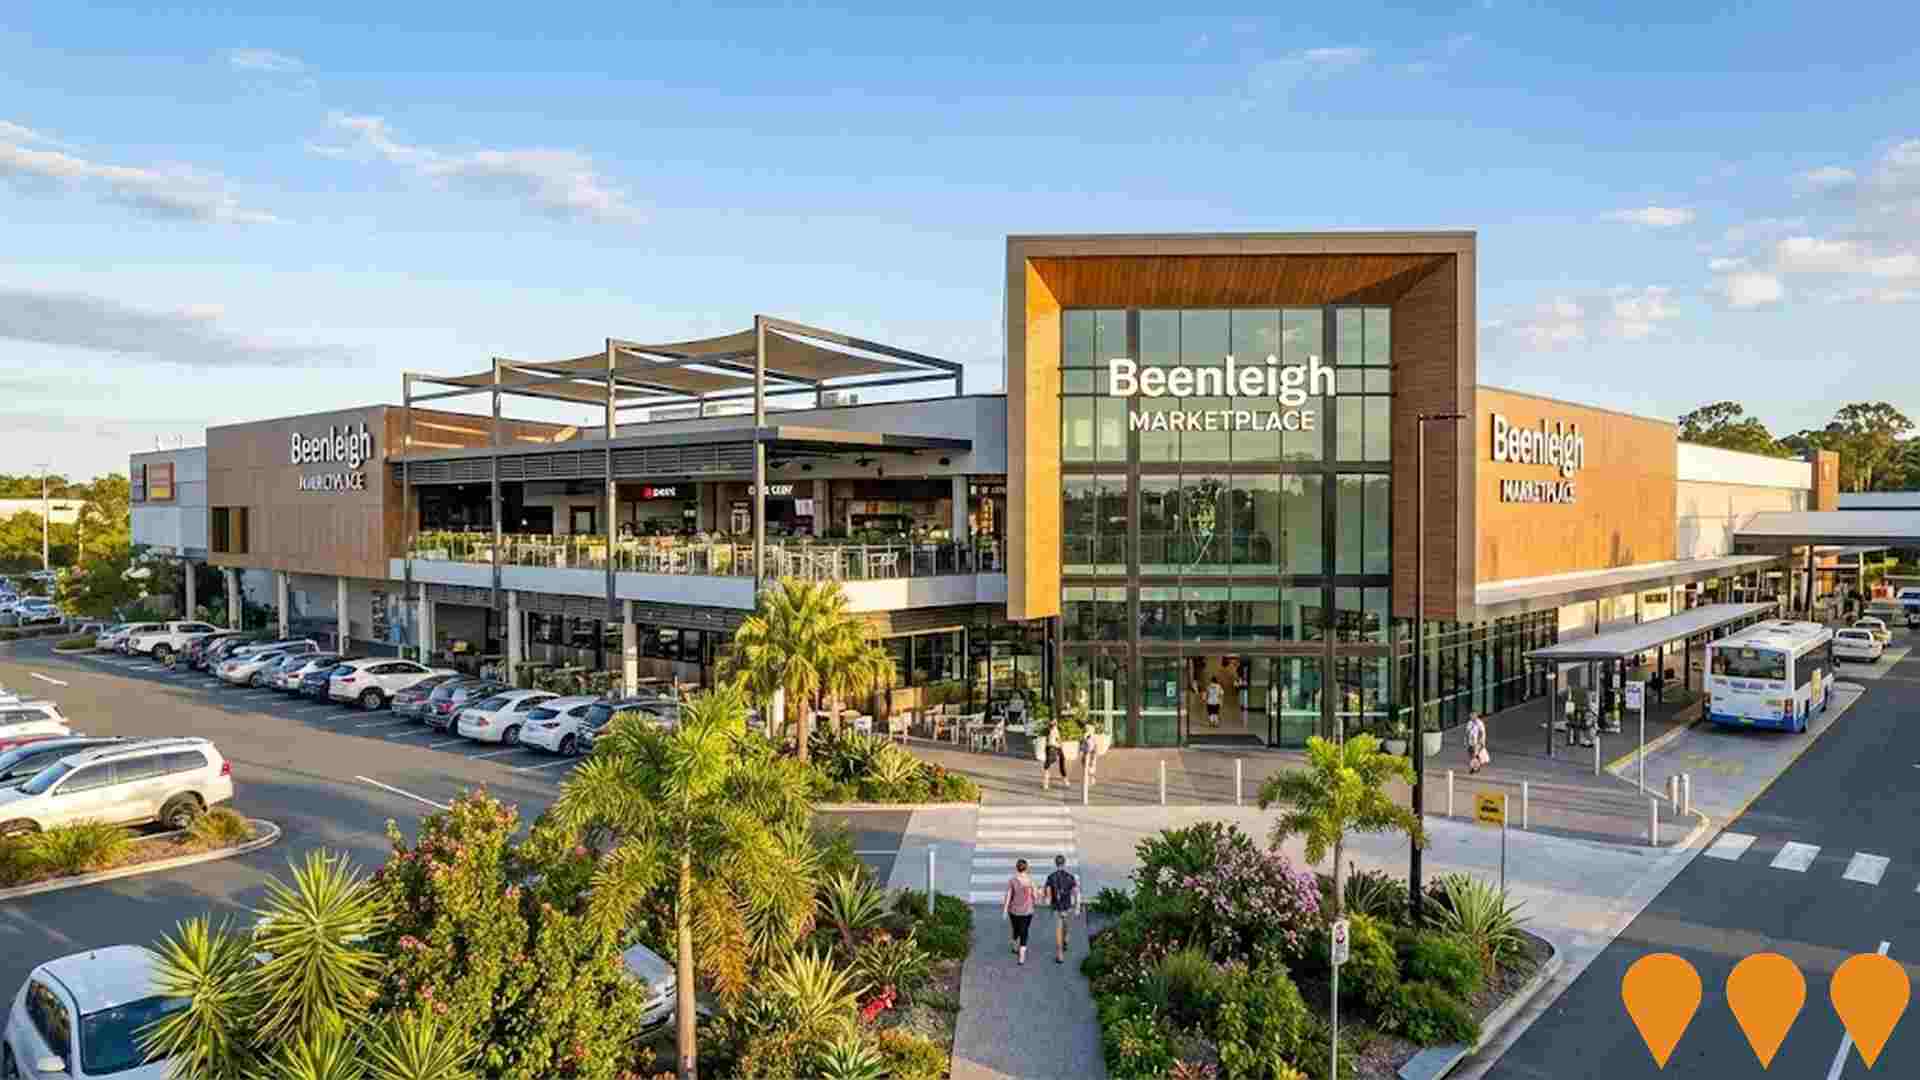
Beenleigh Marketplace Enhancement
Enhancement of established Beenleigh Marketplace with over 55 specialty stores. Improvements include expanded retail space, upgraded food court facilities, improved accessibility, and enhanced customer amenities to serve growing community needs.
The Heights Bahrs Scrub
A master-planned residential community by Villawood Properties delivering over 1,000 lots with parks, future school site, and direct access to the M1.

Holmview Shopping Centre Expansion
Expansion of existing shopping centre to meet growing community demand. Plans include additional retail outlets, improved parking facilities, and enhanced customer amenities for the Holmview community.
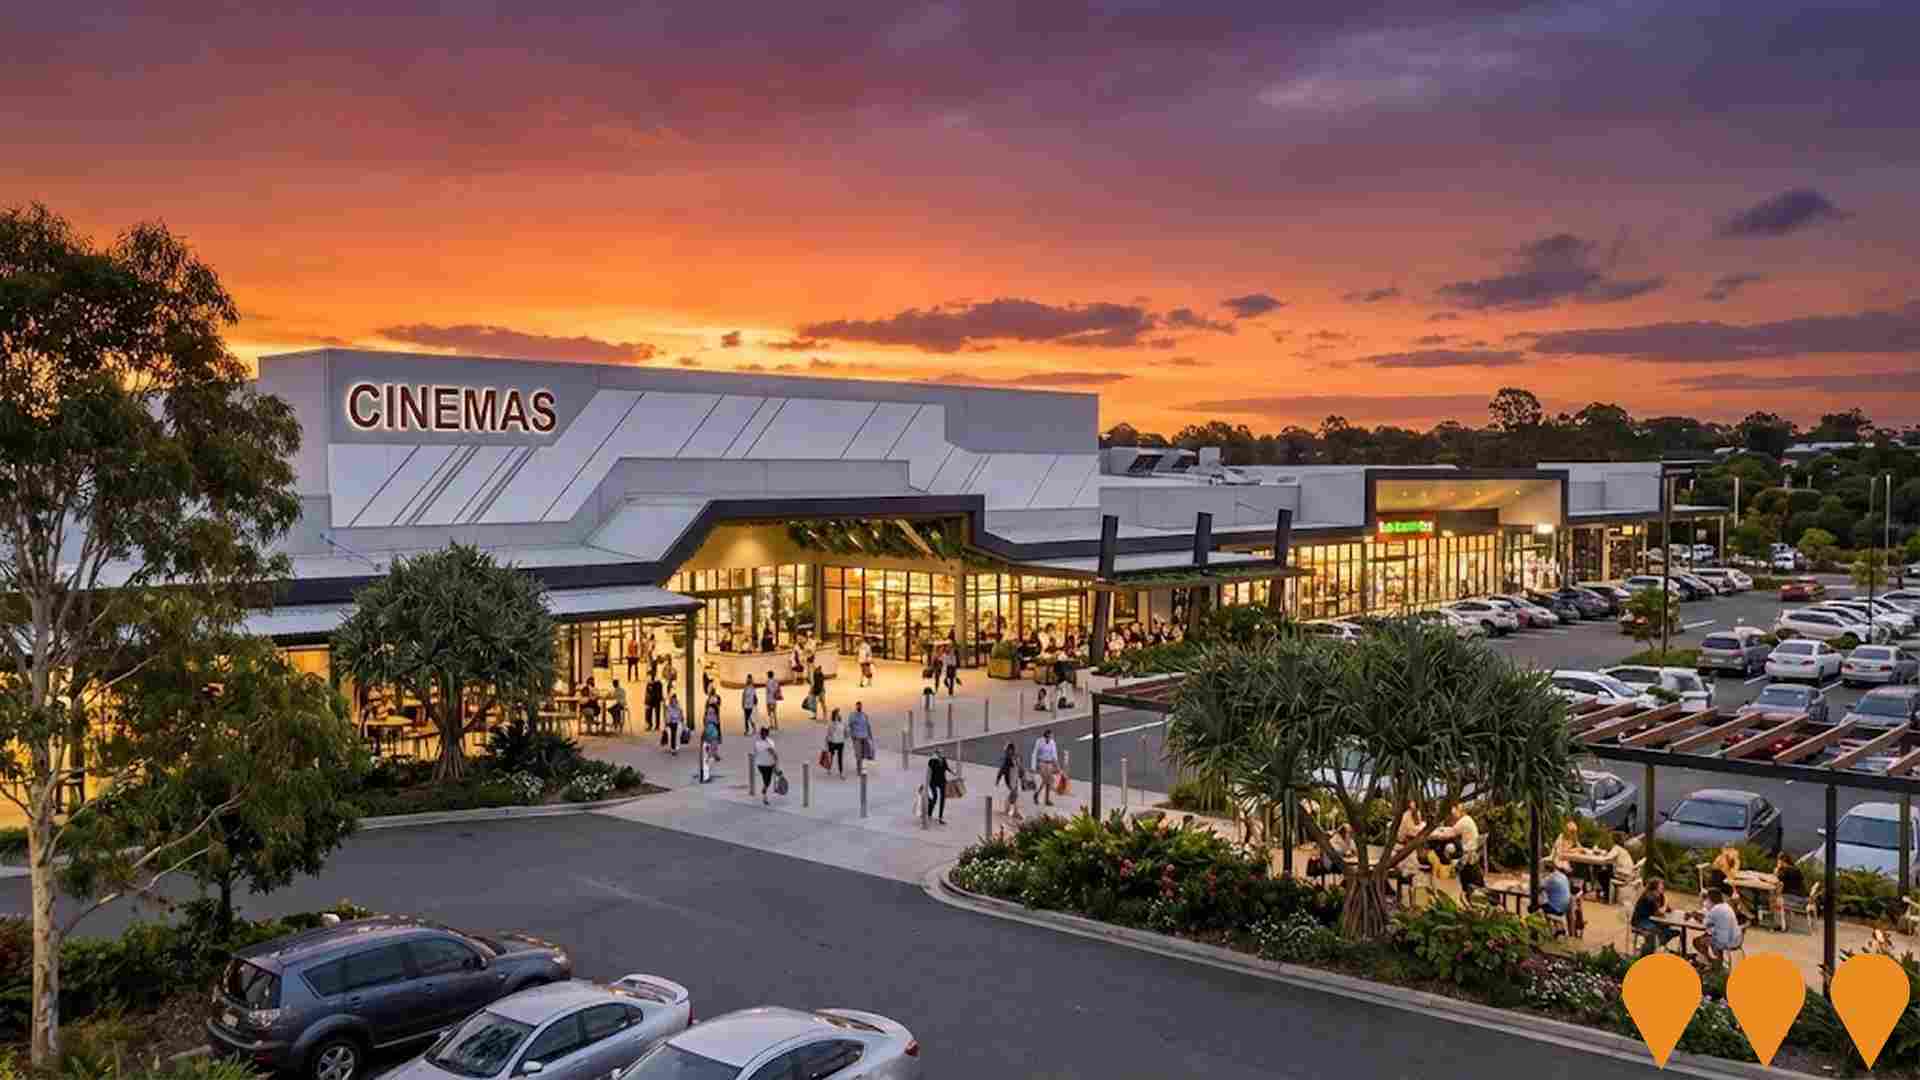
Beenleigh Central Shopping Complex
New shopping complex featuring tavern and 10 retail outlets with exceptional dual street access and high visibility location. Developed to serve growing Beenleigh retail demand with modern facilities and ample parking.

Bahrs Scrub Road & Wuraga Road Residential Estate
AVJennings' Woodlands community delivering 650 residential lots with parkland and future convenience retail precinct in central Bahrs Scrub.

Employment
Employment drivers in Beenleigh are experiencing difficulties, placing it among the bottom 20% of areas assessed across Australia
Beenleigh has a diverse workforce with both white and blue-collar jobs. The construction sector is prominent, with an unemployment rate of 7.3% and estimated employment growth of 4.5% over the past year.
As of September 2025, there are 4,254 employed residents, but the unemployment rate is higher than Greater Brisbane's by 3.3%, indicating room for improvement. Workforce participation in Beenleigh lags at 52.1%, compared to Greater Brisbane's 64.5%. Employment is concentrated in construction, health care & social assistance, and manufacturing. Construction employment share is high at 1.6 times the regional level.
In contrast, professional & technical services employ only 4.4% of local workers, lower than Greater Brisbane's 8.9%. The worker-to-resident ratio is 0.8, suggesting a higher-than-average level of local employment opportunities. From September 2024 to September 2025, Beenleigh's employment increased by 4.5%, while the labour force grew by 1.9%, leading to a 2.3 percentage point decrease in unemployment rate. In comparison, Greater Brisbane saw employment rise by 3.8% and unemployment fall by 0.5 percentage points. Statewide, Queensland's employment contracted by 0.01% between November 2024 and November 2025, with an unemployment rate of 4.2%, closely aligned with the national rate of 4.3%. Looking ahead, Jobs and Skills Australia forecasts national employment growth of 6.6% over five years and 13.7% over ten years. Applying these projections to Beenleigh's employment mix suggests local employment should increase by 5.9% over five years and 12.6% over ten years, based on a simple weighting extrapolation for illustrative purposes.
Frequently Asked Questions - Employment
Income
The area's income levels rank in the lower 15% nationally based on AreaSearch comparative data
AreaSearch's aggregation of ATO data for financial year 2022 shows Beenleigh SA2 had a median taxpayer income of $45,372 and an average income of $50,725. Both figures are below the national averages of $55,645 and $70,520 in Greater Brisbane respectively. Based on Wage Price Index growth from financial year 2022 to September 2025 (an increase of 13.99%), estimated median income is approximately $51,720 and average income is around $57,821. Census data indicates household, family, and personal incomes in Beenleigh fall between the 10th and 18th percentiles nationally. Income distribution shows 28.4% of individuals earn between $1,500 - $2,999 annually (2,540 individuals), which aligns with broader regional trends where 33.3% fall into the same category. Housing affordability pressures are severe, with only 78.2% of income remaining after housing costs, ranking at the 7th percentile nationally.
Frequently Asked Questions - Income
Housing
Beenleigh displays a diverse mix of dwelling types, with a higher proportion of rental properties than the broader region
Beenleigh's dwelling structure, as per the latest Census, consisted of 62.5% houses and 37.5% other dwellings (semi-detached, apartments, 'other' dwellings), compared to Brisbane metro's 78.9% houses and 21.1% other dwellings. Home ownership in Beenleigh stood at 18.0%, with mortgaged dwellings at 27.5% and rented ones at 54.6%. The median monthly mortgage repayment was $1,387, lower than Brisbane metro's average of $1,560. Median weekly rent in Beenleigh was $300, compared to Brisbane metro's $340. Nationally, Beenleigh's mortgage repayments were significantly lower at $1,387 versus Australia's average of $1,863, and rents were substantially below the national figure of $375.
Frequently Asked Questions - Housing
Household Composition
Beenleigh features high concentrations of lone person households and group households, with a lower-than-average median household size
Family households constitute 58.9% of all households, including 19.4% couples with children, 20.6% couples without children, and 17.3% single parent families. Non-family households account for the remaining 41.1%, with lone person households at 36.7% and group households comprising 4.3%. The median household size is 2.3 people, which is smaller than the Greater Brisbane average of 2.6.
Frequently Asked Questions - Households
Local Schools & Education
Educational outcomes in Beenleigh fall within the lower quartile nationally, indicating opportunities for improvement in qualification attainment
The area's university qualification rate is 11.7%, significantly lower than Greater Brisbane's average of 30.5%. Bachelor degrees are the most common at 8.3%, followed by postgraduate qualifications (2.1%) and graduate diplomas (1.3%). Vocational credentials are prevalent, with 43.9% of residents aged 15+ holding them, including advanced diplomas (10.2%) and certificates (33.7%). Educational participation is high, with 30.4% of residents currently enrolled in formal education, including primary (10.7%), secondary (8.9%), and tertiary (3.4%) levels.
Educational participation is notably high, with 30.4% of residents currently enrolled in formal education. This includes 10.7% in primary education, 8.9% in secondary education, and 3.4% pursuing tertiary education.
Frequently Asked Questions - Education
Schools Detail
Nearby Services & Amenities
Transport
Transport servicing is high compared to other areas nationally based on assessment of service frequency, route connectivity and accessibility
Beenleigh has 50 active public transport stops. These include both train and bus services, totaling 48 routes. Each week, these routes facilitate 3,854 passenger trips.
The average distance from residents to the nearest stop is 239 meters. Daily service frequency averages 550 trips across all routes, which equates to approximately 77 weekly trips per individual stop.
Frequently Asked Questions - Transport
Transport Stops Detail
Health
Health performance in Beenleigh is a key challenge with a range of health conditions having marked impacts on both younger and older age cohorts
Beenleigh faces significant health challenges, with various conditions affecting both younger and older residents. Approximately 46% (~4,133 people) have private health cover, lower than Greater Brisbane's 49.1% and the national average of 55.3%. Mental health issues and asthma are the most prevalent conditions, impacting 12.5 and 10.2% of residents respectively.
However, 58.8% report being free from medical ailments, compared to 63.1% in Greater Brisbane. The area has a higher proportion of seniors (17.1%, 1,530 people) than Greater Brisbane (16.1%). Senior health outcomes align with the general population's health profile.
Frequently Asked Questions - Health
Cultural Diversity
The level of cultural diversity witnessed in Beenleigh was found to be slightly above average when compared nationally for a number of language and cultural background related metrics
Beenleigh's population showed above-average cultural diversity, with 11.1% speaking a language other than English at home and 25.1% born overseas. Christianity was the predominant religion, comprising 45.6%. The 'Other' religious category had a slightly higher representation in Beenleigh (1.3%) compared to Greater Brisbane (1.4%).
In terms of ancestry, the top three groups were English (29.8%), Australian (25.7%), and Other (8.0%). Notably, Maori (2.9% vs 3.0%), New Zealand (1.5% vs 1.7%), and Samoan (1.1%) showed minor variations in representation compared to regional averages.
Frequently Asked Questions - Diversity
Age
Beenleigh's population is slightly younger than the national pattern
Beenleigh's median age is 38, slightly higher than Greater Brisbane's 36 but equal to Australia's 38 years. The 55-64 age group makes up 12.8% of Beenleigh's population compared to Greater Brisbane, while the 35-44 cohort is less prevalent at 12.2%. Between 2021 and present, the 75-84 age group has grown from 4.5% to 6.0% of the population. Conversely, the 15-24 cohort has decreased from 13.5% to 12.5%. By 2041, demographic projections show significant shifts in Beenleigh's age structure. The 75-84 group is expected to grow by 66%, reaching 896 people from the current 538. Those aged 65 and above are projected to comprise 54% of population growth. Meanwhile, the 35-44 and 0-4 age cohorts are expected to experience population declines.
