Chart Color Schemes
This analysis uses ABS Statistical Areas Level 2 (SA2) boundaries, which can materially differ from Suburbs and Localities (SAL) even when sharing similar names.
SA2 boundaries are defined by the Australian Bureau of Statistics and are designed to represent communities for statistical reporting (e.g., census and ERP).
Suburbs and Localities (SAL) represent commonly-used suburb/locality names (postal-style areas) and may use different geographic boundaries. For comprehensive analysis, consider reviewing both boundary types if available.
est. as @ -- *
ABS ERP | -- people | --
2021 Census | -- people
Sales Activity
Curious about local property values? Filter the chart to assess the volume and appreciation (including resales) trends and regional comparisons, or scroll to the map below view this information at an individual property level.
Find a Recent Sale
Sales Detail
Population
An assessment of population growth drivers in Thorneside reveals an overall ranking slightly below national averages considering recent, and medium term trends
Thorneside's population, as per AreaSearch's analysis, was approximately 4030 by November 2025. This figure represents a growth of 153 individuals (3.9%) since the 2021 Census, which recorded a population of 3877. The increase is inferred from the estimated resident population of 4028 in June 2024 and an additional five validated new addresses post-Census. This results in a population density of 1509 persons per square kilometer, exceeding national averages assessed by AreaSearch. Over the past decade (2011-2021), Thorneside exhibited consistent growth with a compound annual growth rate of 0.5%, outperforming its SA3 region. Natural growth contributed approximately 52.7% to overall population gains during recent periods.
AreaSearch uses ABS/Geoscience Australia projections for each SA2 area, released in 2024 using 2022 as the base year. For areas not covered by this data and years beyond 2032, Queensland State Government's SA2 area projections from 2023 (based on 2021 data) are adopted, with proportional growth weightings applied in line with ABS Greater Capital Region projections for each age cohort. Future population trends suggest lower quartile growth across statistical areas nationally; Thorneside is projected to expand by 89 persons to 2041 based on the latest annual ERP population numbers, reflecting a total increase of 2.2% over the 17-year period.
Frequently Asked Questions - Population
Development
Residential development activity is lower than average in Thorneside according to AreaSearch's national comparison of local real estate markets
Thorneside has averaged approximately 11 new dwelling approvals per year. Over the past five financial years, from FY21 to FY25, 57 homes were approved, with a further 5 approved in FY26 as of current data.
Each dwelling built has resulted in an average of 2 new residents per year over these five financial years, indicating strong demand which supports property values. The average construction cost value of new homes is $330,000. Compared to Greater Brisbane, Thorneside has 14.0% less new development per person and ranks at the 27th percentile nationally for areas assessed, suggesting limited buyer options and increased demand for established dwellings. This is below the national average, indicating the area's established nature and potential planning limitations.
All new construction since FY21 has been detached houses, maintaining Thorneside's traditional suburban character focused on family homes. However, developers are building more traditional houses than the current mix suggests (64.0% at Census), indicating continued strong demand for family homes despite density pressures. With around 585 people per dwelling approval, Thorneside reflects a highly mature market. Population forecasts indicate Thorneside will gain approximately 87 residents by 2041 (from the latest AreaSearch quarterly estimate). Based on current development patterns, new housing supply should readily meet demand, offering good conditions for buyers and potentially facilitating population growth beyond current projections.
Frequently Asked Questions - Development
Infrastructure
Thorneside has moderate levels of nearby infrastructure activity, ranking in the 46thth percentile nationally
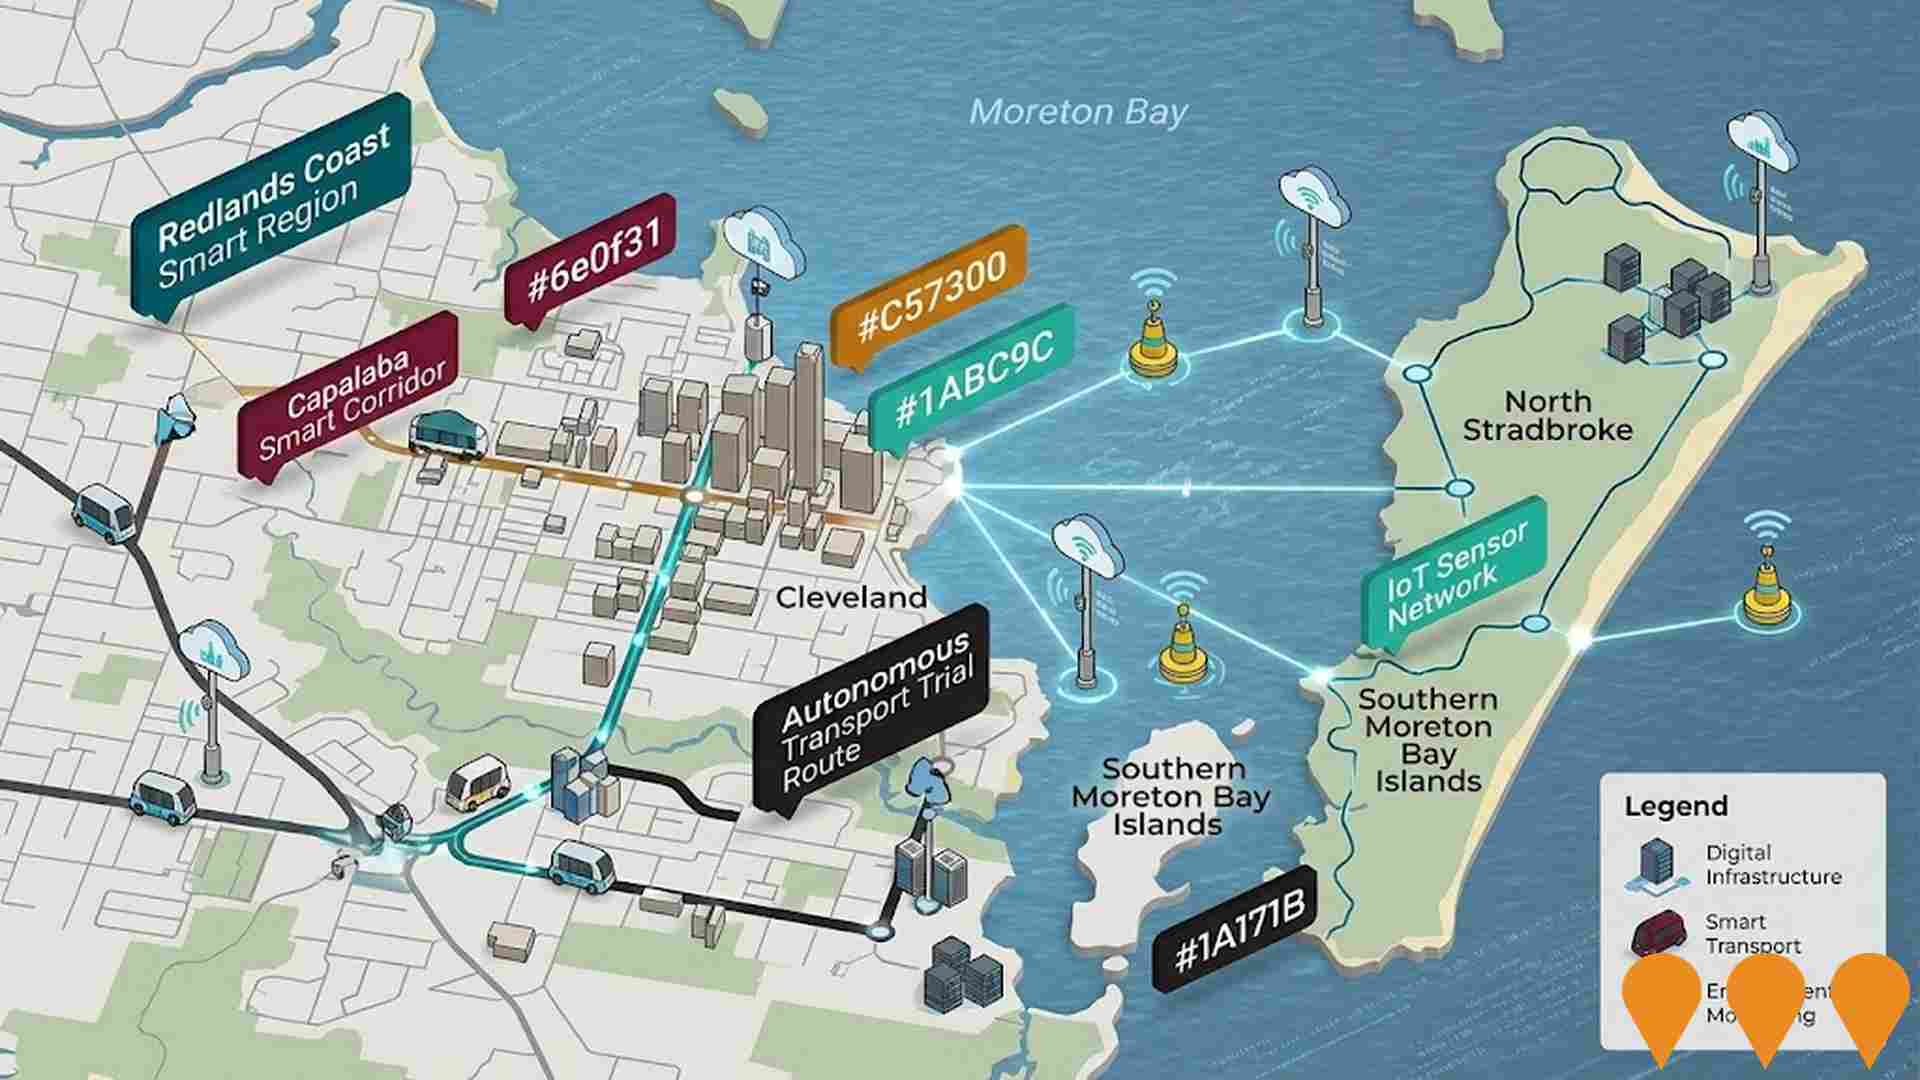
Changes to local infrastructure significantly influence an area's performance. AreaSearch has identified one major project likely impacting the region: Eastwood Birkdale. Other key projects include Redland Hospital Expansion, Redlands Coast Smart and Connected City Strategy, and Cleveland Line Duplication (Park Road to Cleveland).
Professional plan users can use the search below to filter and access additional projects.
INFRASTRUCTURE SEARCH
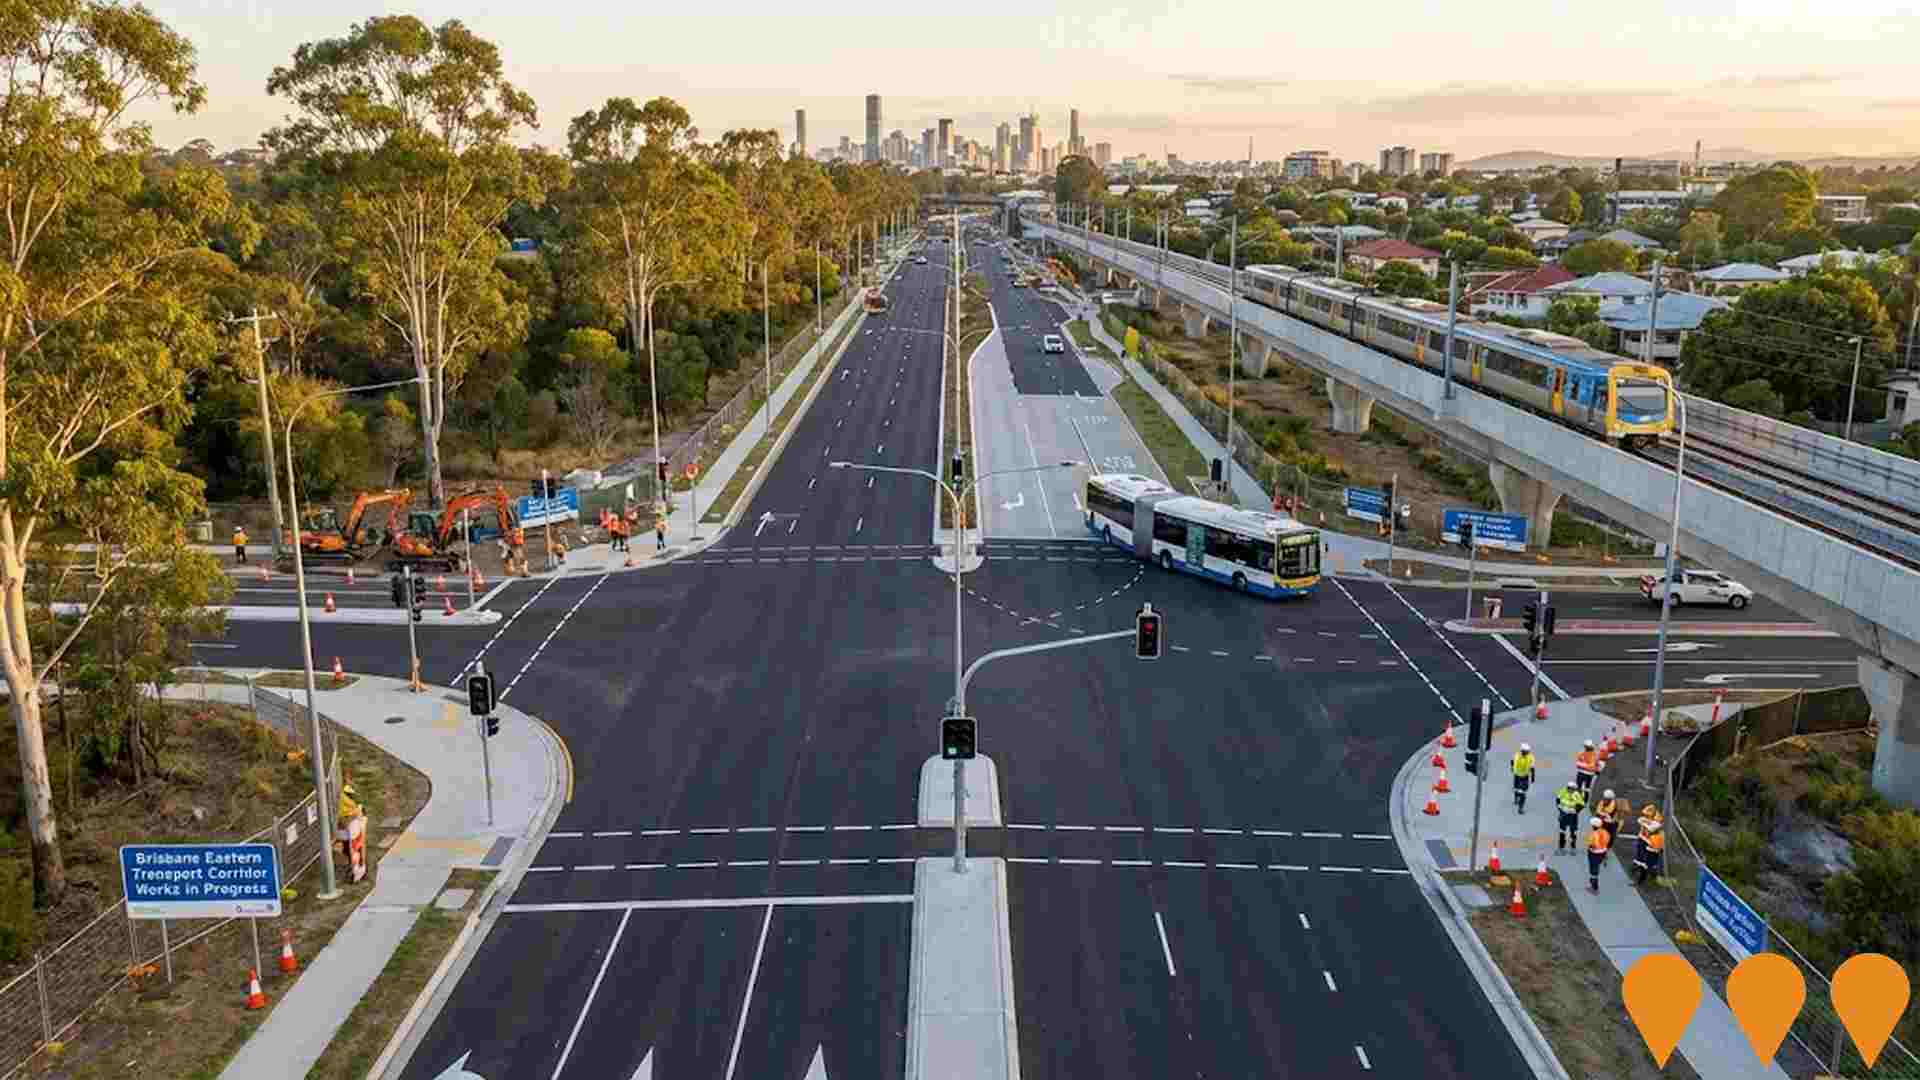
 Denotes AI-based impression for illustrative purposes only, not to be taken as definitive under any circumstances. Please follow links and conduct other investigations from the project's source for actual imagery. Developers and project owners wishing us to use original imagery please Contact Us and we will do so.
Frequently Asked Questions - Infrastructure
Brisbane 2032 Olympic and Paralympic Games Infrastructure Program
The $7.1 billion infrastructure program for the Brisbane 2032 Olympic and Paralympic Games includes a new ~60,000-seat main stadium at Victoria Park (hosting opening/closing ceremonies and athletics), a new Brisbane Arena (Roma Street or alternate location), venue upgrades to QSAC and Suncorp Stadium, new and upgraded aquatic centres, athletes' villages, and supporting transport improvements across South East Queensland. The program emphasises existing venues where possible with targeted new builds for legacy benefit.

Queensland Energy and Jobs Plan
The Queensland Energy and Jobs Plan, initially a comprehensive plan for renewable energy and job creation, has been superseded by the Queensland Energy Roadmap 2025 by the new government (October 2025). The Roadmap focuses on energy affordability, reliability, and sustainability by leveraging existing coal and gas assets, increasing private sector investment in renewables and storage (targeting 6.8 GW of wind/solar and 3.8 GW of storage by 2030), and developing a new Regional Energy Hubs framework to replace Renewable Energy Zones. The initial $62 billion investment pipeline is now primarily focused on implementing the new Roadmap's priorities, including an estimated $26 billion in reduced energy system costs compared to the previous plan. The foundational legislation is the Energy Roadmap Amendment Bill 2025, which is currently before Parliament and expected to pass by December 2025, formally repealing the previous renewable energy targets. Key infrastructure projects like CopperString's Eastern Link are still progressing. The overall project is in the planning and legislative amendment phase under the new policy.
Brisbane 2032 Games Venue Infrastructure Program
The $7.1 billion Games Venue Infrastructure Program involves the planning and delivery of 17 new and upgraded venues across Queensland, including the new 63,000-seat Brisbane Stadium at Victoria Park and the National Aquatic Centre. Led by the Games Independent Infrastructure and Coordination Authority (GIICA), the program aims to deliver long-term sporting and community legacy benefits for Brisbane and regional Queensland.
Redland Hospital Expansion
Multi-stage expansion of Redland Hospital in Cleveland to meet growing healthcare demand in Redlands Coast. Completed stages include multi-level car park (1,000+ spaces, 2023), Lagoon Ward (28 beds, 2023), upgraded birthing suite and ED (2020), and Stage 1 clinical services building with new ICU and 37 additional inpatient beds (opened early 2025). Current Stage 2 ($150M) is a new mental health and sub-acute/allied health building delivering 43 beds (20 net new) plus expanded outpatient services - under construction with completion expected mid-2027.
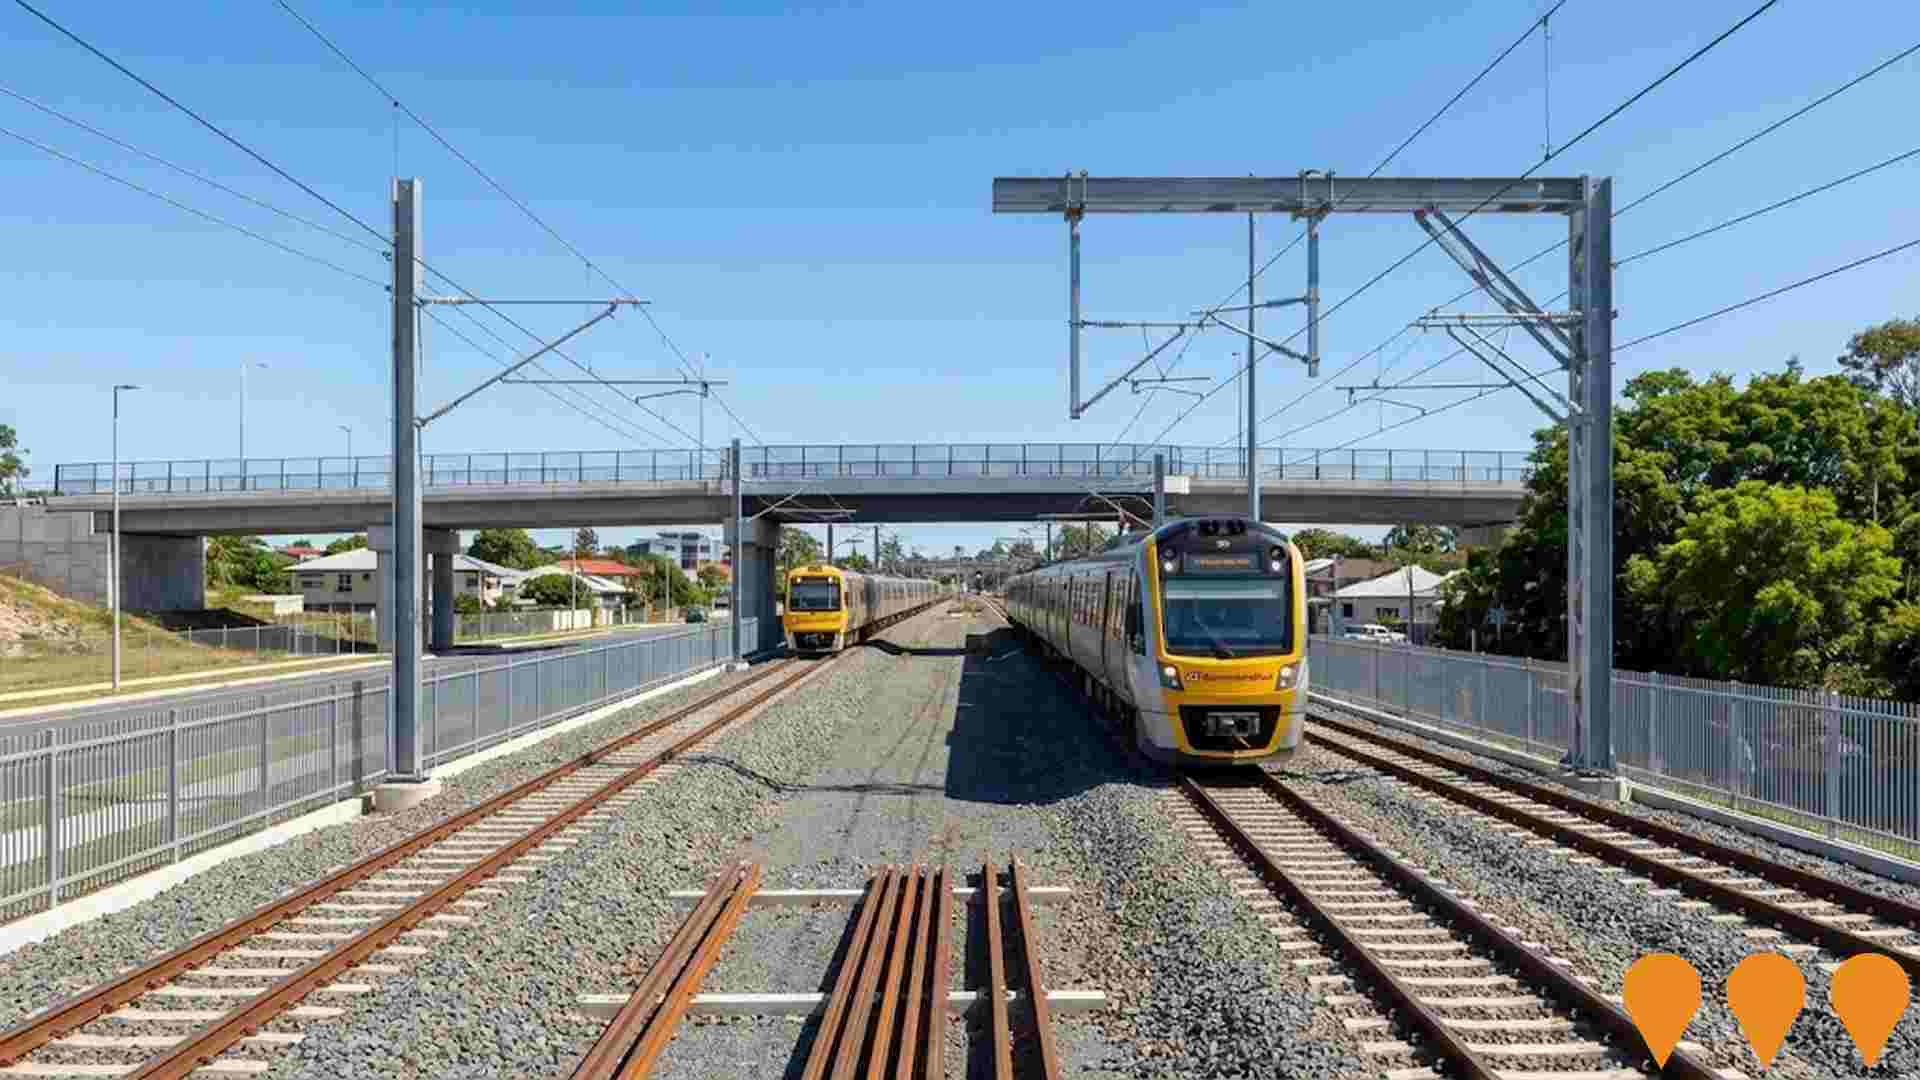
Cleveland Line Duplication (Park Road to Cleveland)
Major upgrade and partial duplication of the Cleveland Line between Park Road and Cleveland stations to increase capacity, improve reliability and enable higher frequency services in preparation for Cross River Rail and the Brisbane 2032 Olympic and Paralympic Games. Works include track duplication (particularly between Lindum and Cleveland), station upgrades, level crossing removals and signalling improvements.
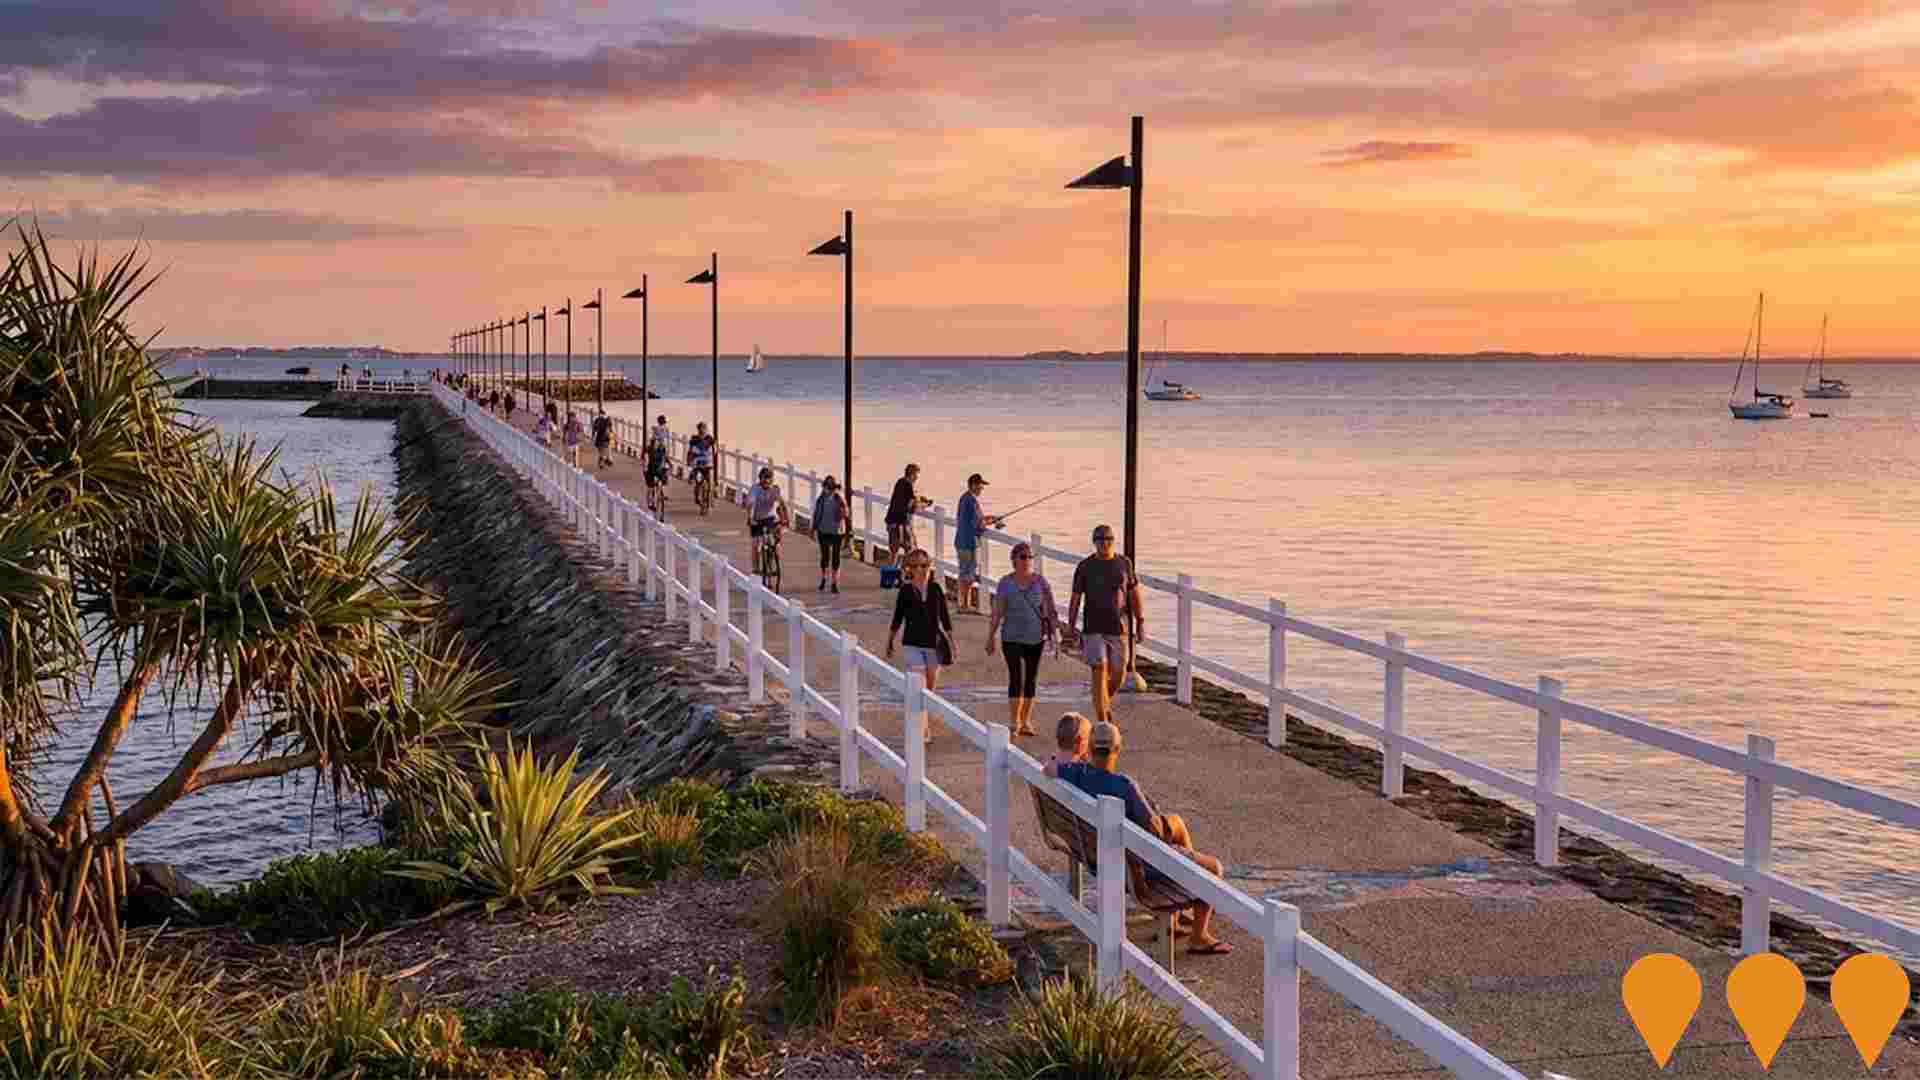
Wynnum, Manly and Lota Foreshores Master Plan
Brisbane City Council's 20-year master plan to renew and rejuvenate the Wynnum, Manly and Lota foreshores. The plan protects heritage and natural values, improves connectivity, expands recreation opportunities, and enhances community spaces while balancing development with environmental conservation. Initial community engagement has closed; a draft master plan is being prepared with further feedback invited in 2025-2026, targeting finalisation mid to late 2026.
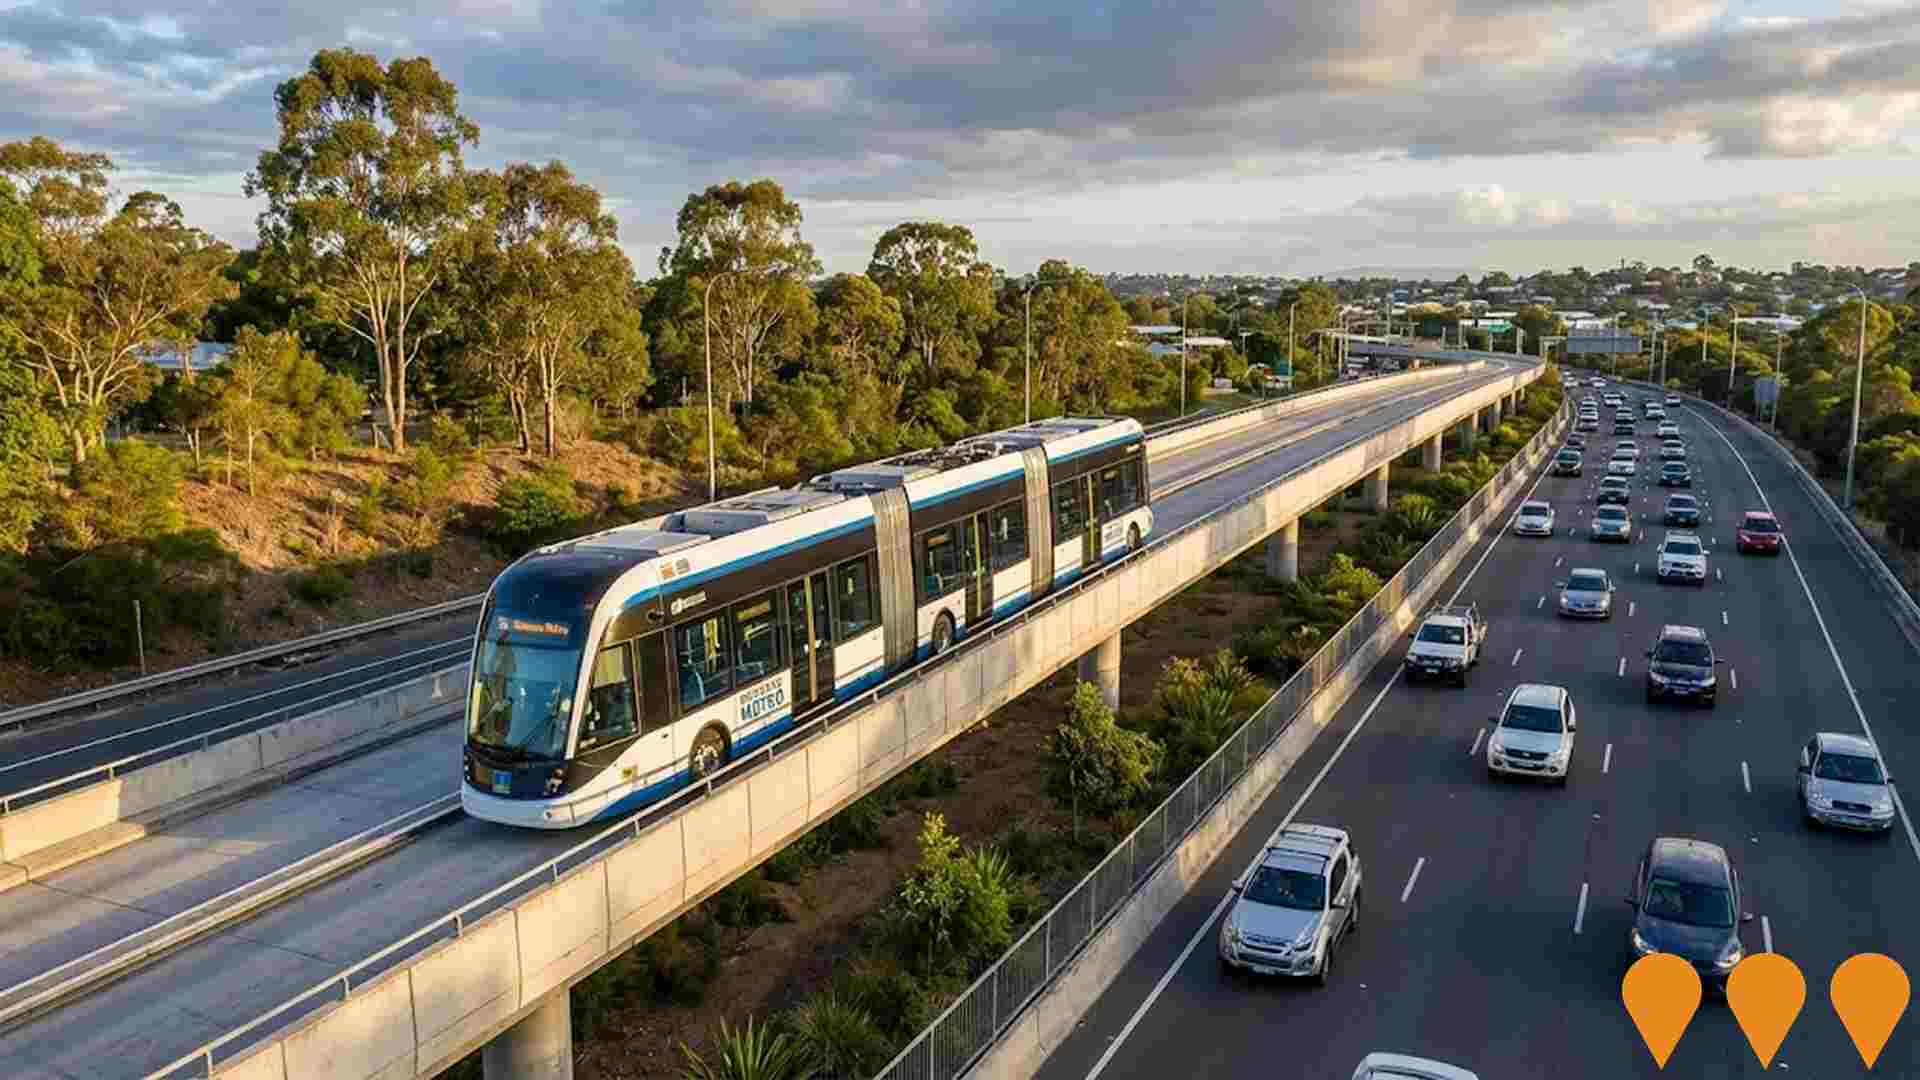
Eastern Metro Study - Coorparoo to Capalaba
Strategic study examining options for a high-capacity, high-frequency public transport corridor along Old Cleveland Road from Coorparoo to Capalaba. The study is assessing extensions of Brisbane Metro-style services or dedicated busway priority to better connect eastern Brisbane suburbs, Redlands, and major activity centres, with the aim of reducing car dependency and improving travel times. Jointly led by Queensland Department of Transport and Main Roads (TMR), Brisbane City Council and Redland City Council. A detailed business case for an eastward Brisbane Metro extension is in preparation.
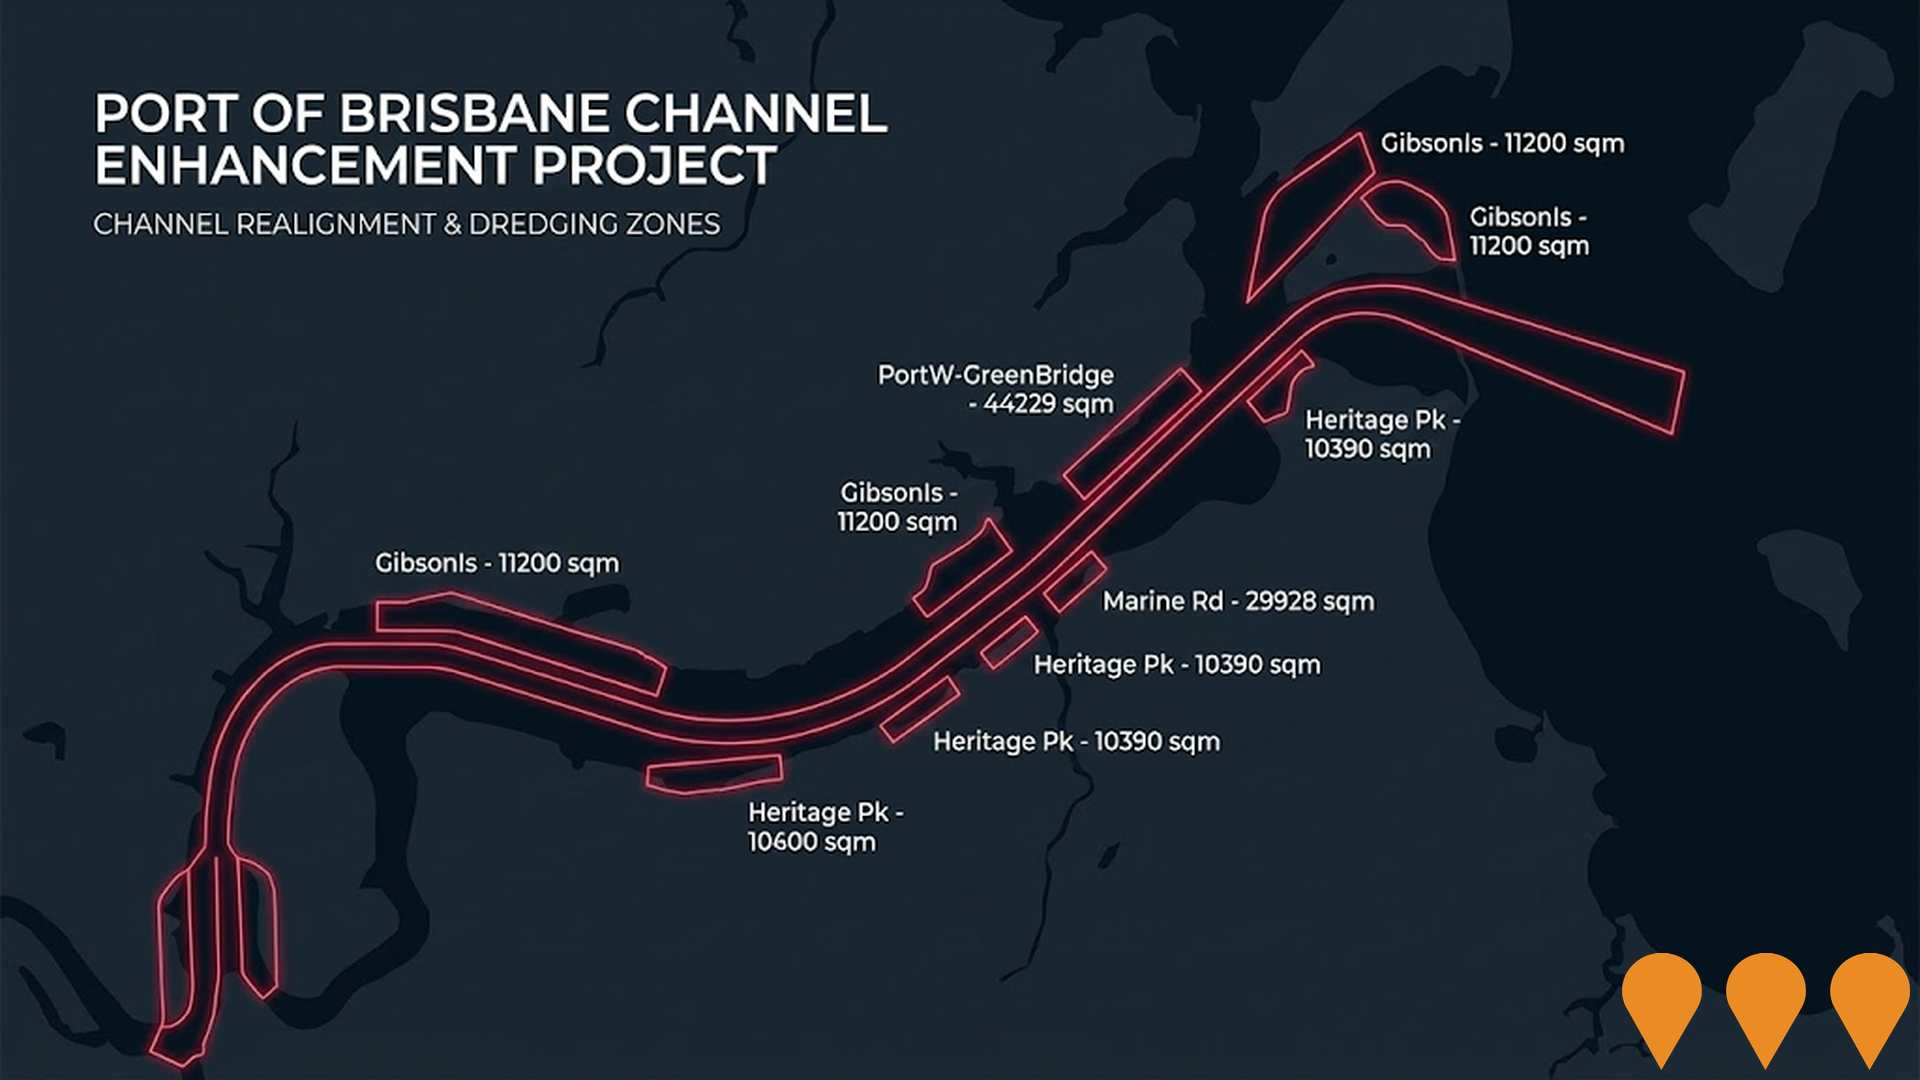
Port of Brisbane Channel Enhancement Project
The 25-year Port of Brisbane Channel Enhancement Project is a long-term program to widen, deepen and realign sections of the existing shipping channel by dredging approximately 96.5 million cubic metres of material. The project will improve safety and efficiency, enable access for larger container vessels, reduce vessel emissions, enhance resilience of Australia's east coast container network, and support beneficial reuse and disposal of dredged material. It is a declared coordinated project with an active EIS process (draft Terms of Reference exhibited Apr-May 2025). Subject to approvals and final investment decision, construction is expected to commence from 2028.
Employment
Employment conditions in Thorneside demonstrate strong performance, ranking among the top 35% of areas assessed nationally
Thorneside has a skilled workforce with notable representation in essential services sectors. Its unemployment rate was 3.3% as of September 2025.
Employment growth over the past year was estimated at 5.9%. As of that date, 2,309 residents were employed, with an unemployment rate of 0.6% lower than Greater Brisbane's rate of 4.0%. Workforce participation in Thorneside is on par with Greater Brisbane's 64.5%. Leading employment industries among residents include health care & social assistance, construction, and education & training.
Construction employment levels are particularly high at 1.4 times the regional average. Conversely, accommodation & food services employ only 4.6% of local workers, below Greater Brisbane's 6.7%. The area appears to offer limited local employment opportunities based on Census data comparisons between working population and resident population. Between September 2024 and September 2025, employment levels increased by 5.9% while labour force increased by 6.0%, leaving unemployment broadly flat. In comparison, Greater Brisbane recorded employment growth of 3.8% with a 0.5 percentage point decrease in unemployment during the same period. State-level data from 25-Nov-25 shows Queensland employment contracted by 0.01% (losing 1,210 jobs), with an unemployment rate of 4.2%, closely aligned with the national rate of 4.3%. National employment forecasts from Jobs and Skills Australia project a 6.6% increase over five years and 13.7% over ten years. Applying these projections to Thorneside's employment mix suggests local employment should increase by 6.5% over five years and 13.4% over ten years, although this is a simplified extrapolation for illustrative purposes.
Frequently Asked Questions - Employment
Income
Income levels align closely with national averages, indicating typical economic conditions for Australian communities according to AreaSearch analysis
ThorneSide SA2 had a median taxpayer income of $55,492 and an average of $66,152 in the financial year 2022, according to postcode level ATO data aggregated by AreaSearch. This was slightly above the national average for that year. In Greater Brisbane during the same period, median income was $55,645 with an average income of $70,520. By September 2025, estimates suggest median income would be approximately $63,255 and average income around $75,407, factoring in a 13.99% growth since financial year 2022. According to the 2021 Census, personal income ranked at the 54th percentile ($827 weekly), while household income was at the 35th percentile. The $1,500 - 2,999 income bracket dominated with 30.1% of residents (1,213 people), similar to regional levels where 33.3% fell into this bracket. Housing affordability pressures were severe, with only 82.6% of income remaining after housing costs, ranking at the 34th percentile. The area's SEIFA income ranking placed it in the 5th decile.
Frequently Asked Questions - Income
Housing
Thorneside displays a diverse mix of dwelling types, with above-average rates of outright home ownership
Thorneside's dwelling structure, as per the latest Census, comprised 63.6% houses and 36.4% other dwellings. In comparison, Brisbane metro had 85.0% houses and 15.1% other dwellings. Home ownership in Thorneside was 34.0%, similar to Brisbane metro's level. Dwellings were either mortgaged (36.8%) or rented (29.1%). The median monthly mortgage repayment was $1,787, below the Brisbane metro average of $1,950 and the Australian average of $1,863. The median weekly rent in Thorneside was $370, compared to Brisbane metro's $405 and the national figure of $375.
Frequently Asked Questions - Housing
Household Composition
Thorneside has a typical household mix, with a lower-than-average median household size
Family households make up 67.0% of all households, including 24.8% couples with children, 26.4% couples without children, and 15.2% single parent families. Non-family households account for the remaining 33.0%, with lone person households at 29.6% and group households comprising 3.2%. The median household size is 2.3 people, which is smaller than the Greater Brisbane average of 2.7.
Frequently Asked Questions - Households
Local Schools & Education
The educational profile of Thorneside exceeds national averages, with above-average qualification levels and academic performance metrics
Thorneside Trail's residents aged 15 and above have 22.4% university degree holders, compared to Greater Brisbane's 30.5%. Bachelor degrees are the most common at 16.0%, followed by postgraduate qualifications (3.6%) and graduate diplomas (2.8%). Vocational credentials are held by 41.0% of residents aged 15 and above, with advanced diplomas at 11.9% and certificates at 29.1%. Current educational participation is high, with 26.3% enrolled in formal education: primary (10.0%), secondary (7.7%), and tertiary (3.3%).
Educational participation is notably high, with 26.3% of residents currently enrolled in formal education. This includes 10.0% in primary education, 7.7% in secondary education, and 3.3% pursuing tertiary education.
Frequently Asked Questions - Education
Schools Detail
Nearby Services & Amenities
Transport
Transport servicing is good compared to other areas nationally based on assessment of service frequency, route connectivity and accessibility
Thorneside has 26 active public transport stops. These are a mix of train and bus stations. They are served by 23 different routes.
Together, these provide 1,691 weekly passenger trips. The average distance from residents to the nearest stop is 184 meters. On average, there are 241 trips per day across all routes. This equates to about 65 weekly trips per individual stop.
Frequently Asked Questions - Transport
Transport Stops Detail
Health
Health performance in Thorneside is lower than average with common health conditions somewhat prevalent across both younger and older age cohorts
Thorneside faces significant health challenges with common health conditions prevalent across both younger and older age cohorts. The rate of private health cover is approximately 52% of the total population (~2,111 people), compared to 55.1% across Greater Brisbane.
Mental health issues impact 10.2% of residents, while arthritis affects 8.8%. Sixty-four point two percent declare themselves completely clear of medical ailments, compared to 66.8% in Greater Brisbane. Twenty-two point four percent of residents are aged 65 and over (902 people), higher than the 20.0% in Greater Brisbane. Health outcomes among seniors are above average, performing better than the general population in health metrics.
Frequently Asked Questions - Health
Cultural Diversity
Thorneside ranks below the Australian average when compared to other local markets across a number of language and cultural background related metrics
Thorneside, as per the census on 28 June 2016, had a population with 78.5% born in Australia. Citizenship stood at 89.8%, and English was spoken exclusively at home by 93.3%. Christianity was the predominant religion, practised by 48.1% of residents, compared to 53.3% across Greater Brisbane.
The top three ancestry groups were English (30.1%), Australian (27.9%), and Irish (9.1%). Notably, New Zealand-born residents made up 1.2%, Russians 0.6%, and Germans 5.0%, each exceeding their respective regional percentages of 1.2%, 0.3%, and 4.3%.
Frequently Asked Questions - Diversity
Age
Thorneside's population is slightly older than the national pattern
Thorneside has a median age of 41, which is higher than Greater Brisbane's figure of 36 and Australia's figure of 38. The 65-74 age cohort is notably over-represented in Thorneside at 12.3%, compared to the Greater Brisbane average, while the 25-34 age group is under-represented at 9.9%. Between 2021 and present, the 75-84 age group has grown from 5.2% to 7.8% of the population, and the 15-24 cohort increased from 9.2% to 10.8%. Conversely, the 25-34 cohort declined from 12.4% to 9.9%, and the 55-64 group dropped from 13.3% to 11.7%. By 2041, demographic modeling suggests Thorneside's age profile will change significantly. The 85+ age cohort is projected to increase dramatically, adding 199 people (a 212% rise) from 94 to 294. Notably, the combined 65+ age groups are expected to account for 93% of total population growth, reflecting Thorneside's aging demographic profile. Meanwhile, the 15-24 and 5-14 cohorts are projected to experience population declines.

