Chart Color Schemes
This analysis uses ABS Statistical Areas Level 2 (SA2) boundaries, which can materially differ from Suburbs and Localities (SAL) even when sharing similar names.
SA2 boundaries are defined by the Australian Bureau of Statistics and are designed to represent communities for statistical reporting (e.g., census and ERP).
Suburbs and Localities (SAL) represent commonly-used suburb/locality names (postal-style areas) and may use different geographic boundaries. For comprehensive analysis, consider reviewing both boundary types if available.
est. as @ -- *
ABS ERP | -- people | --
2021 Census | -- people
Sales Activity
Curious about local property values? Filter the chart to assess the volume and appreciation (including resales) trends and regional comparisons, or scroll to the map below view this information at an individual property level.
Find a Recent Sale
Sales Detail
Population
An assessment of population growth drivers in Parkwood reveals an overall ranking slightly below national averages considering recent, and medium term trends
Parkwood's population, as of November 2025, is approximately 9,154, marking a rise of 317 individuals (3.6%) since the 2021 Census which recorded a population of 8,837. This increase is inferred from ABS' estimated resident population of 9,145 in June 2024 and the validation of five new addresses post-Census date. This results in a population density of 1,474 persons per square kilometer, exceeding national averages assessed by AreaSearch. Overseas migration accounted for roughly 77.8% of recent population growth in the area. AreaSearch uses ABS/Geoscience Australia projections for each SA2 area released in 2024 with a base year of 2022.
For areas not covered and years after 2032, Queensland State Government's SA2 area projections from 2023 based on 2021 data are adopted. However, these state projections lack age category splits, so AreaSearch applies proportional growth weightings in line with ABS Greater Capital Region projections released in 2023 and based on 2022 data. Based on projected demographic shifts, the area is expected to experience above median population growth nationally by 2041. The latest annual ERP population numbers project an increase of 1,343 persons by then, reflecting a total rise of 14.6% over the 17-year period.
Frequently Asked Questions - Population
Development
AreaSearch assessment of residential development drivers sees a low level of activity in Parkwood, placing the area among the bottom 25% of areas assessed nationally
Parkwood has granted approval for approximately 43 residential properties per year over the past five financial years, totalling 216 homes. As of FY-26, no approvals have been recorded yet. On average, 0.4 people have moved to the area annually for each dwelling built between FY-21 and FY-25, indicating that new supply is meeting or exceeding demand. The average construction cost value of new homes is $492,000, slightly above the regional average.
This financial year has seen $11.9 million in commercial approvals, suggesting moderate commercial development levels. Parkwood's construction rates per person are similar to the rest of Queensland, maintaining market equilibrium with surrounding areas. The majority of new building activity consists of townhouses or apartments (93.0%), with a smaller proportion of standalone homes (7.0%). This shift from the current housing mix of 91.0% houses reflects reduced development site availability and changing lifestyle demands and affordability requirements. Parkwood has an established market, with approximately 1901 people per dwelling approval.
By 2041, the area is projected to grow by 1,334 residents, and at current development rates, new housing supply should comfortably meet demand, providing favourable conditions for buyers and potentially supporting growth beyond current population projections.
Frequently Asked Questions - Development
Infrastructure
Parkwood has very high levels of nearby infrastructure activity, ranking in the top 20% nationally
Changes to local infrastructure significantly impact an area's performance. AreaSearch has identified 32 projects that may affect this region. Notable projects include New Coomera Hospital, Griffith University Gold Coast Campus Expansion, Coomera Connector Stage 1 - Central Section, and Urbana (Coomera Urban Village) Stage 3. The following list details those most likely to be relevant.
Professional plan users can use the search below to filter and access additional projects.
INFRASTRUCTURE SEARCH
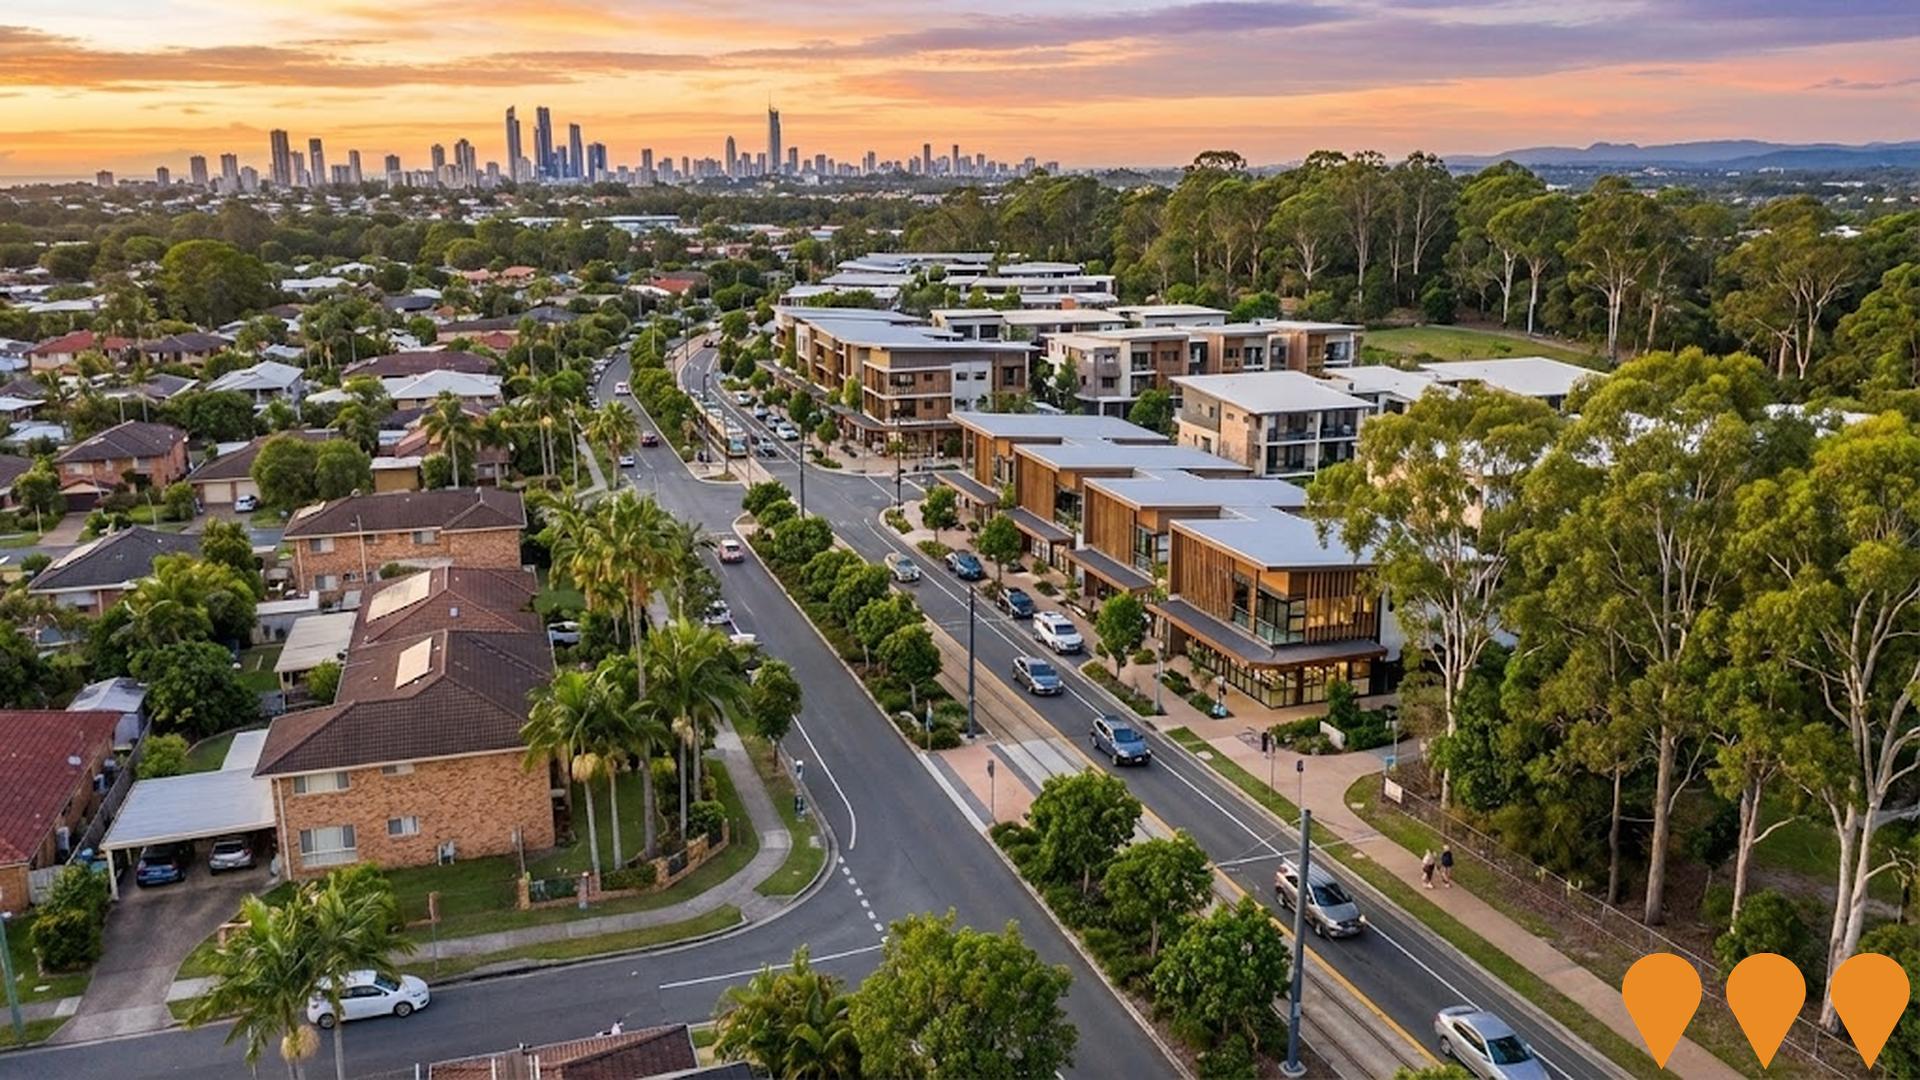
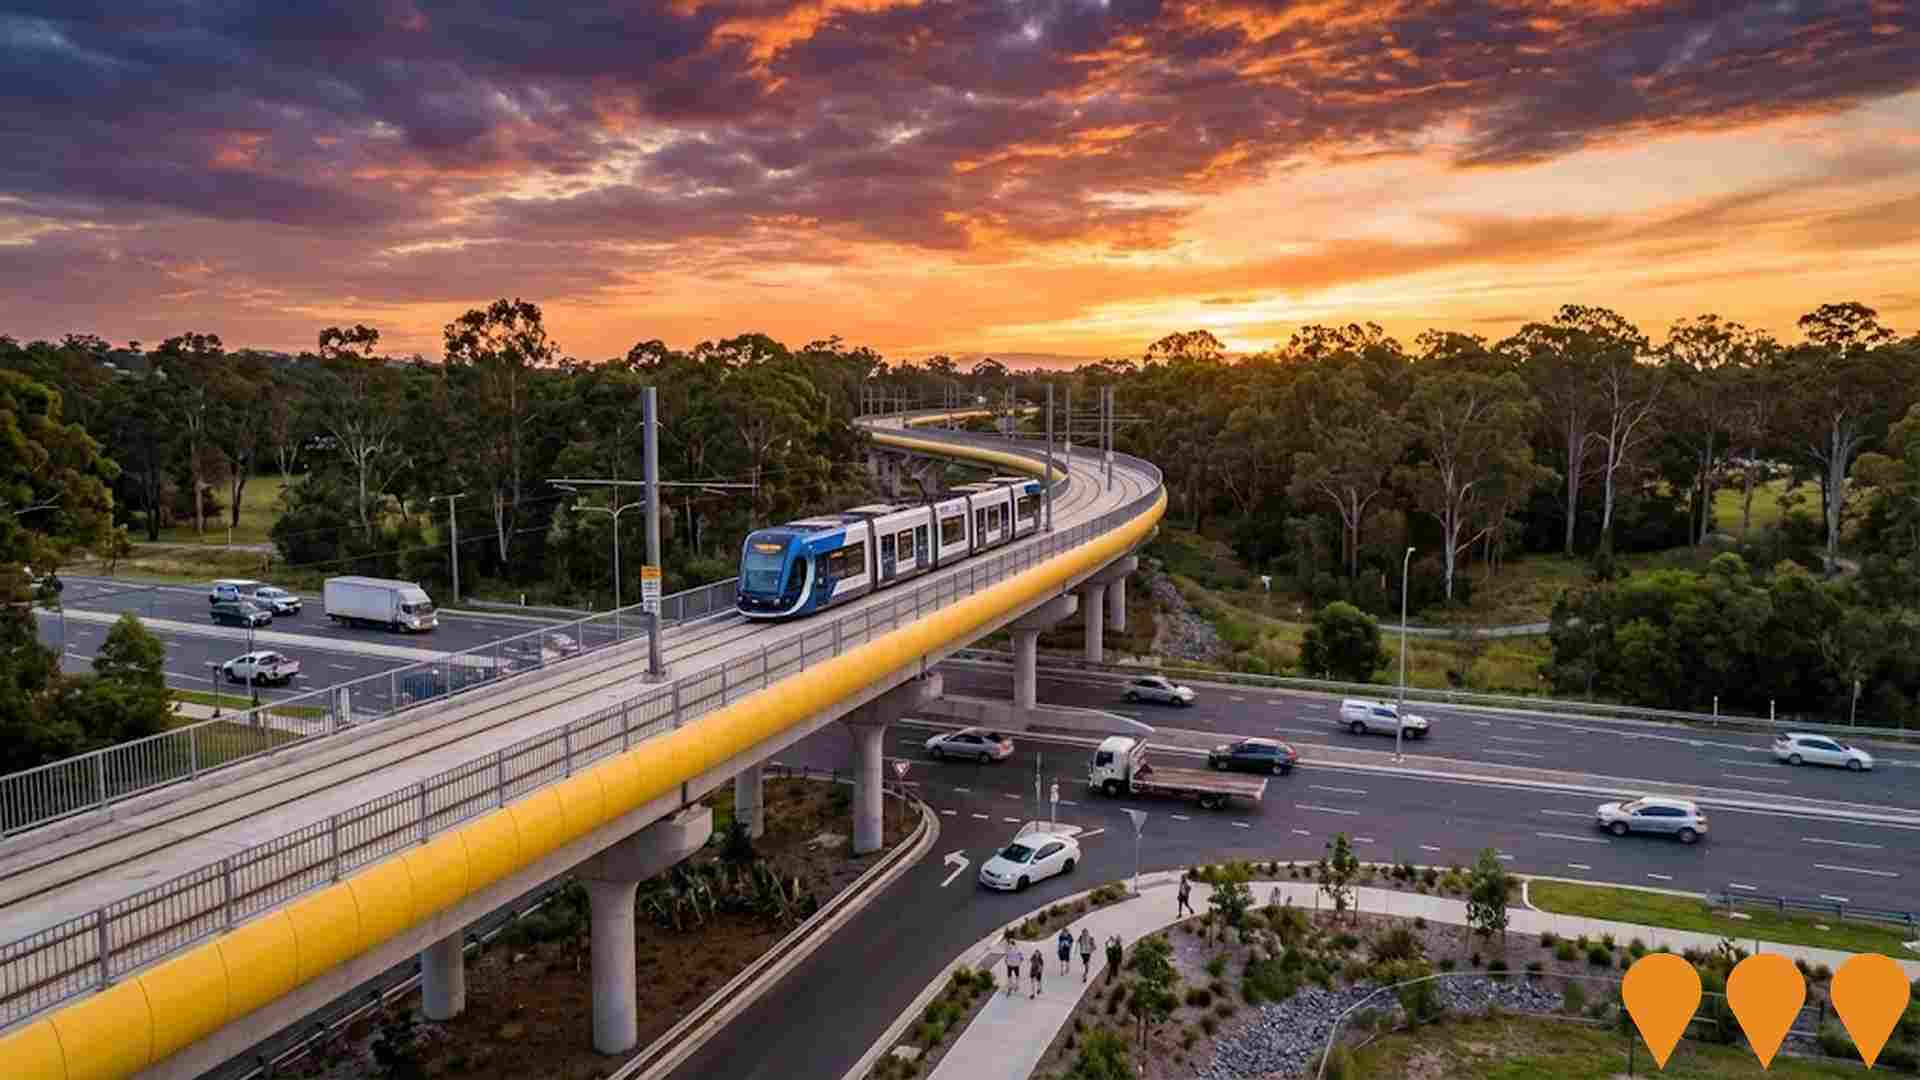
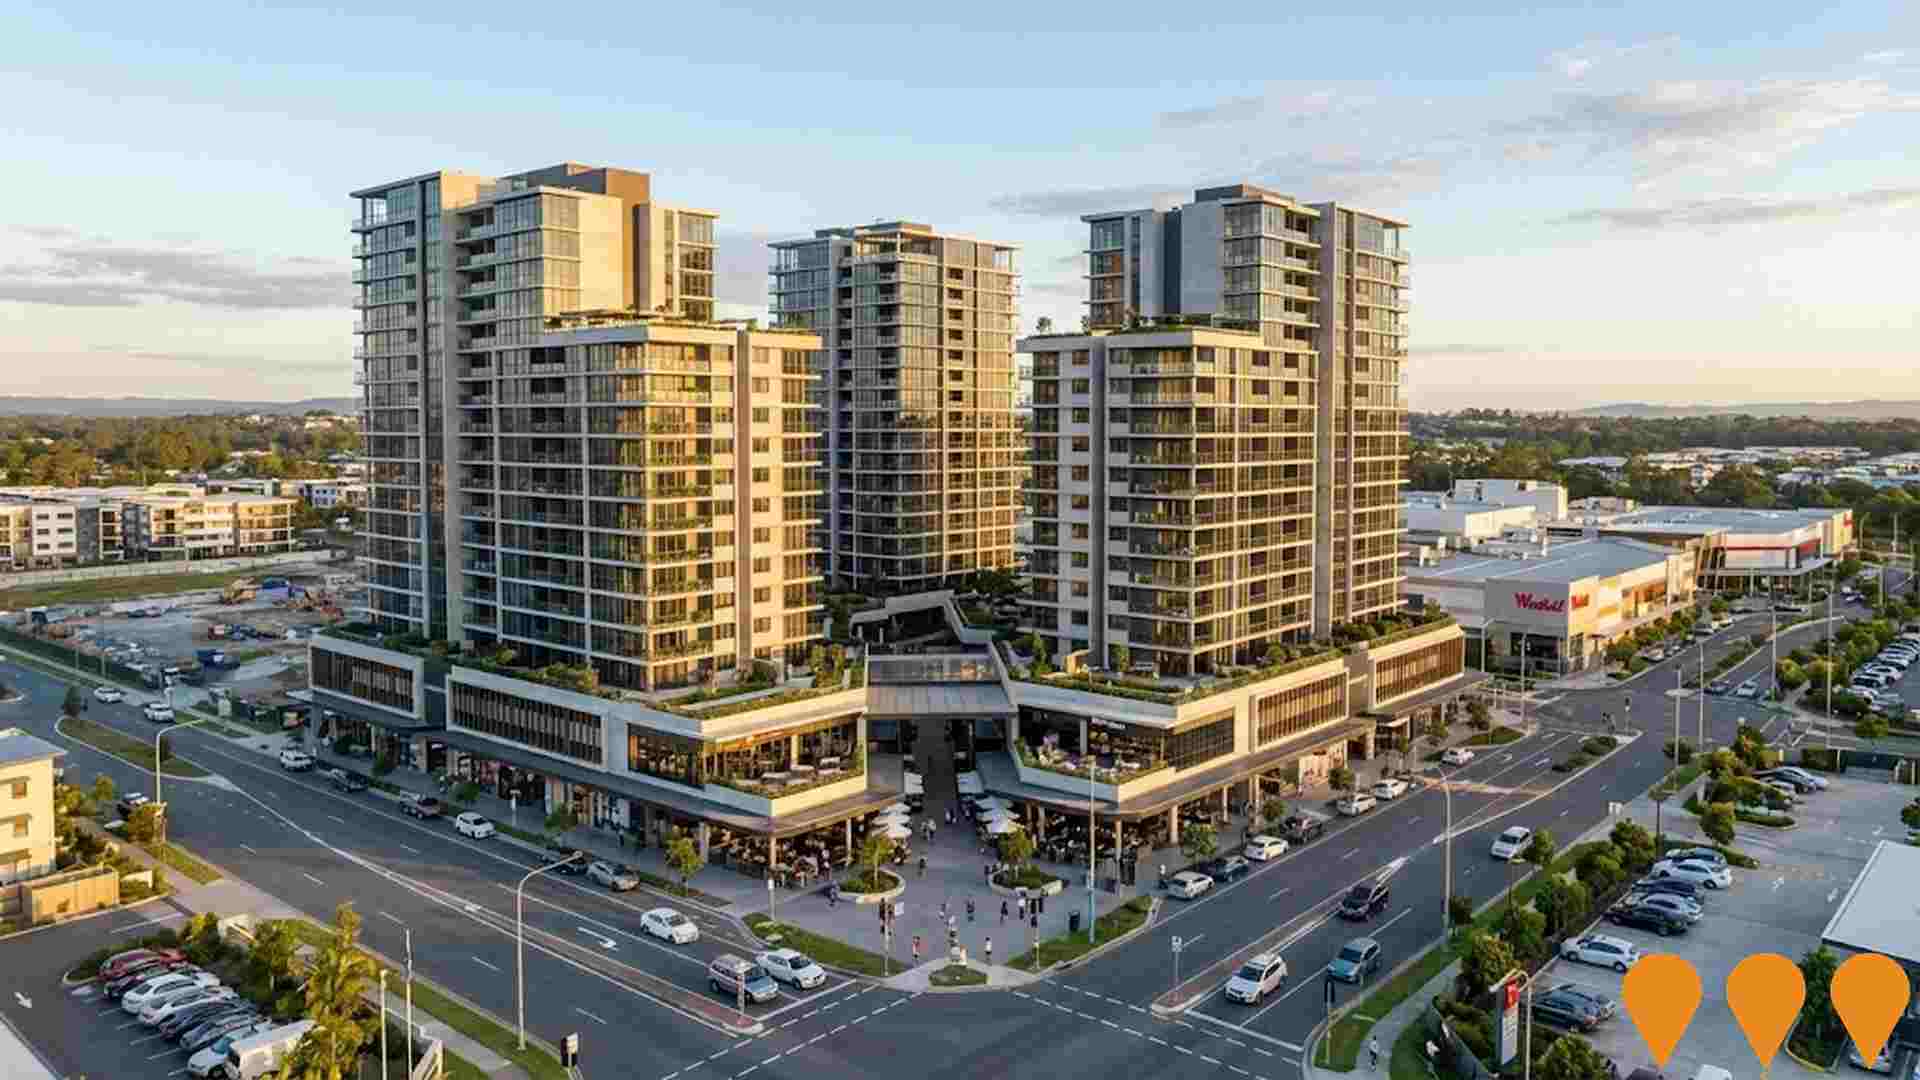
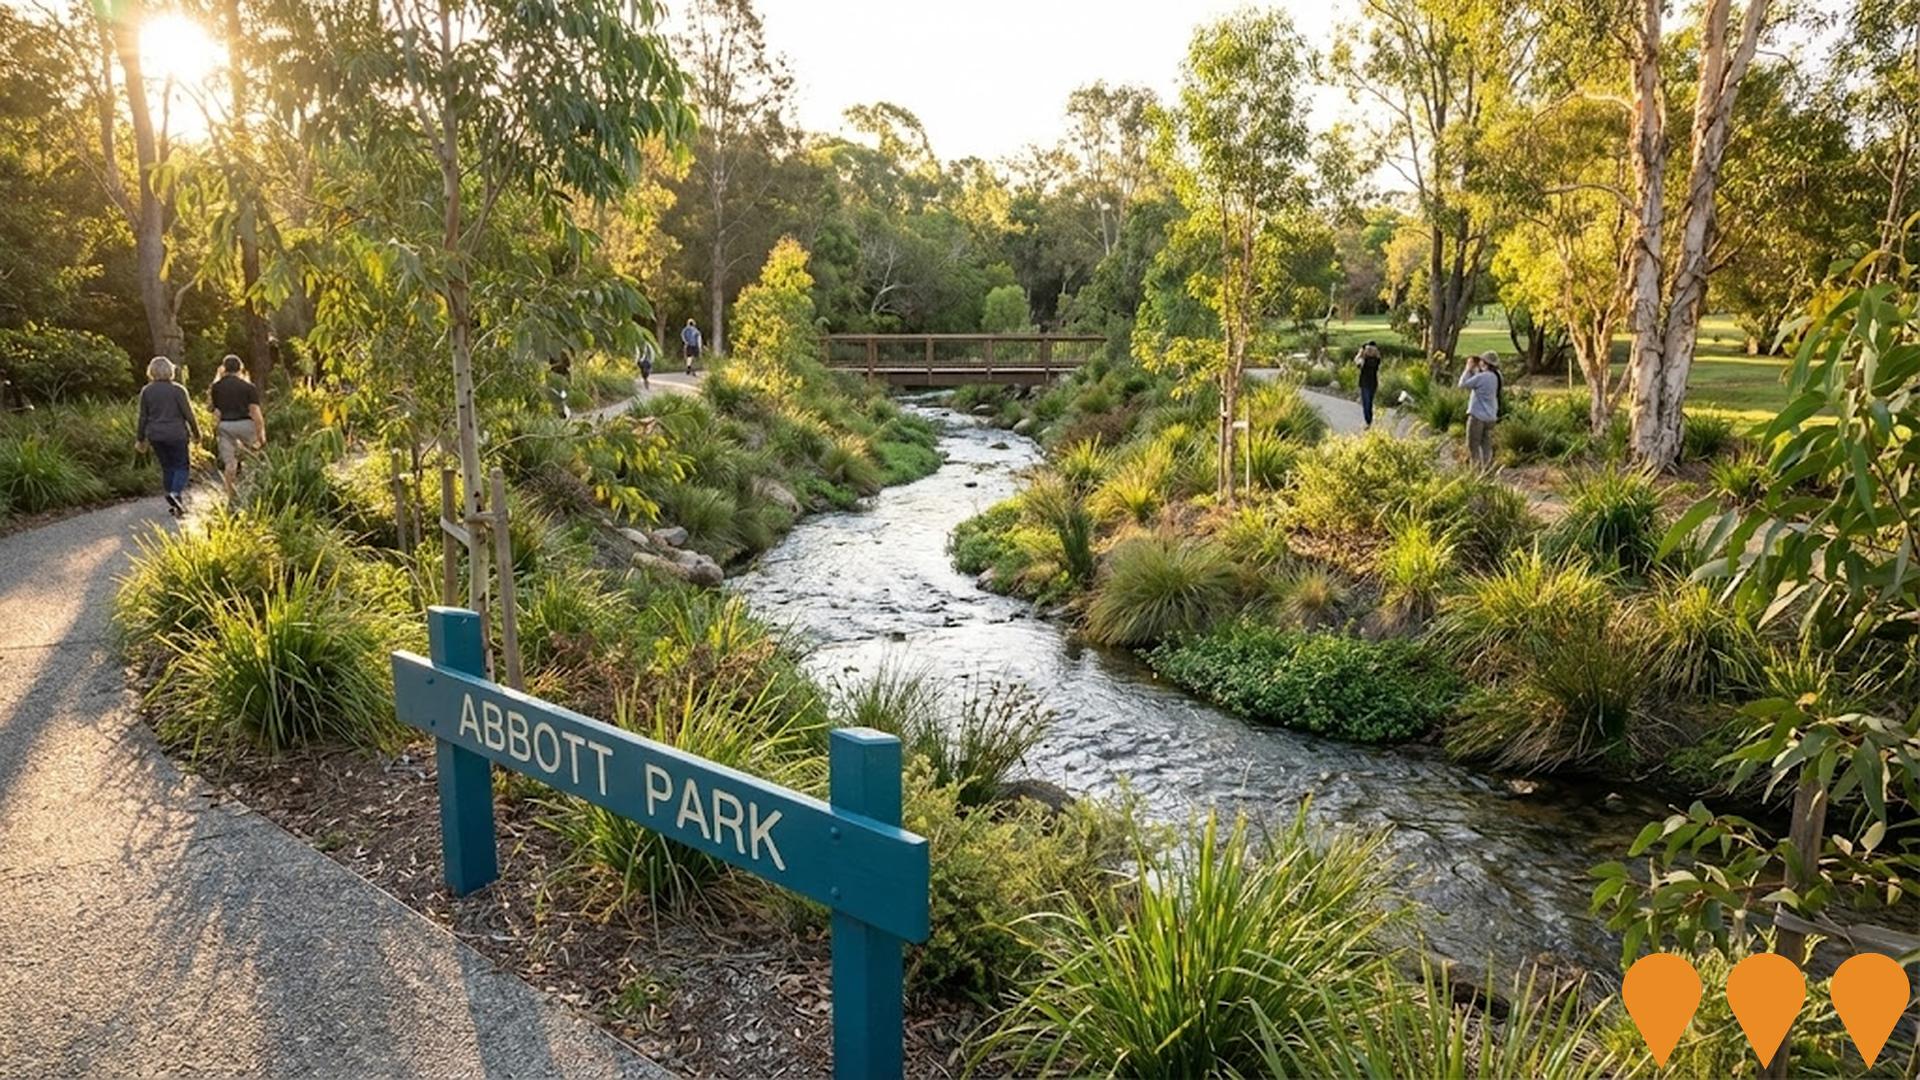
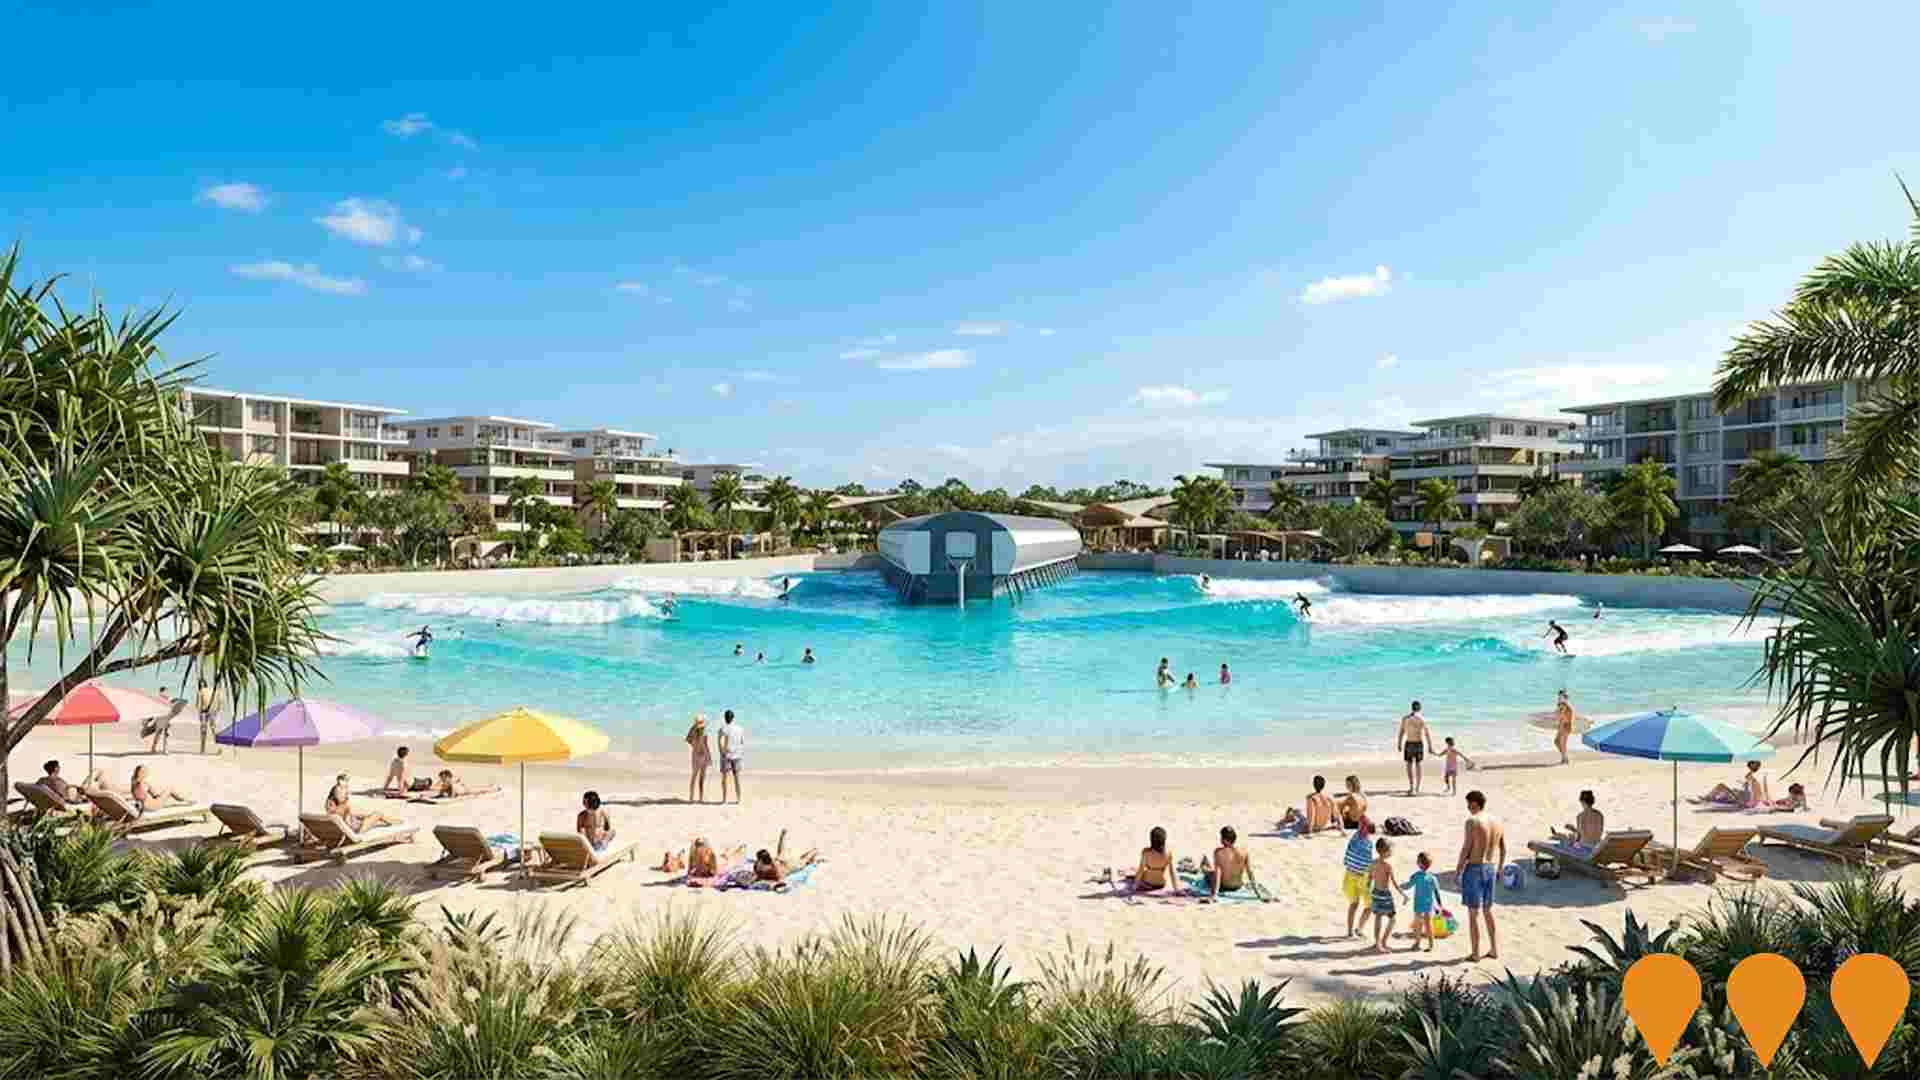
 Denotes AI-based impression for illustrative purposes only, not to be taken as definitive under any circumstances. Please follow links and conduct other investigations from the project's source for actual imagery. Developers and project owners wishing us to use original imagery please Contact Us and we will do so.
Frequently Asked Questions - Infrastructure
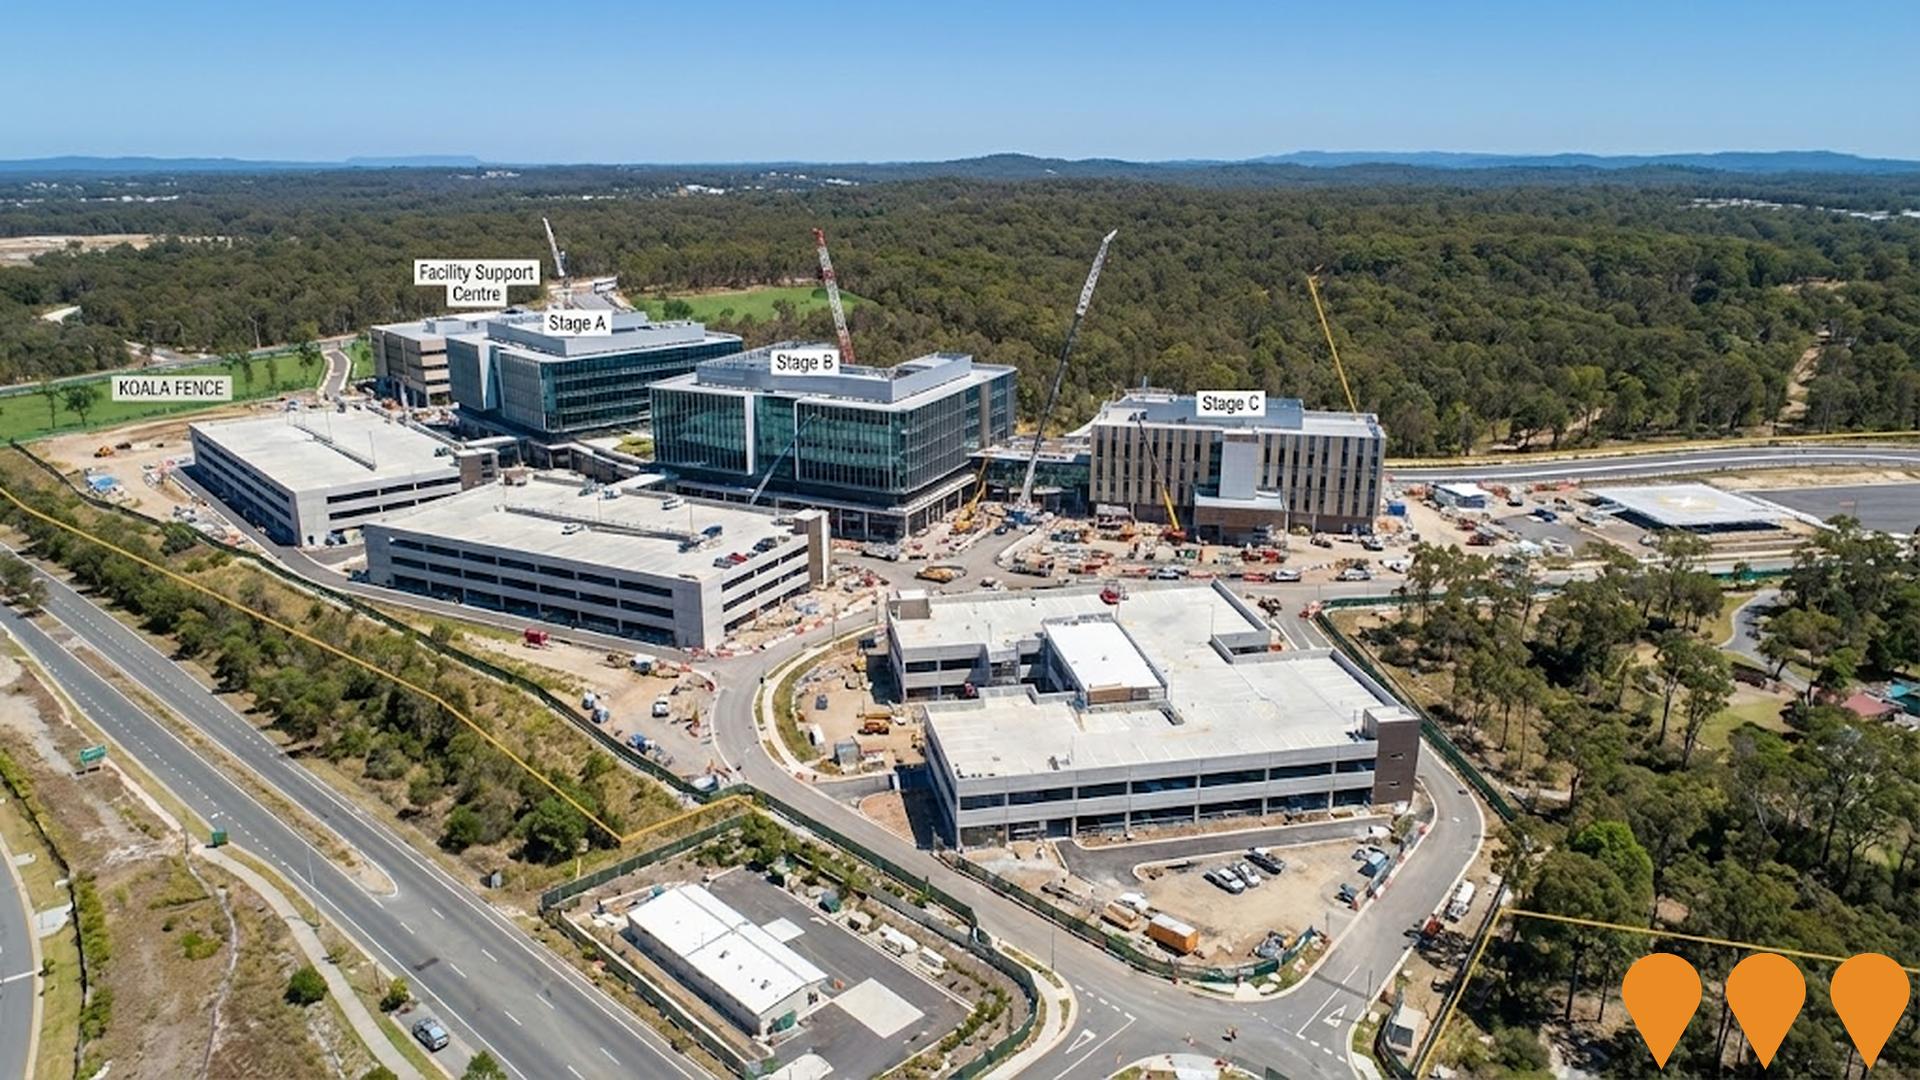
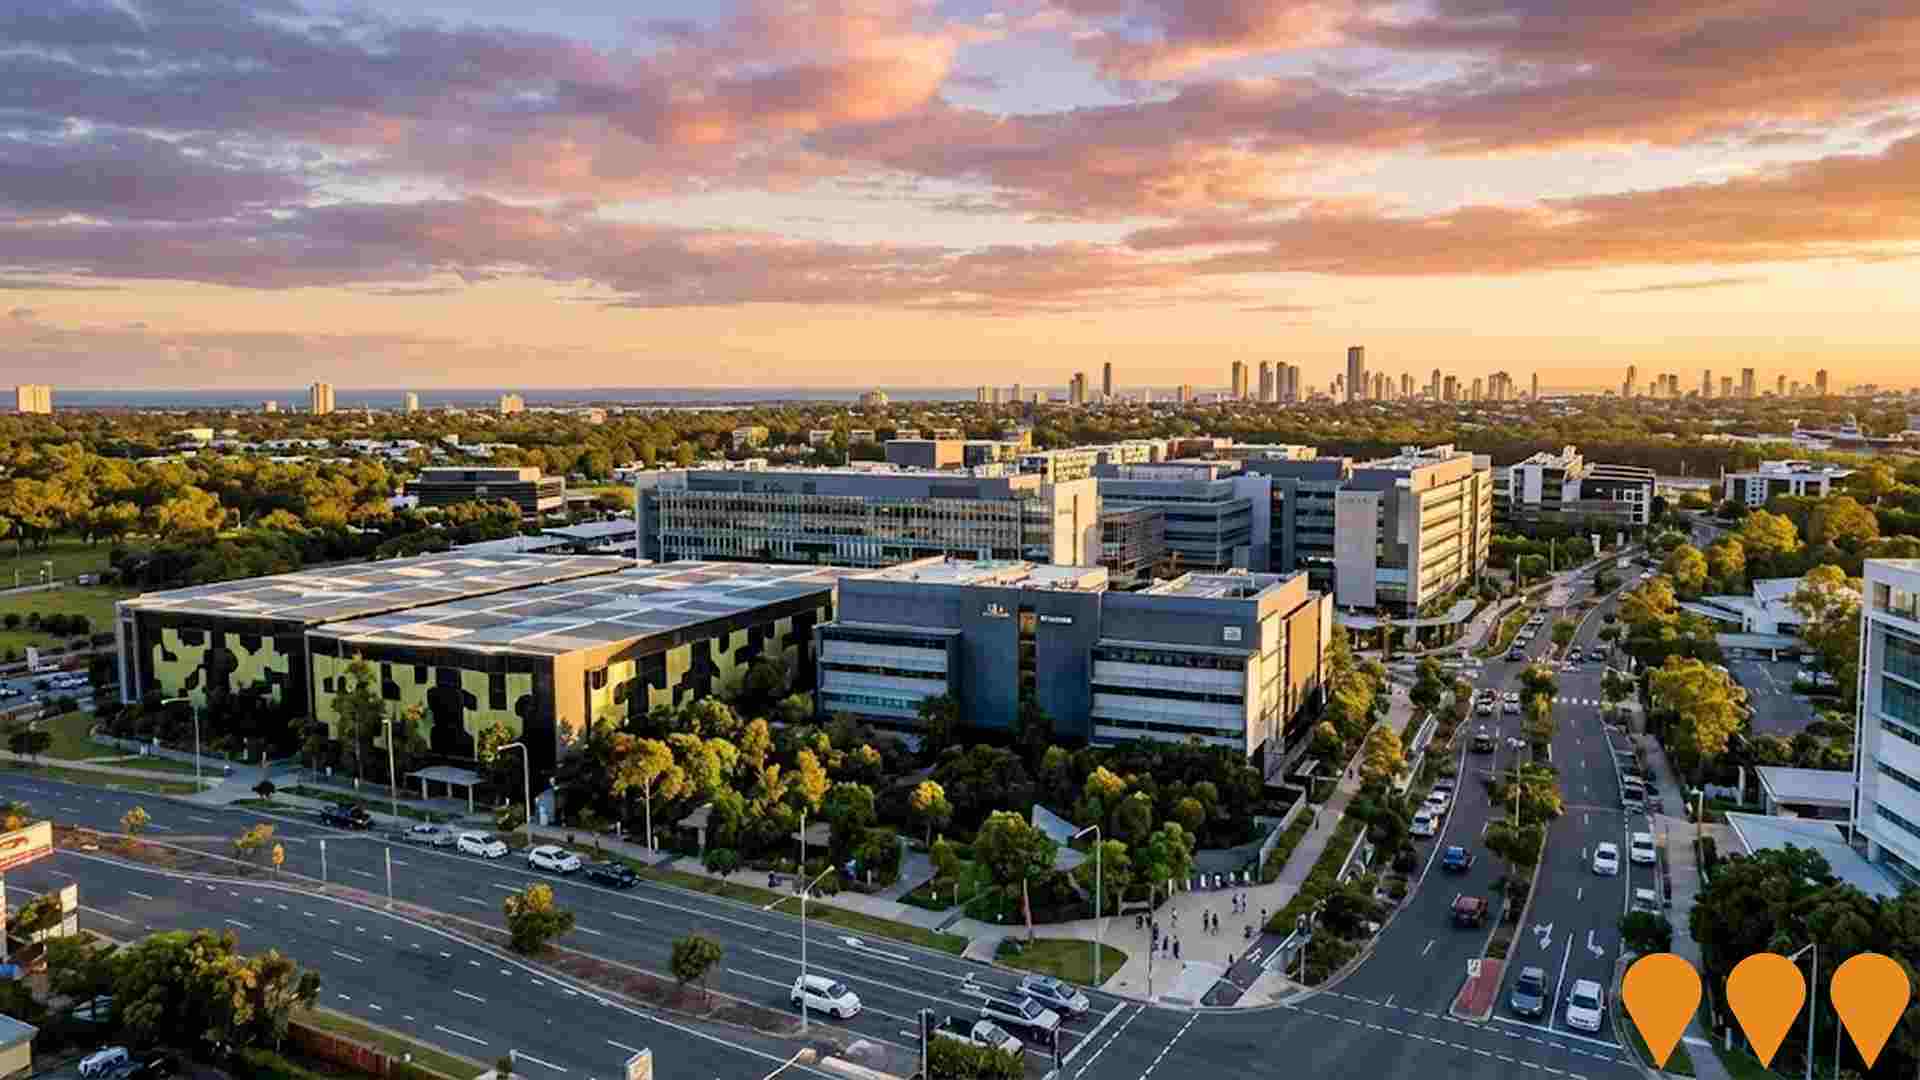
New Coomera Hospital
State-of-the-art public hospital now planned to feature about 600 overnight beds, an increase from the original 404, to serve the growing northern Gold Coast population. Features will include an emergency department, operating theatres, birthing suites, intensive care, coronary care, and mental health services. The project is part of the Queensland Government's Health Big Build program and is currently in the construction phase with early works continuing and major structural milestones achieved.
Gold Coast Health and Knowledge Precinct - Lumina Development
Lumina is a 9.5-hectare commercial cluster within the Gold Coast Health and Knowledge Precinct, dedicated to life sciences, health, and technology. It features major developments like the RDX Life Sciences Centre and Proxima, fostering collaboration between researchers, clinicians, and entrepreneurs.
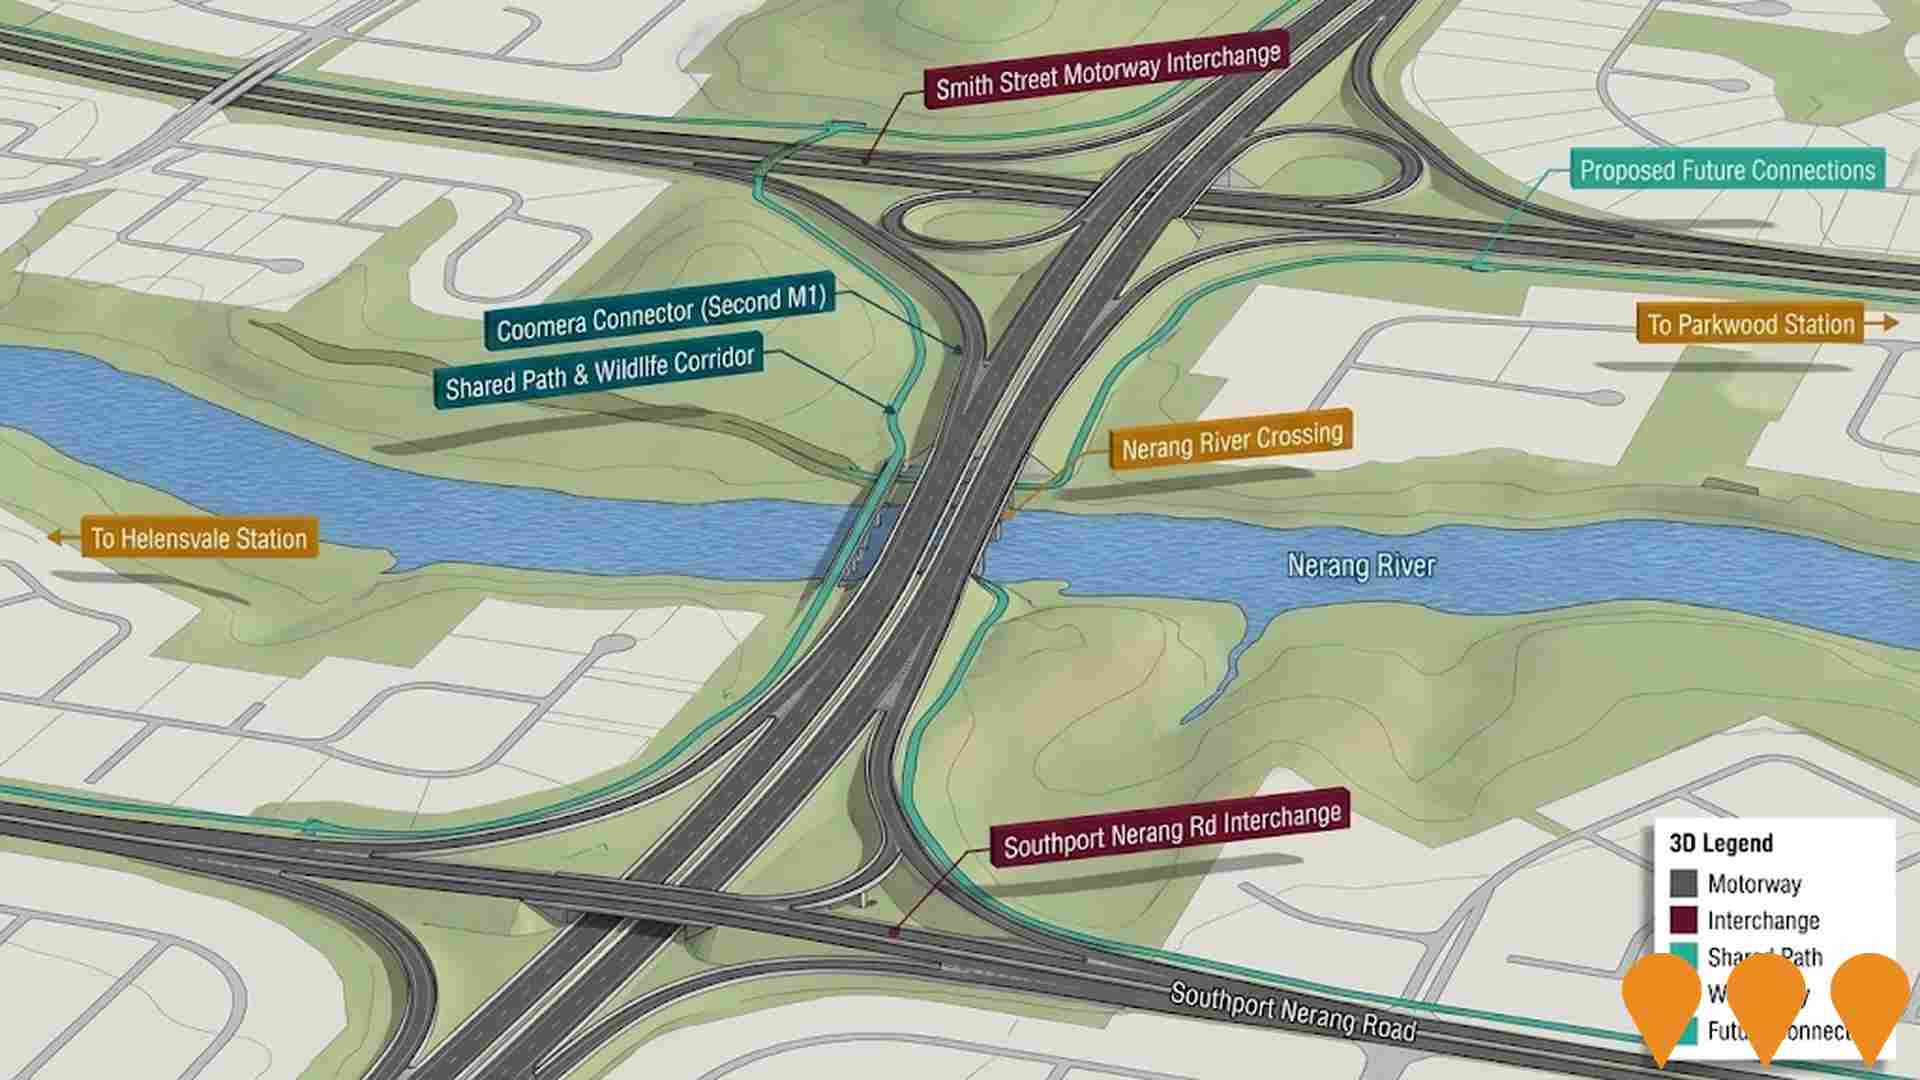
Coomera Connector Stage 1 - Central Section
Construction of 8km section of the Coomera Connector (Second M1) between Helensvale Road and Smith Street Motorway in Parkwood. Features grade separated interchanges, more than 8km of shared bike and pedestrian paths connecting to Helensvale and Parkwood light rail stations, and wildlife corridors.
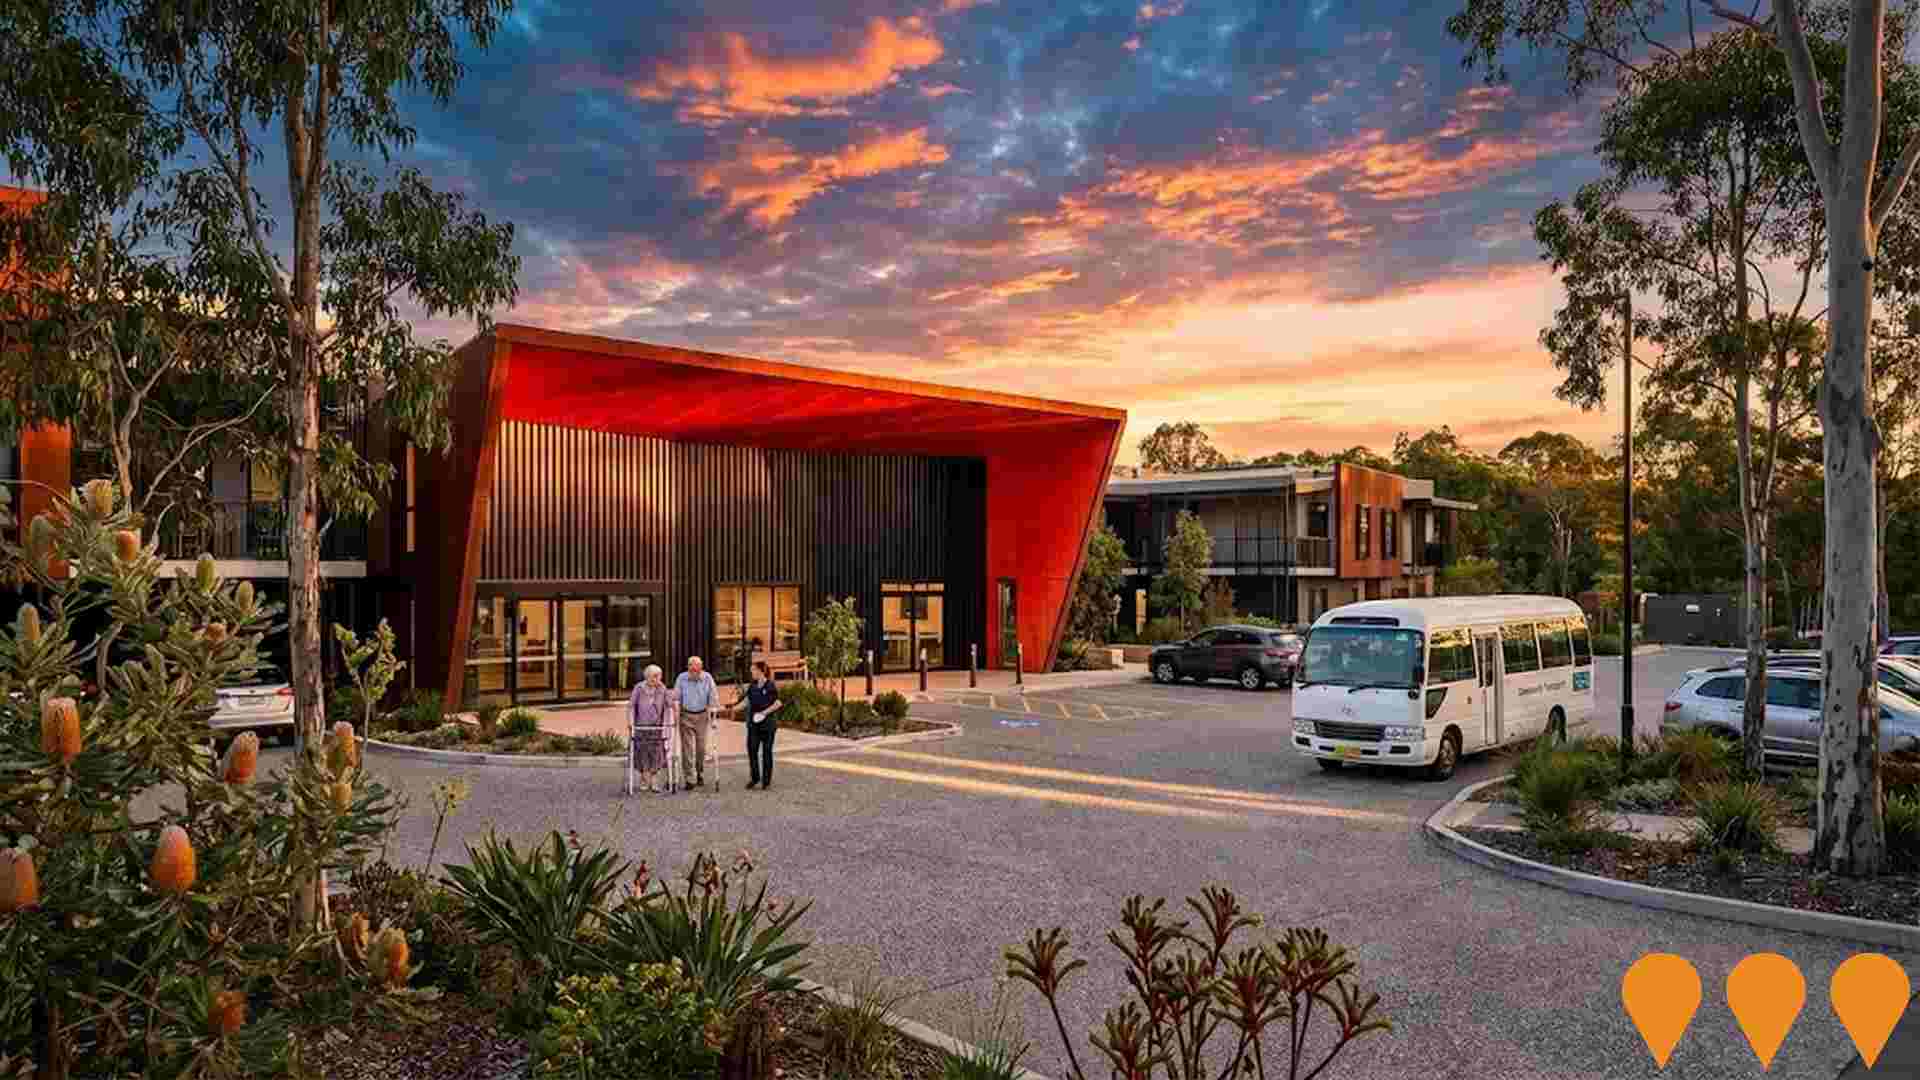
130-Bed Aged Care Facility
8,906 sqm site with development approval for a 130 bed residential aged care facility. The site was marketed by Knight Frank under instructions from Cor Cordis as receivers, with DA current until April 2026. The property has since sold (May 2025). No construction works identified; project remains at approved stage pending new owner plans.
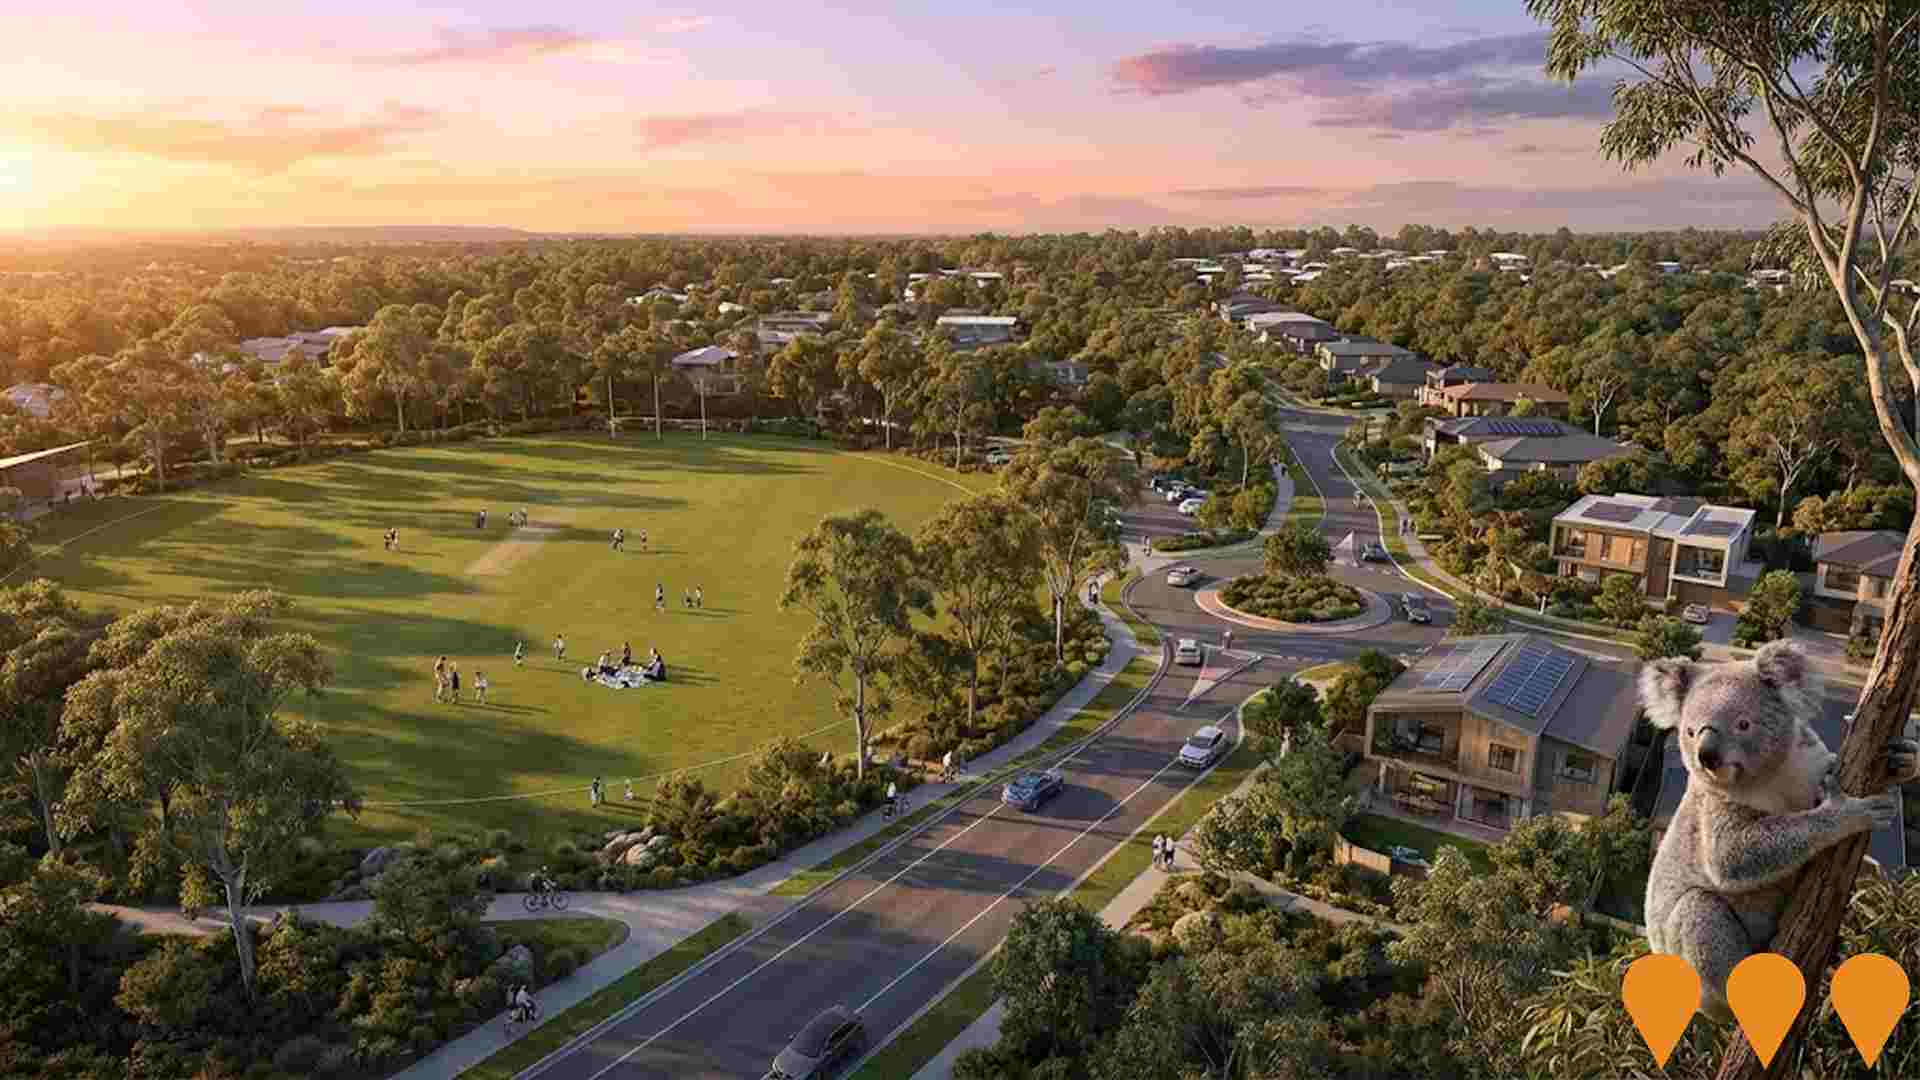
Arundel Hills Residential Development
Approved redevelopment of the 67-hectare former Arundel Hills Country Club into an environmentally focused residential community. The Queensland Government-approved project will deliver a minimum of 650 homes (including 20% affordable housing) for approximately 1200 residents, with over 60% of the site dedicated to recreation, open space, conservation, wetlands and koala habitat. Features include low-rise and medium-density dwellings, a destination recreation park, sporting facilities for AB Paterson College, and comprehensive environmental protections.
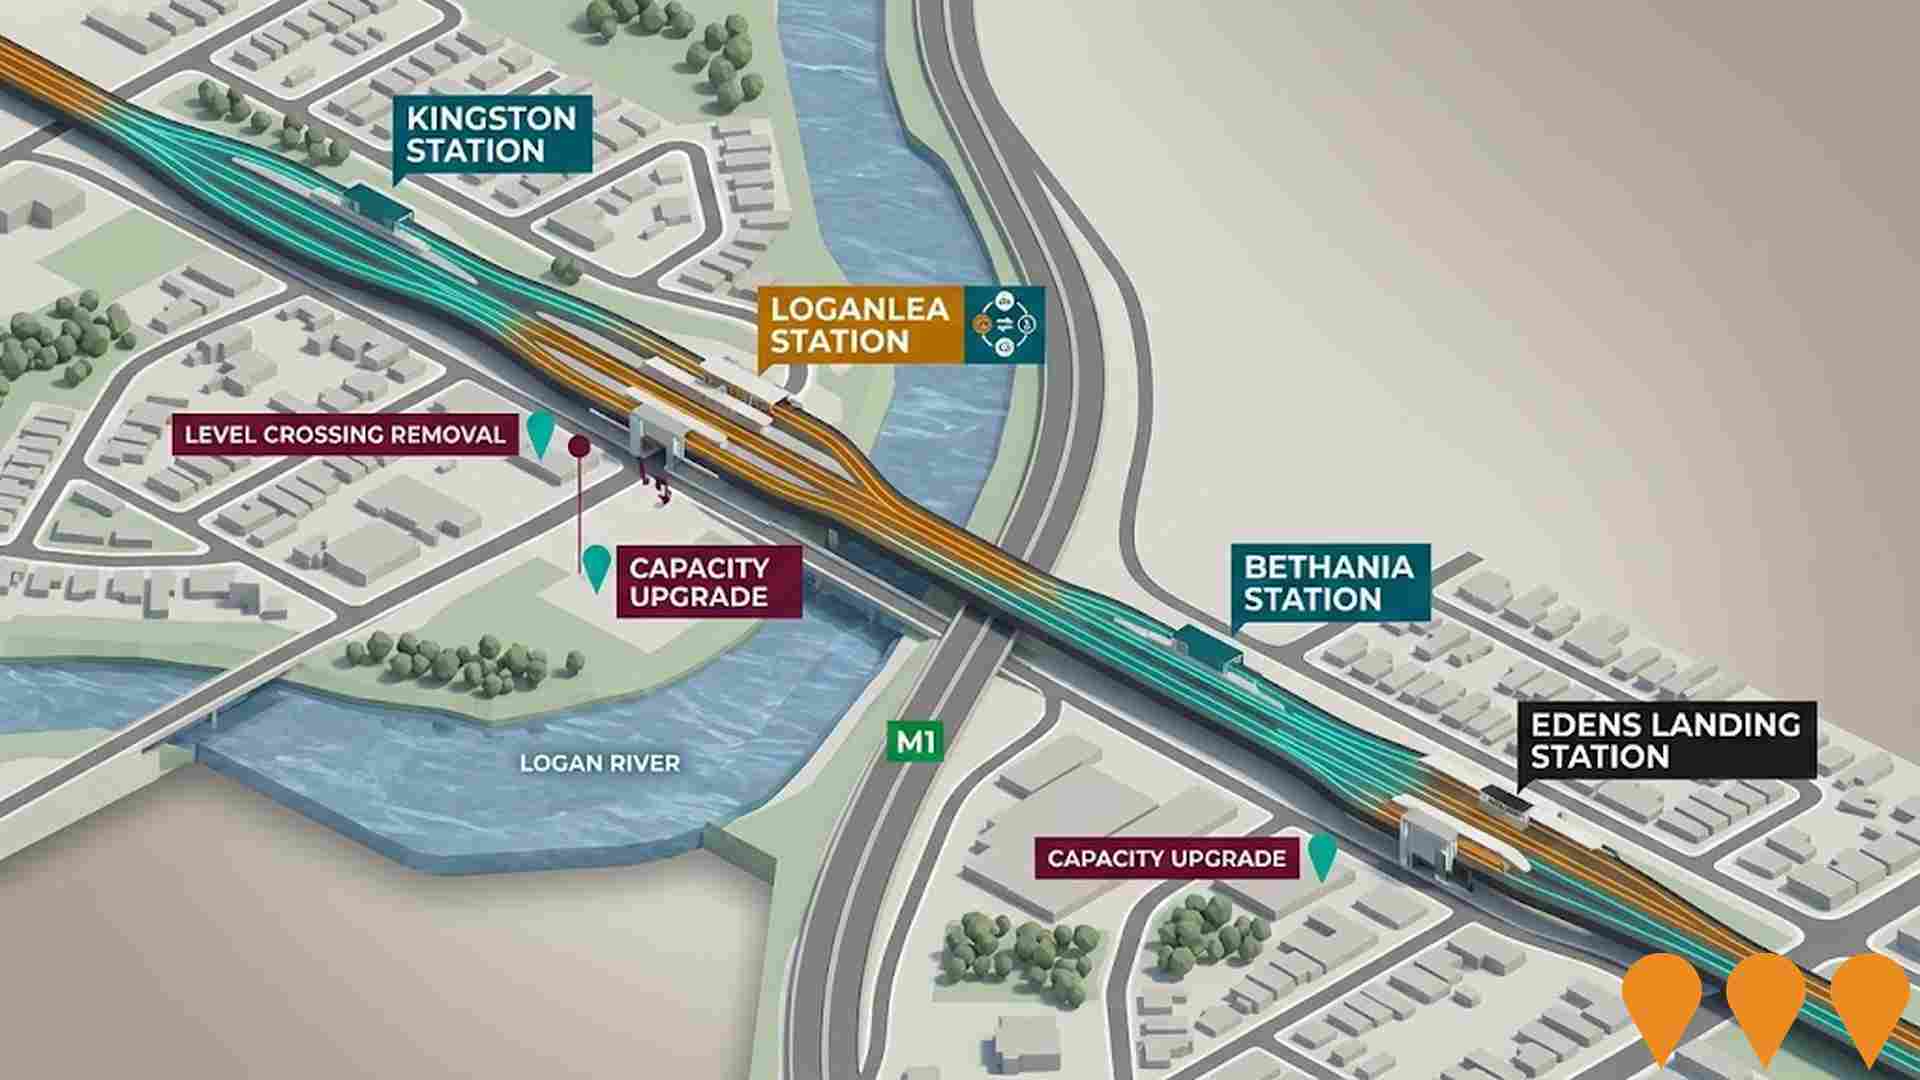
Logan and Gold Coast Faster Rail
Major rail infrastructure project to deliver more frequent and reliable train services between Brisbane, Logan, and Gold Coast. The $5.75 billion project will double tracks from two to four between Kuraby and Beenleigh over 20km, remove 5 level crossings, upgrade 9 stations (Kuraby, Trinder Park, Woodridge, Kingston, Loganlea, Bethania, Edens Landing, Holmview, Beenleigh), and improve accessibility and connectivity. Part of South East Queensland rail network improvements supporting Brisbane 2032 Olympic and Paralympic Games. Jointly funded 50:50 by Australian and Queensland Governments.
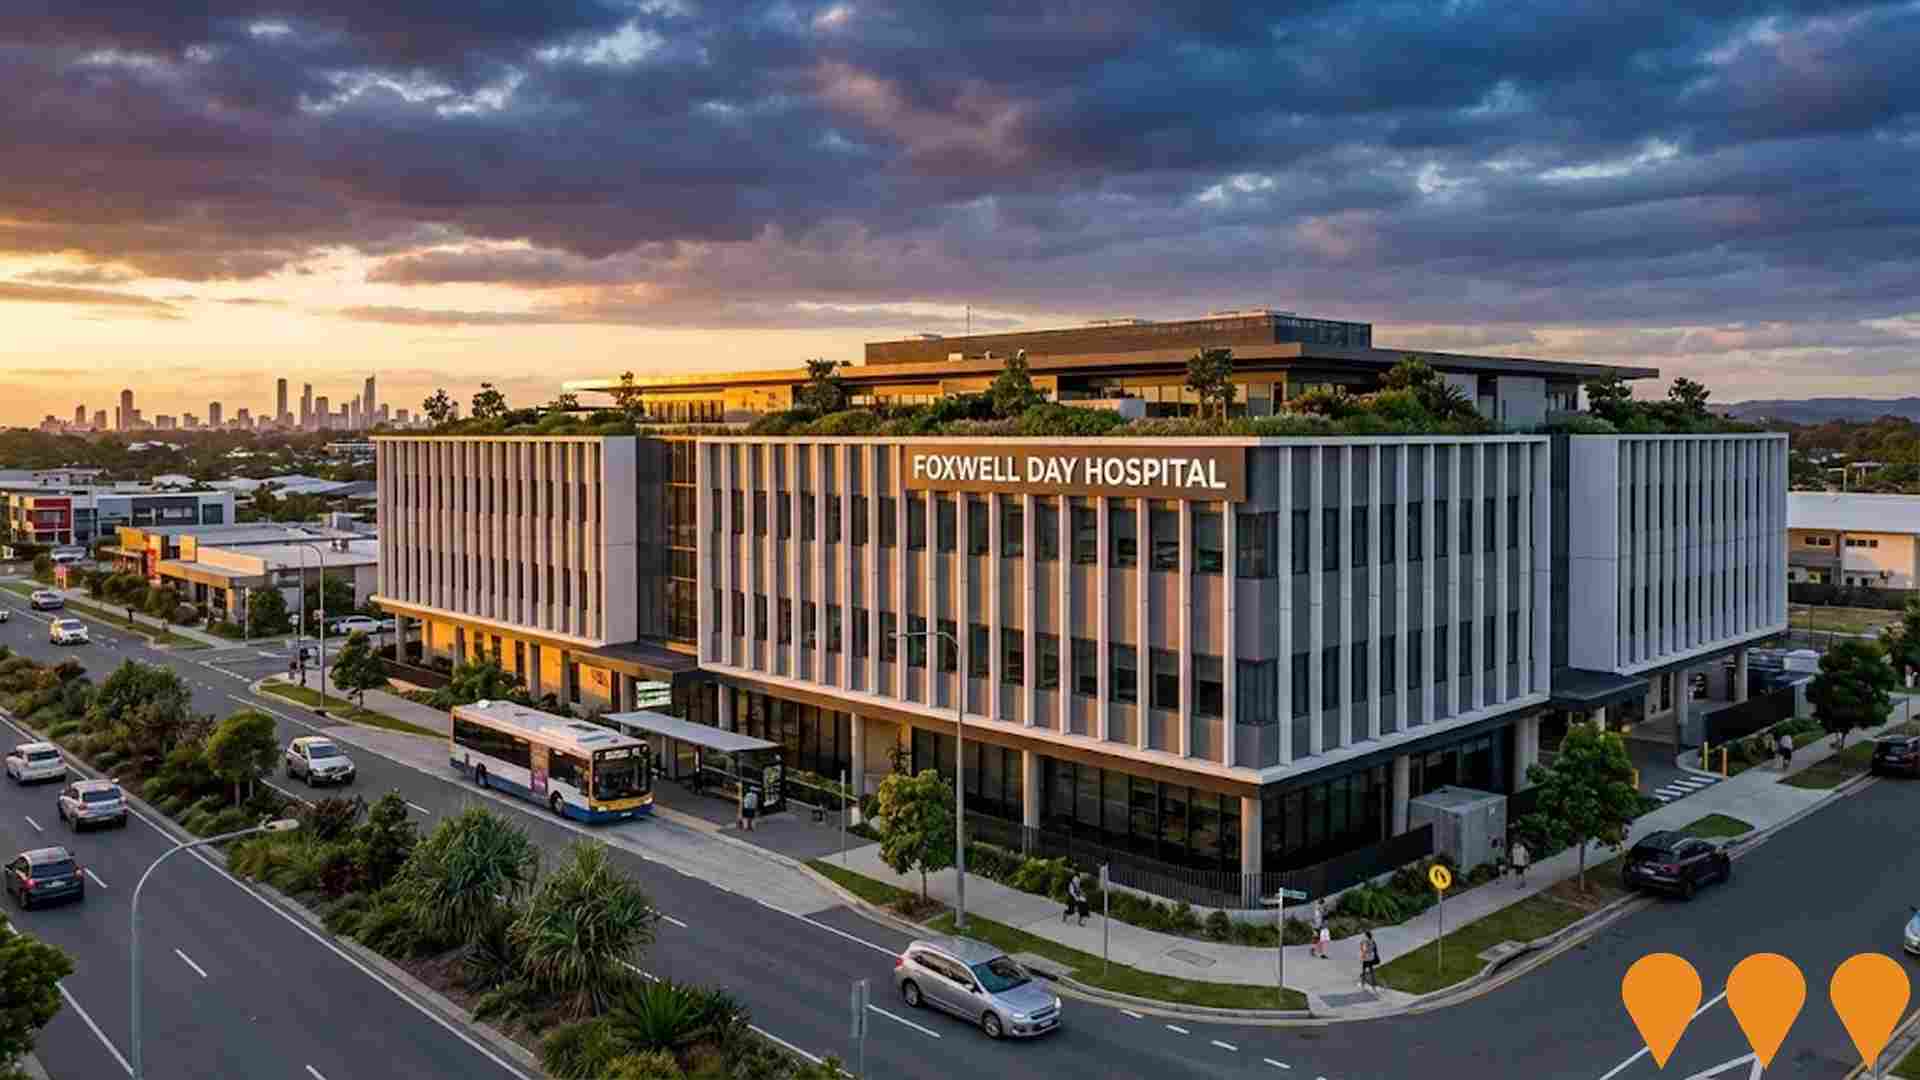
Foxwell Day Hospital & Health Precinct
400-bed private hospital and comprehensive health precinct by Keylin and Kinstone Group. Features ambulatory care, surgical facilities, and medical services. Part of $1.5 billion Foxwell Coomera masterplan development.
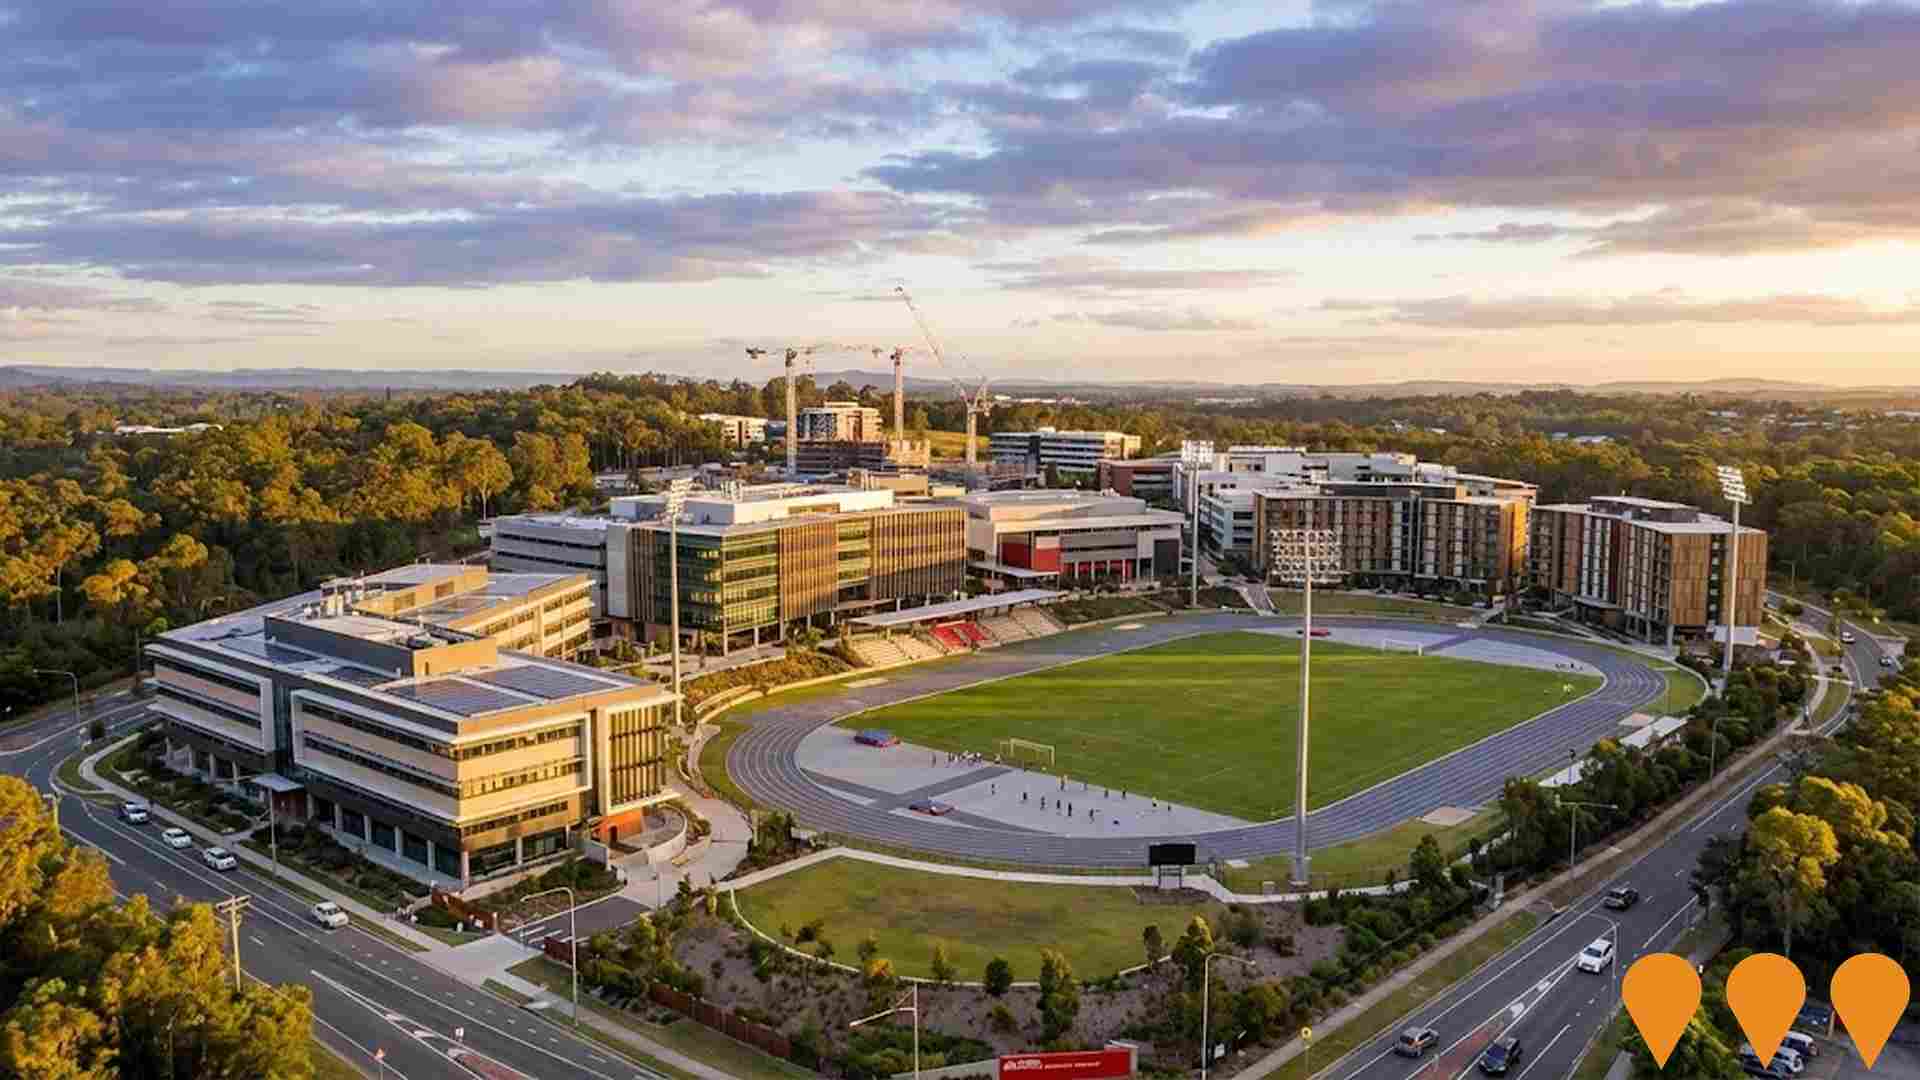
Griffith University Gold Coast Campus Expansion
New academic buildings, student accommodation, research facilities and sports complex at Griffith University Gold Coast campus.
Employment
AreaSearch analysis indicates Parkwood maintains employment conditions that align with national benchmarks
Parkwood's workforce is skilled with significant representation in essential services sectors. The unemployment rate was 4.2% as of September 2025.
Employment growth over the past year was estimated at 1.2%. There were 5,189 residents employed by September 2025, with an unemployment rate aligning with Rest of Qld's 4.1%. Workforce participation was higher at 64.8% compared to Rest of Qld's 59.1%.
Key industries for employment among residents were health care & social assistance, retail trade, and construction. Agriculture, forestry & fishing had limited presence at 0.3%, lower than the regional average of 4.5%. Employment opportunities locally appeared limited based on Census data comparison between working population and resident population. Between September 2024 and September 2025, employment levels increased by 1.2% while labour force grew by 2.0%, leading to a 0.7 percentage point rise in unemployment. In contrast, Rest of Qld saw employment growth of 1.7%, labour force growth of 2.1%, and an unemployment increase of 0.3 percentage points. State-level data from 25-Nov-25 showed Queensland's employment had contracted by 0.01% (losing 1,210 jobs), with the state unemployment rate at 4.2%, closely matching the national rate of 4.3%. National employment forecasts from Jobs and Skills Australia, released in May-25, project a 6.6% increase over five years and 13.7% over ten years. Applying these projections to Parkwood's employment mix suggests local employment should grow by 6.7% over five years and 13.9% over ten years, based on simple weighting extrapolation for illustrative purposes.
Frequently Asked Questions - Employment
Income
Income levels align closely with national averages, indicating typical economic conditions for Australian communities according to AreaSearch analysis
Parkwood SA2 had a median taxpayer income of $48,663 and an average income of $63,270 in the financial year 2022. These figures are slightly lower than national averages of $50,780 and $64,844 for Rest of Qld respectively. As of September 2025, estimated median and average incomes would be approximately $55,471 and $72,121 based on a 13.99% Wage Price Index growth since financial year 2022. According to the 2021 Census, household income ranks at the 69th percentile ($2,064 weekly), while personal income is at the 35th percentile. The predominant income cohort in Parkwood consists of 37.5% (3,432 people) with incomes between $1,500 and $2,999, similar to the surrounding region's 31.7%. Housing costs consume 16.8% of income, but strong earnings place disposable income at the 68th percentile. The area's SEIFA income ranking places it in the 6th decile.
Frequently Asked Questions - Income
Housing
Parkwood is characterized by a predominantly suburban housing profile, with above-average rates of outright home ownership
Parkwood's dwelling structures, as per the latest Census evaluation, consisted of 90.7% houses and 9.3% other dwellings. This contrasts with Non-Metro Qld's figures of 44.5% houses and 55.5% other dwellings. Home ownership in Parkwood stood at 27.7%, with mortgaged dwellings at 41.9% and rented ones at 30.4%. The median monthly mortgage repayment was $1,894, higher than Non-Metro Qld's average of $1,750. The median weekly rent in Parkwood was $538, compared to Non-Metro Qld's $420. Nationally, Parkwood's mortgage repayments were higher at $1,894 versus the Australian average of $1,863, and rents were substantially above the national figure of $375.
Frequently Asked Questions - Housing
Household Composition
Parkwood features high concentrations of group households and family households, with a higher-than-average median household size
Family households comprise 80.6% of all households, including 38.1% couples with children, 27.5% couples without children, and 13.3% single parent families. Non-family households account for the remaining 19.4%, with lone person households at 12.8% and group households comprising 6.8%. The median household size is 3.0 people, which is larger than the Rest of Qld average of 2.3.
Frequently Asked Questions - Households
Local Schools & Education
Parkwood performs slightly above the national average for education, showing competitive qualification levels and steady academic outcomes
The area's educational profile is notable regionally with university qualification rates at 26.8%, exceeding the Rest of Qld average of 20.6%. Bachelor degrees are most common at 18.1%, followed by postgraduate qualifications (6.7%) and graduate diplomas (2.0%). Vocational credentials are prominent, with 36.4% of residents aged 15+ holding them - advanced diplomas at 11.9% and certificates at 24.5%.
Educational participation is high, with 32.7% currently enrolled in formal education. This includes 9.6% in tertiary education, 9.0% in primary education, and 7.8% pursuing secondary education.
Frequently Asked Questions - Education
Schools Detail
Nearby Services & Amenities
Transport
Transport servicing is good compared to other areas nationally based on assessment of service frequency, route connectivity and accessibility
The Parkwood transport analysis shows 43 active stops operating within the area. These include lightrail and bus services. Five routes serve these stops, collectively providing 1,755 weekly passenger trips.
Transport accessibility is rated good, with residents typically located 209 meters from the nearest stop. Service frequency averages 250 trips per day across all routes, equating to approximately 40 weekly trips per individual stop.
Frequently Asked Questions - Transport
Transport Stops Detail
Health
The level of general health in Parkwood is notably higher than the national average with prevalence of common health conditions quite low across both younger and older age cohorts
Parkwood shows better-than-average health outcomes, with low prevalence of common conditions across both younger and older age groups.
Approximately 51% (~4,686 people) have private health cover, slightly lower than the average SA2 area. The most prevalent medical conditions are asthma (7.4%) and arthritis (7.3%). About 71.5% of residents report no medical ailments, compared to 69.4% in Rest of Qld. Around 14.3% (~1,309 people) are aged 65 and over, lower than the 17.1% in Rest of Qld. Health outcomes among seniors align with those of the general population.
Frequently Asked Questions - Health
Cultural Diversity
The level of cultural diversity witnessed in Parkwood was found to be above average when compared nationally for a number of language and cultural background related metrics
Parkwood's population showed higher linguistic diversity, with 17.9% speaking a language other than English at home, compared to most local markets. Overseas-born residents made up 33.3%, indicating significant international migration. Christianity was the predominant religion in Parkwood, accounting for 47.2%.
Islam, while still a minority, had a higher representation in Parkwood at 2.6% compared to Rest of Qld's 1.8%. In terms of ancestry, English (29.0%), Australian (21.9%), and Other (9.9%) were the top groups. Notably, New Zealanders comprised 1.7%, Maori made up 2.0%, and Koreans accounted for 0.8% of Parkwood's population, each exceeding their respective regional percentages.
Frequently Asked Questions - Diversity
Age
Parkwood's population is slightly younger than the national pattern
Parkwood has a median age of 36, which is lower than the Rest of Qld figure of 41 and Australia's median age of 38. The 15-24 cohort is over-represented in Parkwood at 18.7%, compared to the Rest of Qld average and the national figure of 12.5%. Meanwhile, those aged 75-84 are under-represented at 4.3%. Between 2021 and present, the 25-34 age group has grown from 13.3% to 15.2%, while the 15-24 cohort increased from 17.2% to 18.7%. Conversely, the 5-14 cohort declined from 11.8% to 10.1%, and the 45-54 group dropped from 13.6% to 12.1%. By 2041, demographic modeling projects significant changes in Parkwood's age profile. The 25-34 age cohort is expected to expand by 579 people (42%), from 1,391 to 1,971. Conversely, both the 55-64 and 15-24 age groups are projected to decrease in number.
