Chart Color Schemes
This analysis uses ABS Statistical Areas Level 2 (SA2) boundaries, which can materially differ from Suburbs and Localities (SAL) even when sharing similar names.
SA2 boundaries are defined by the Australian Bureau of Statistics and are designed to represent communities for statistical reporting (e.g., census and ERP).
Suburbs and Localities (SAL) represent commonly-used suburb/locality names (postal-style areas) and may use different geographic boundaries. For comprehensive analysis, consider reviewing both boundary types if available.
est. as @ -- *
ABS ERP | -- people | --
2021 Census | -- people
Sales Activity
Curious about local property values? Filter the chart to assess the volume and appreciation (including resales) trends and regional comparisons, or scroll to the map below view this information at an individual property level.
Find a Recent Sale
Sales Detail
Population
Population growth drivers in Arundel are above average based on AreaSearch's ranking of recent, and medium to long-term trends
Arundel's population, as of November 2025, is approximately 11,940. This figure represents a growth of 769 people from the 2021 Census total of 11,171, marking an increase of 6.9%. The change was inferred from ABS's estimated resident population of 11,919 in June 2024 and additional 76 validated new addresses since the Census date. This results in a population density ratio of 1,225 persons per square kilometer, higher than the average seen across national locations assessed by AreaSearch. Arundel's growth rate exceeded that of its SA3 area (6.5%), positioning it as a growth leader in the region. Overseas migration contributed approximately 79.8% of overall population gains during recent periods, although all drivers including natural growth and interstate migration were positive factors.
AreaSearch adopts ABS/Geoscience Australia projections for each SA2 area, released in 2024 with 2022 as the base year. For areas not covered by this data and years post-2032, Queensland State Government's SA2 area projections are used, released in 2023 based on 2021 data. However, these state projections do not provide age category splits; hence proportional growth weightings aligned with ABS Greater Capital Region projections (released in 2023, based on 2022 data) for each age cohort are applied when utilized. Considering projected demographic shifts, Arundel is expected to increase by just below the median of regional areas across the nation. Based on the latest annual ERP population numbers, the area is projected to increase by 1,652 persons to reach a total of approximately 13,592 by 2041, reflecting an overall increase of 13.7% over the 17-year period.
Frequently Asked Questions - Population
Development
Residential development activity is lower than average in Arundel according to AreaSearch's national comparison of local real estate markets
Arundel has averaged approximately 15 new dwelling approvals each year over the past five financial years, totalling 78 homes. As of FY26, there has been 1 approval recorded so far. On average, 13 new residents have been associated with every home built annually between FY21 and FY25. This discrepancy between demand and supply typically leads to price growth and increased buyer competition.
The average construction value for new properties is $345,000. In the current financial year, there have been $34.5 million in commercial approvals, indicating high levels of local commercial activity. Compared to the rest of Queensland, Arundel has a significantly lower building activity rate, which is 65.0% below the regional average per person. This scarcity of new homes often strengthens demand and prices for existing properties. Nationally, this figure is also below average, suggesting the area's maturity and possible planning constraints. New development consists of 57.0% detached dwellings and 43.0% attached dwellings, marking a shift from the current housing pattern of 83.0% houses.
This change may indicate diminishing developable land availability and responds to evolving lifestyle preferences and housing affordability needs. With around 3588 people per dwelling approval, Arundel reflects a highly mature market. According to AreaSearch's latest quarterly estimate, Arundel is projected to add 1631 residents by 2041. If current construction levels persist, housing supply could lag population growth, potentially intensifying buyer competition and underpinning price growth.
Frequently Asked Questions - Development
Infrastructure
Arundel has very high levels of nearby infrastructure activity, ranking in the top 20% nationally
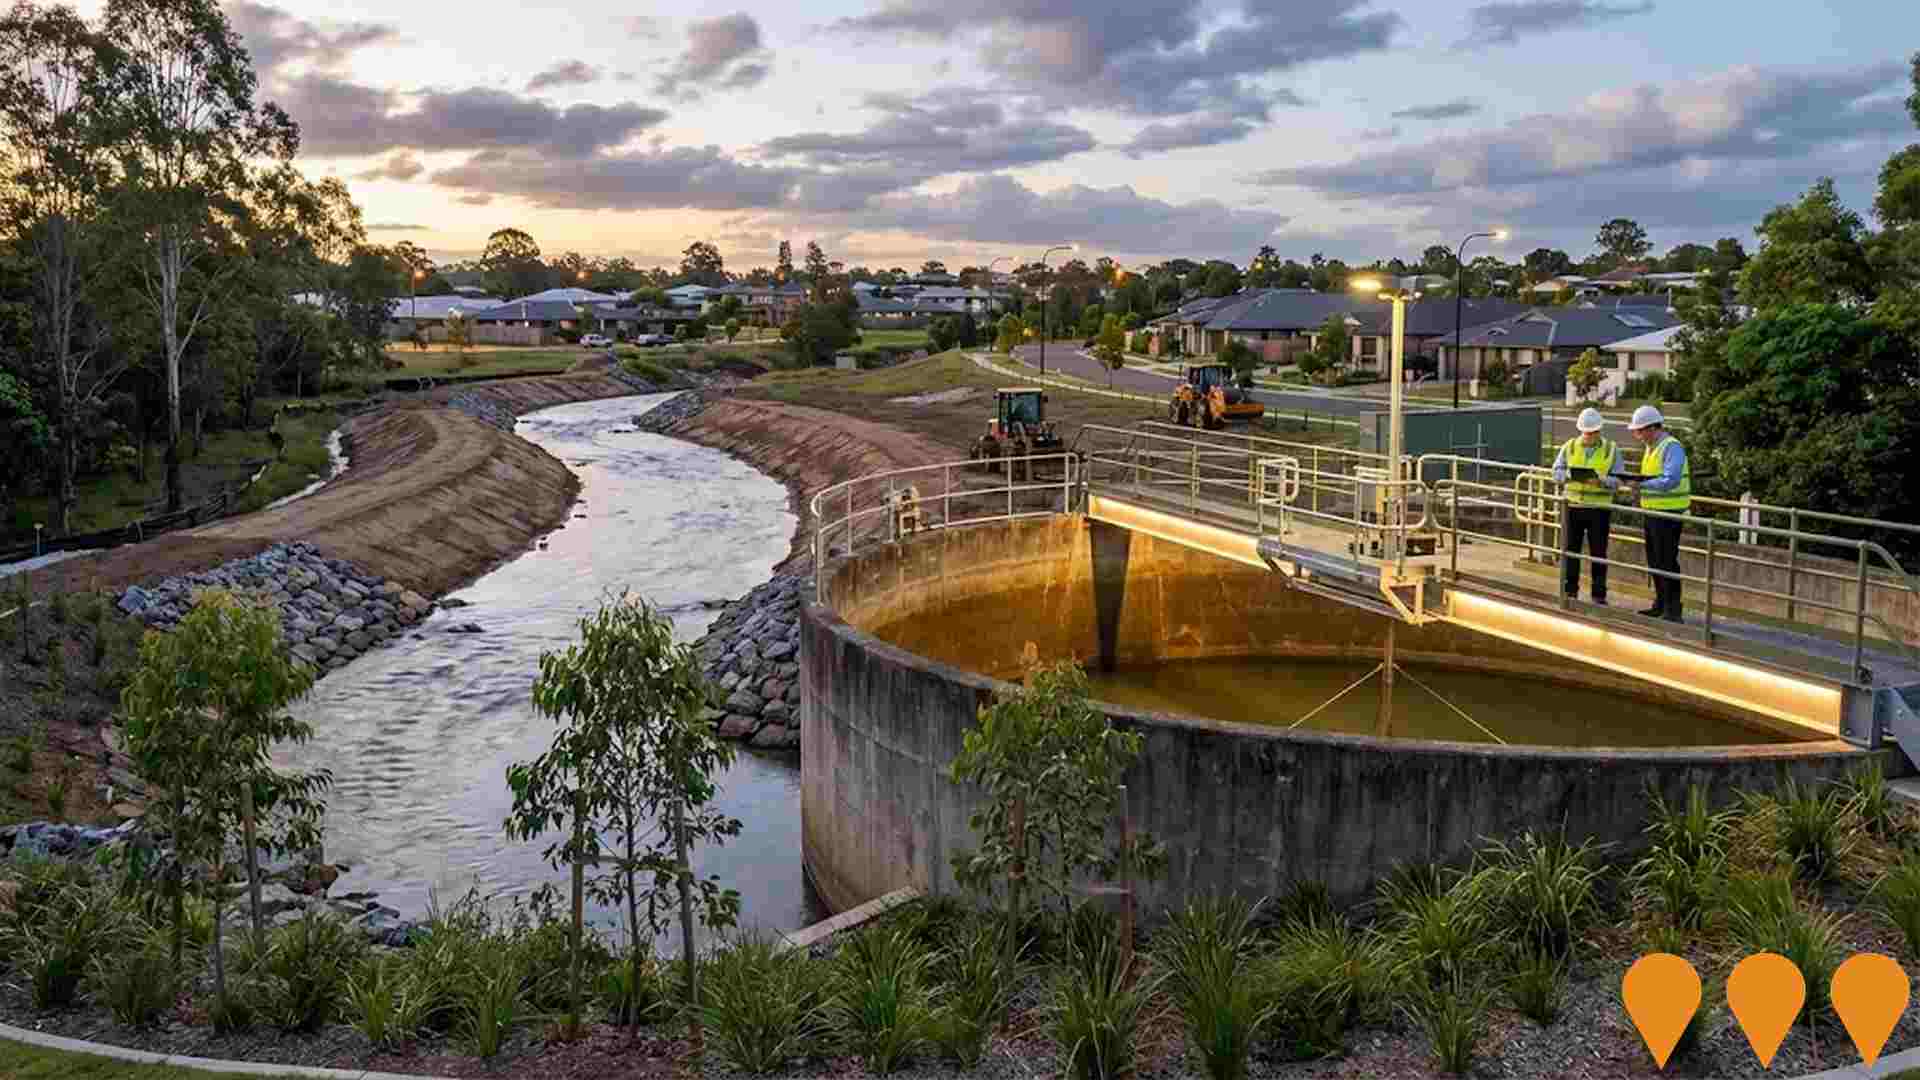
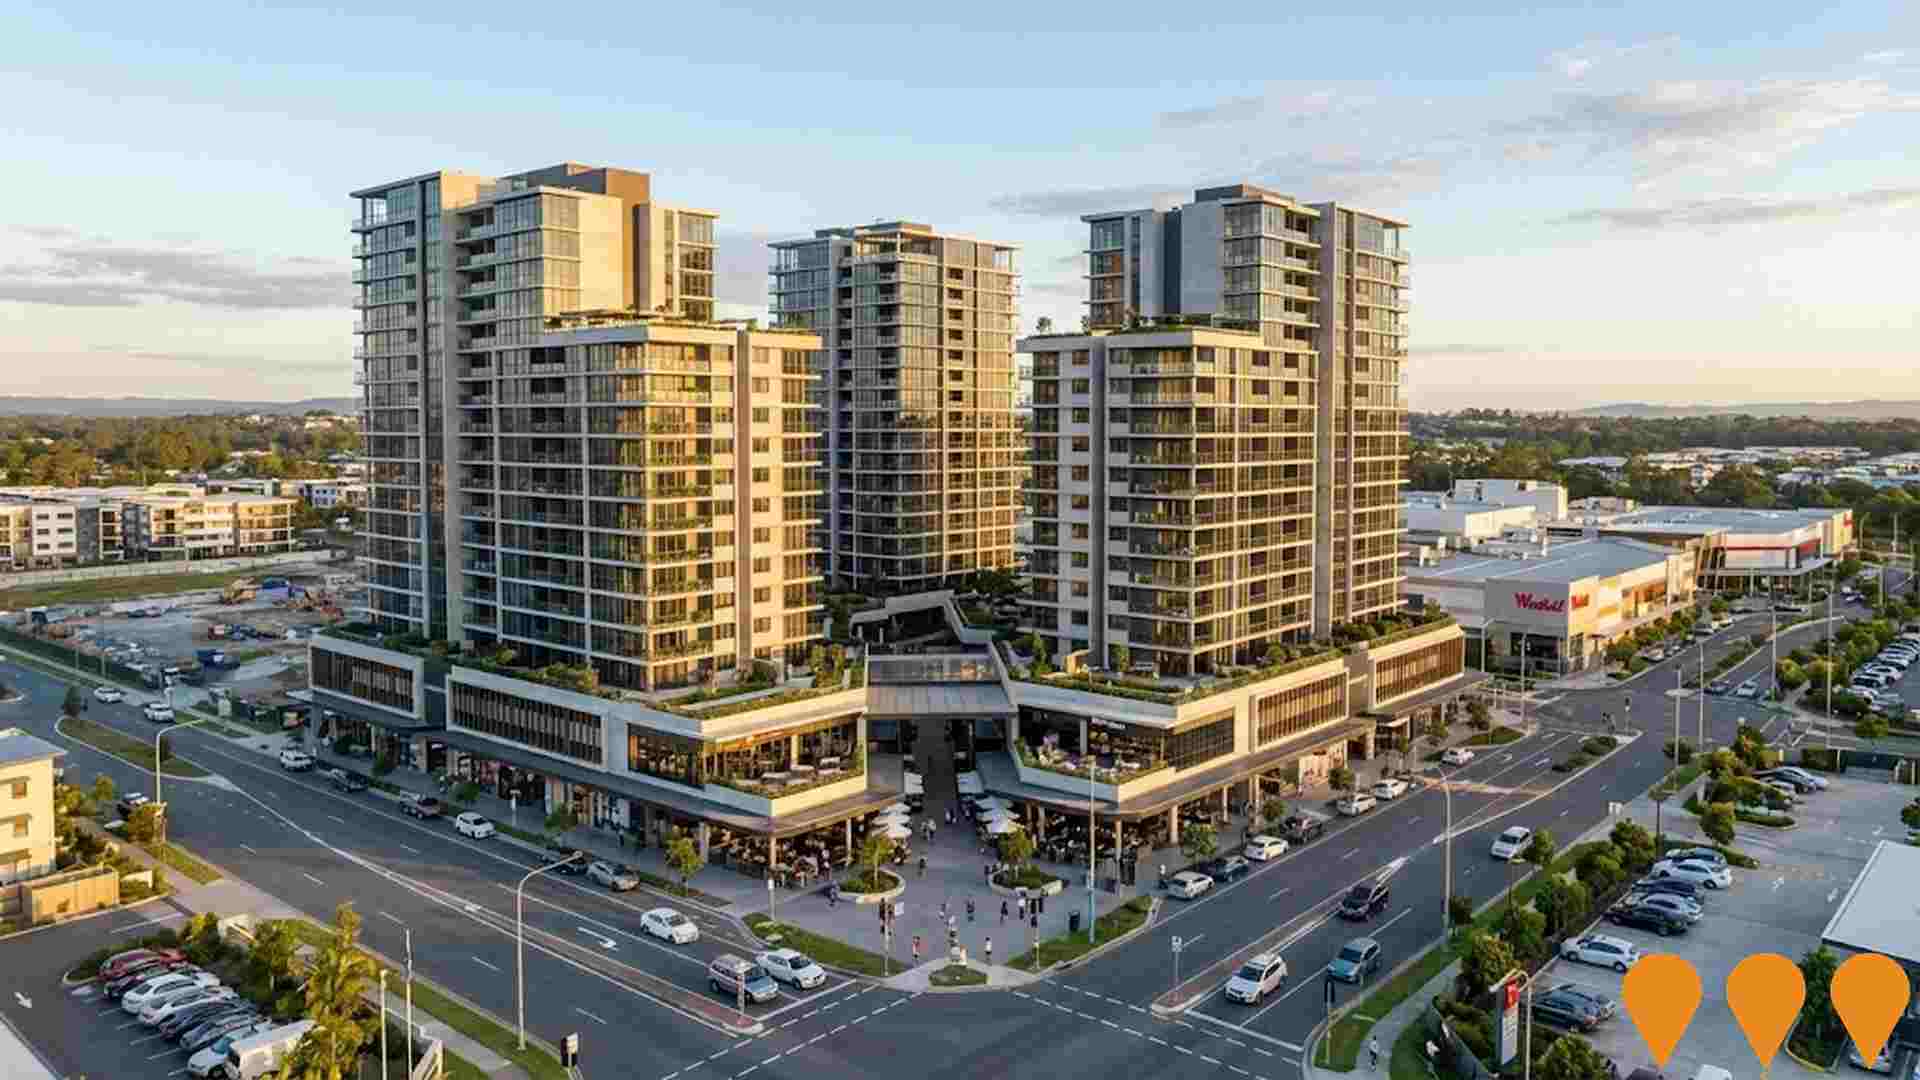
Changes to local infrastructure significantly impact an area's performance. AreaSearch has identified 39 projects likely affecting the region. Notable initiatives include Arundel Hills Residential Development, Smith Street Motorway Connection, Molendinar Creek Flood Mitigation, and Arundel Springs by AVID. The following list details those most relevant.
Professional plan users can use the search below to filter and access additional projects.
INFRASTRUCTURE SEARCH
 Denotes AI-based impression for illustrative purposes only, not to be taken as definitive under any circumstances. Please follow links and conduct other investigations from the project's source for actual imagery. Developers and project owners wishing us to use original imagery please Contact Us and we will do so.
Frequently Asked Questions - Infrastructure
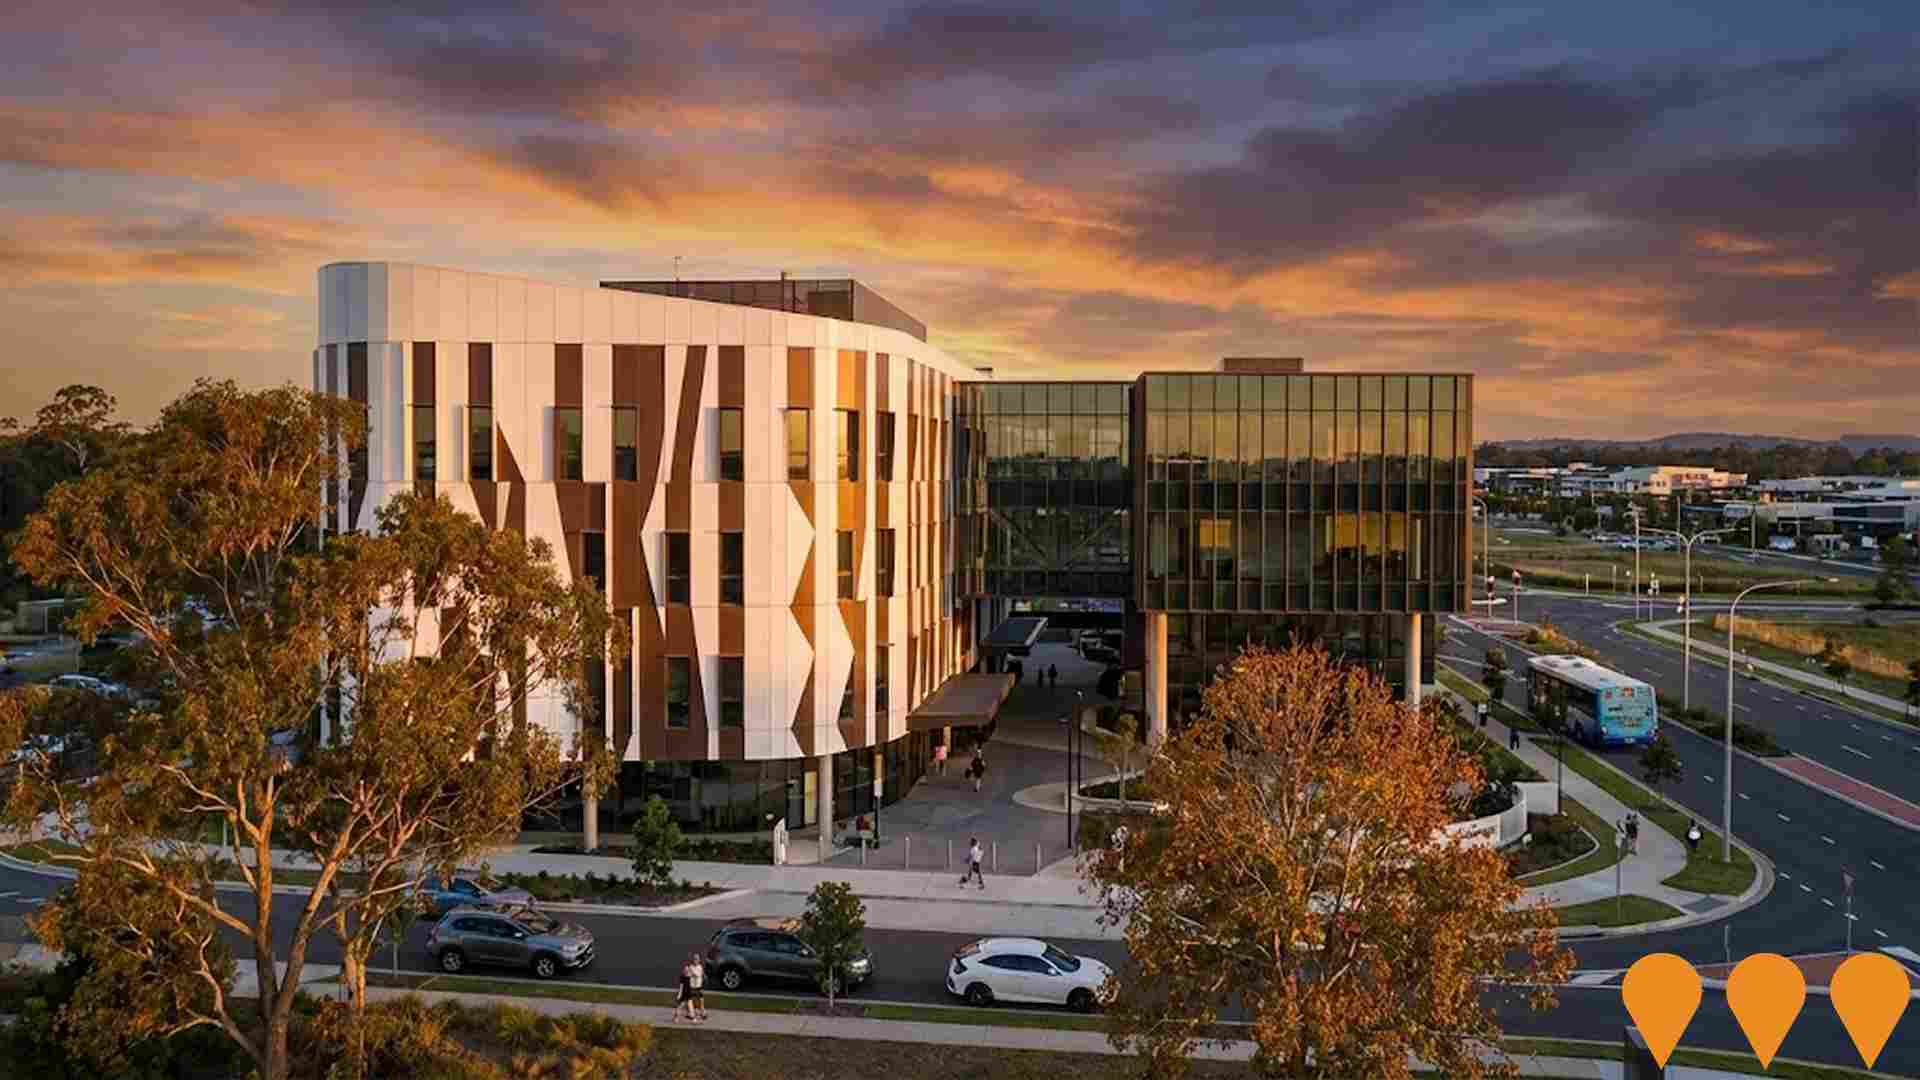
Gold Coast Health and Knowledge Precinct - Lumina Development
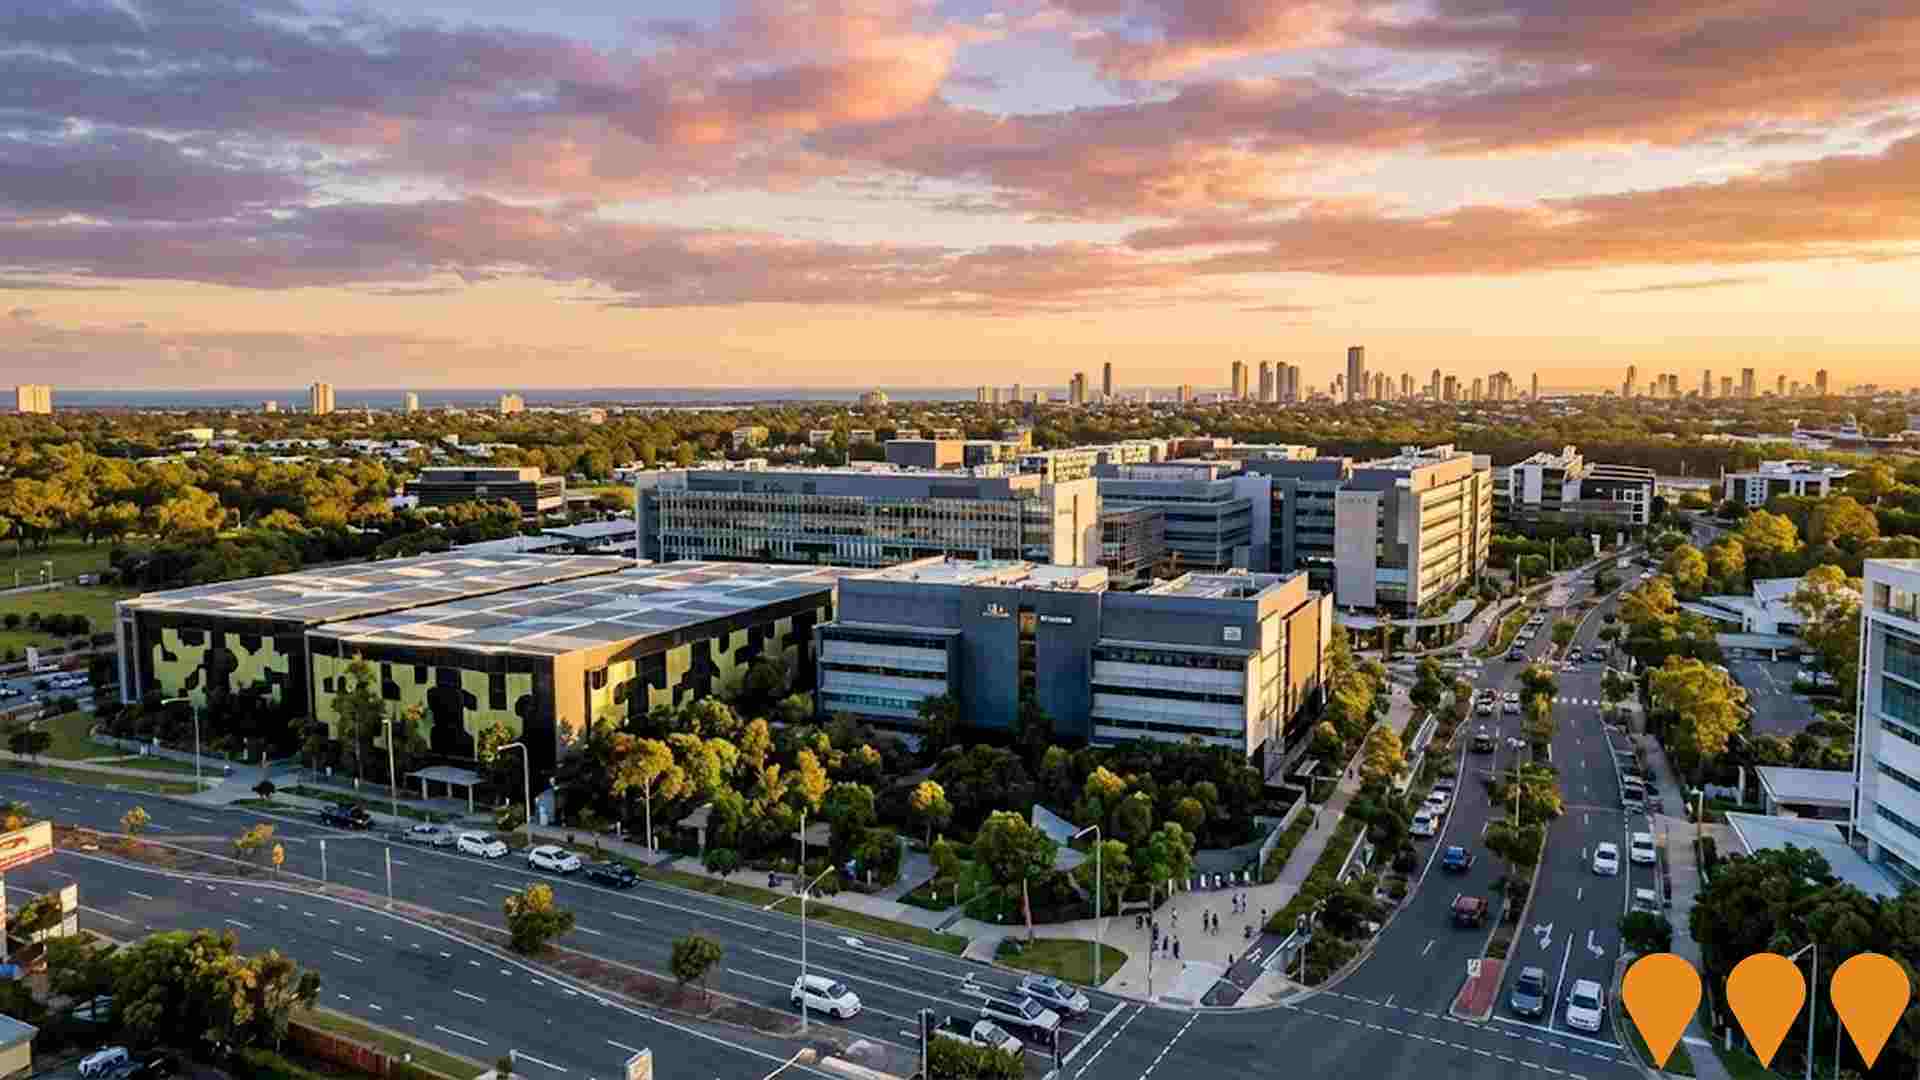
Lumina is a 9.5-hectare commercial cluster within the Gold Coast Health and Knowledge Precinct, dedicated to life sciences, health, and technology. It features major developments like the RDX Life Sciences Centre and Proxima, fostering collaboration between researchers, clinicians, and entrepreneurs.
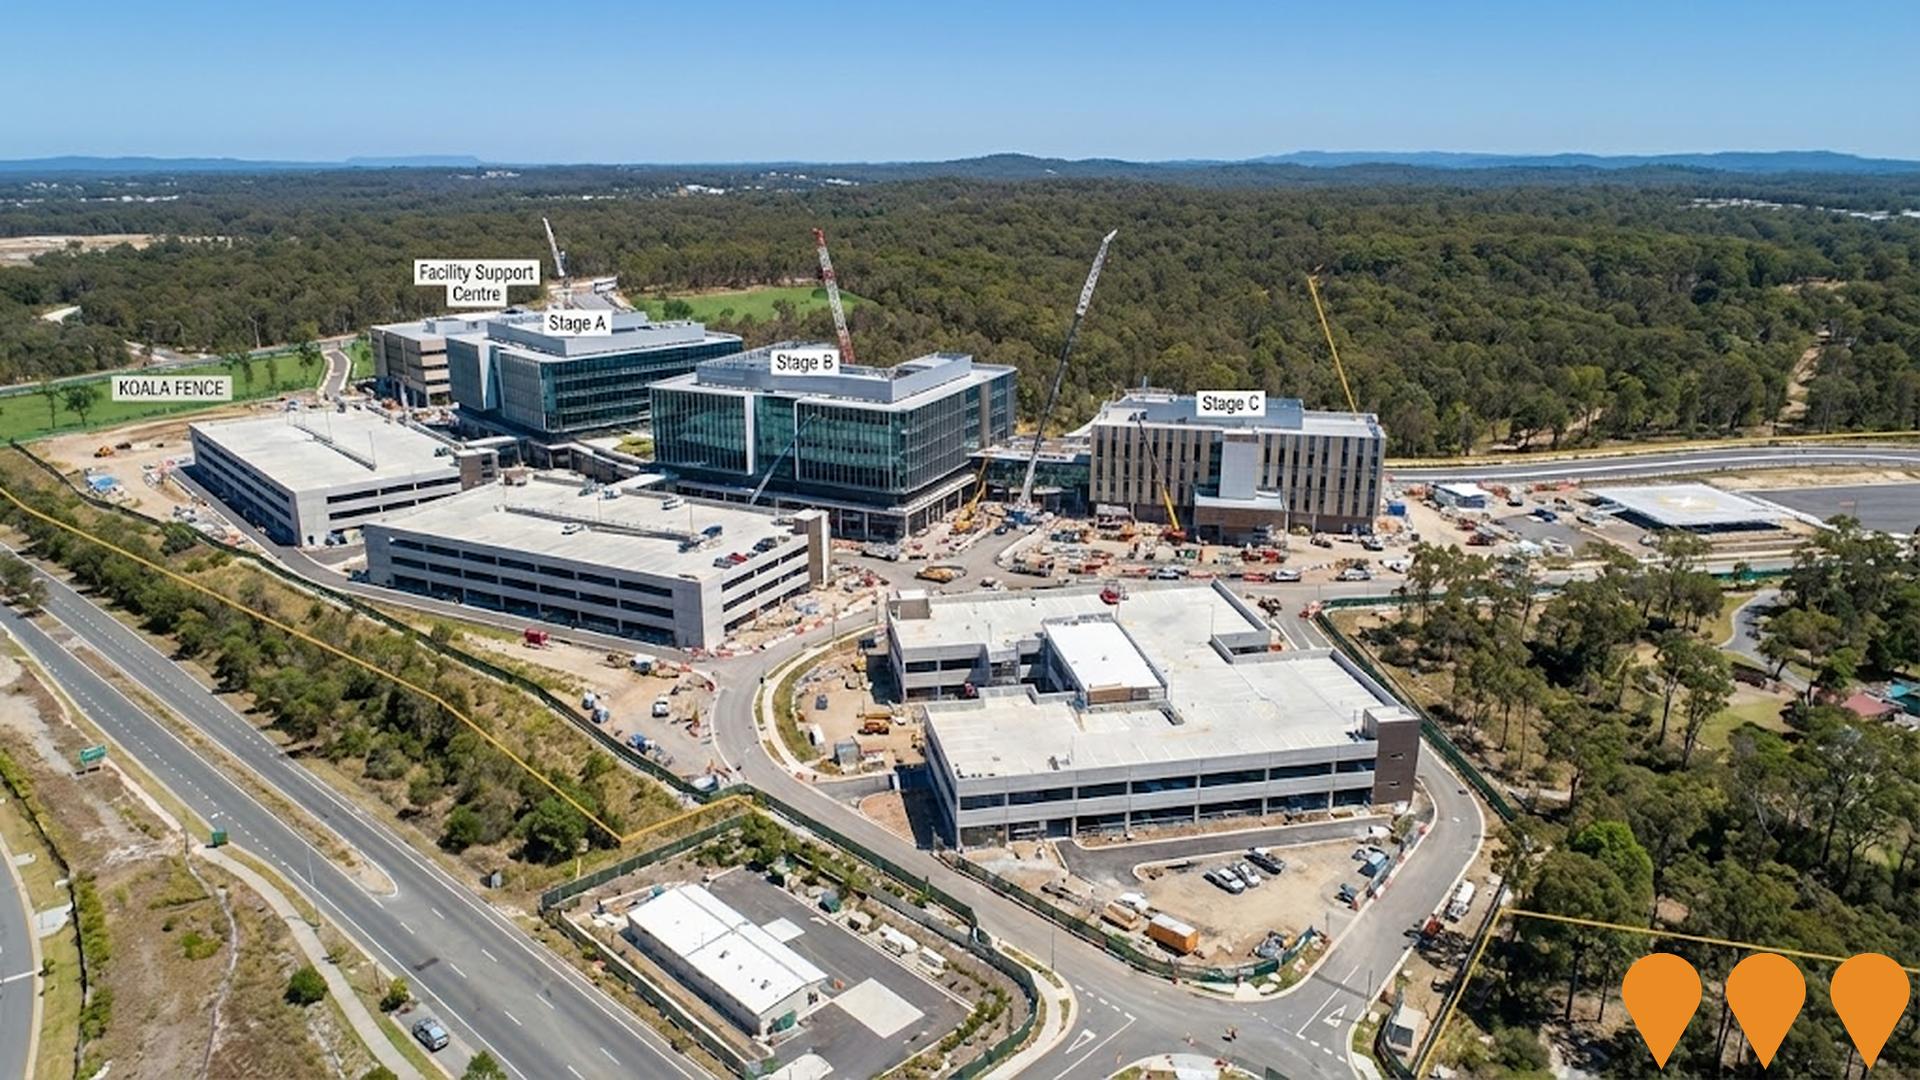
New Coomera Hospital
State-of-the-art public hospital now planned to feature about 600 overnight beds, an increase from the original 404, to serve the growing northern Gold Coast population. Features will include an emergency department, operating theatres, birthing suites, intensive care, coronary care, and mental health services. The project is part of the Queensland Government's Health Big Build program and is currently in the construction phase with early works continuing and major structural milestones achieved.
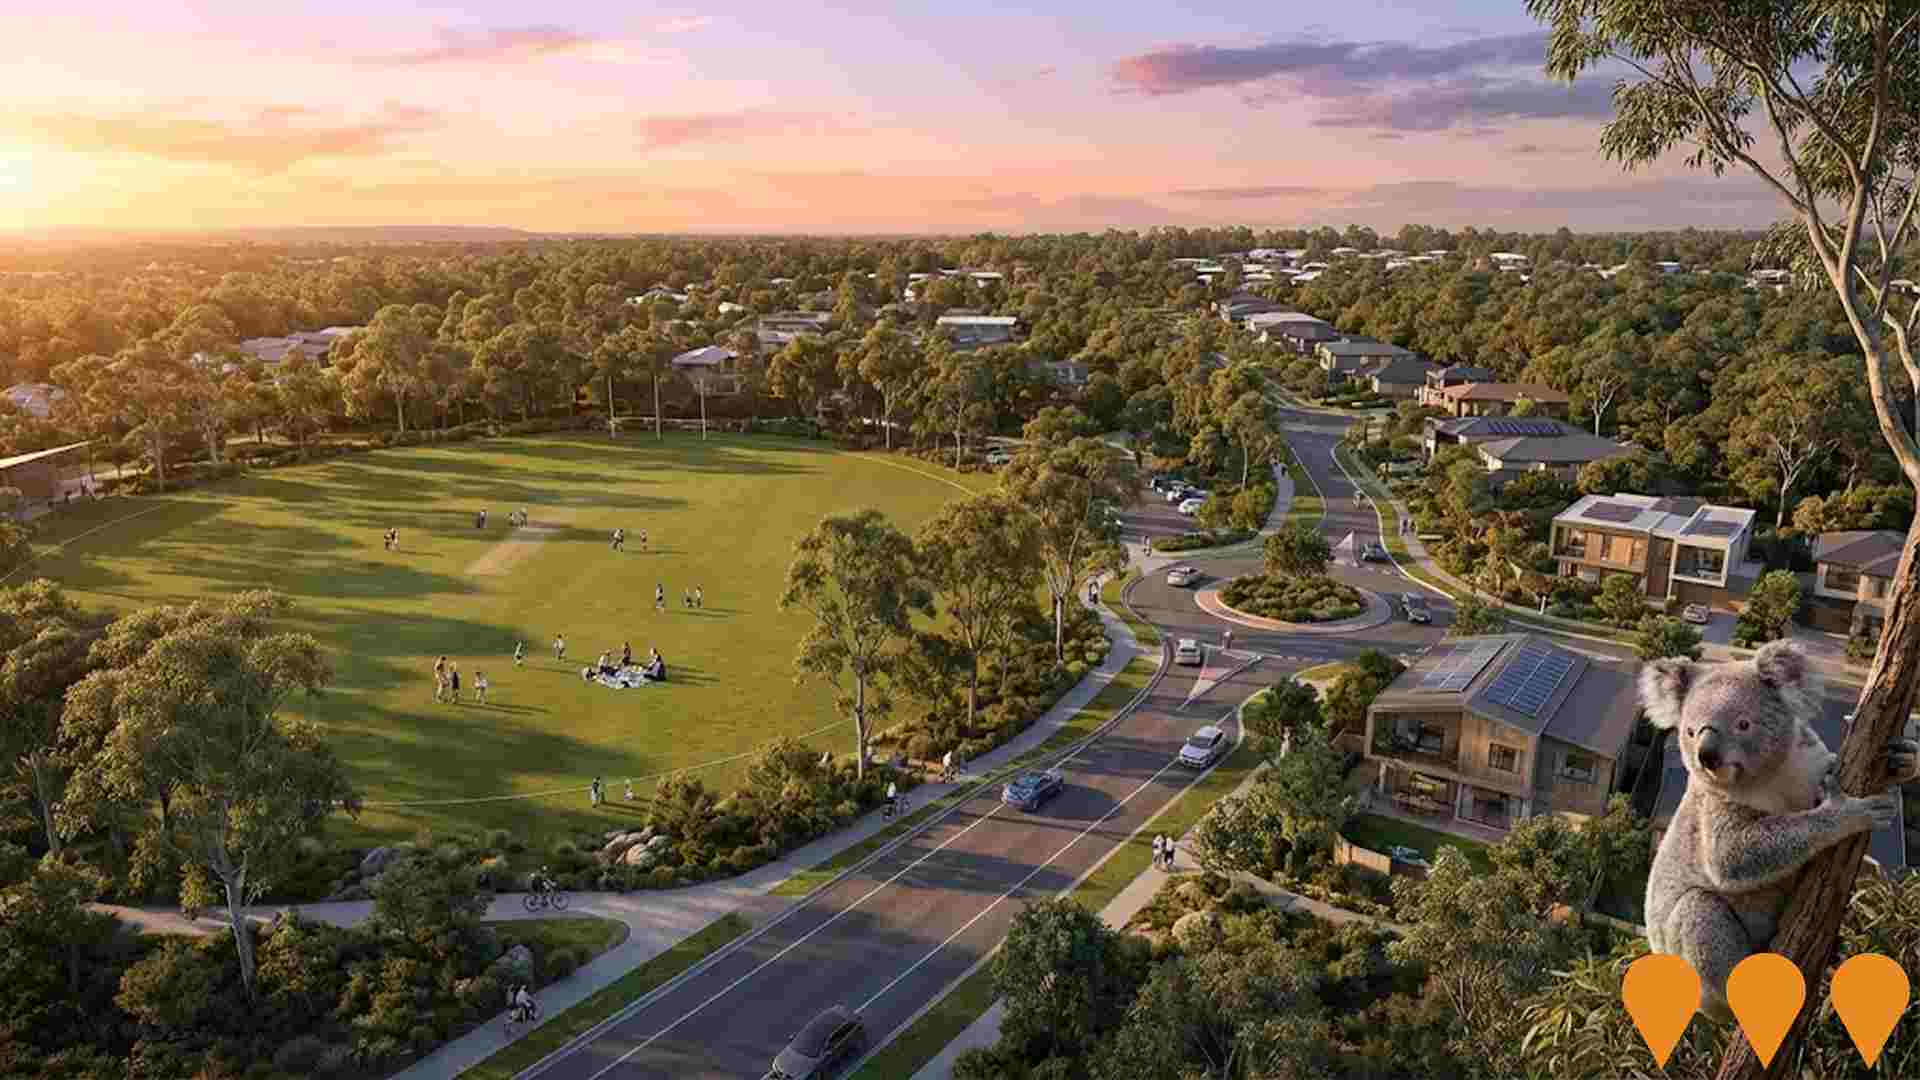
Arundel Hills Residential Development
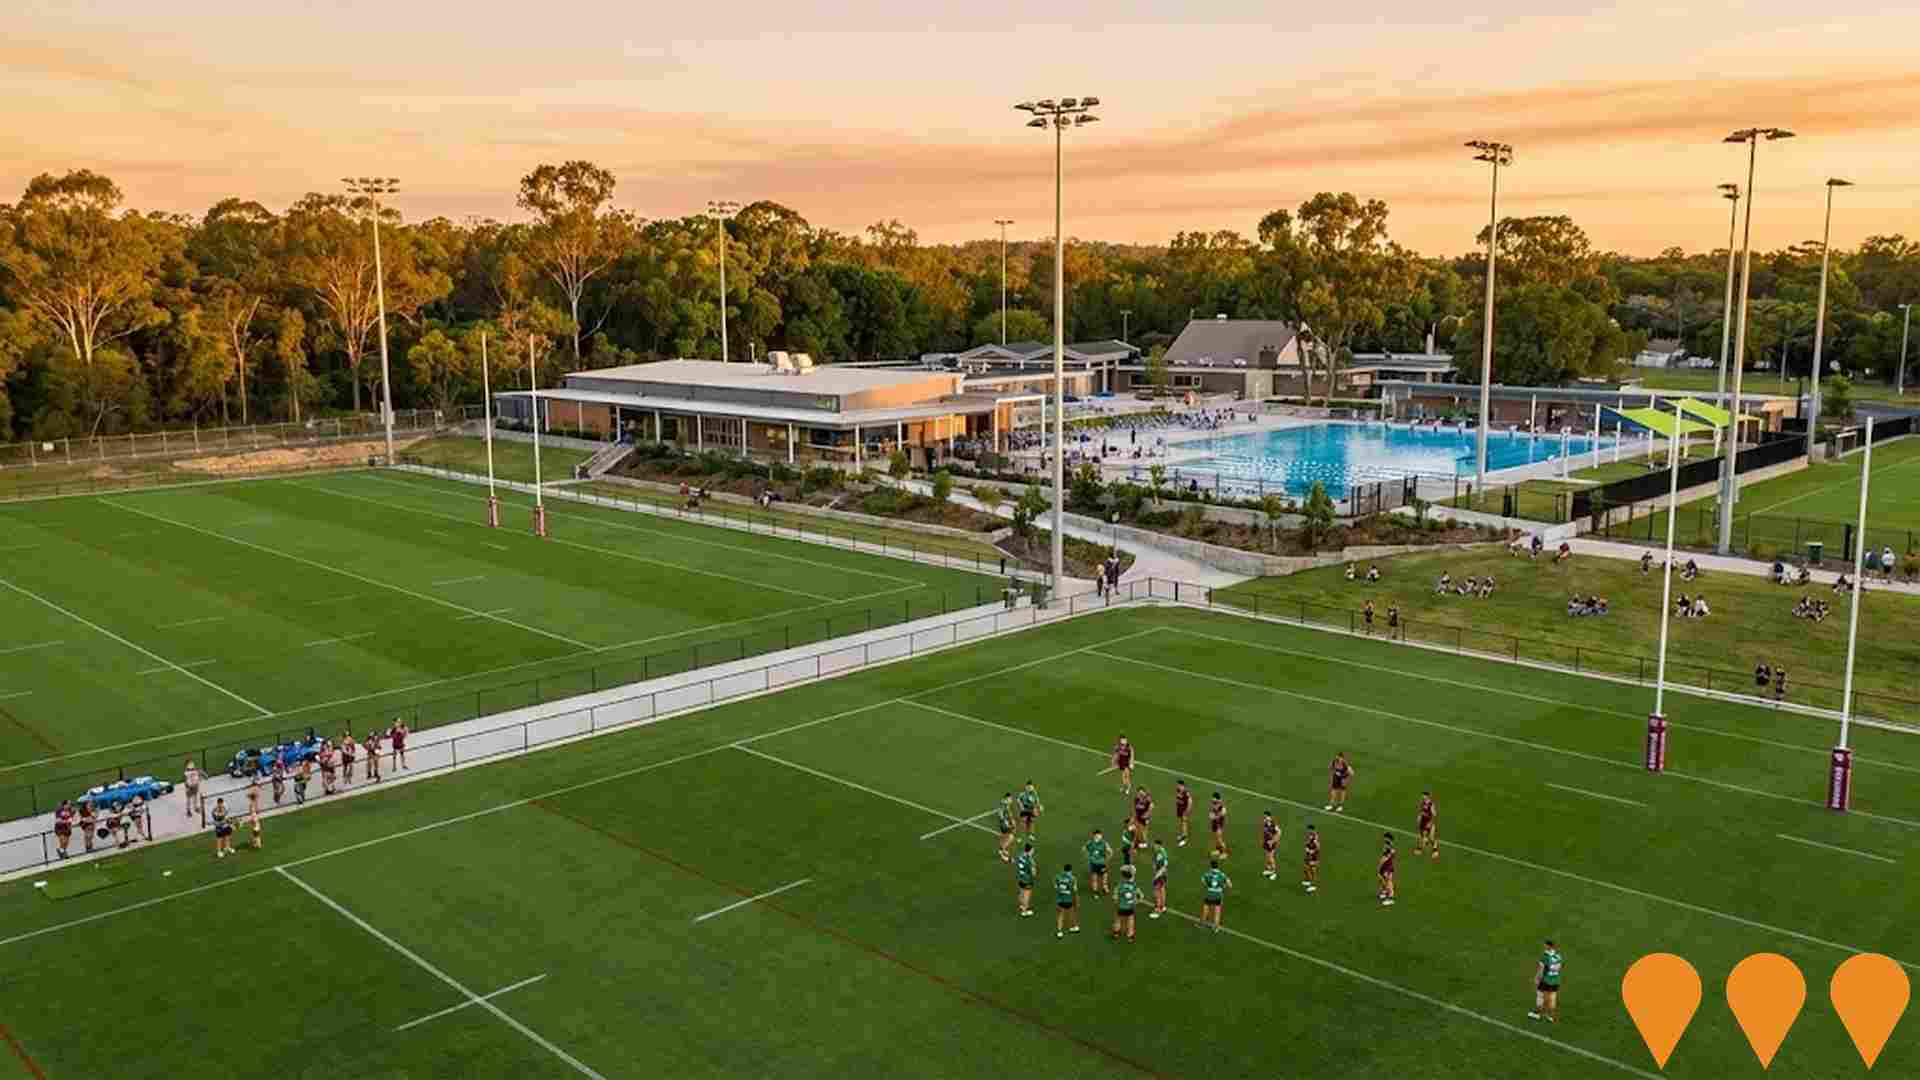
Approved redevelopment of the 67-hectare former Arundel Hills Country Club into an environmentally focused residential community. The Queensland Government-approved project will deliver a minimum of 650 homes (including 20% affordable housing) for approximately 1200 residents, with over 60% of the site dedicated to recreation, open space, conservation, wetlands and koala habitat. Features include low-rise and medium-density dwellings, a destination recreation park, sporting facilities for AB Paterson College, and comprehensive environmental protections.
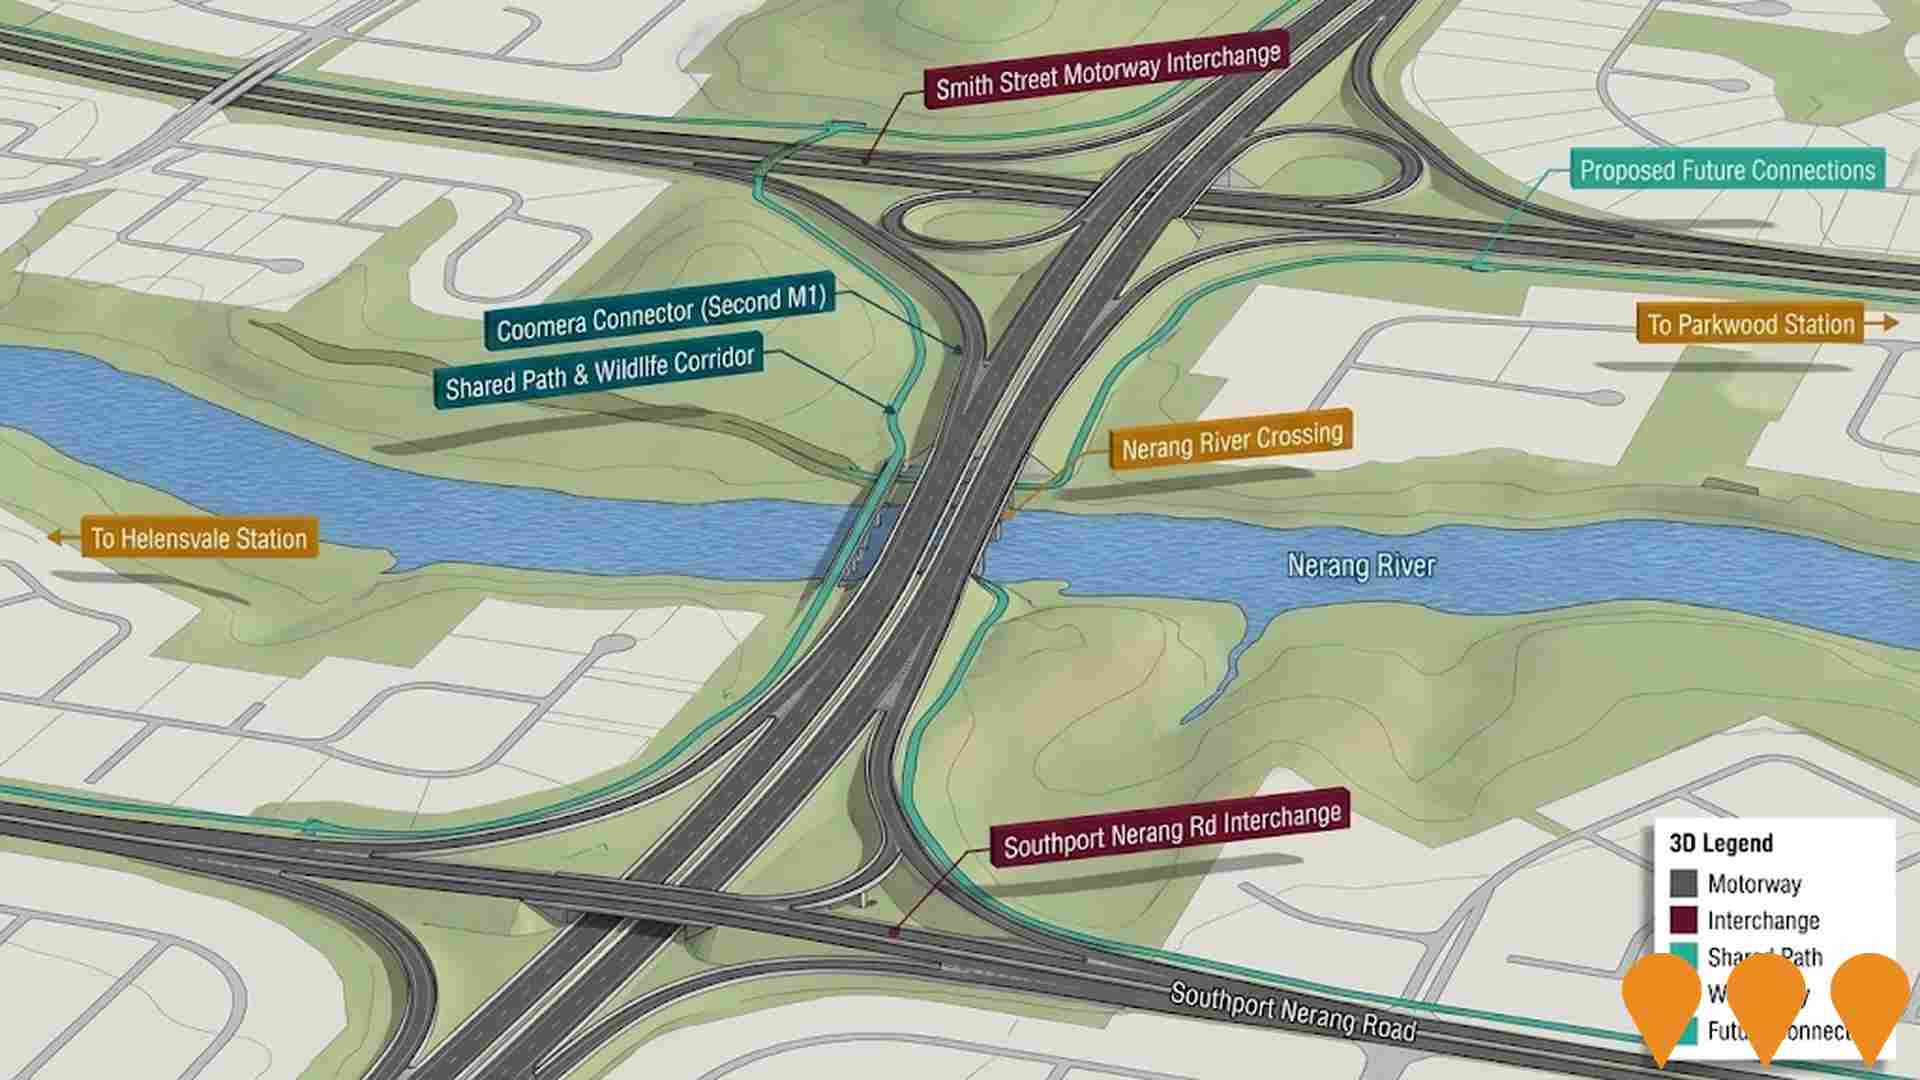
Coomera Connector Stage 1 - Central Section
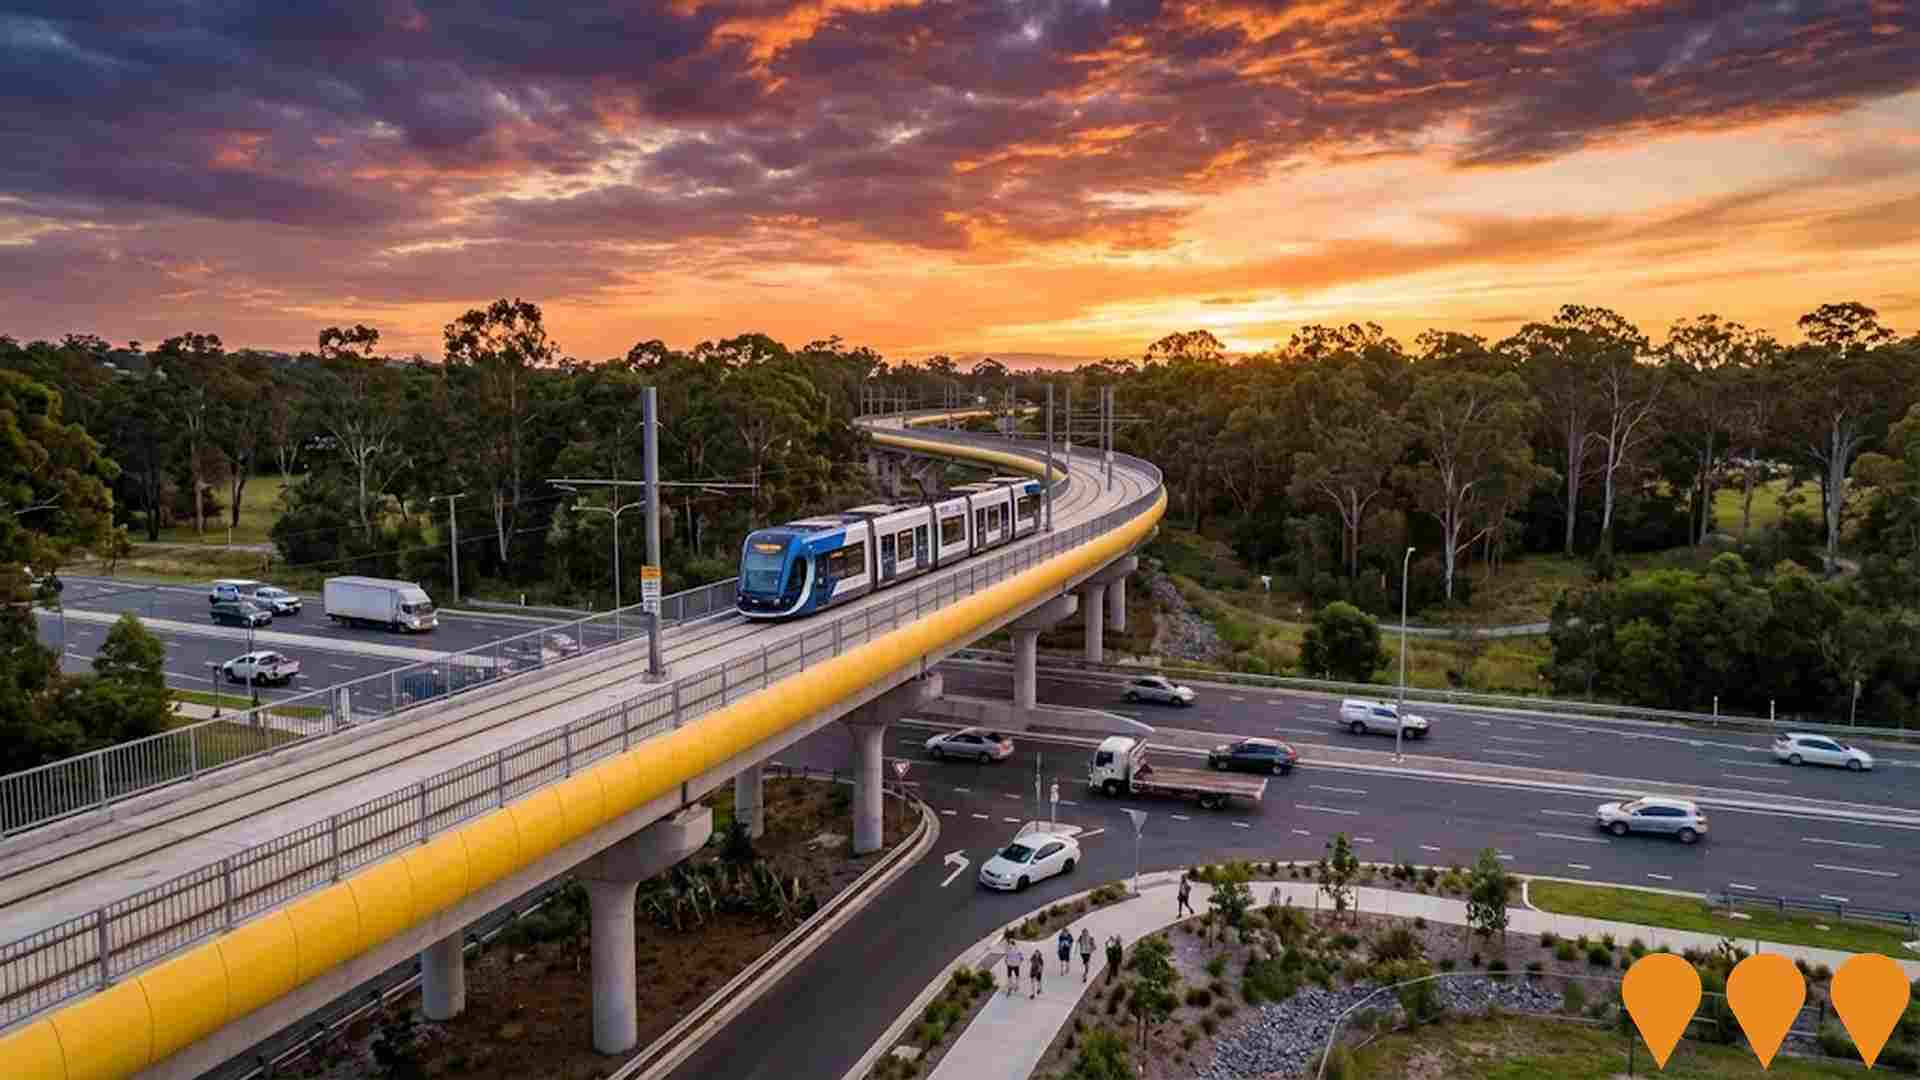
Construction of 8km section of the Coomera Connector (Second M1) between Helensvale Road and Smith Street Motorway in Parkwood. Features grade separated interchanges, more than 8km of shared bike and pedestrian paths connecting to Helensvale and Parkwood light rail stations, and wildlife corridors.
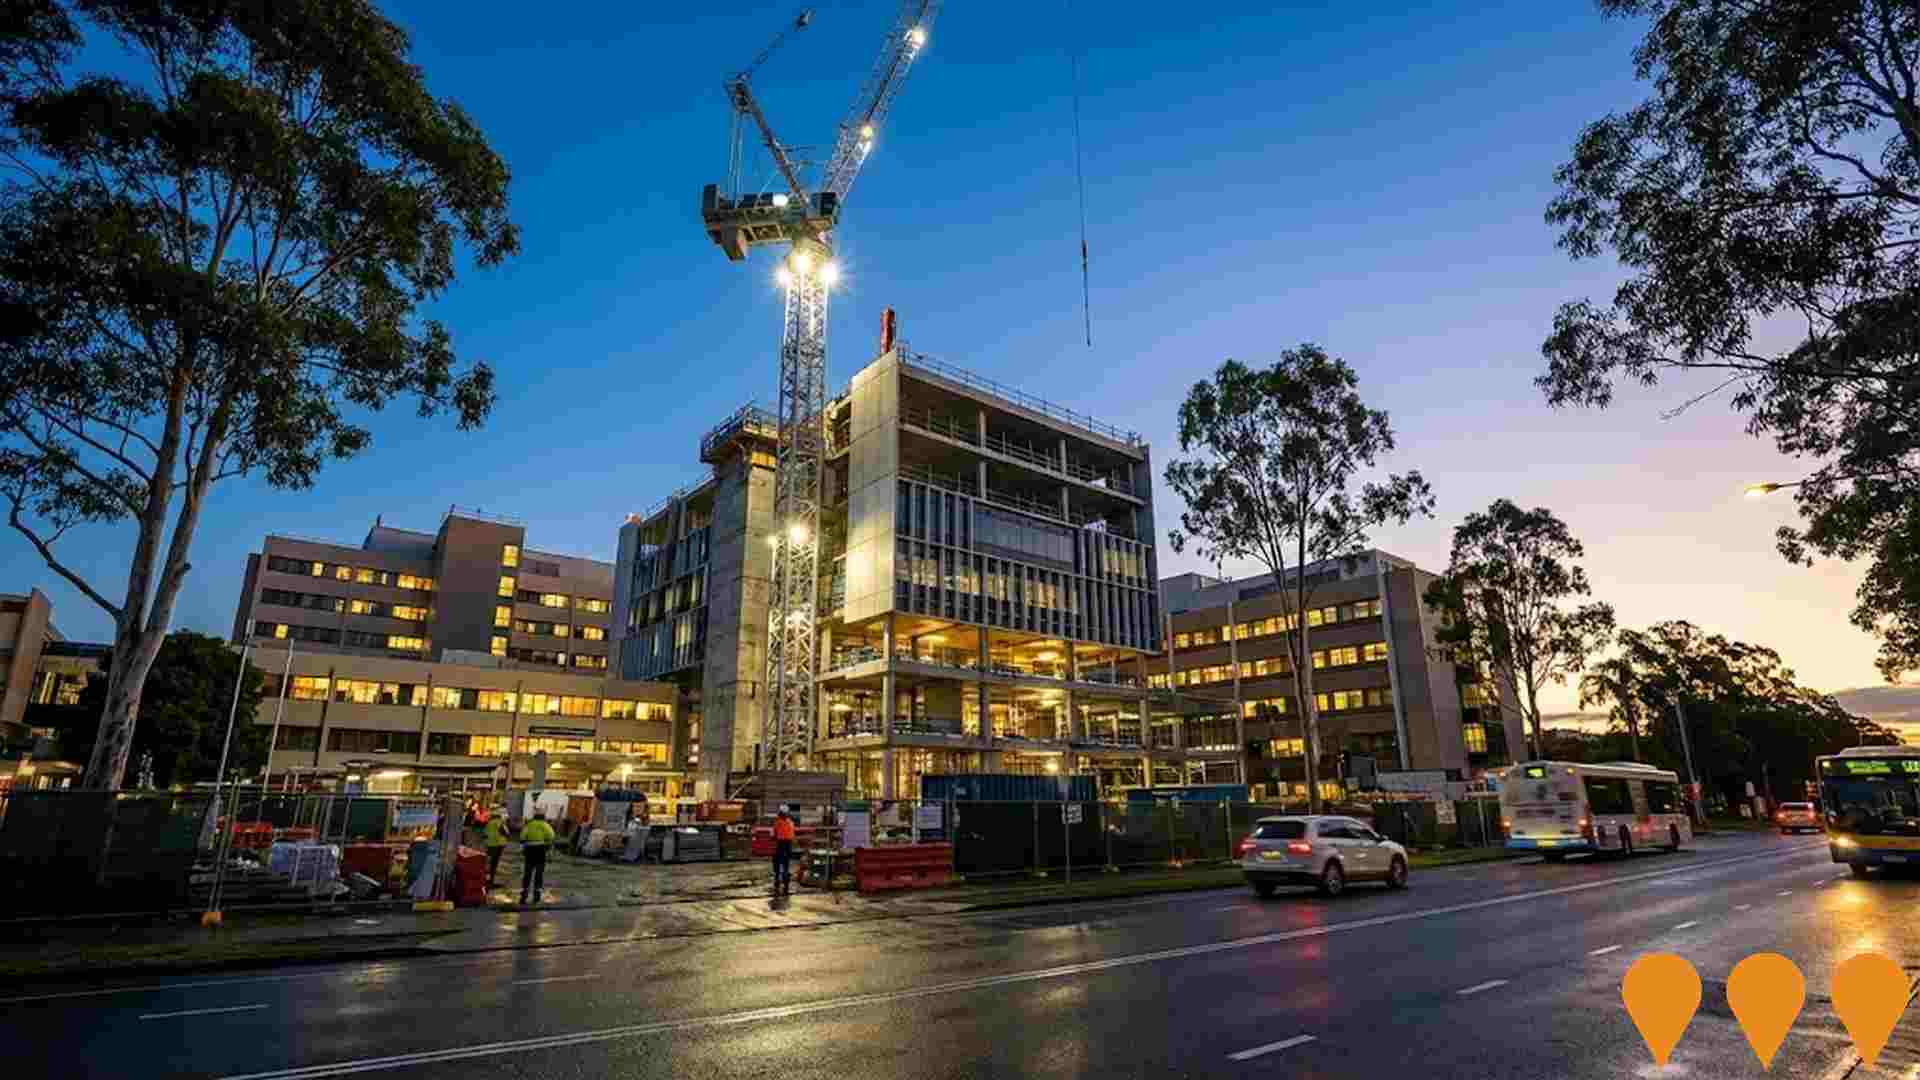
Gold Coast University Hospital Expansion
Expansion of Gold Coast University Hospital including additional beds, emergency department upgrade, new surgical suites and expanded specialist services.
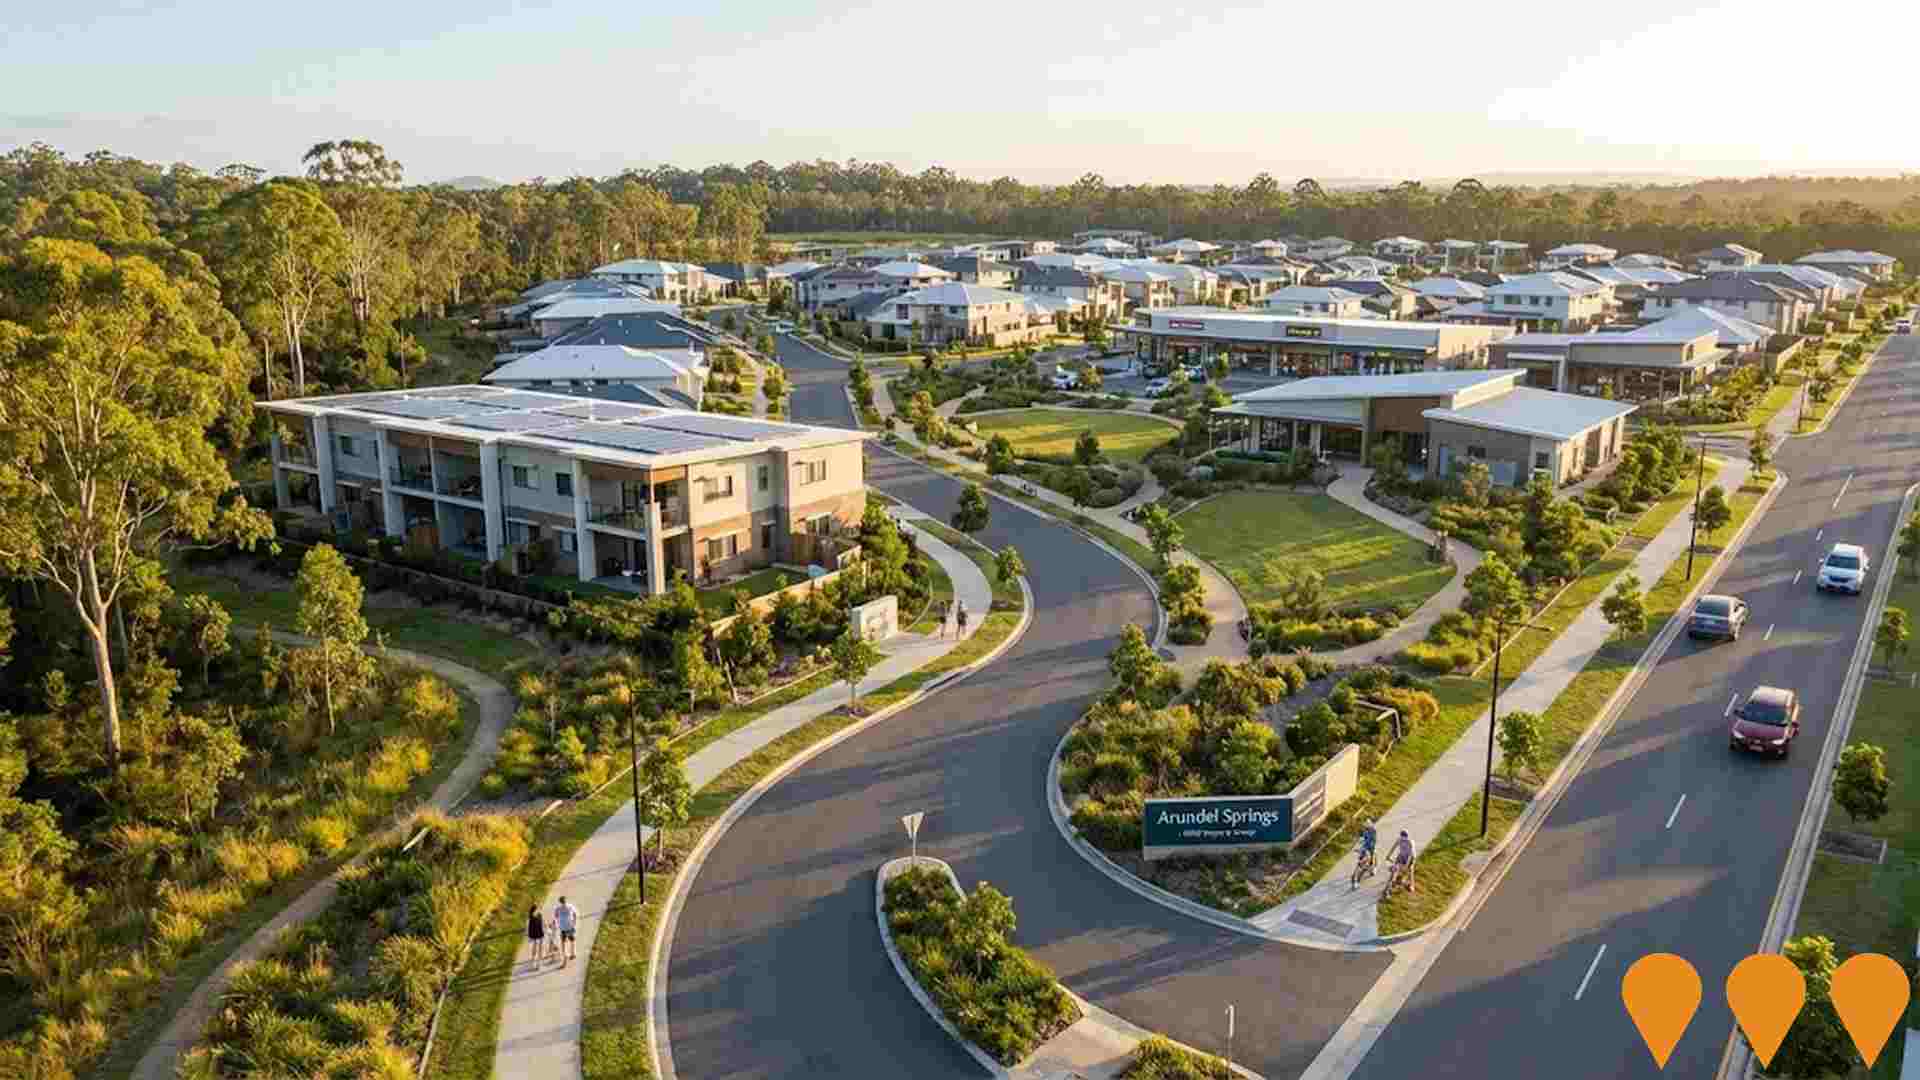
Arundel Springs by AVID
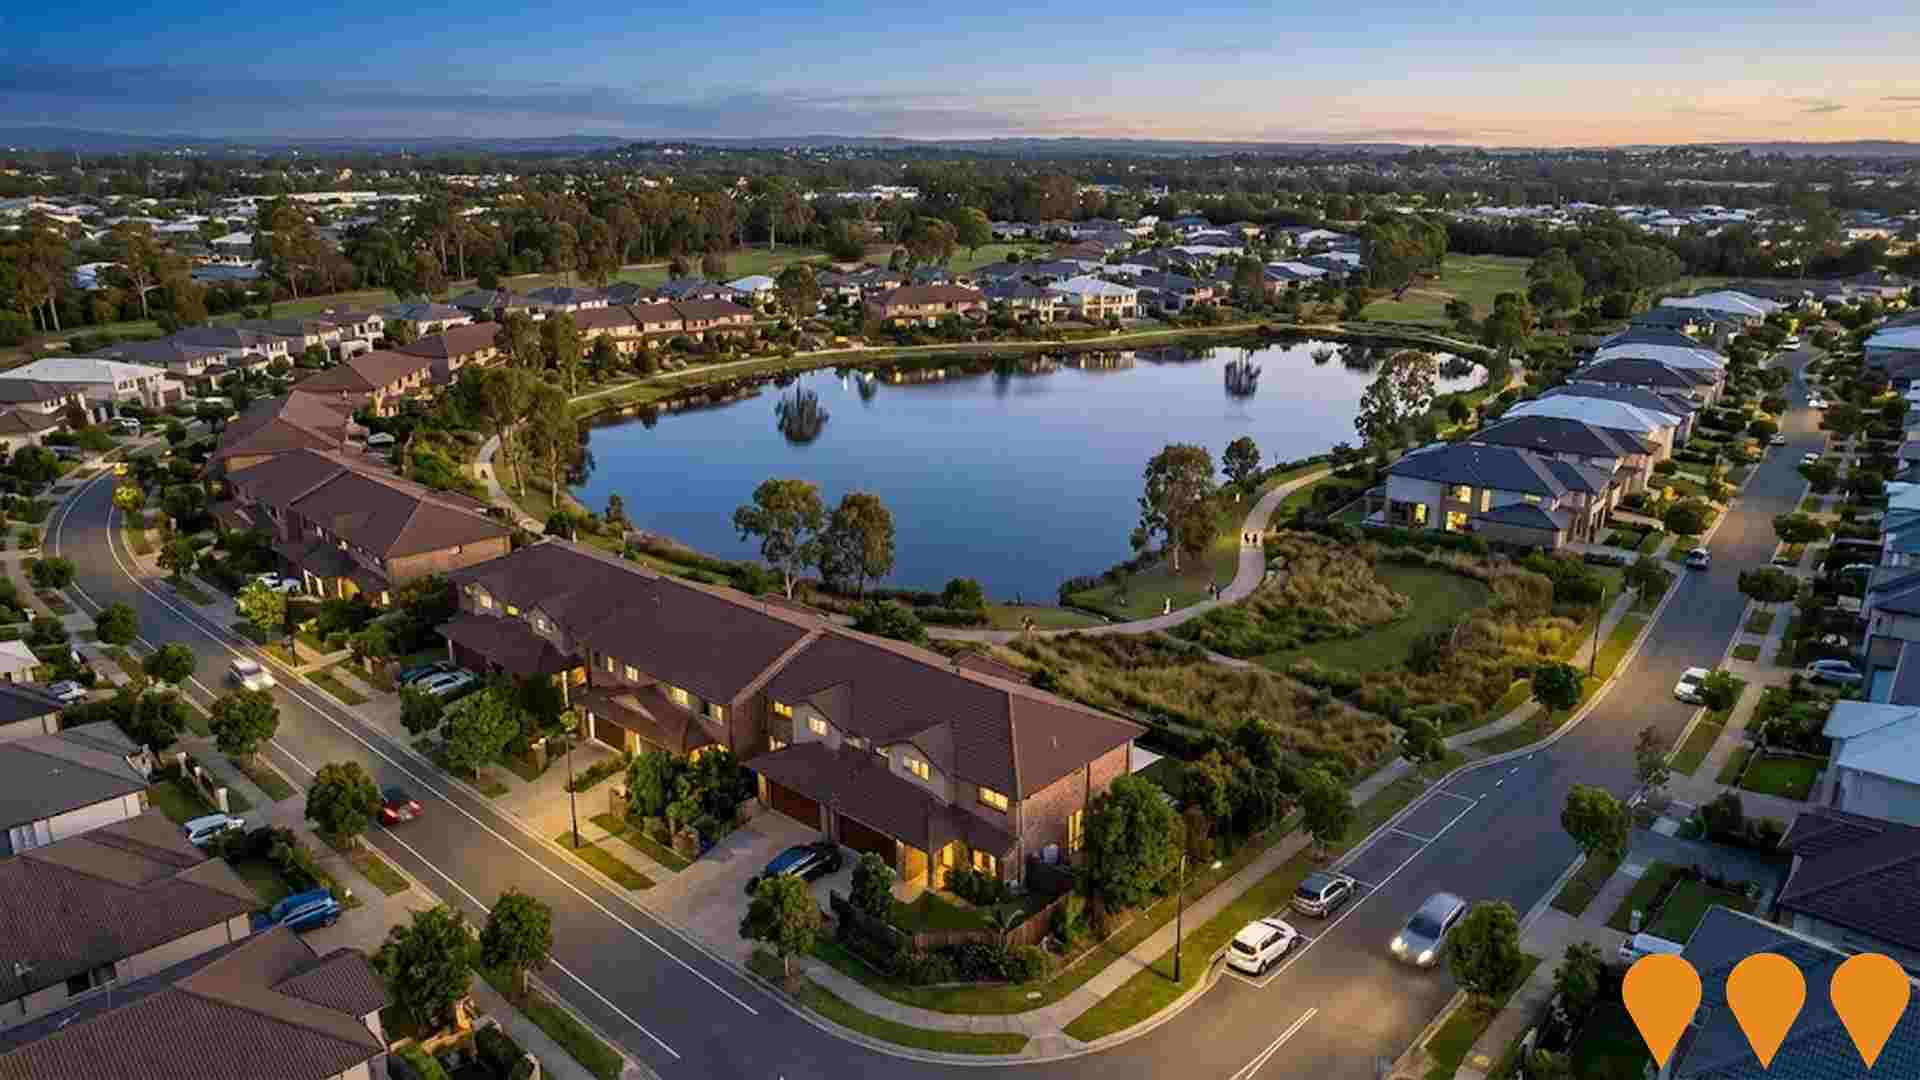
A proposed residential development featuring approximately 970 new homes with diverse housing types including detached houses, townhouses, and low-rise apartments. The project includes new roads, a local shopping centre, community facilities, open space networks, and conservation areas.
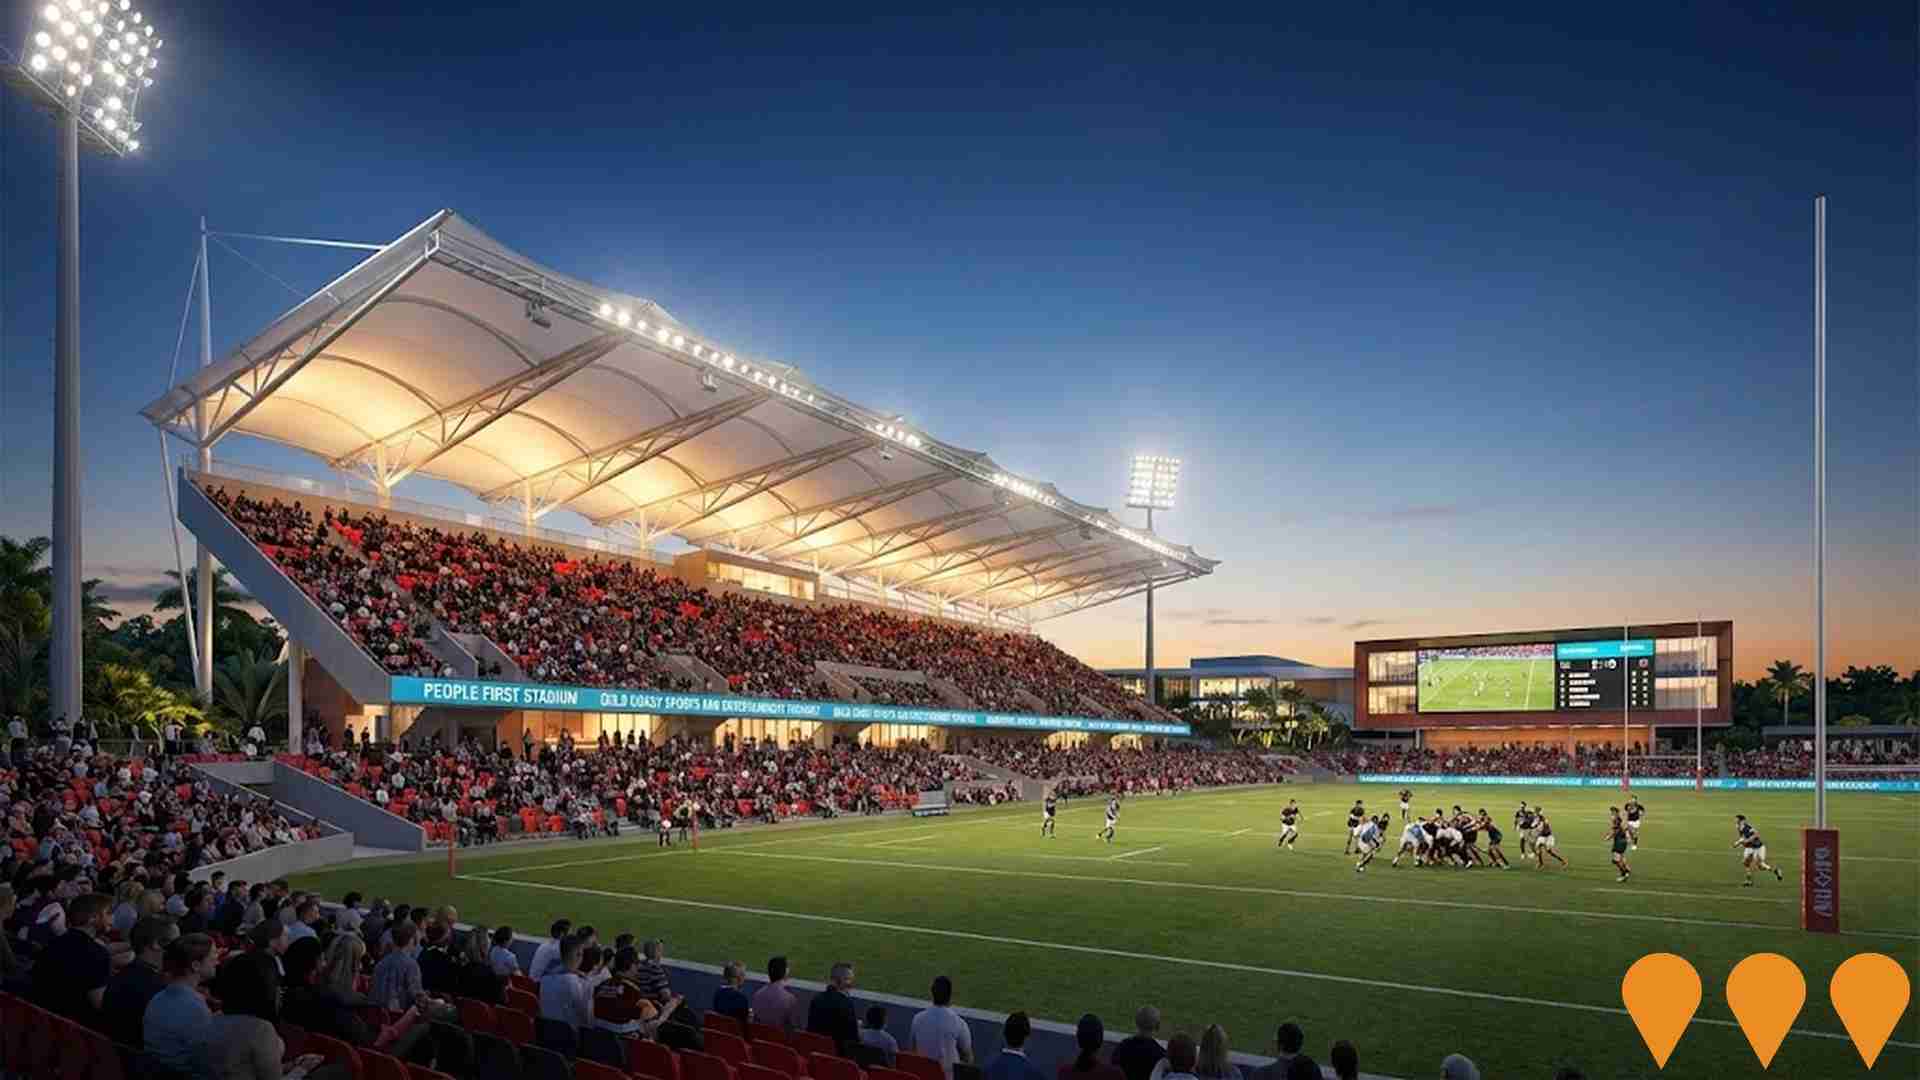
Gold Coast Sports and Entertainment Precinct
A major sports and entertainment complex featuring upgraded sporting facilities, entertainment venues, retail spaces, and recreational amenities designed to host major events and serve the Gold Coast community.
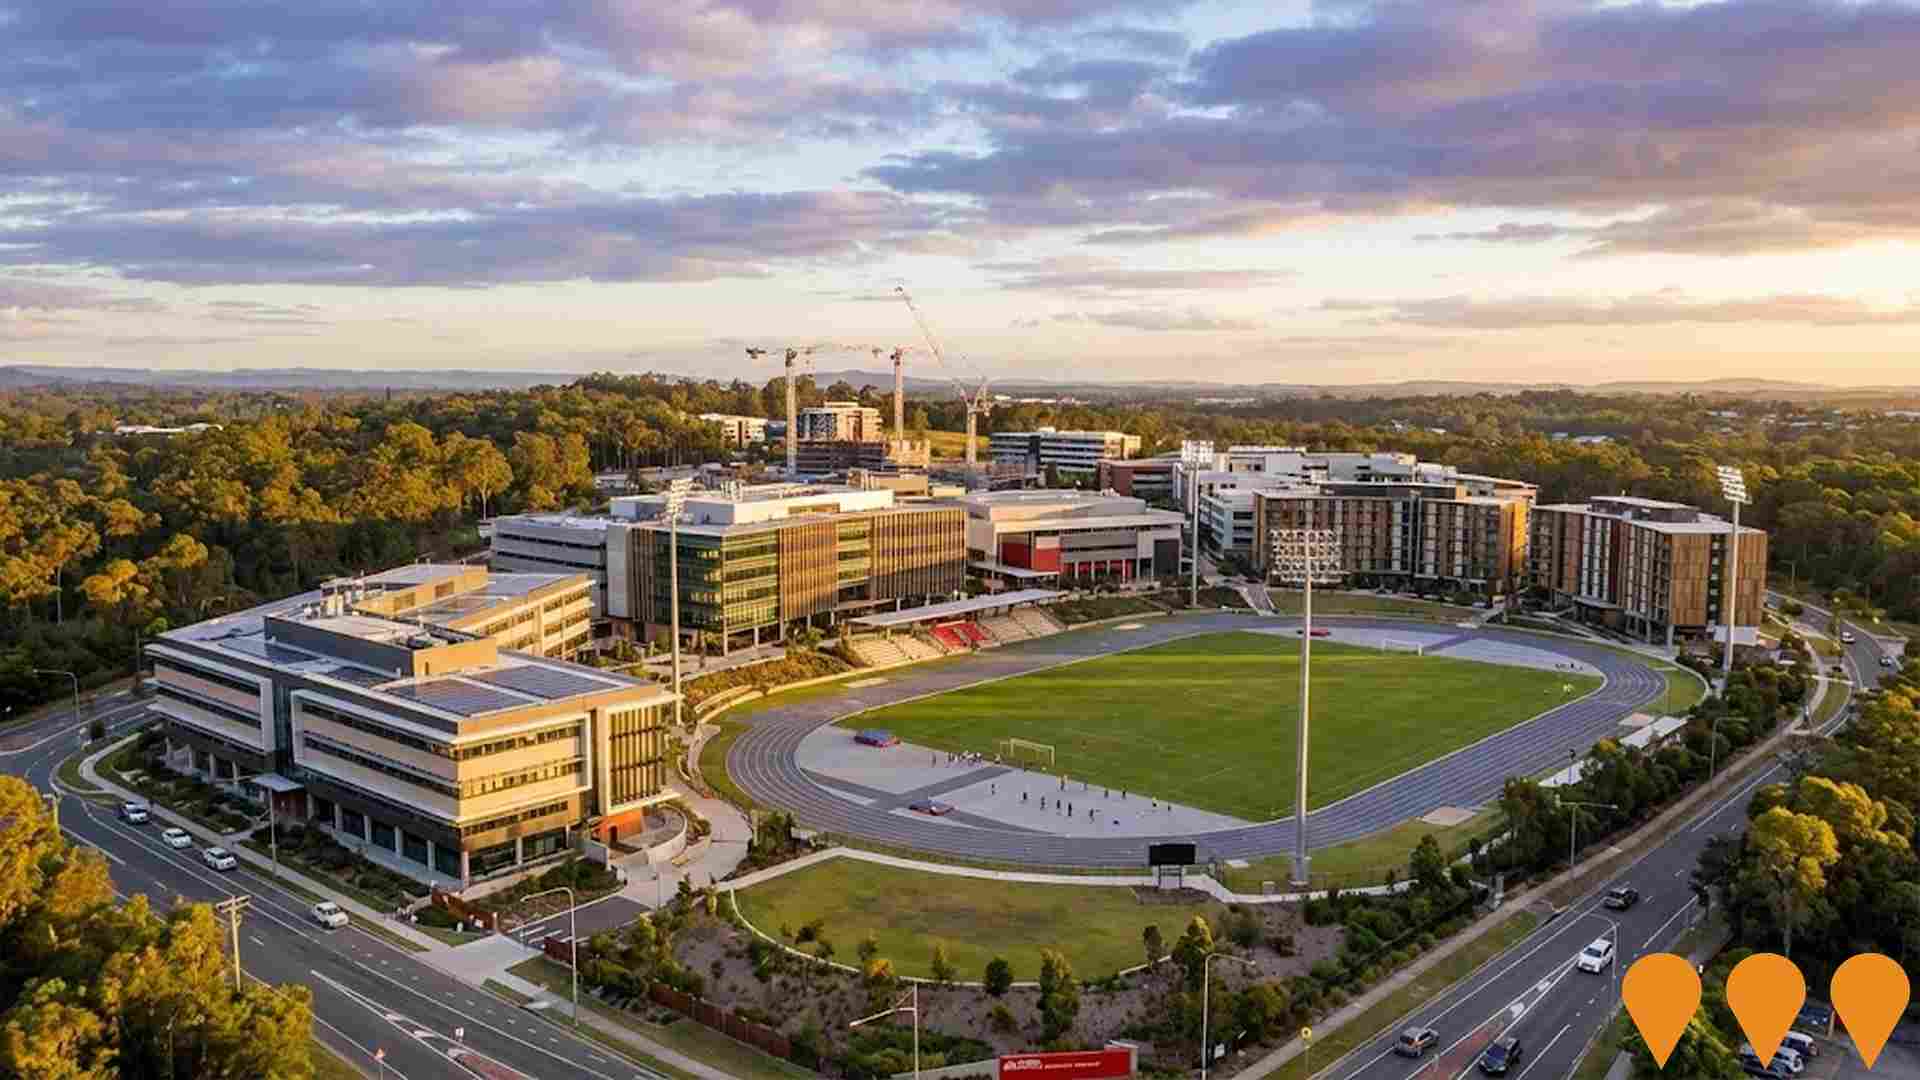
Griffith University Gold Coast Campus Expansion
New academic buildings, student accommodation, research facilities and sports complex at Griffith University Gold Coast campus.
Employment
Employment performance in Arundel has been broadly consistent with national averages
Arundel has a well-educated workforce with essential services sectors well represented. The unemployment rate was 3.8% as of the past year, with an estimated employment growth of 2.4%.
As of September 2025, 6,075 residents are employed, and the unemployment rate is 0.2% lower than Rest of Qld's rate of 4.1%. Workforce participation in Arundel is similar to Rest of Qld's at 59.1%. Employment among residents is concentrated in health care & social assistance (37%), retail trade (21%), and education & training (16%).
Agriculture, forestry & fishing employs only 0.2% of local workers, below Rest of Qld's 4.5%. Many Arundel residents commute elsewhere for work based on Census data. In the 12-month period ending September 2025, employment increased by 2.4%, labour force rose by 2.2%, and unemployment decreased by 0.2 percentage points. This contrasts with Rest of Qld where employment grew by 1.7%, labour force expanded by 2.1%, and unemployment rose by 0.3 percentage points. State-level data from 25-Nov-25 shows Queensland's employment contracted by 0.01% (losing 1,210 jobs), with the state unemployment rate at 4.2%, closely aligned with the national rate of 4.3%. Jobs and Skills Australia forecasts national employment growth of 6.6% over five years and 13.7% over ten years. Applying these projections to Arundel's employment mix suggests local employment should increase by 6.7% over five years and 14.0% over ten years, assuming constant population projections.
Frequently Asked Questions - Employment
Income
Income levels sit below national averages according to AreaSearch assessment
AreaSearch's latest postcode level ATO data for financial year 2022 shows that income in the Arundel SA2 is below the national average. The median assessed income is $47,275 and the average income stands at $61,464. This contrasts with Rest of Qld's figures where the median income is $50,780 and the average income is $64,844. Based on Wage Price Index growth of 13.99% since financial year 2022, current estimates for median income would be approximately $53,889 and average income would be around $70,063 as of September 2025. According to the 2021 Census figures, household, family, and personal incomes in Arundel rank modestly, between the 31st and 46th percentiles. The income distribution shows that the $1,500 - $2,999 earnings band captures 34.1% of the community (4,071 individuals), which is consistent with broader trends across the metropolitan region showing 31.7% in the same category. Housing affordability pressures are severe, with only 81.8% of income remaining after housing costs, ranking at the 44th percentile. The area's SEIFA income ranking places it in the 5th decile.
Frequently Asked Questions - Income
Housing
Arundel is characterized by a predominantly suburban housing profile, with ownership patterns similar to the broader region
Arundel's dwelling structure, as per the latest Census, consisted of 83.0% houses and 17.1% other dwellings (semi-detached, apartments, 'other' dwellings). In comparison, Non-Metro Qld had 41.7% houses and 58.3% other dwellings. Home ownership in Arundel was 34.2%, with mortgaged dwellings at 37.5% and rented at 28.3%. The median monthly mortgage repayment was $2,000, higher than Non-Metro Qld's average of $1,733. Median weekly rent in Arundel was $470, compared to Non-Metro Qld's $410. Nationally, Arundel's median monthly mortgage repayment is higher at $2,000 than the Australian average of $1,863, while median weekly rent is substantially higher at $470 than the national figure of $375.
Frequently Asked Questions - Housing
Household Composition
Arundel features high concentrations of group households and family households, with a higher-than-average median household size
Family households account for 77.4% of all households, including 33.2% couples with children, 30.0% couples without children, and 13.1% single parent families. Non-family households constitute the remaining 22.6%, with lone person households at 18.4% and group households making up 4.2%. The median household size is 2.7 people, larger than the Rest of Qld average of 2.2.
Frequently Asked Questions - Households
Local Schools & Education
The educational profile of Arundel exceeds national averages, with above-average qualification levels and academic performance metrics
The area's university qualification rate is 27.3%, higher than the Rest of Qld average of 20.6% and the SA3 area's rate of 22.9%. Bachelor degrees are most common at 18.0%, followed by postgraduate qualifications (7.1%) and graduate diplomas (2.2%). Vocational credentials are held by 34.8% of residents aged 15+, with advanced diplomas at 11.8% and certificates at 23.0%.
Educational participation is high, with 28.5% currently enrolled in formal education: 9.2% in primary, 7.4% in secondary, and 6.0% in tertiary education.
Frequently Asked Questions - Education
Schools Detail
Nearby Services & Amenities
Transport
Transport servicing is moderate compared to other areas nationally based on assessment of service frequency, route connectivity and accessibility
Transport analysis indicates 30 operational stops in Arundel, comprising a mix of bus services. These stops are served by 6 distinct routes, collectively facilitating 1567 weekly passenger trips. Transport accessibility is rated as good, with residents typically situated 333 meters from the nearest stop.
Service frequency averages 223 trips per day across all routes, equating to approximately 52 weekly trips per individual stop.
Frequently Asked Questions - Transport
Transport Stops Detail
Health
Health outcomes in Arundel are marginally below the national average with common health conditions somewhat prevalent across both younger and older age cohorts
Health indicators suggest below-average outcomes in Arundel. Common health conditions are somewhat prevalent across both younger and older age cohorts.
The rate of private health cover is relatively low at approximately 51% of the total population (~6,041 people), compared to 53.9% across Rest of Qld. The most common medical conditions are arthritis and mental health issues, impacting 8.7 and 8.1% of residents respectively. 68.2% of residents declare themselves completely clear of medical ailments, compared to 64.5% across Rest of Qld. There are 18.9% of residents aged 65 and over (2,251 people), which is lower than the 25.8% in Rest of Qld. Health outcomes among seniors present some challenges, broadly in line with the general population's health profile.
Frequently Asked Questions - Health
Cultural Diversity
Arundel was found to be more culturally diverse than the vast majority of local markets in Australia, upon assessment of a range of language and cultural background related metrics
Arundel's population showed higher cultural diversity compared to most nearby markets, with 22.0% speaking a language other than English at home and 38.2% born overseas. Christianity was the predominant religion in Arundel, accounting for 46.6%. However, Islam was more prevalent in Arundel at 4.4%, compared to the Rest of Qld's 2.5%.
The top three ancestry groups were English (28.3%), Australian (20.5%), and Other (11.6%). Notably, New Zealanders comprised 1.5% of Arundel's population versus 1.4% regionally, Maori at 1.7% vs 1.5%, and Koreans at 0.8% vs 0.5%.
Frequently Asked Questions - Diversity
Age
Arundel's population is slightly older than the national pattern
Arundel has a median age of 40, closely aligned with Rest of Queensland's figure of 41 but slightly above Australia's national norm of 38. The 25-34 age group comprises 14.2% of Arundel's population, higher than Rest of Queensland's figure. Conversely, the 65-74 cohort makes up 8.9%, lower than Rest of Queensland. Post-2021 Census, the 25-34 age group grew from 11.8% to 14.2%, while the 65-74 cohort decreased from 10.6% to 8.9%. By 2041, demographic projections indicate significant changes in Arundel's age profile. The 25-34 group is expected to grow by 33%, reaching 2,246 people from the current 1,694. Meanwhile, the 15-24 age range is projected to decrease by 72%.
