Chart Color Schemes
This analysis uses ABS Statistical Areas Level 2 (SA2) boundaries, which can materially differ from Suburbs and Localities (SAL) even when sharing similar names.
SA2 boundaries are defined by the Australian Bureau of Statistics and are designed to represent communities for statistical reporting (e.g., census and ERP).
Suburbs and Localities (SAL) represent commonly-used suburb/locality names (postal-style areas) and may use different geographic boundaries. For comprehensive analysis, consider reviewing both boundary types if available.
est. as @ -- *
ABS ERP | -- people | --
2021 Census | -- people
Sales Activity
Curious about local property values? Filter the chart to assess the volume and appreciation (including resales) trends and regional comparisons, or scroll to the map below view this information at an individual property level.
Find a Recent Sale
Sales Detail
Population
Helensvale lies within the top quartile of areas nationally for population growth performance according to AreaSearch analysis of recent, and medium to long-term trends
Helensvale's population was approximately 20,991 as of November 2025. This figure represents a growth of 2,042 people since the 2021 Census, which reported a population of 18,949. The increase is inferred from the estimated resident population of 20,815 in June 2024 and an additional 306 validated new addresses since the Census date. This results in a population density ratio of 1,042 persons per square kilometer, which aligns with averages seen across locations assessed by AreaSearch. Helensvale's growth rate of 10.8% since the 2021 census exceeded both the non-metro area average (8.8%) and the national average, positioning it as a growth leader in the region. Interstate migration contributed approximately 49.5% of overall population gains during recent periods, with all drivers including overseas migration and natural growth being positive factors.
AreaSearch adopts ABS/Geoscience Australia projections for each SA2 area, released in 2024 with a base year of 2022. For areas not covered by this data and years post-2032, Queensland State Government's SA2 area projections are used, released in 2023 based on 2021 data. It is noted that these state projections do not provide age category splits; hence proportional growth weightings aligned with ABS Greater Capital Region projections are applied where utilized. Considering projected demographic shifts, a significant population increase in the top quartile of Australian non-metropolitan areas is forecast, with Helensvale expected to increase by 7,269 persons to 2041 based on the latest annual ERP population numbers, reflecting a gain of 33.8% over the 17 years.
Frequently Asked Questions - Population
Development
AreaSearch assessment of residential development activity positions Helensvale among the top 25% of areas assessed nationwide
Helensvale has seen approximately 131 new homes approved annually. Between FY21 and FY25659 homes were approved, with an additional 139 approved in FY26 so far. On average, 3.6 new residents arrived per dwelling constructed over the past five financial years.
This supply lagging demand suggests heightened buyer competition and pricing pressures, with new properties constructed at an average value of $353,000. In FY26, $16.4 million in commercial approvals have been registered, indicating moderate levels of commercial development. Compared to the rest of Queensland, Helensvale shows around 75% of construction activity per person and ranks among the 42nd percentile nationally, resulting in relatively constrained buyer choice and supporting interest in existing homes. New building activity comprises 57.0% detached houses and 43.0% medium and high-density housing, with a growing mix of townhouses and apartments offering options across different price points.
This shift from the area's existing housing (currently 81.0% houses) indicates decreasing availability of developable sites and reflects changing lifestyles and demand for more diverse, affordable housing options. With around 408 people per approval, Helensvale suggests a mature market. Looking ahead, AreaSearch estimates Helensvale to grow by 7,093 residents through to 2041. Development is keeping pace with projected growth, though buyers may face increasing competition as the population expands.
Frequently Asked Questions - Development
Infrastructure
Helensvale has very high levels of nearby infrastructure activity, ranking in the top 10% nationally
Infrastructure changes significantly influence an area's performance. AreaSearch has identified 77 projects likely impacting the area. Key projects include Harbour Cove Mixed-Use Development, Arundel Springs Estate, Helensvale Business Park, and Helensvale Station Precinct Development. The following list details those most relevant.
Professional plan users can use the search below to filter and access additional projects.
INFRASTRUCTURE SEARCH
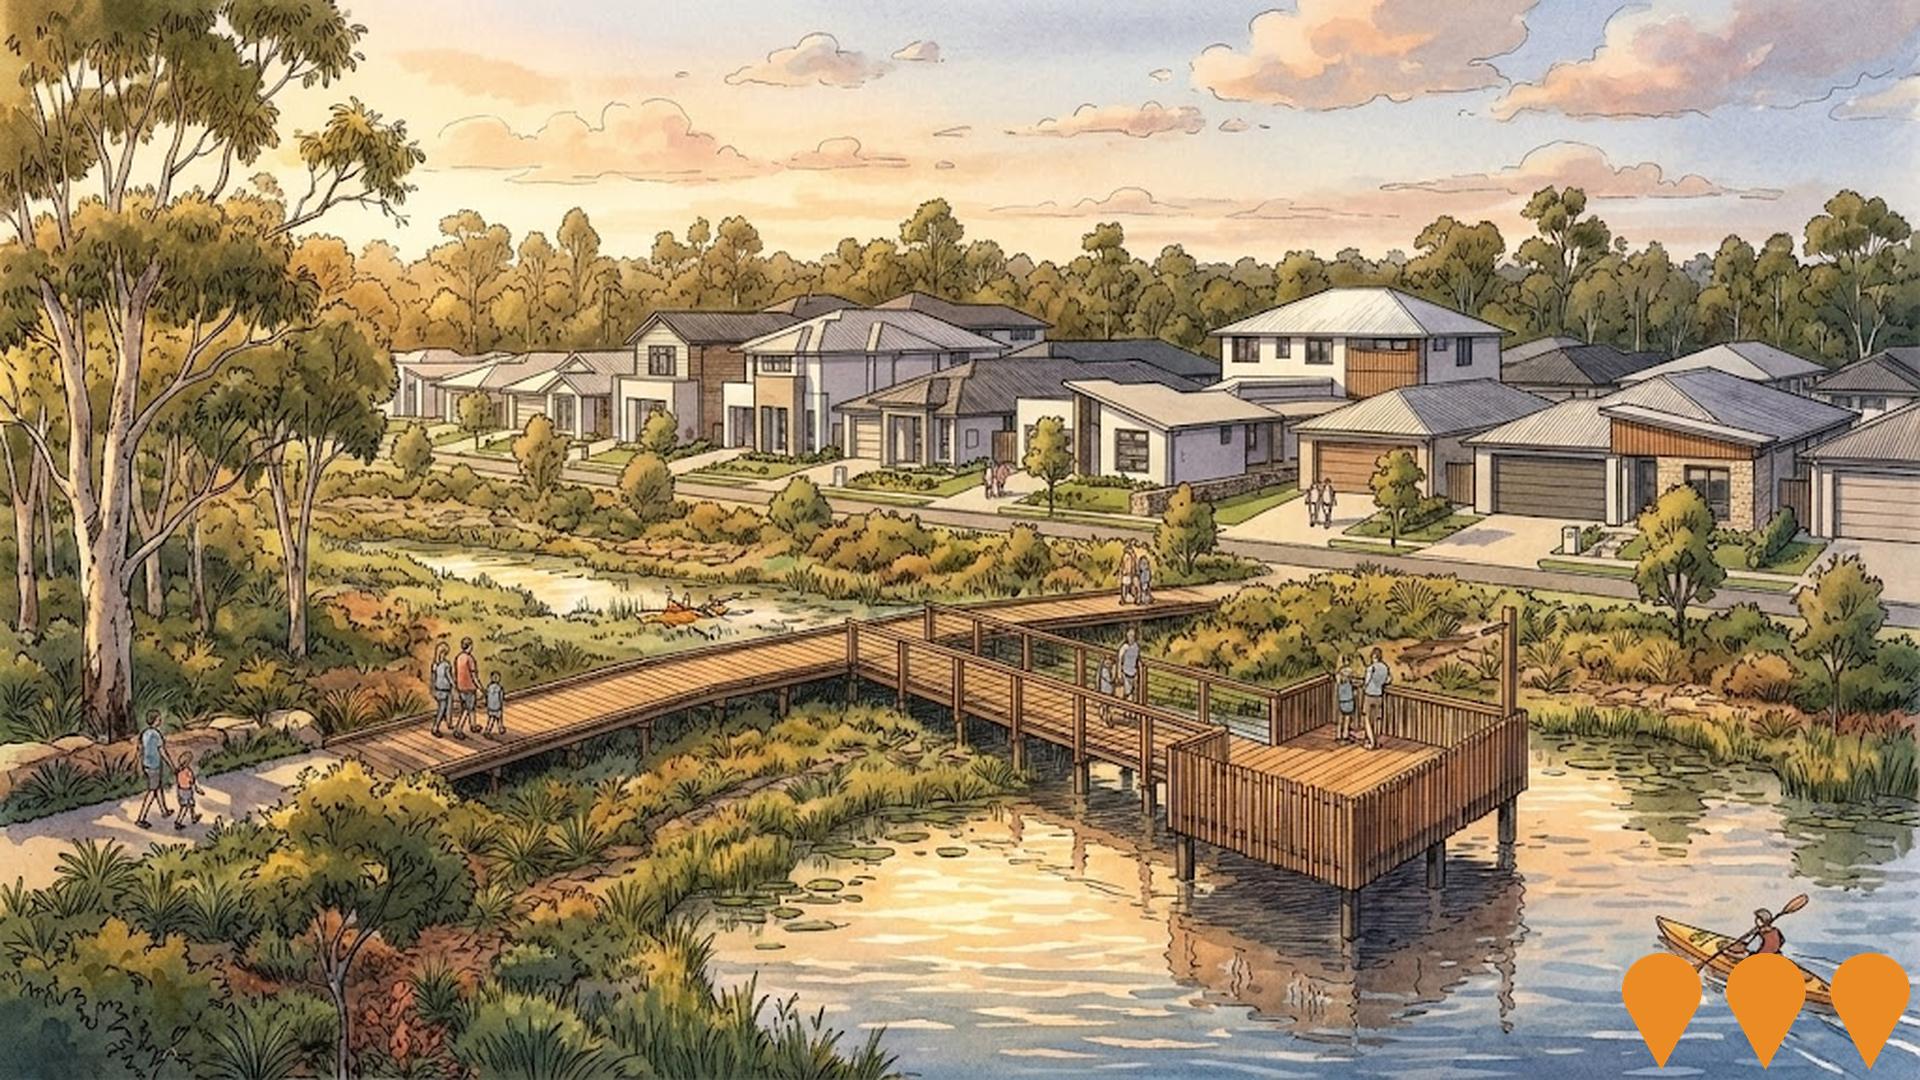
 Denotes AI-based impression for illustrative purposes only, not to be taken as definitive under any circumstances. Please follow links and conduct other investigations from the project's source for actual imagery. Developers and project owners wishing us to use original imagery please Contact Us and we will do so.
Frequently Asked Questions - Infrastructure
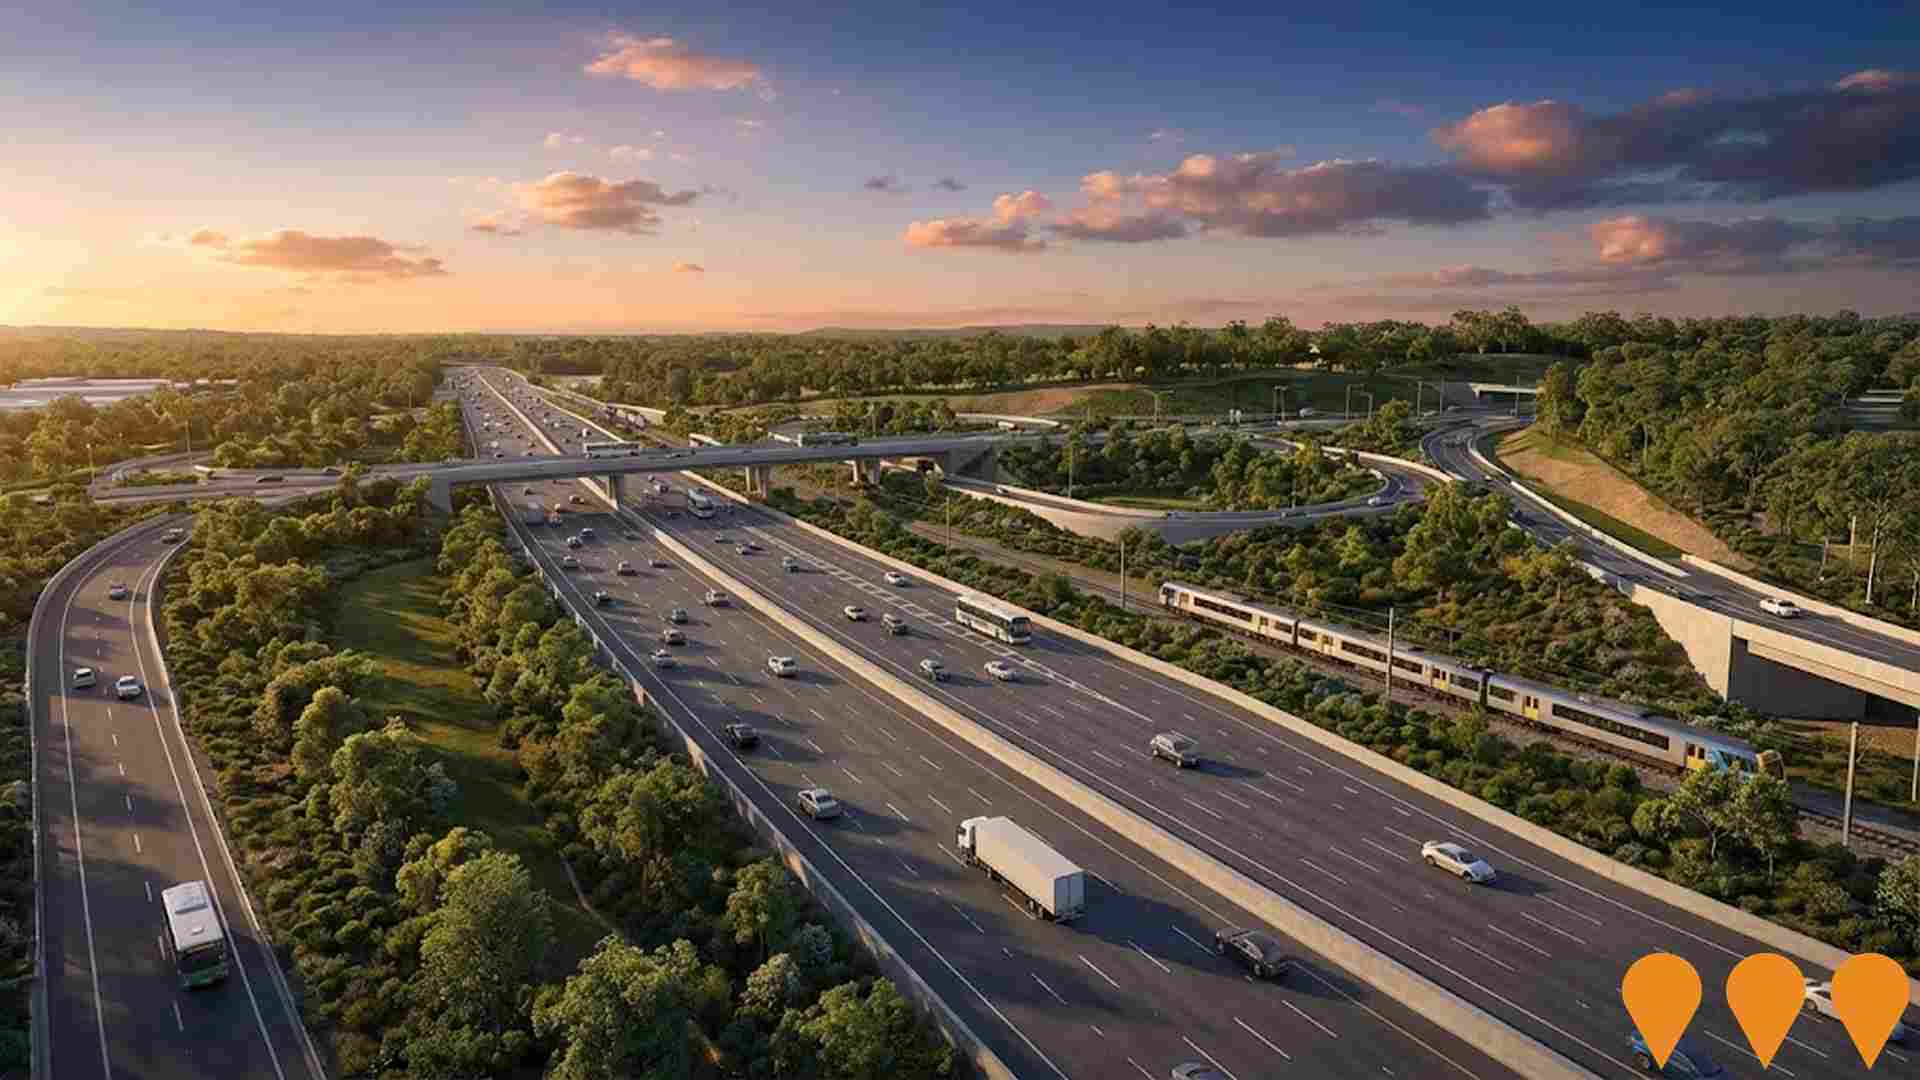
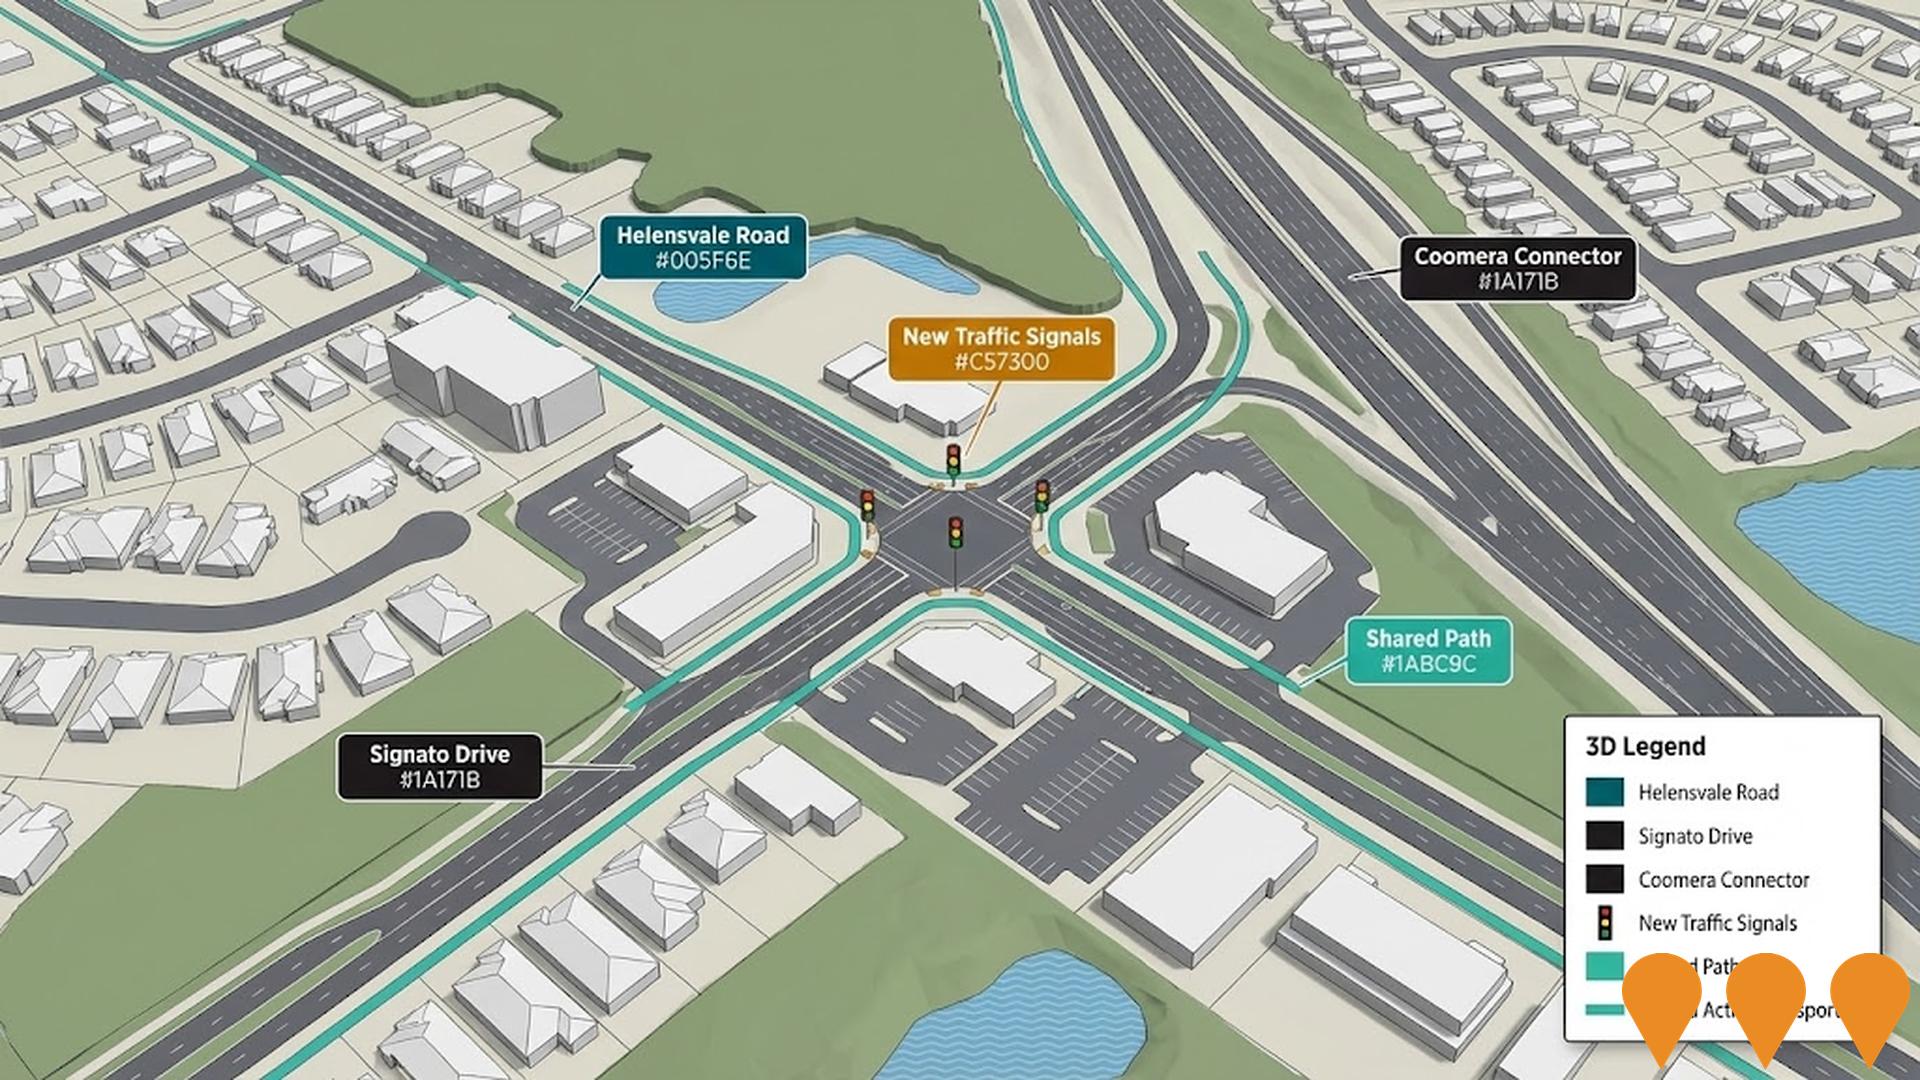
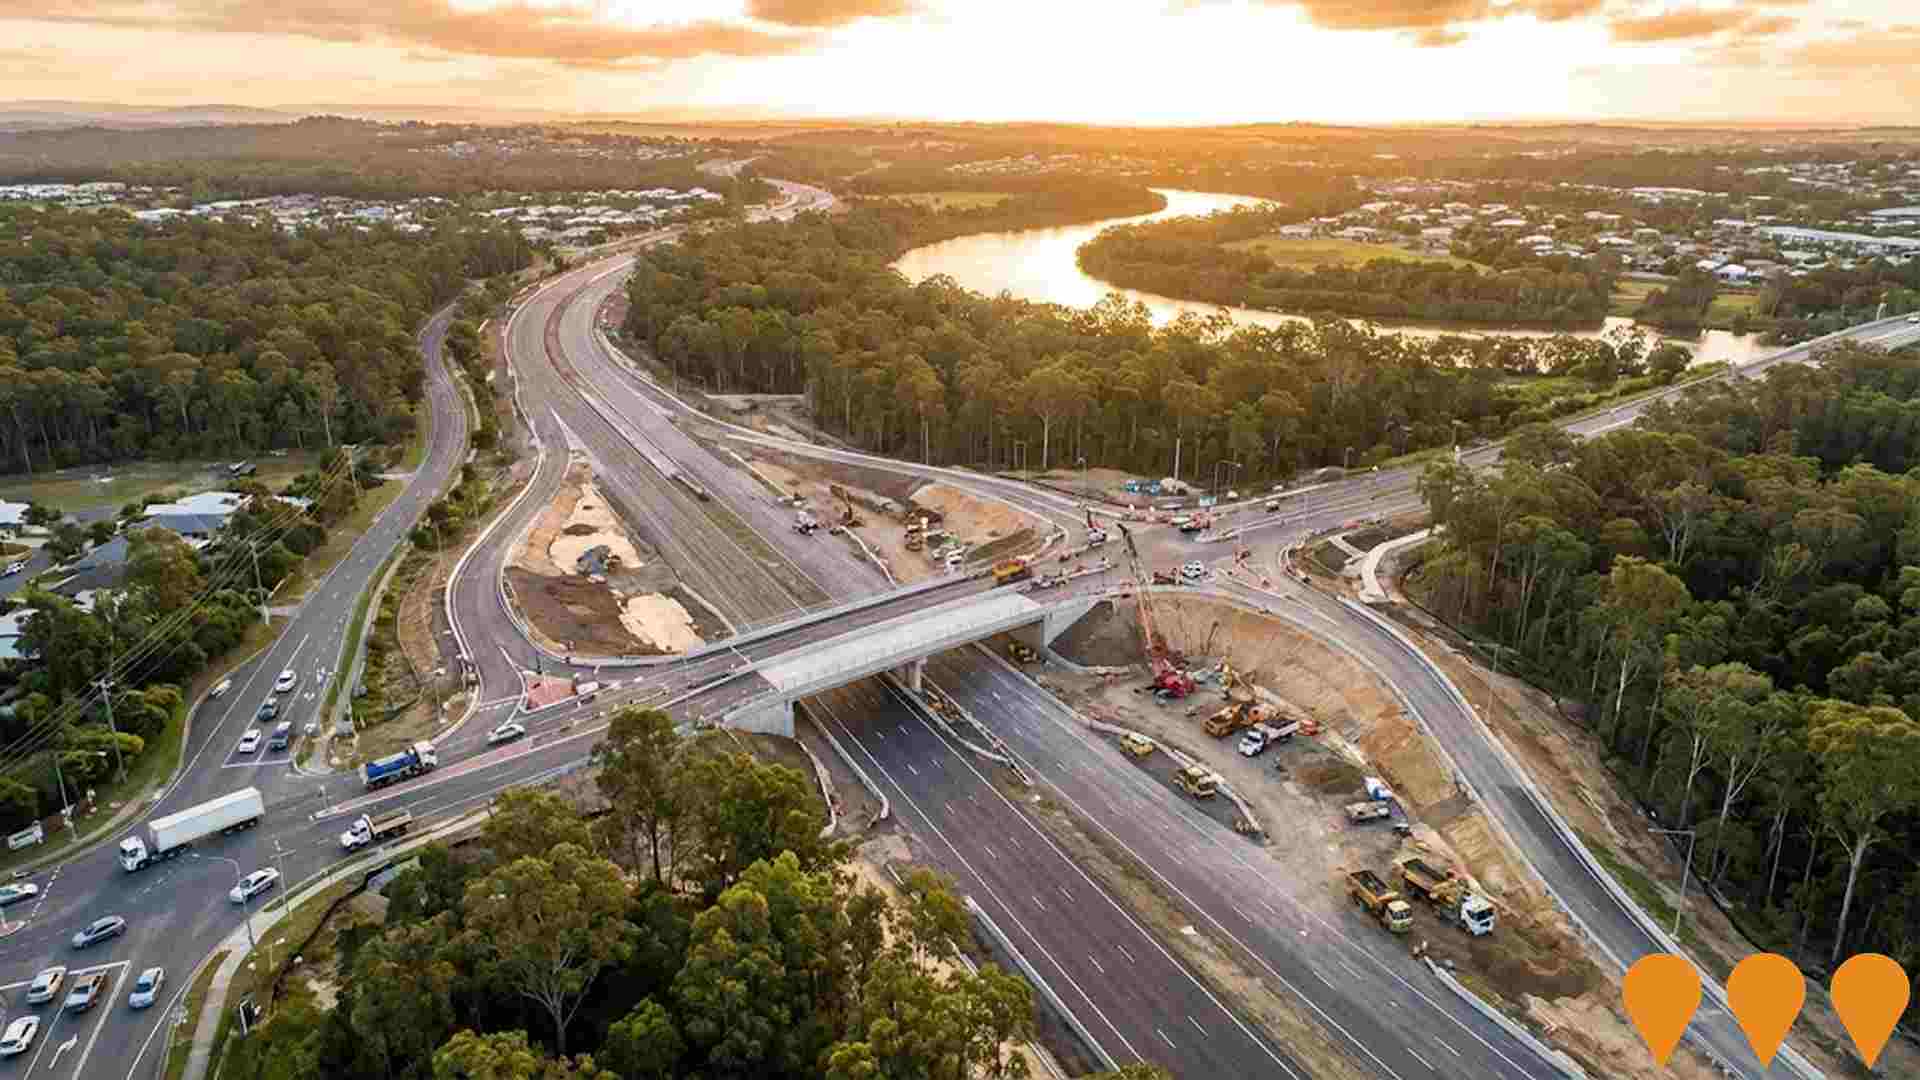
Coomera Connector Stage 1
16km motorway from Coomera to Nerang, part of the 45km Coomera Connector (M9). Stage 1 North (Shipper Drive to Helensvale Road) opened to traffic in December 2025. Stage 1 Central and South packages are under construction. Features smart motorway technology, shared paths, and wildlife crossings. Jointly funded by Australian and Queensland governments.
Coomera Quarter
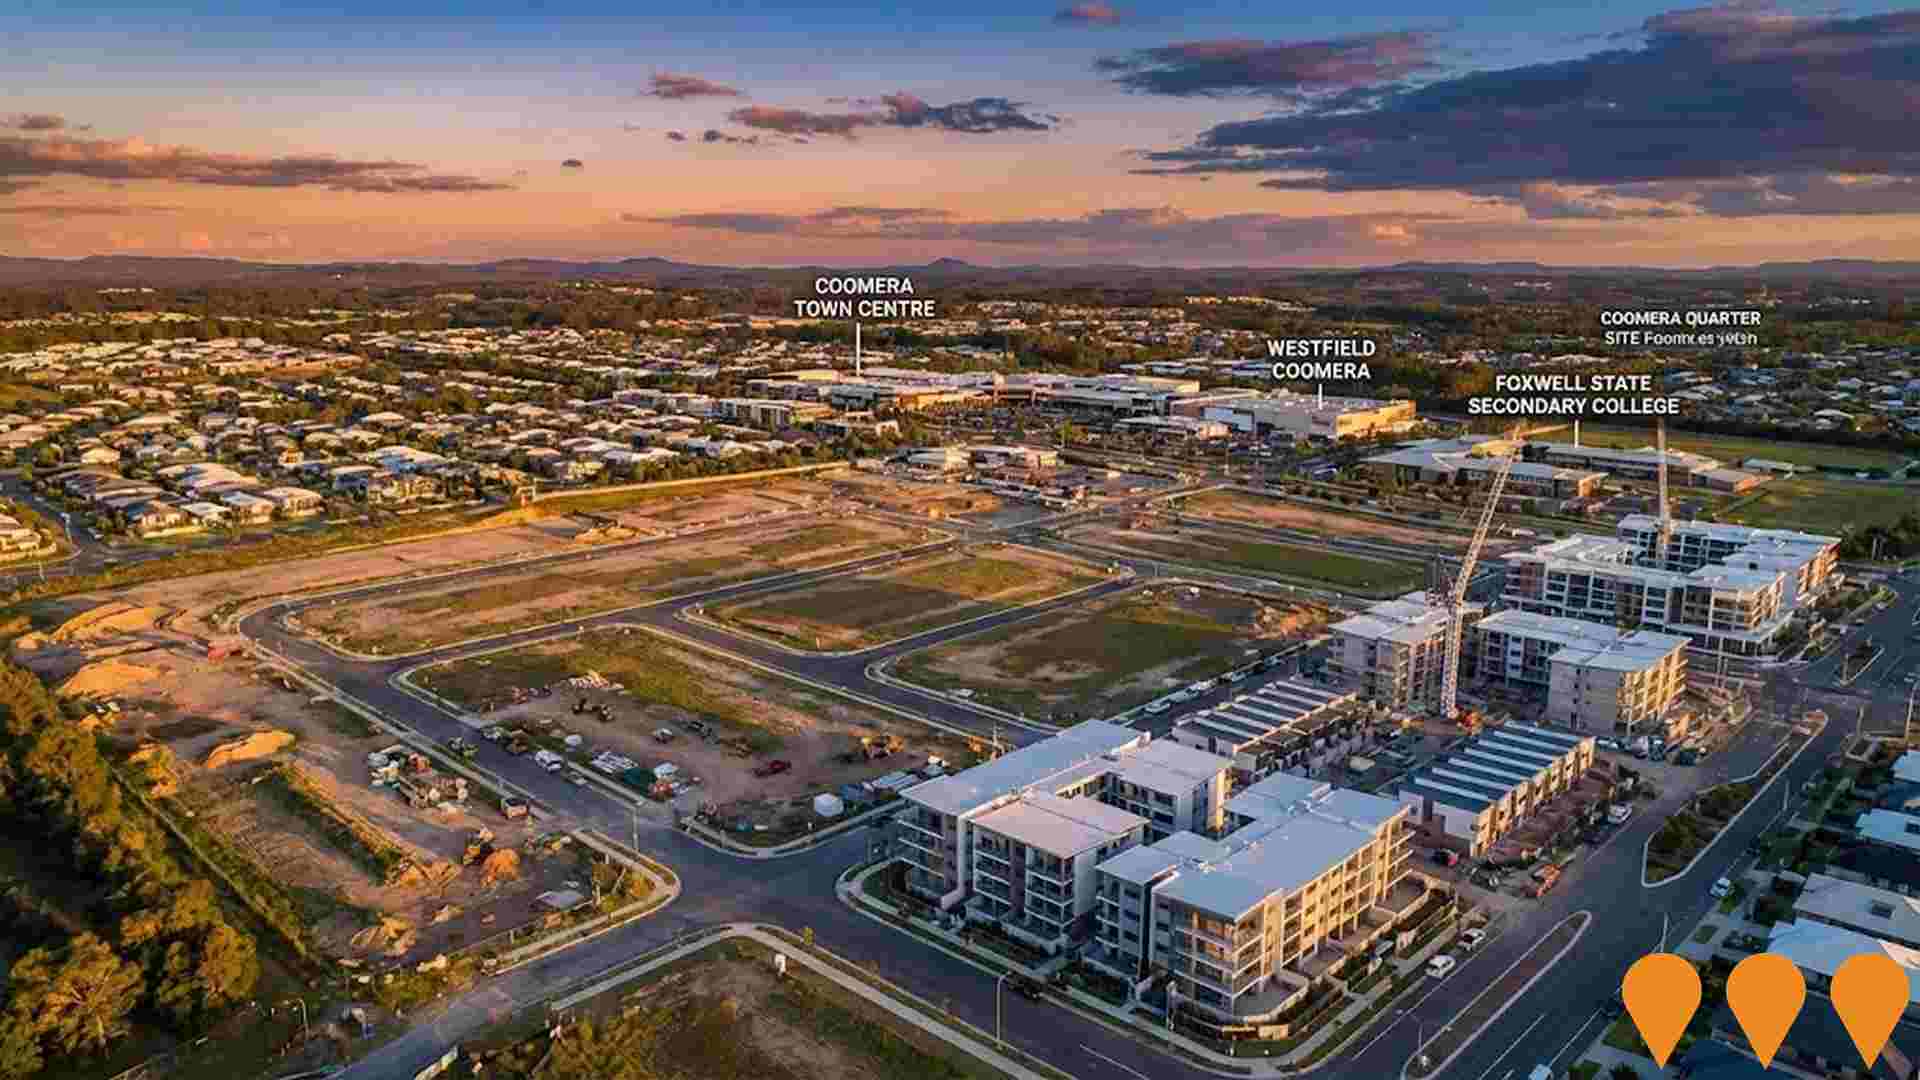
161-hectare master-planned mixed-use community in Coomera on the northern Gold Coast. Developed by Leda Holdings (Bob Ell), the infill site has existing approvals for over 4,000 dwellings (mix of houses, townhouses and apartments), retail spaces, five neighbourhood centres, parklands and recreational facilities. Located in one of Queensland's fastest-growing corridors with proximity to Coomera Town Centre, Westfield Coomera, schools, future hospitals and excellent transport links.
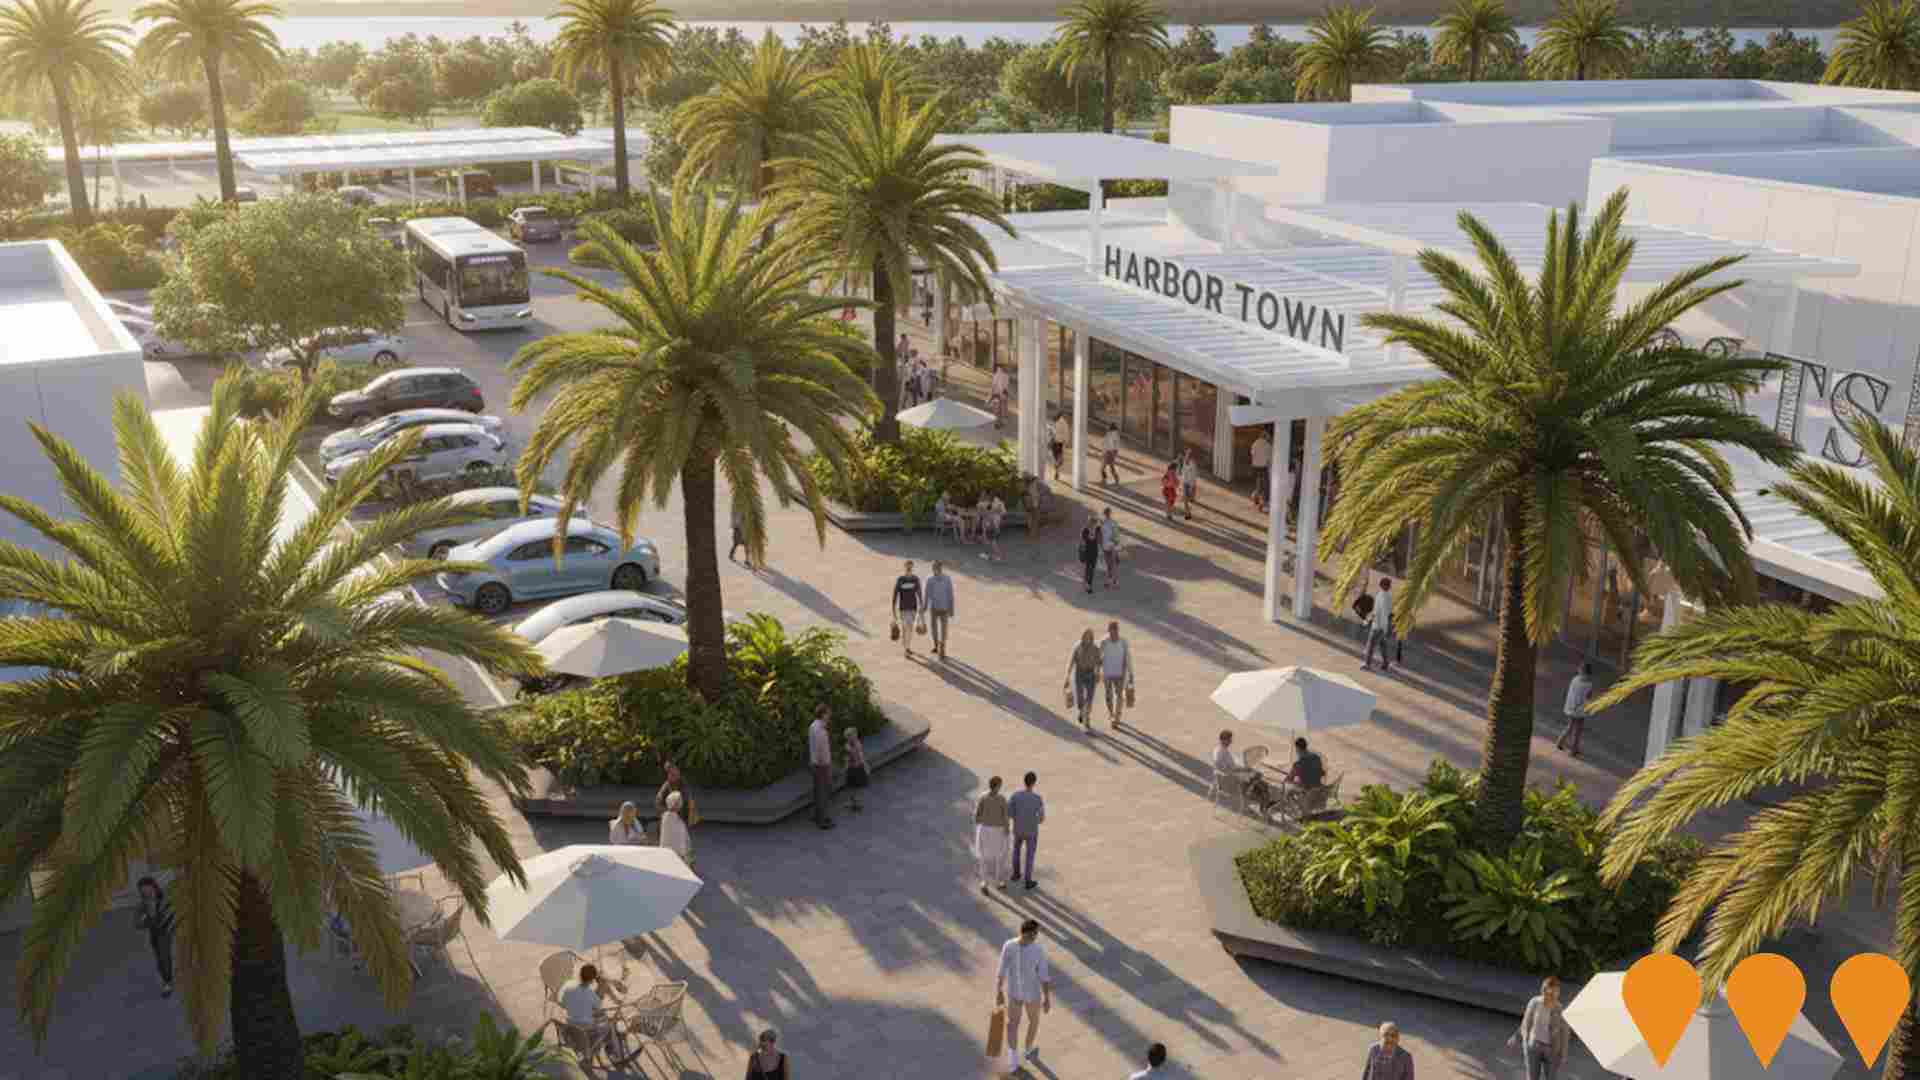
Harbour Town Premium Outlets Expansion
Southern mall upgrade to Harbour Town Premium Outlets (from JB Hi-Fi to the Fruit Market and adjacent to the Harbour Town Eats water feature), delivering refreshed finishes, shading and seating, new food kiosks and a new courtyard outside Woolworths. Works commenced 28 May 2024 and reached practical completion in late November 2024.
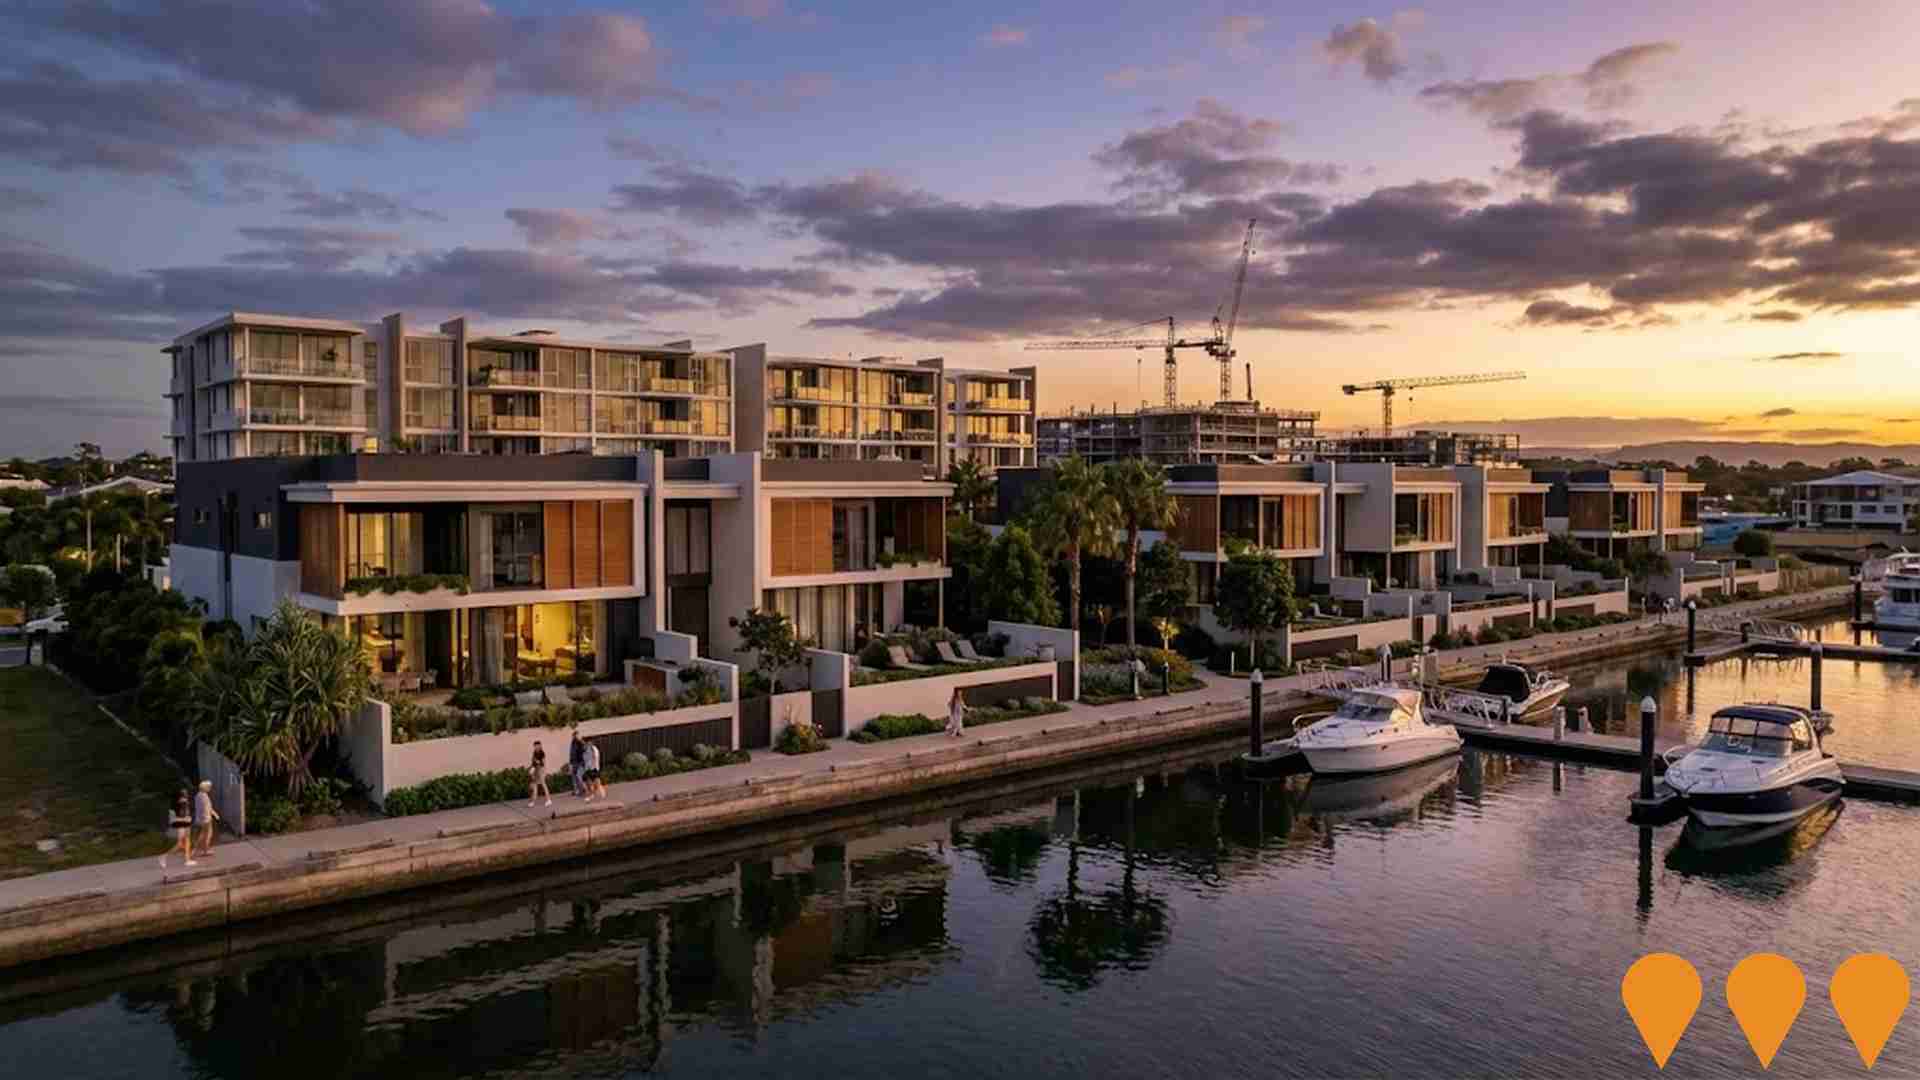
Harbour Shores Biggera Waters
$1.5b masterplanned waterfront community on 16 hectares with 1.2km canal frontage. Circa 2,000 dwellings across 30 mid-rise buildings and villas, with resort-style amenities, waterfront boardwalk and private marina berths. Certified 6 Star Green Star Communities v1.1. Stage 1 (The Waterline, Palm House and The Residences) is under construction and tracking ahead of schedule: Waterline fitouts underway with first kitchens installed 2 July 2025; Palm House sheet piling and basement excavation complete with the first basement pour scheduled mid-August 2025. First residents expected mid 2026; full build out over the next decade.
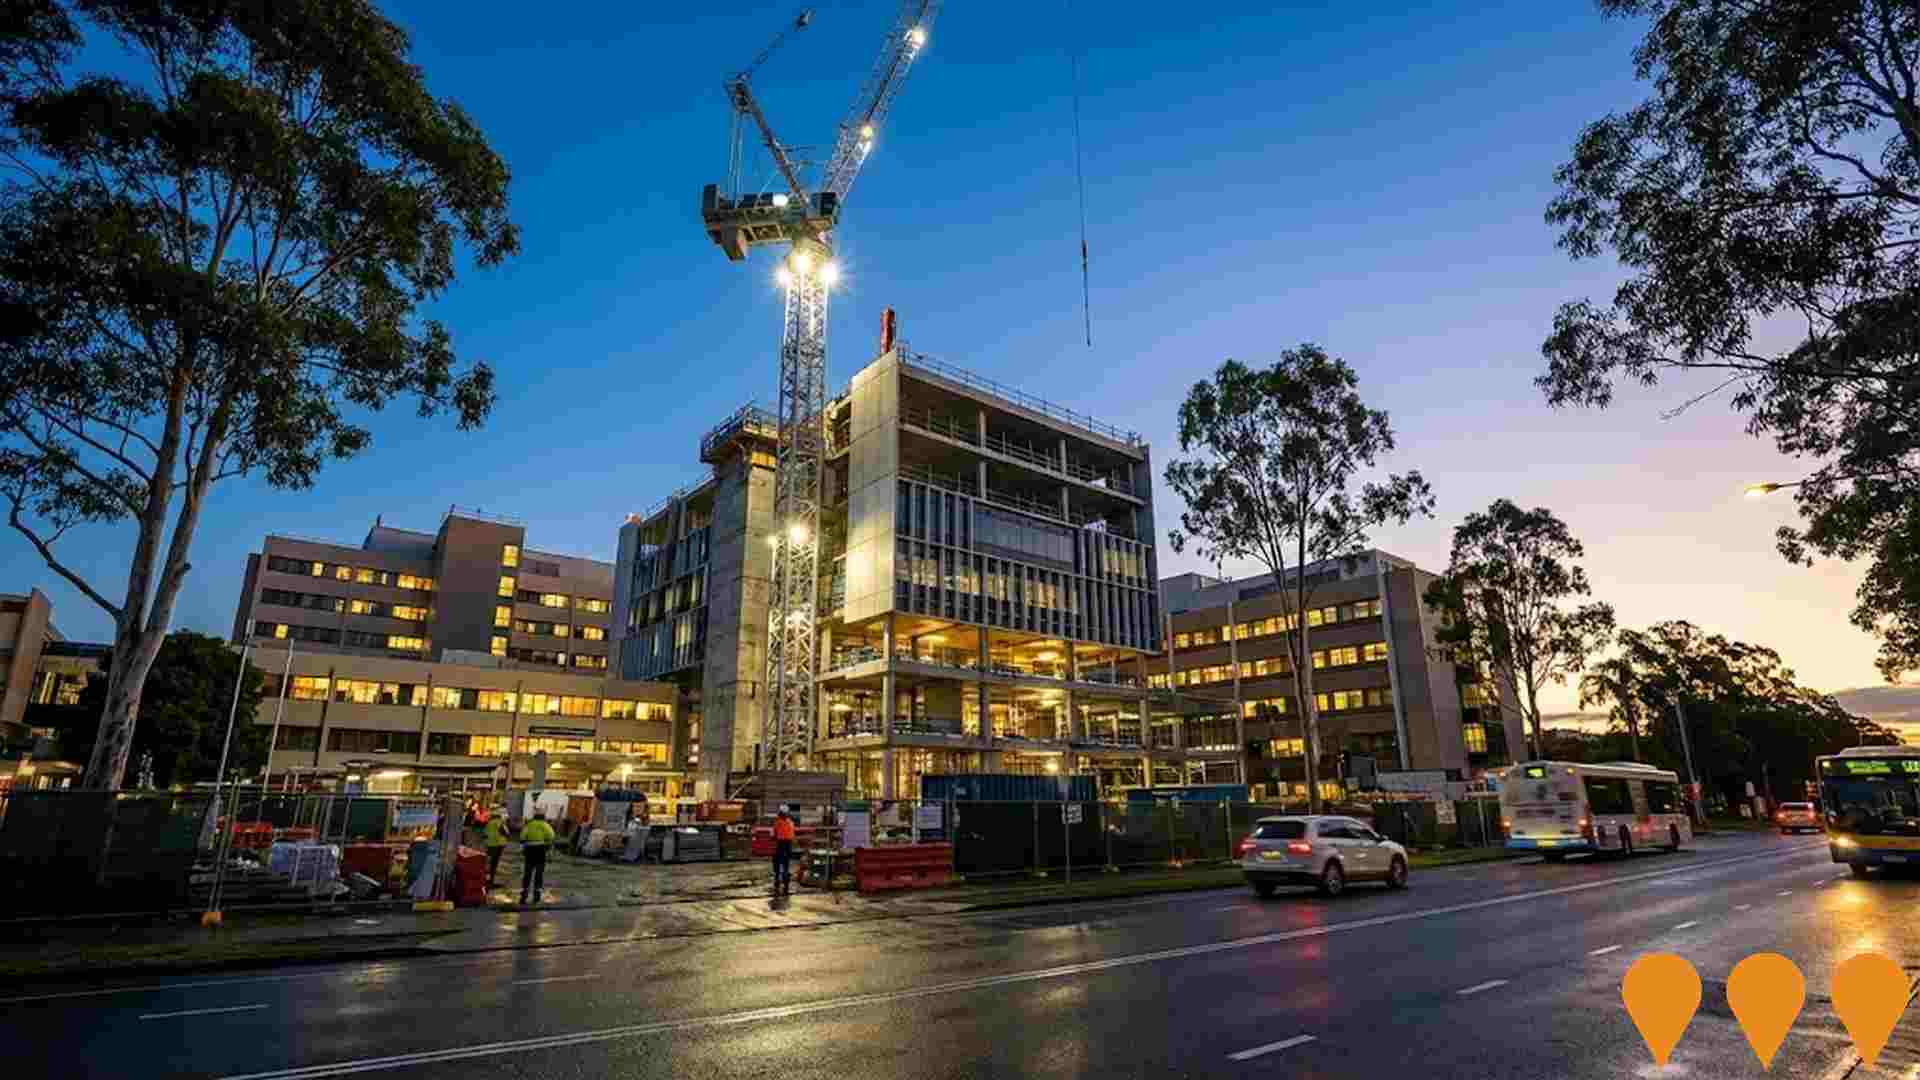
Gold Coast University Hospital Expansion
Expansion of Gold Coast University Hospital including additional beds, emergency department upgrade, new surgical suites and expanded specialist services.
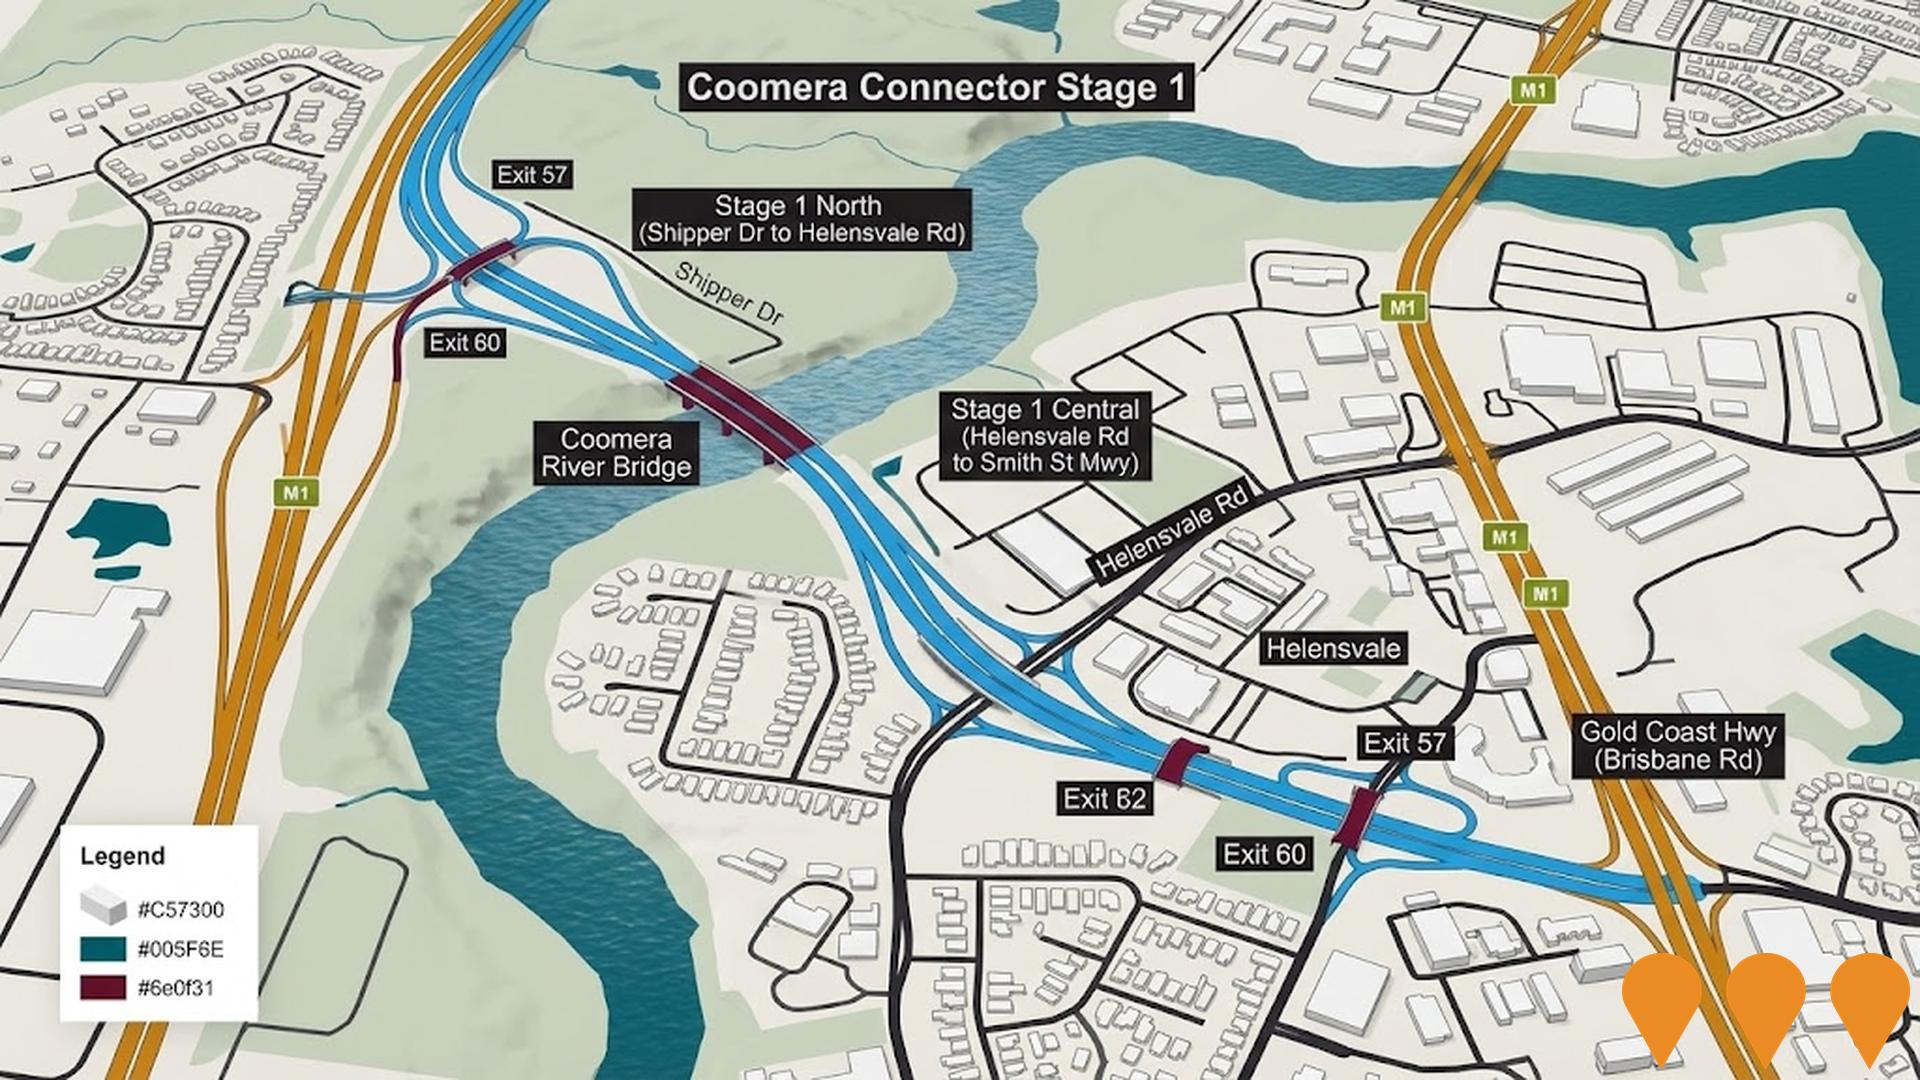
Coomera Connector Stage 1
Queensland's second M1 - a $3.026 billion, 16km motorway connection between Coomera and Nerang, delivered in three packages (North, Central, South). Will provide alternative to M1, removing up to 60,000 local trips per day. Features 4 lanes with provision for future widening to 6 lanes, bridges over Coomera and Nerang rivers, grade-separated interchanges at Shipper Drive and Helensvale Road, shared pedestrian/cycle paths, and open graded asphalt road surface. Expected to progressively open to traffic from late 2025.
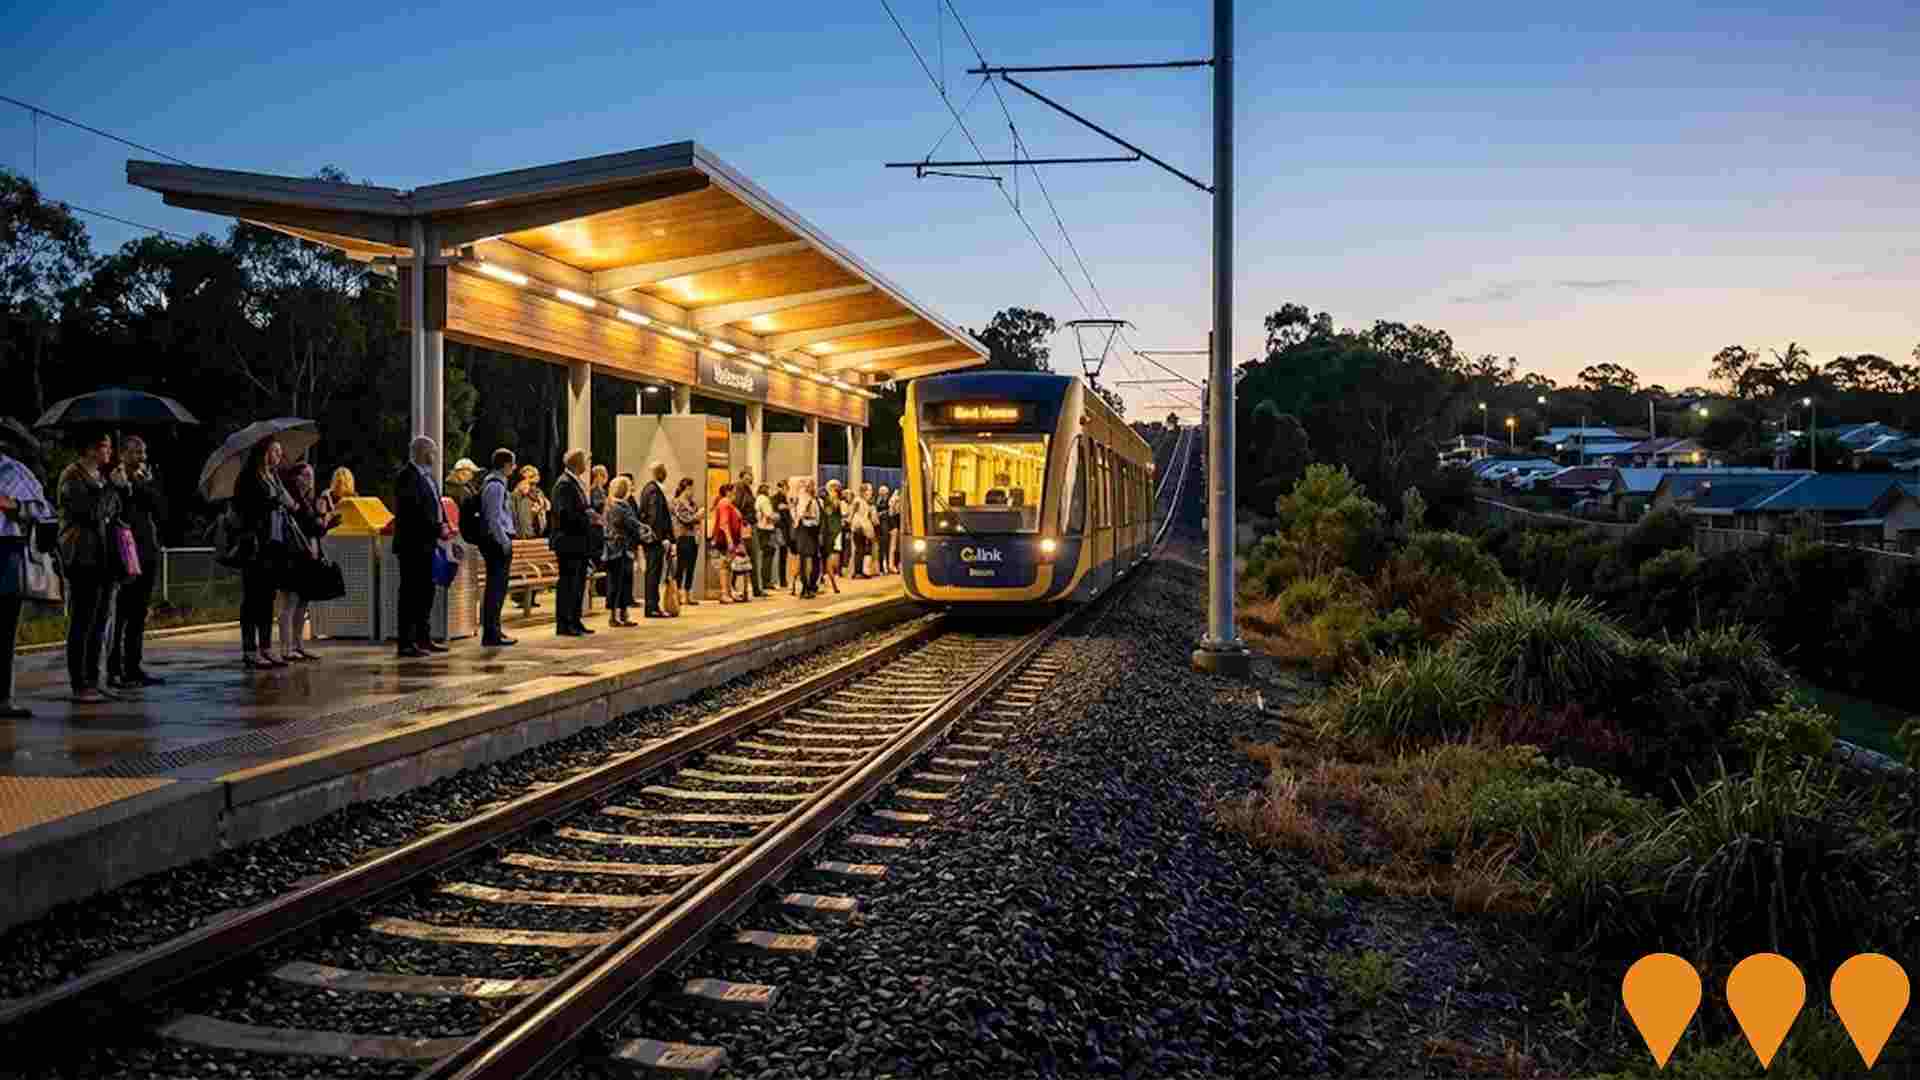
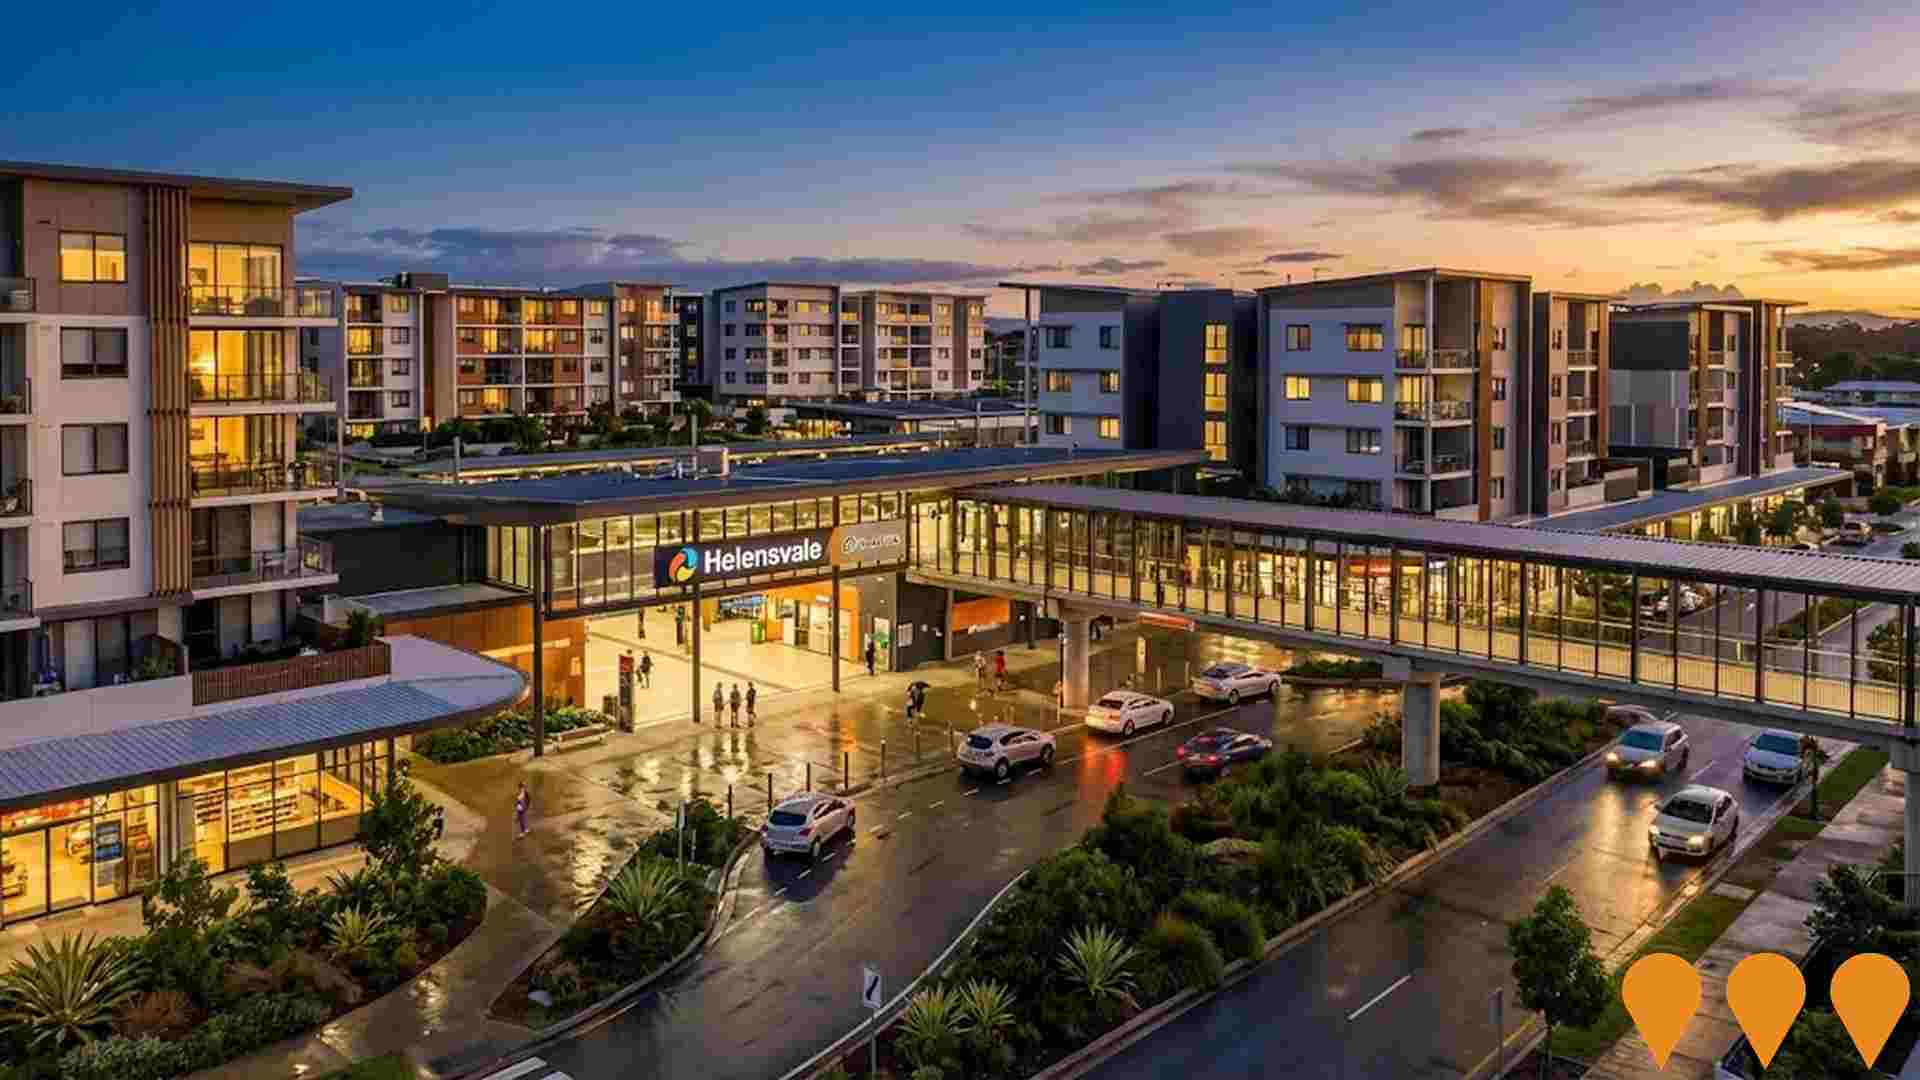
Helensvale Station Precinct Development
Mixed-use development around Helensvale train station including residential apartments, retail spaces, office buildings and improved transport connections.
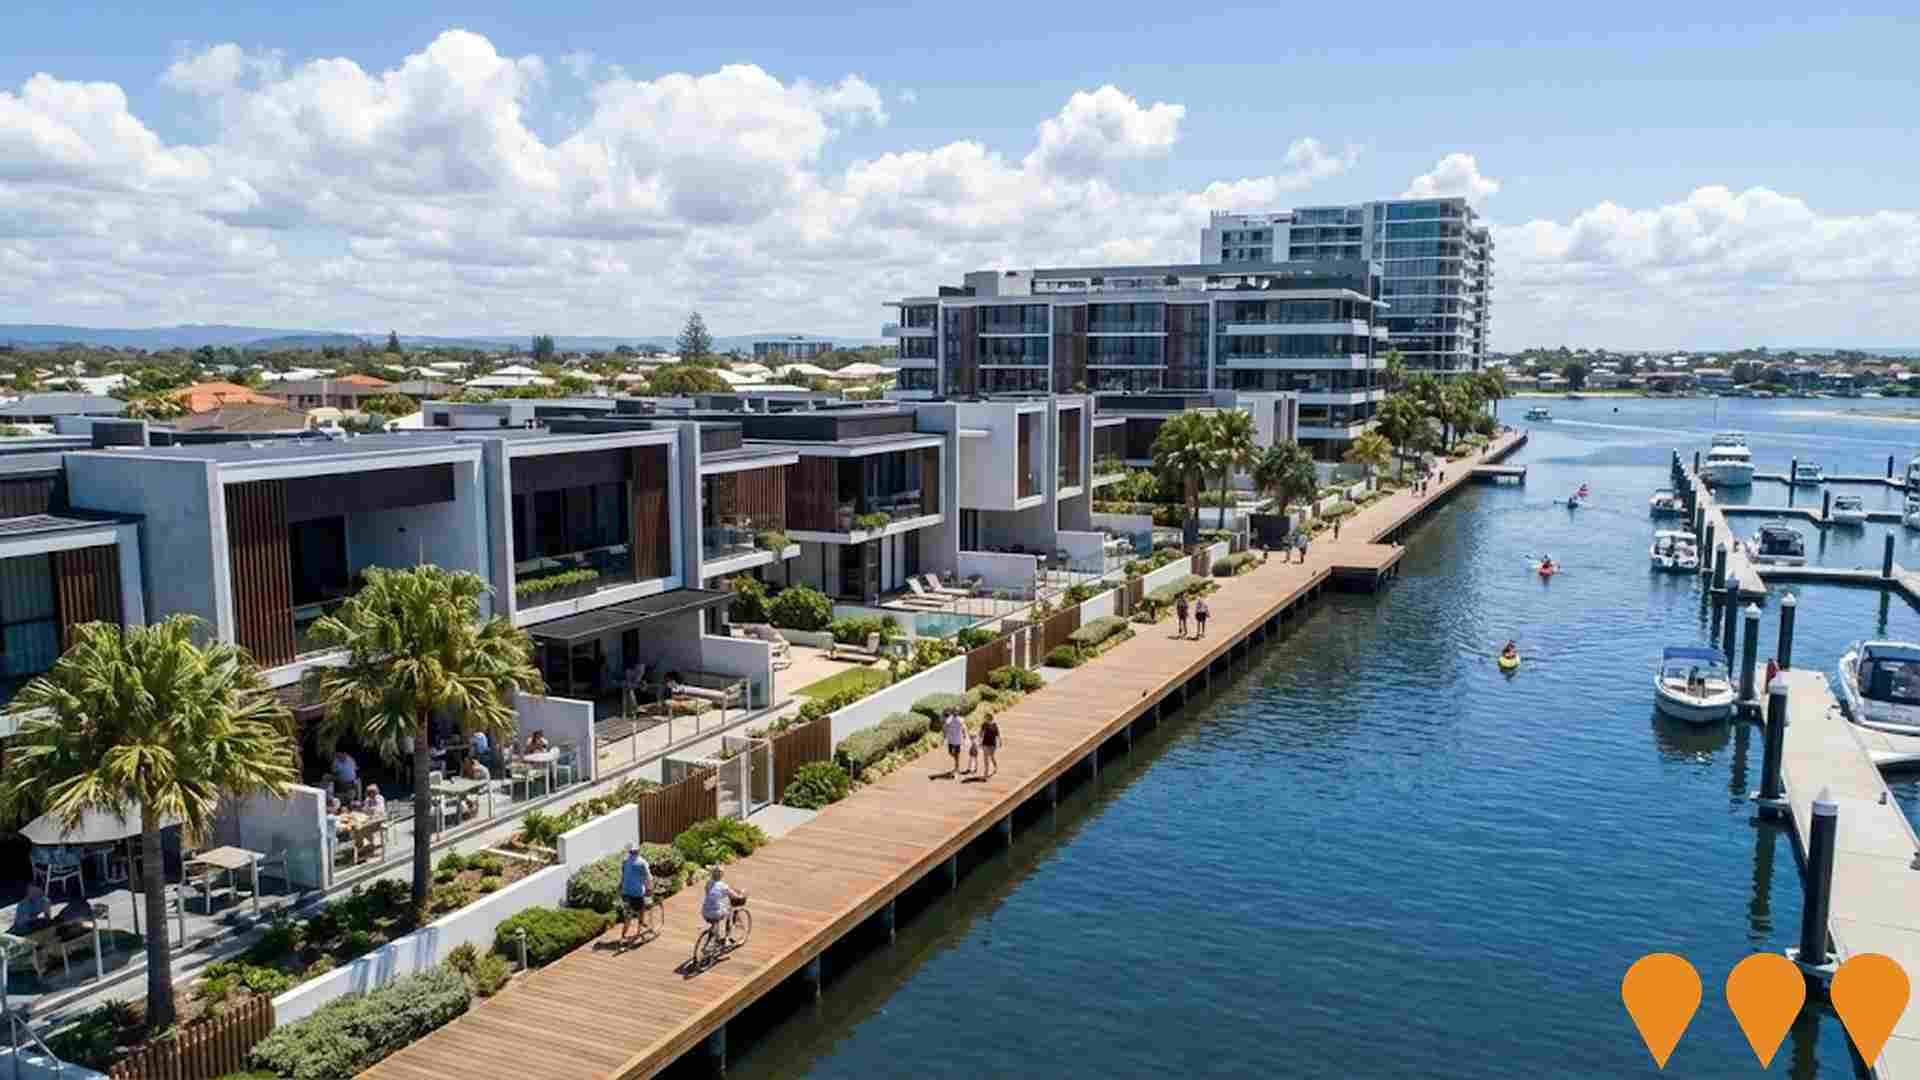
Harbour Cove Mixed-Use Development
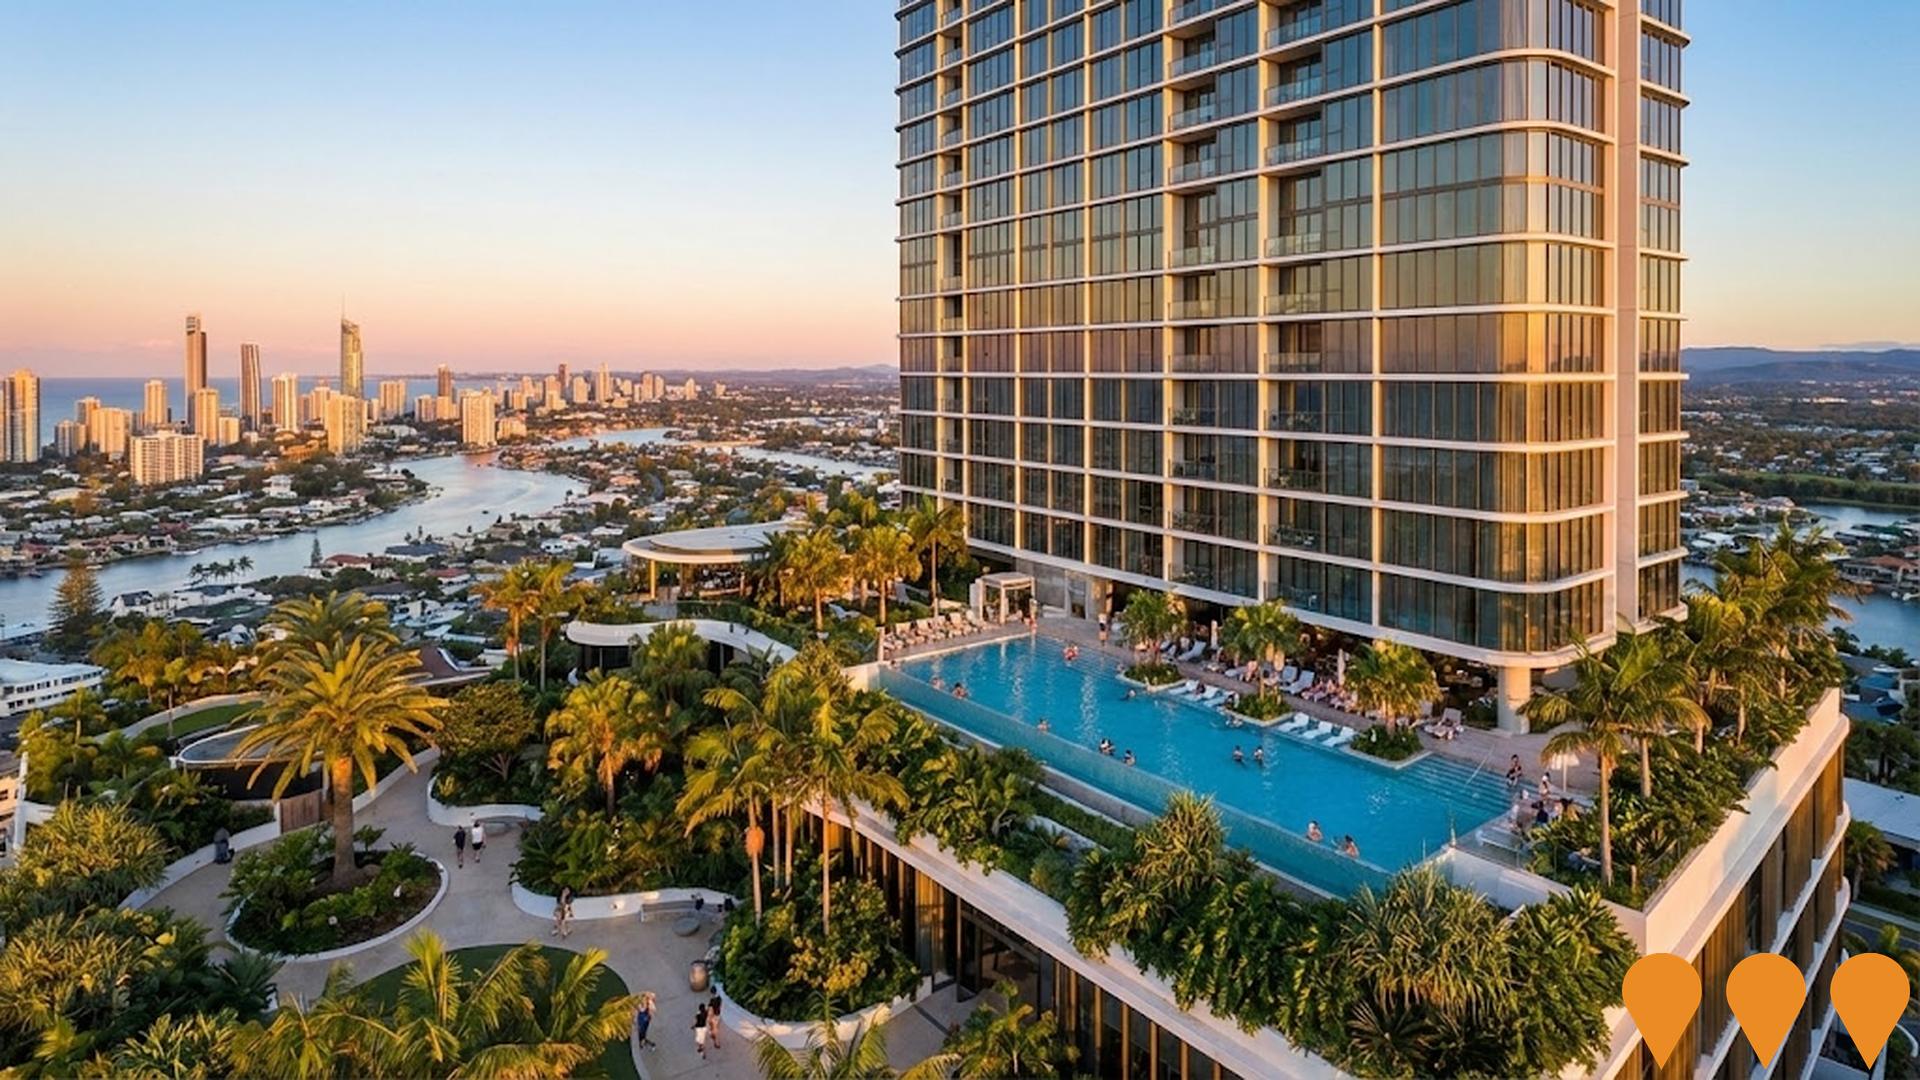
A comprehensive mixed-use waterfront development featuring 511 apartments across six medium-rise towers, complete with resort-style amenities, rooftop pools, sky gardens, and a boutique harbour-side retail/restaurant precinct. Master planning underway for marina and boardwalk with direct Broadwater access.
Employment
Employment conditions in Helensvale demonstrate strong performance, ranking among the top 35% of areas assessed nationally
Helensvale has a skilled workforce with diverse sector representation. Its unemployment rate is 2.8%, lower than the Rest of Qld's 4.1%.
Employment growth over the past year was estimated at 2.3%. As of September 2025, 11,490 residents are employed, with a participation rate of 64.2% compared to Rest of Qld's 59.1%, and an unemployment rate 1.2% lower than the regional average. Dominant employment sectors include health care & social assistance, construction, and retail trade. Construction is particularly strong, with an employment share 1.2 times the regional level.
Conversely, agriculture, forestry & fishing shows lower representation at 0.2%. Many residents commute elsewhere for work based on Census data. Over a 12-month period ending September 2025, employment increased by 2.3% while unemployment remained essentially unchanged. This contrasts with Rest of Qld where employment rose by 1.7% and unemployment rose by 0.3 percentage points. State-level data to 25-Nov-25 shows Queensland employment contracted by 0.01%, with an unemployment rate of 4.2%. National employment forecasts from May-25 suggest a 6.6% growth over five years and 13.7% over ten years. Applying these projections to Helensvale's employment mix, local employment is expected to increase by 6.6% over five years and 13.6% over ten years.
Frequently Asked Questions - Employment
Income
Income analysis reveals strong economic positioning, with the area outperforming 60% of locations assessed nationally by AreaSearch
AreaSearch aggregated latest postcode level ATO data released for financial year 2022. Helensvale SA2 had a median income among taxpayers of $52,601 and an average level of $76,062. These figures were above the national averages of $50,780 and $64,844 respectively for Rest of Qld. Based on Wage Price Index growth of 13.99% since financial year 2022, estimated median income as of September 2025 would be approximately $59,960 and average income around $86,703. According to the 2021 Census, household income ranked at the 66th percentile ($2,014 weekly), with personal income at the 47th percentile. The majority of residents (33.6%, or 7,052 people) fell within the $1,500 - 2,999 income bracket, similar to the surrounding region's 31.7%. Housing costs consumed 16.4% of income, but strong earnings placed disposable income at the 65th percentile. The area's SEIFA income ranking was in the 7th decile.
Frequently Asked Questions - Income
Housing
Helensvale is characterized by a predominantly suburban housing profile, with above-average rates of outright home ownership
Helensvale's dwelling structures, as per the latest Census, consisted of 81.4% houses and 18.6% other dwellings (semi-detached, apartments, 'other' dwellings). In comparison, Non-Metro Qld had 80.5% houses and 19.4% other dwellings. Home ownership in Helensvale was at 32.3%, with mortgaged dwellings at 48.0% and rented ones at 19.7%. The median monthly mortgage repayment in the area was $2,098, while the median weekly rent was $495. Nationally, Helensvale's mortgage repayments were higher than the Australian average of $1,863, with rents substantially above the national figure of $375.
Frequently Asked Questions - Housing
Household Composition
Helensvale features high concentrations of family households, with a lower-than-average median household size
Family households account for 80.5% of all households, including 40.1% couples with children, 27.9% couples without children, and 11.4% single parent families. Non-family households constitute the remaining 19.5%, with lone person households at 16.9% and group households comprising 2.7%. The median household size is 2.8 people, which is smaller than the Rest of Qld average of 2.9 people.
Frequently Asked Questions - Households
Local Schools & Education
Helensvale performs slightly above the national average for education, showing competitive qualification levels and steady academic outcomes
Helensvale's educational qualifications trail regional benchmarks, with 23.7% of residents aged 15+ holding university degrees compared to Australia's 30.4%. This gap suggests potential for educational development and skills enhancement. Bachelor degrees are the most common at 16.4%, followed by postgraduate qualifications (5.2%) and graduate diplomas (2.1%). Trade and technical skills are prominent, with 39.0% of residents aged 15+ holding vocational credentials – advanced diplomas (13.2%) and certificates (25.8%).
Educational participation is notably high, with 29.7% of residents currently enrolled in formal education, including 9.5% in secondary education, 9.4% in primary education, and 4.8% pursuing tertiary education.
Frequently Asked Questions - Education
Schools Detail
Nearby Services & Amenities
Transport
Transport servicing is good compared to other areas nationally based on assessment of service frequency, route connectivity and accessibility
Helensvale has 78 active public transport stops offering a mix of train, light rail, and bus services. These stops are served by 32 different routes that facilitate 4,119 weekly passenger trips in total. Residents enjoy good transport accessibility, with an average distance of 356 meters to the nearest stop.
Service frequency across all routes averages 588 trips per day, which translates to about 52 weekly trips per individual stop.
Frequently Asked Questions - Transport
Transport Stops Detail
Health
Helensvale's residents are relatively healthy in comparison to broader Australia with the level of common health conditions among the general population somewhat typical, though higher than the nation's average among older cohorts
Helensvale's health metrics are near national benchmarks. The prevalence of common health conditions among its general population is somewhat typical but higher than the national average among older cohorts.
Private health cover rate is very high at approximately 58% (12,132 people), compared to 52.3% across the rest of Queensland. The most prevalent medical conditions are arthritis and mental health issues, affecting 8.1 and 7.5% of residents respectively, while 69.7% report being completely free from medical ailments, compared to 71.6% in the rest of Queensland. As of June 2021, 16.3% of Helensvale's population is aged 65 and over (3,417 people), higher than the 12.0% in the rest of Queensland. Health outcomes among seniors require more attention than the broader population.
Frequently Asked Questions - Health
Cultural Diversity
The level of cultural diversity witnessed in Helensvale was found to be above average when compared nationally for a number of language and cultural background related metrics
Helensvale's cultural diversity was notable, with 14.9% speaking a language other than English at home and 34.1% born overseas. Christianity was the predominant religion, accounting for 48.6%. Judaism was overrepresented compared to the rest of Queensland, comprising 0.2% versus 0.1%.
The top three ancestry groups were English (31.2%), Australian (22.8%), and Other (7.7%). Notably, New Zealanders were slightly overrepresented at 1.8%, Maori at 1.5%, and South Africans at 0.8% compared to regional averages of 1.9%, 2.9%, and 1.0% respectively.
Frequently Asked Questions - Diversity
Age
Helensvale's population is slightly older than the national pattern
Helensvale's median age is 40, close to Rest of Qld's figure of 41 but exceeding the national norm of 38. The 15-24 age group makes up 14.6% of Helensvale's population compared to Rest of Qld, while the 65-74 cohort is less prevalent at 8.4%. According to the 2021 Census, the 15-24 age group grew from 13.2% to 14.6%, and the 35-44 cohort increased from 13.0% to 14.2%. Conversely, the 45-54 cohort declined from 15.4% to 13.9%. By 2041, demographic modeling suggests Helensvale's age profile will significantly shift. The 25-34 group is projected to grow by 57%, adding 1,370 people to reach 3,782 from 2,411. The 15-24 group is expected to grow more modestly at 9%, adding only 267 residents.
