Chart Color Schemes
This analysis uses ABS Statistical Areas Level 2 (SA2) boundaries, which can materially differ from Suburbs and Localities (SAL) even when sharing similar names.
SA2 boundaries are defined by the Australian Bureau of Statistics and are designed to represent communities for statistical reporting (e.g., census and ERP).
Suburbs and Localities (SAL) represent commonly-used suburb/locality names (postal-style areas) and may use different geographic boundaries. For comprehensive analysis, consider reviewing both boundary types if available.
est. as @ -- *
ABS ERP | -- people | --
2021 Census | -- people
Sales Activity
Curious about local property values? Filter the chart to assess the volume and appreciation (including resales) trends and regional comparisons, or scroll to the map below view this information at an individual property level.
Find a Recent Sale
Sales Detail
Population
Ashmore has seen population growth performance typically on par with national averages when looking at short and medium term trends
Ashmore's population, as of Nov 2025, is approximately 13,072. This figure represents an increase of 657 people since the 2021 Census, which reported a population of 12,415. The change is inferred from ABS data showing an estimated resident population of 12,935 as of June 2024 and an additional 297 validated new addresses since the Census date. This results in a population density ratio of 1,913 persons per square kilometer, higher than average national locations assessed by AreaSearch. Overseas migration was the primary driver of population growth during recent periods.
AreaSearch adopts ABS/Geoscience Australia projections for each SA2 area, released in 2024 with a base year of 2022. For areas not covered and years post-2032, Queensland State Government's SA2 area projections are used, released in 2023 based on 2021 data. However, these state projections do not provide age category splits, so AreaSearch applies proportional growth weightings in line with ABS Greater Capital Region projections for each age cohort. Demographically, locations outside capital cities are projected to have above median population growth. By 2041, Ashmore is expected to grow by 1,864 persons based on the latest annual ERP population numbers, reflecting a total gain of 12.3% over the 17 years.
Frequently Asked Questions - Population
Development
Residential development activity is lower than average in Ashmore according to AreaSearch's national comparison of local real estate markets
Ashmore has received approximately 10 dwelling approvals per year. Over the past five financial years, from FY21 to FY25, around 50 homes were approved, with an additional 41 approved in FY26 so far. Each year, about 4.6 new residents have arrived per dwelling constructed during these five years.
This supply has lagged behind demand, leading to heightened buyer competition and pricing pressures. New homes are being built at an average expected construction cost of $481,000, which is moderately above regional levels, indicating a focus on quality construction. In FY26, commercial approvals totaling $20.5 million have been registered, suggesting balanced commercial development activity. Compared to the rest of Queensland, Ashmore has markedly lower building activity, with 84.0% below the regional average per person. This limited new supply generally supports stronger demand and values for established homes, which is also under the national average, indicating the area's established nature and suggesting potential planning limitations.
Recent development in Ashmore has been entirely comprised of standalone homes, maintaining the area's traditional suburban character with a focus on family homes appealing to those seeking space. New construction favours detached housing more than current patterns suggest, demonstrating ongoing robust demand for family homes despite increasing density pressures. The location has approximately 1309 people per dwelling approval, indicating an established market. According to AreaSearch's latest quarterly estimate, Ashmore is forecasted to gain 1,612 residents by 2041. At current development rates, housing supply may struggle to match population growth, potentially heightening buyer competition and supporting price increases.
Frequently Asked Questions - Development
Infrastructure
Ashmore has very high levels of nearby infrastructure activity, ranking in the top 20% nationally
Changes to local infrastructure significantly influence an area's performance. AreaSearch identified 34 projects likely impacting the region. Key initiatives include The Hills Ashmore, Hart Street Residences, Victoria & Albert Broadbeach, and Pacific Motorway (M1) Upgrades, with the following list detailing those of most relevance.
Professional plan users can use the search below to filter and access additional projects.
INFRASTRUCTURE SEARCH
 Denotes AI-based impression for illustrative purposes only, not to be taken as definitive under any circumstances. Please follow links and conduct other investigations from the project's source for actual imagery. Developers and project owners wishing us to use original imagery please Contact Us and we will do so.
Frequently Asked Questions - Infrastructure
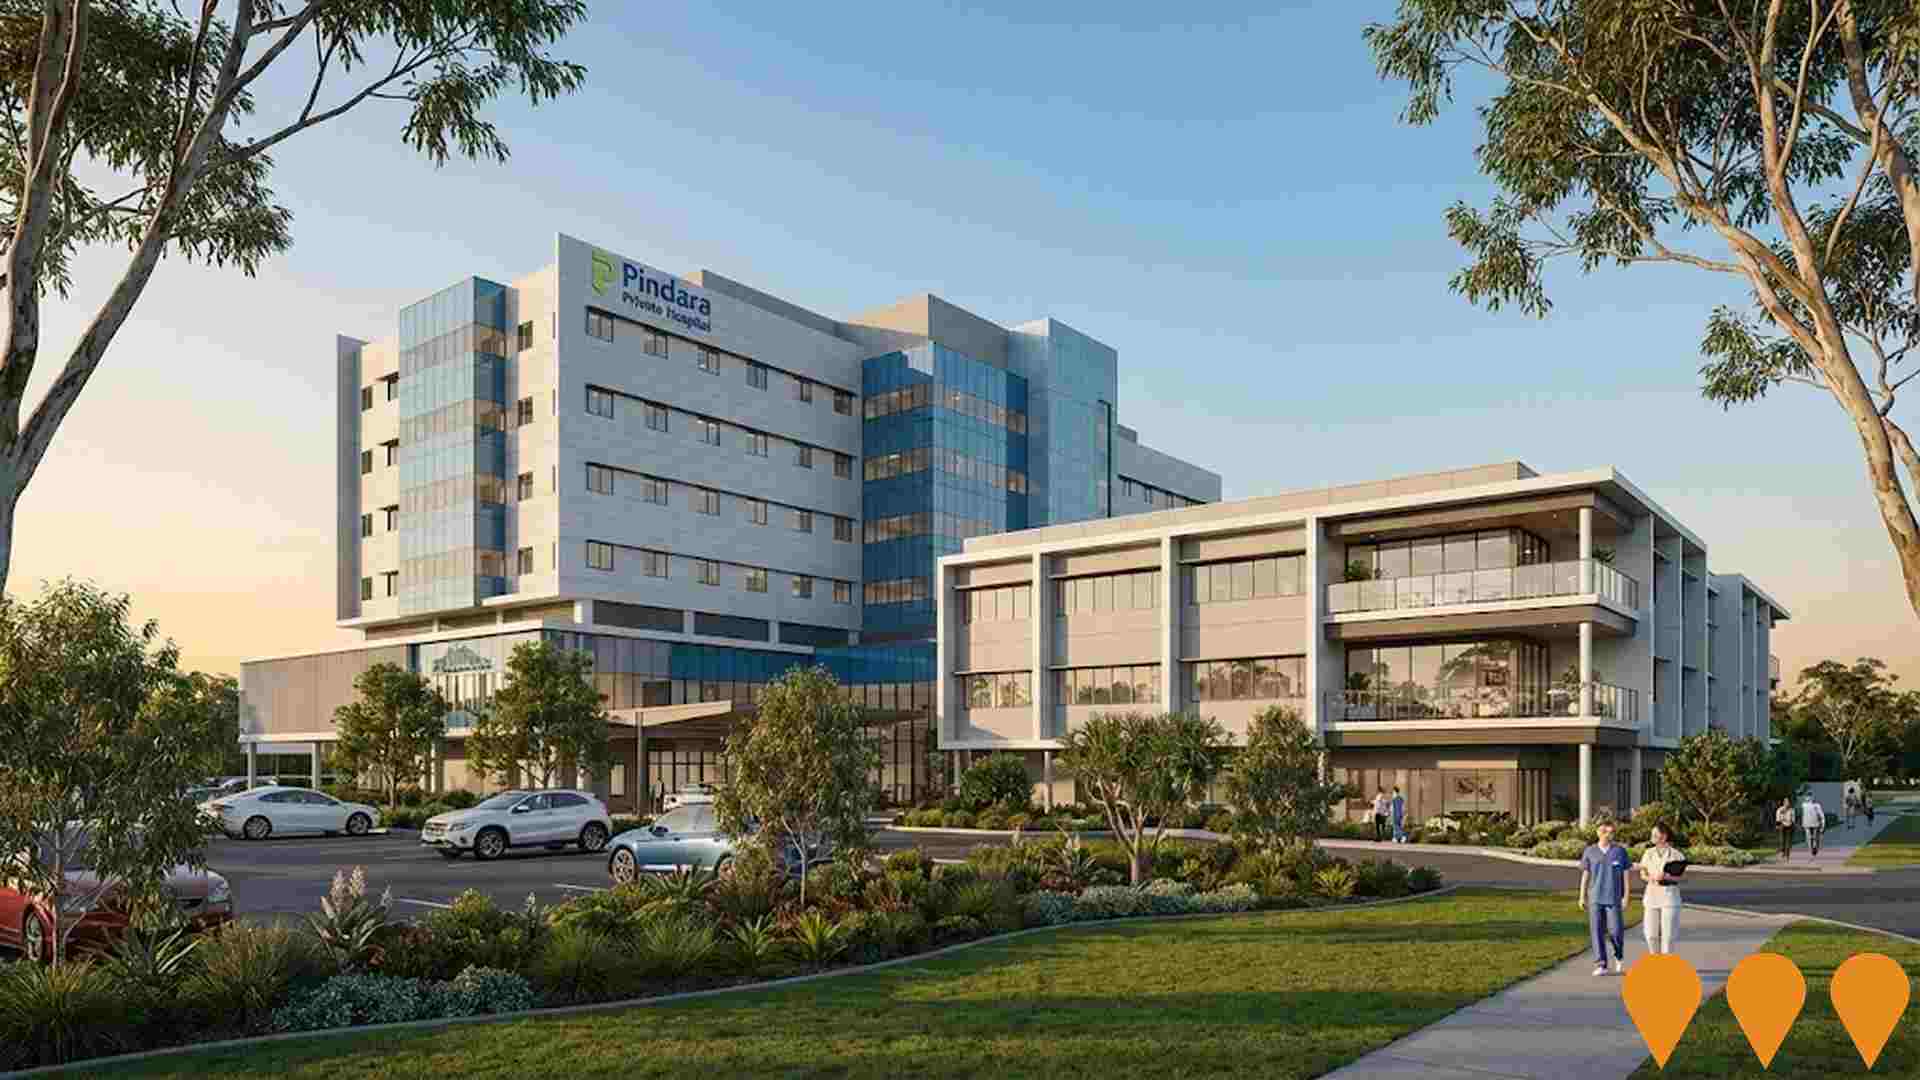
Pindara Private Hospital Stage 3 Expansion
The Stage 3 expansion of Pindara Private Hospital involved the southern extension of the Dr David Lindsay Wing, adding two luxurious wards with spacious private ensuited rooms and two new cutting-edge operating theatres. This increased the total licensed beds to 348, enhanced medical services, and expanded capacity for Day Infusion and Renal Dialysis Services.
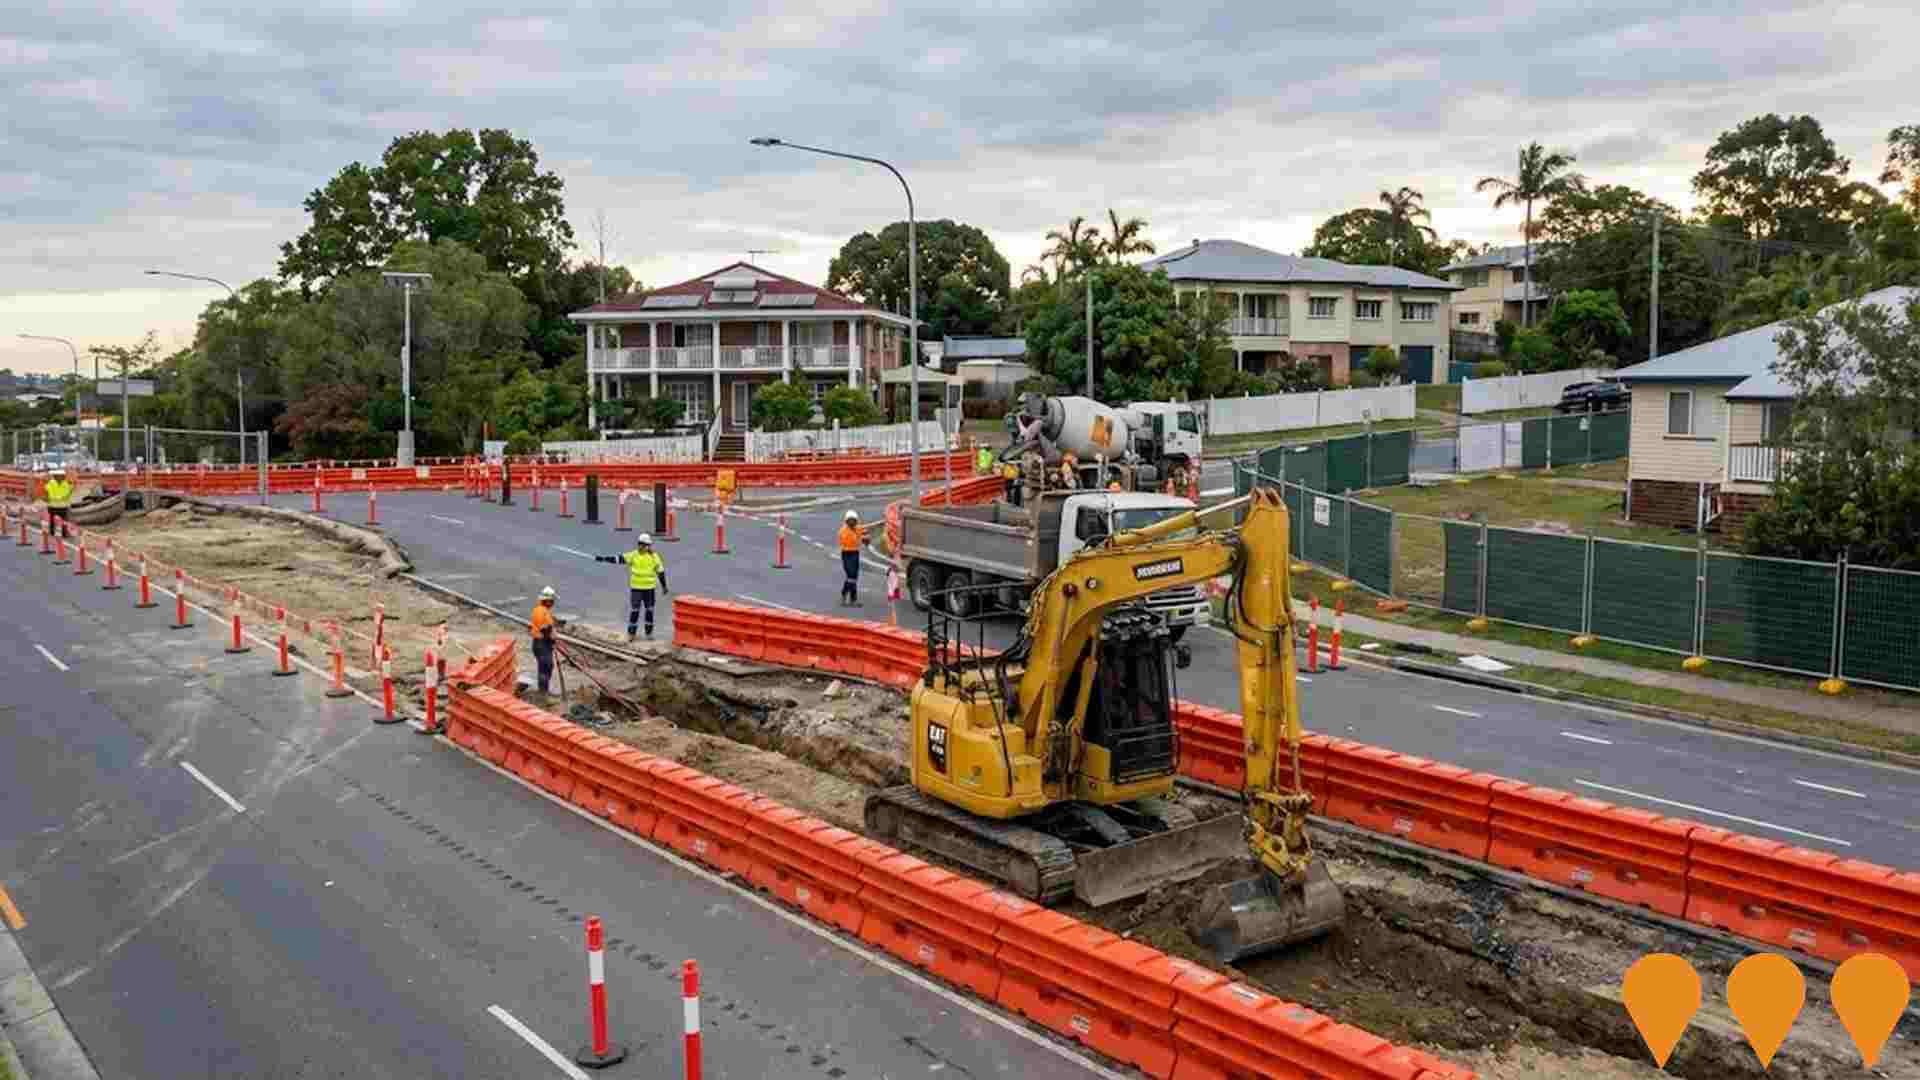
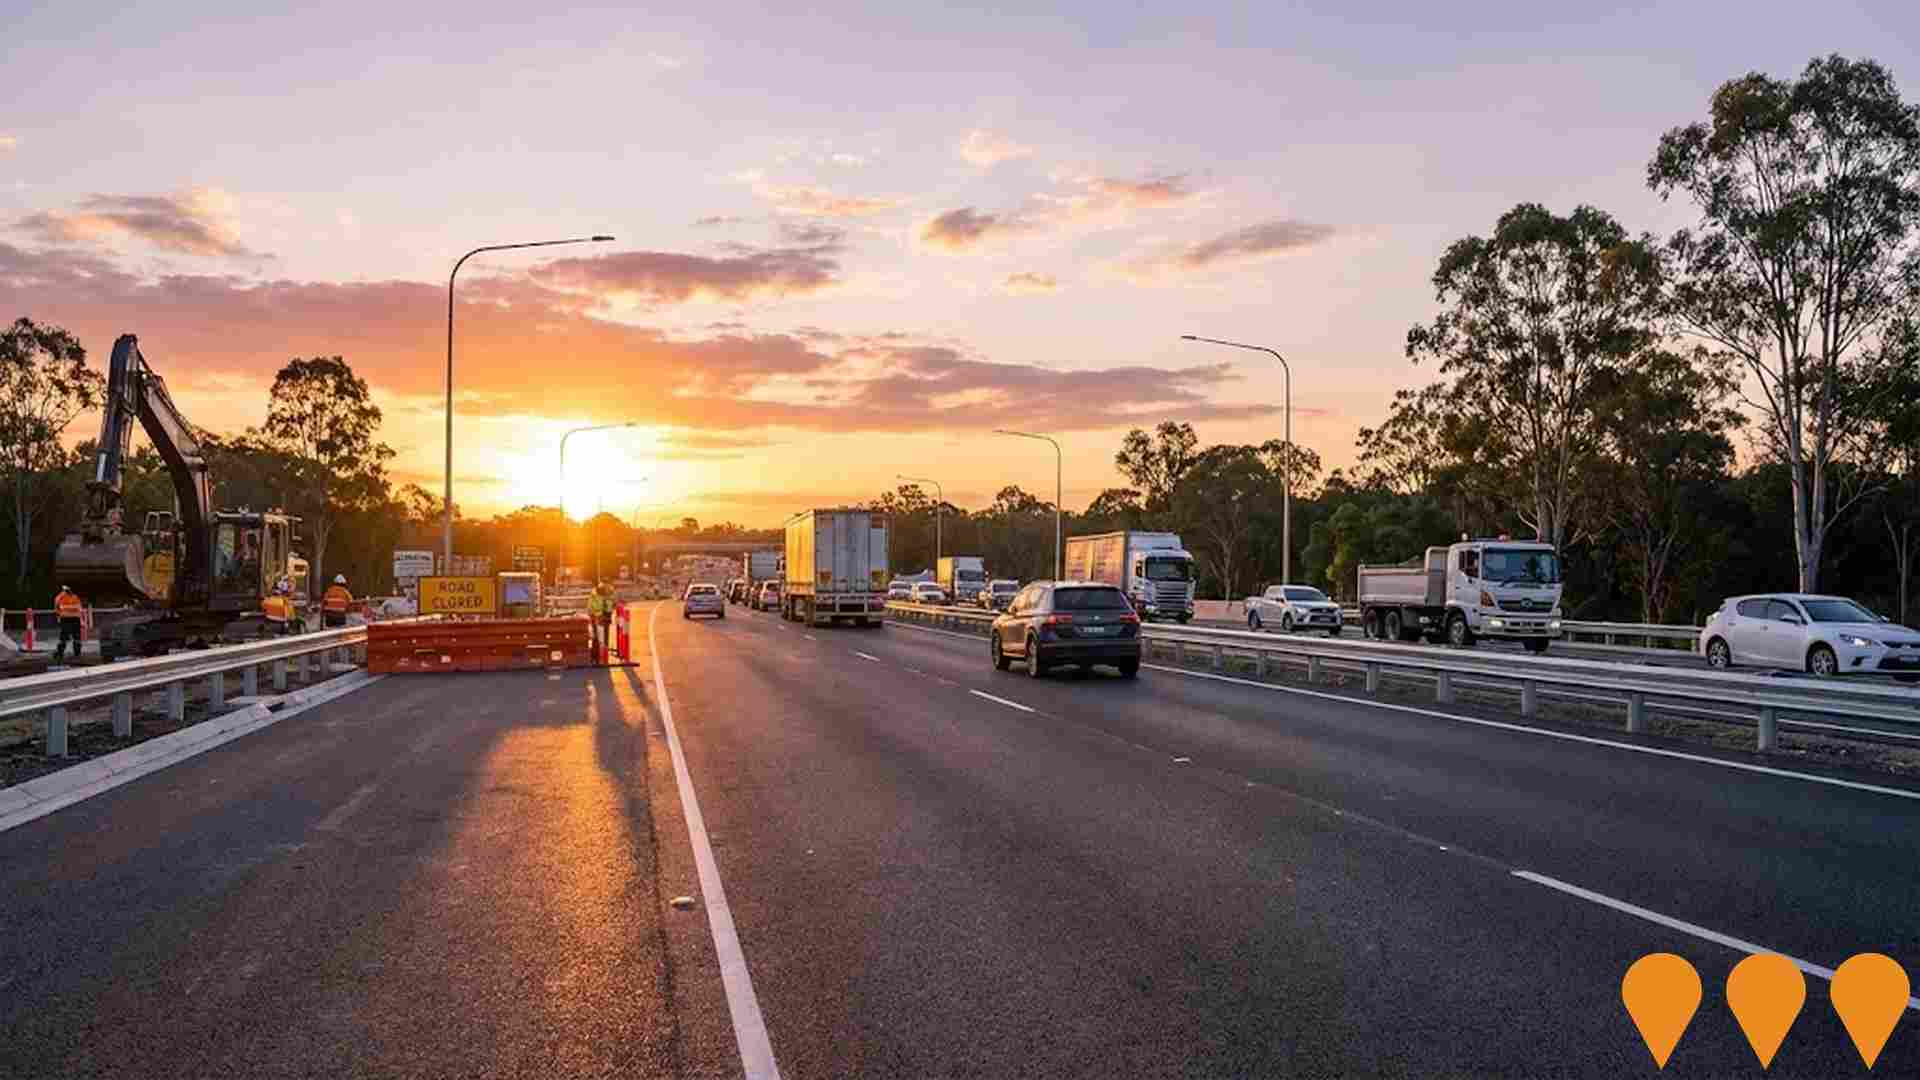
Pacific Motorway (M1) Upgrades
Rolling upgrades to the Pacific Motorway (M1) corridor between Brisbane and the Gold Coast to improve safety, capacity and travel time reliability. Current focus areas include Eight Mile Plains to Daisy Hill (Stage 2, multi-package works), Varsity Lakes to Tugun (VL2T, packages B and C opening progressively from 2024), plus planning for Daisy Hill to Logan Motorway (Stage 3). Works include additional lanes, interchange upgrades, widened creek bridges, active transport links and smart motorway systems.
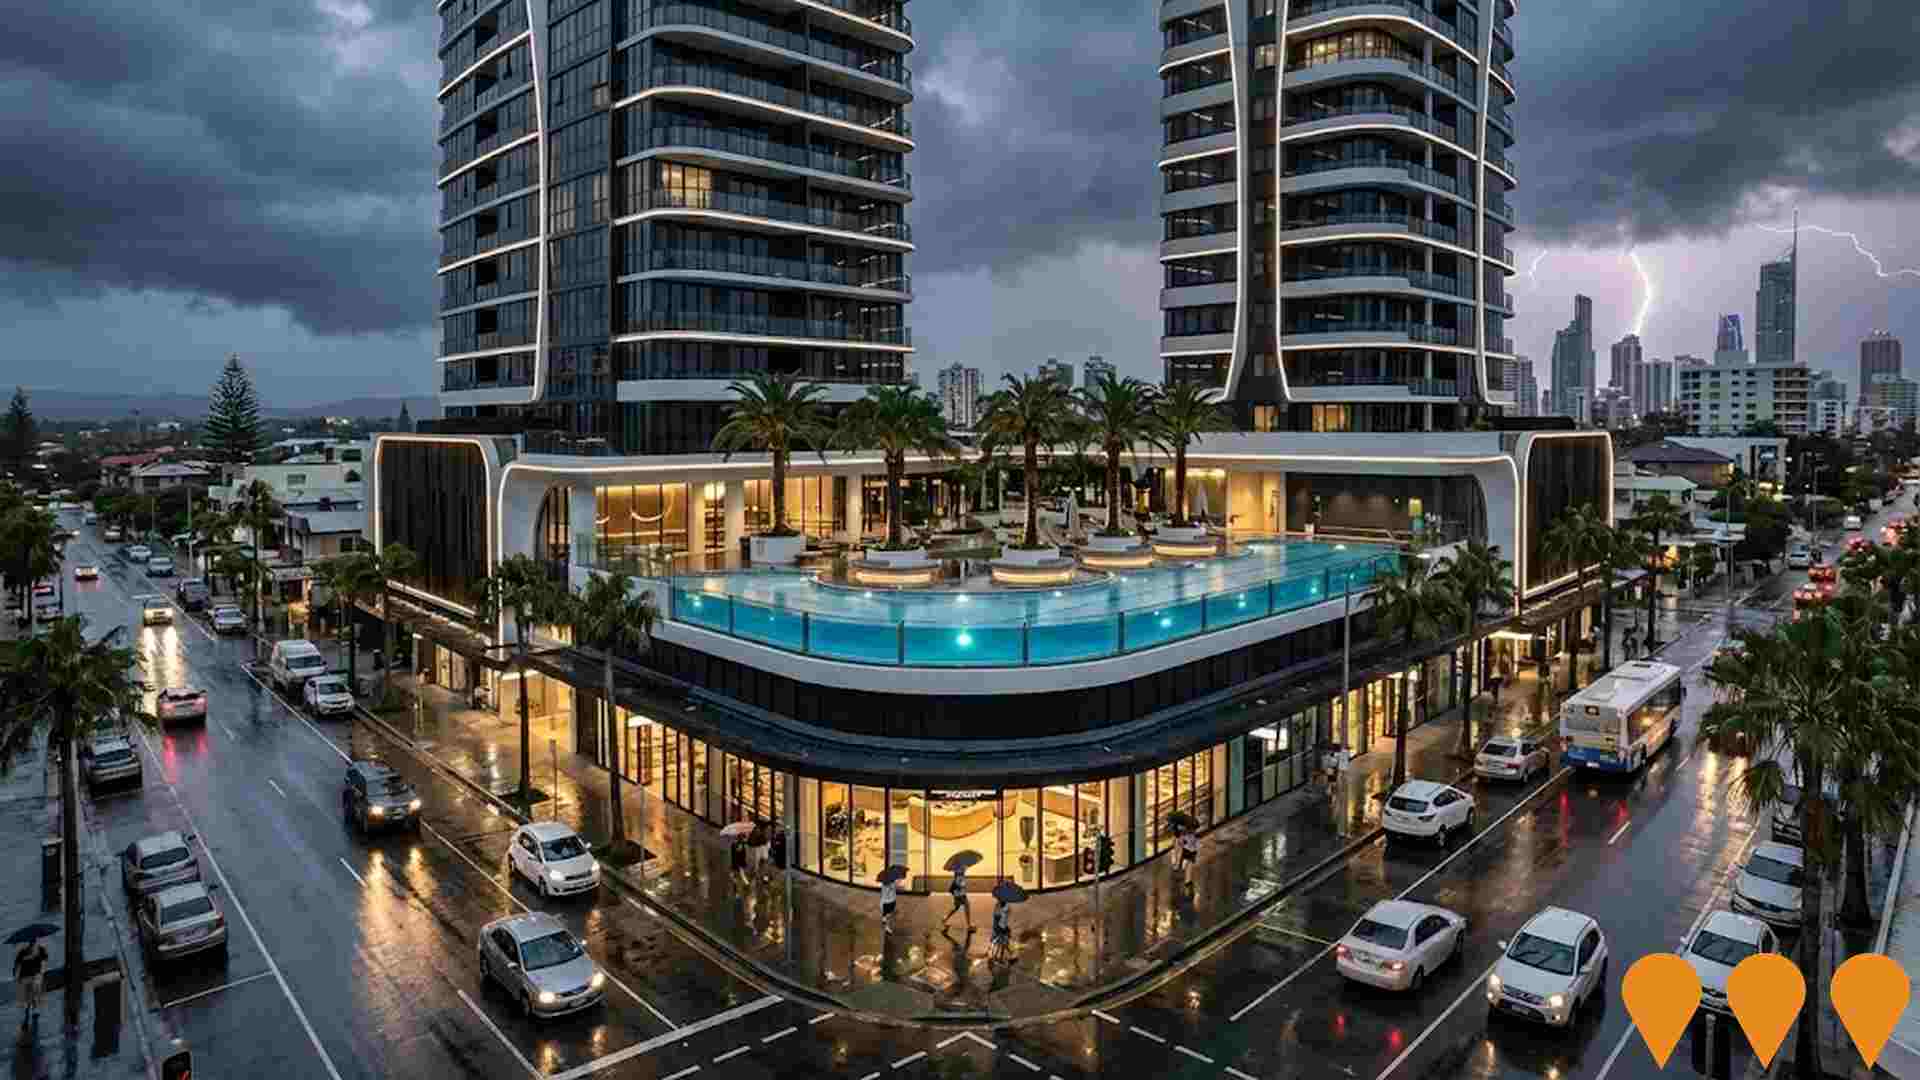
Paradiso Place
Landmark $800 million three-tower development featuring 792 apartments across 38, 40 and 42-storey towers. Located on former King Tutt's Putt Putt site with ground-level retail plaza, suspended glass-bottom lap pool, and smart home technology integration.
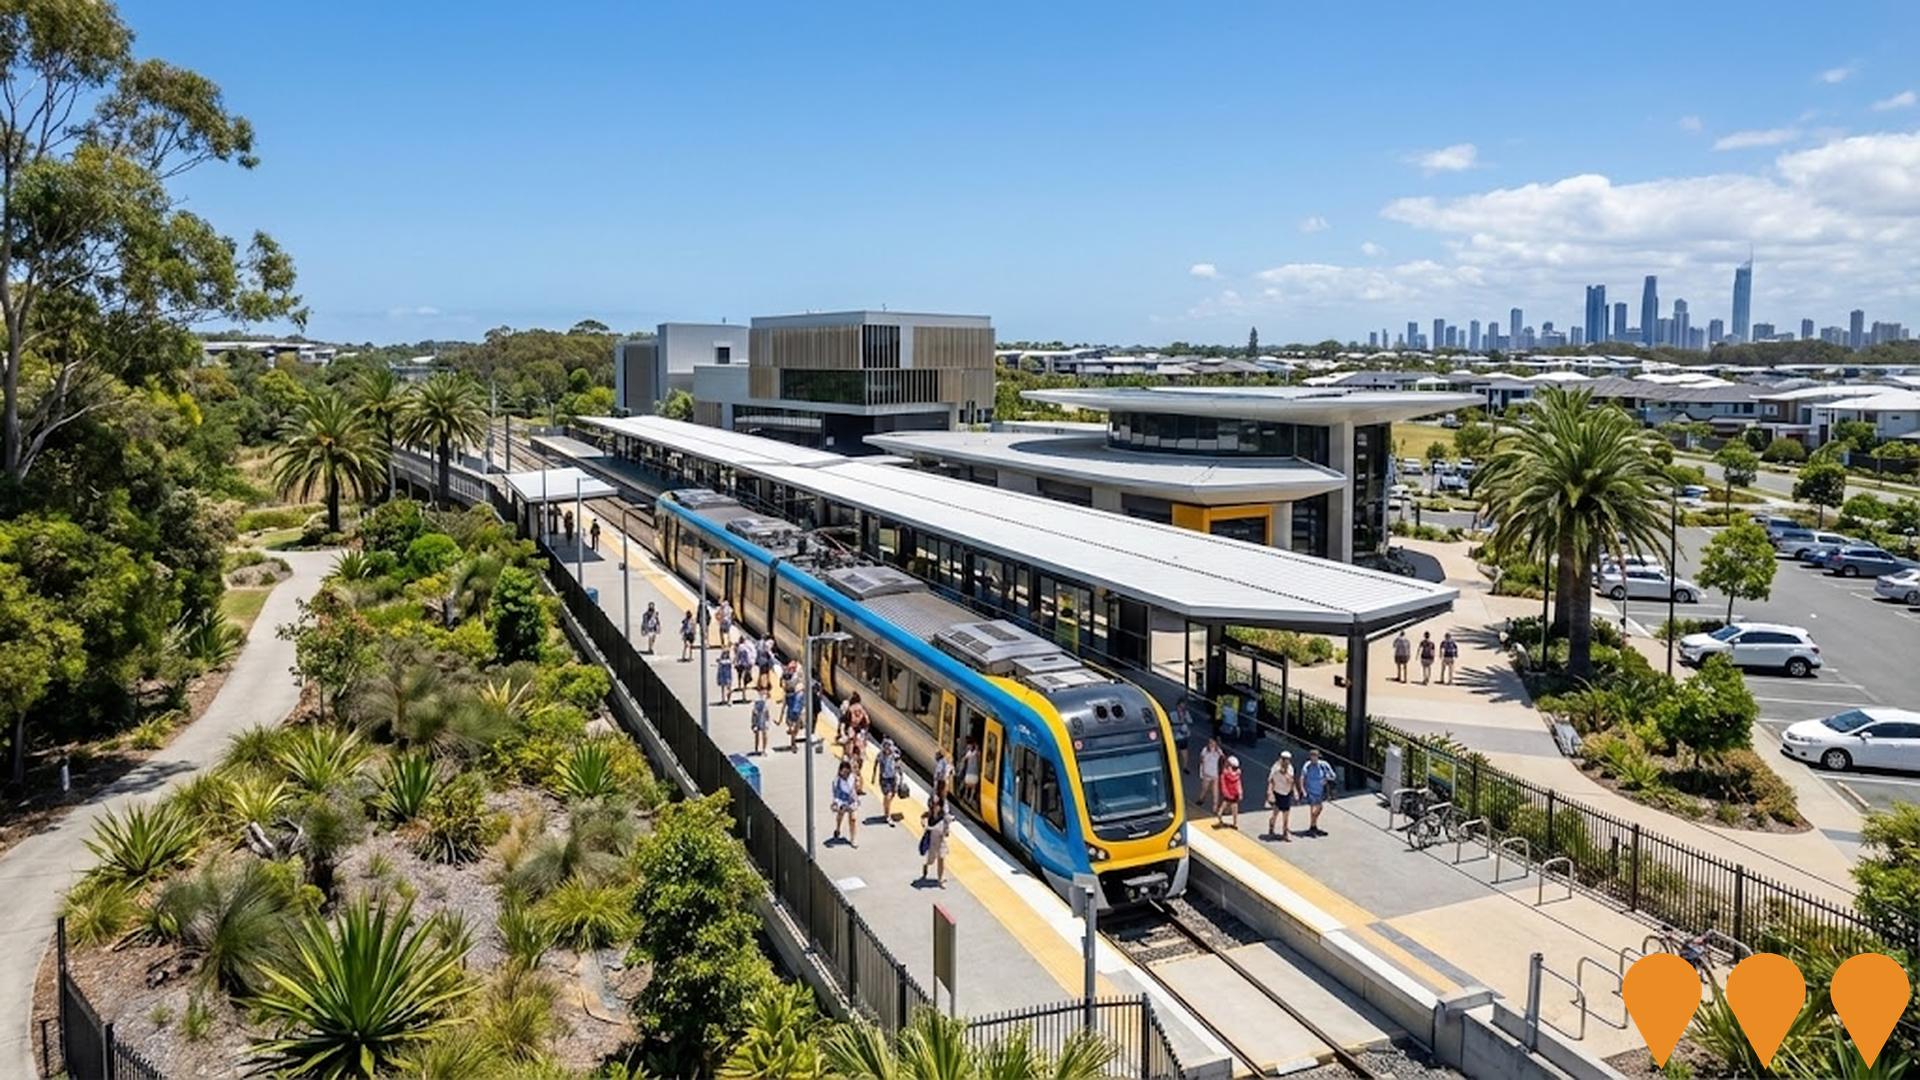
Cross River Rail - New Gold Coast Stations
Three new stations are being delivered on the Gold Coast line at Pimpama, Hope Island and Merrimac by the Cross River Rail Delivery Authority. Each station includes parking and set-down areas, accessible lifts and wayfinding, pedestrian and cycle connections, public transport integration and upgraded lighting and CCTV. Major construction is underway at all three sites, with ADCO Constructions delivering Pimpama, Acciona Georgiou JV delivering Hope Island and Fulton Hogan delivering Merrimac.
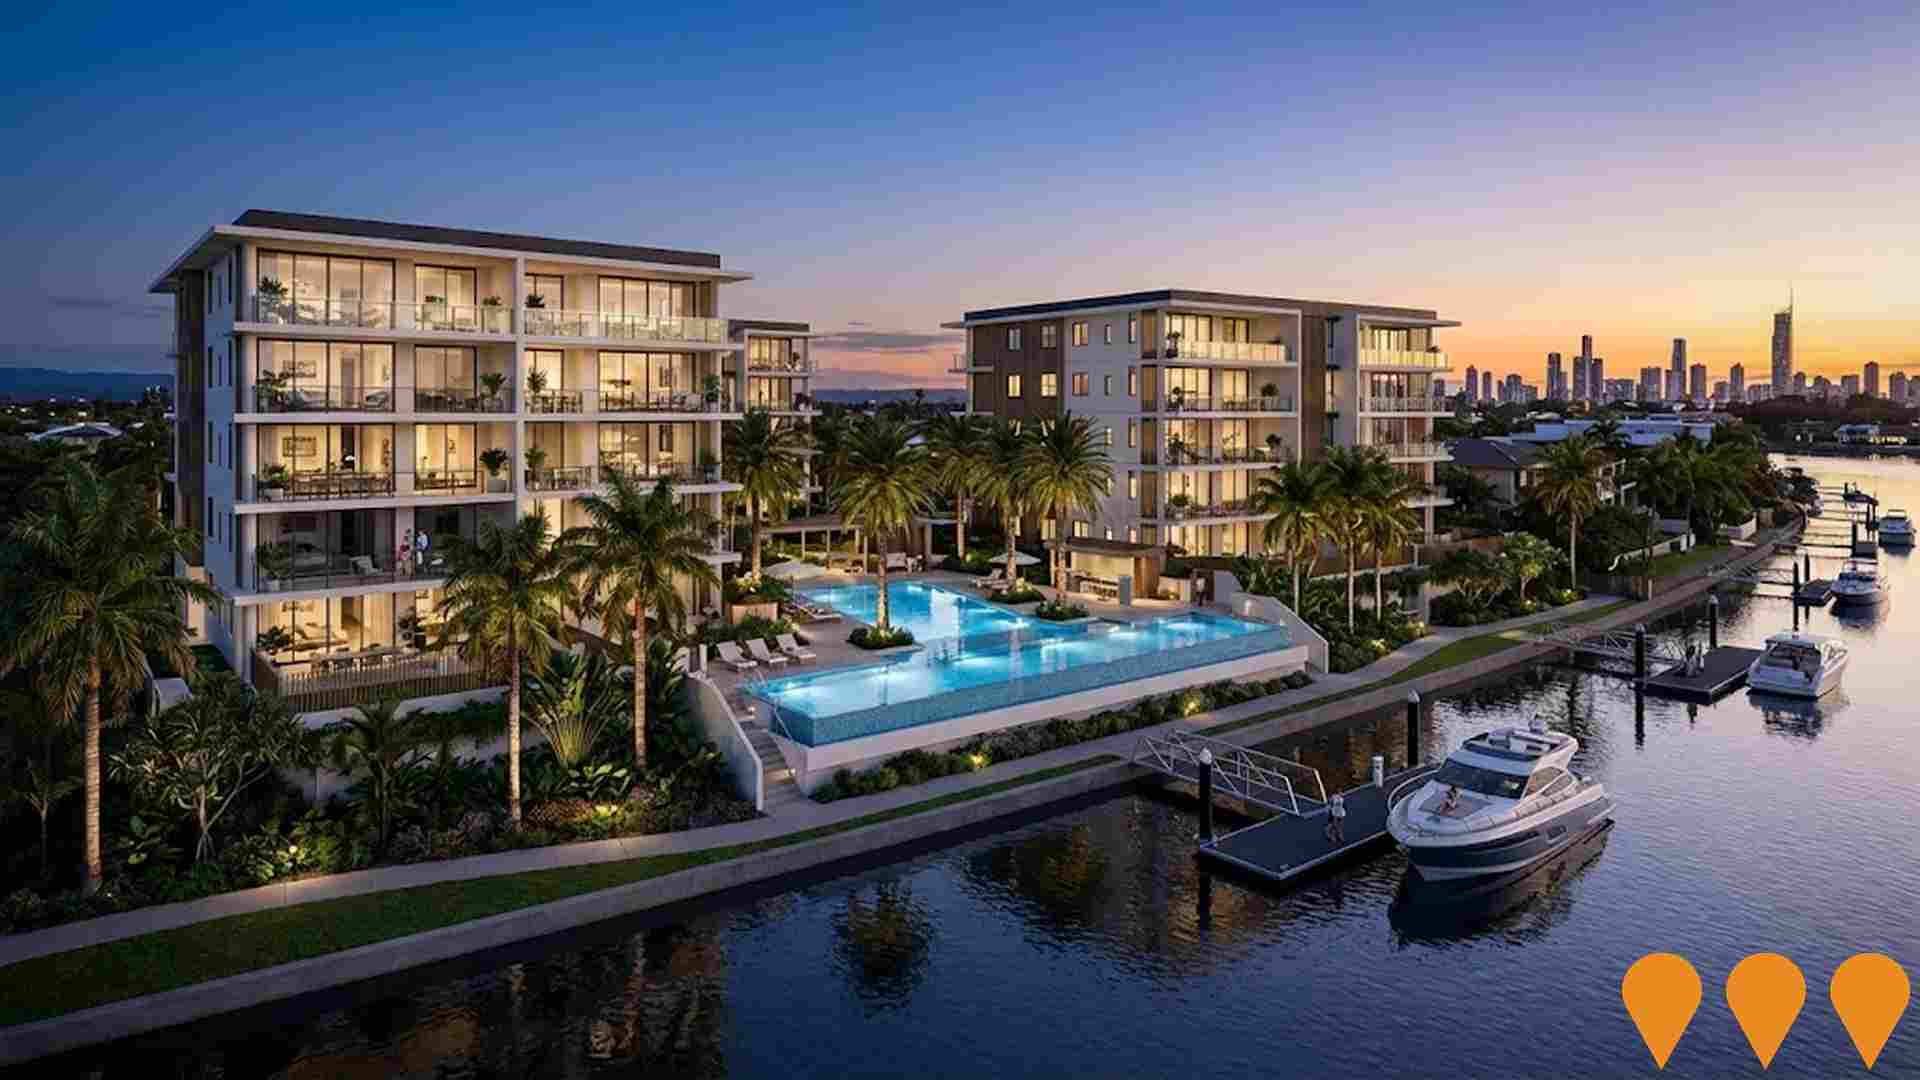
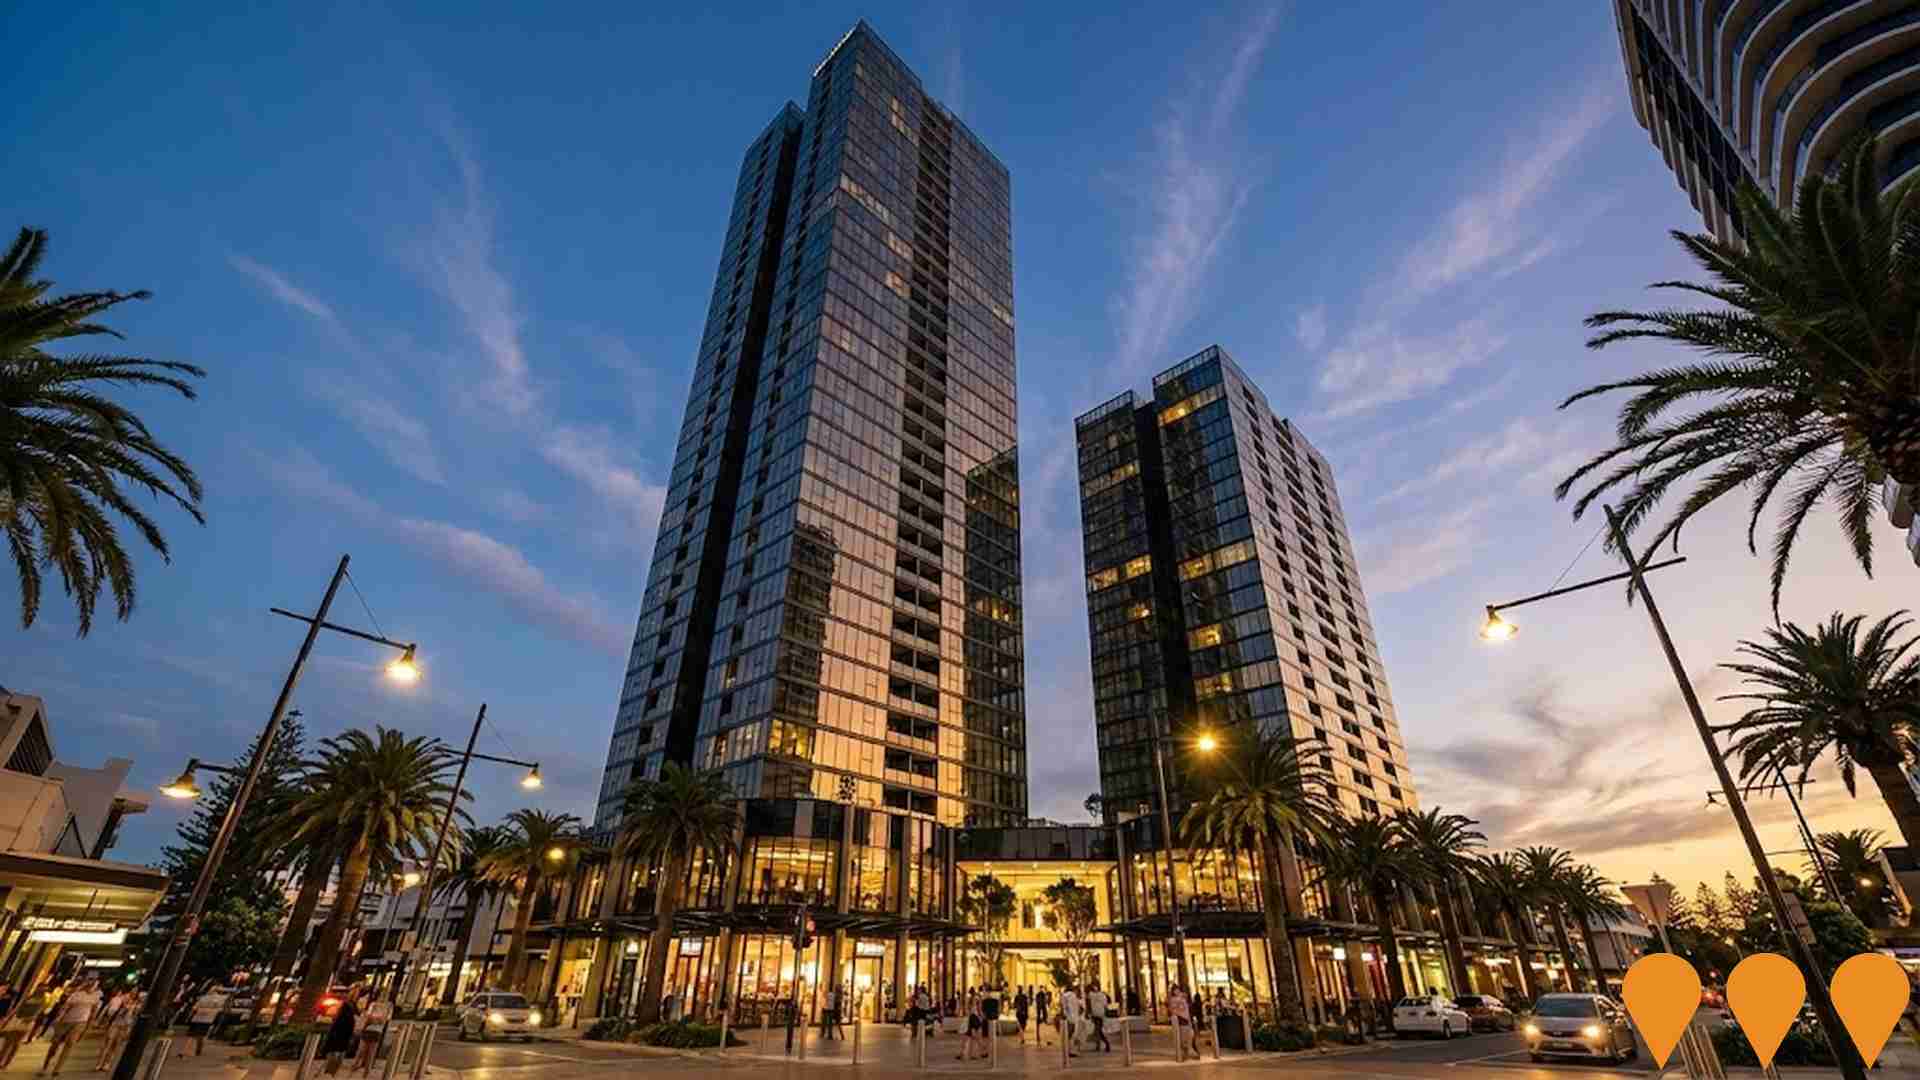
Victoria & Albert Broadbeach
$800 million transformation of landmark Niecon Plaza site featuring 398 apartments across two towers of 56 and 40 storeys. Mixed-use development includes premium offices, commercial facilities, and fresh food and dining retail at street level.
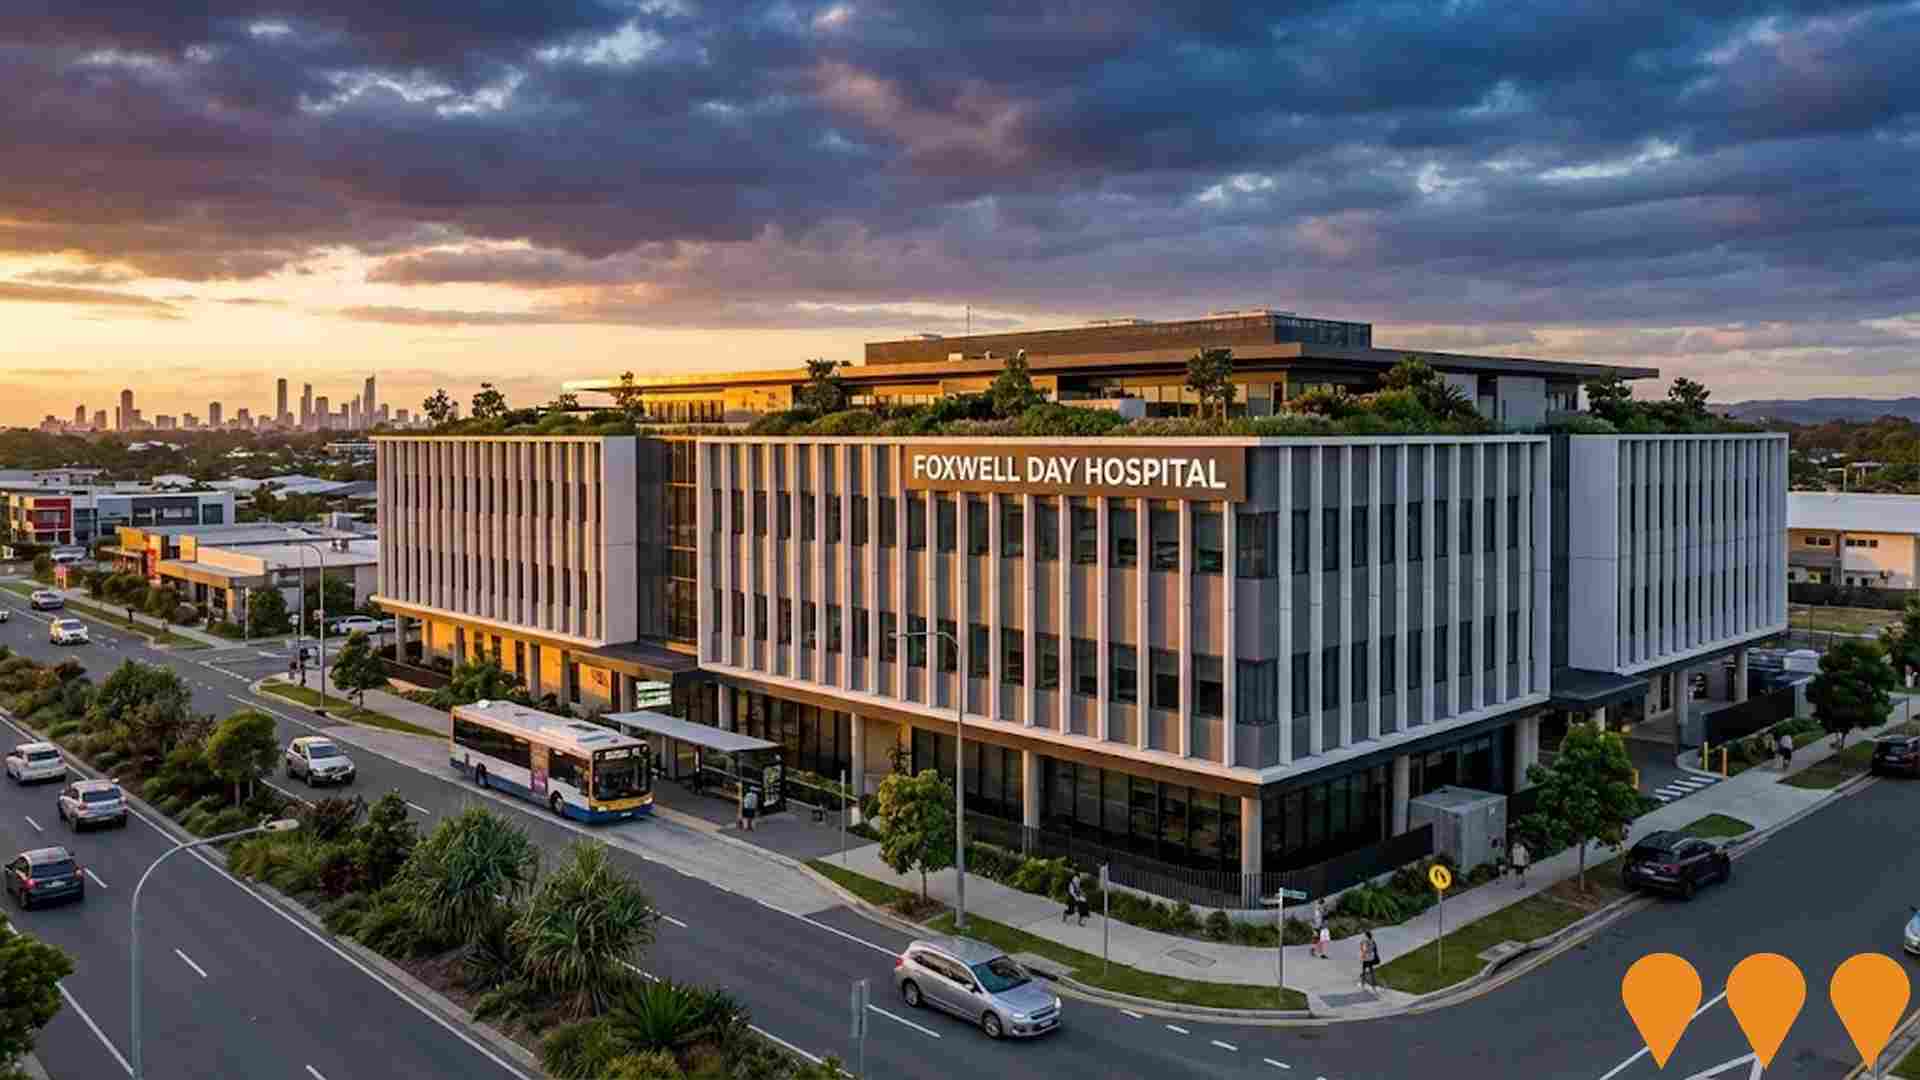
Foxwell Day Hospital & Health Precinct
400-bed private hospital and comprehensive health precinct by Keylin and Kinstone Group. Features ambulatory care, surgical facilities, and medical services. Part of $1.5 billion Foxwell Coomera masterplan development.
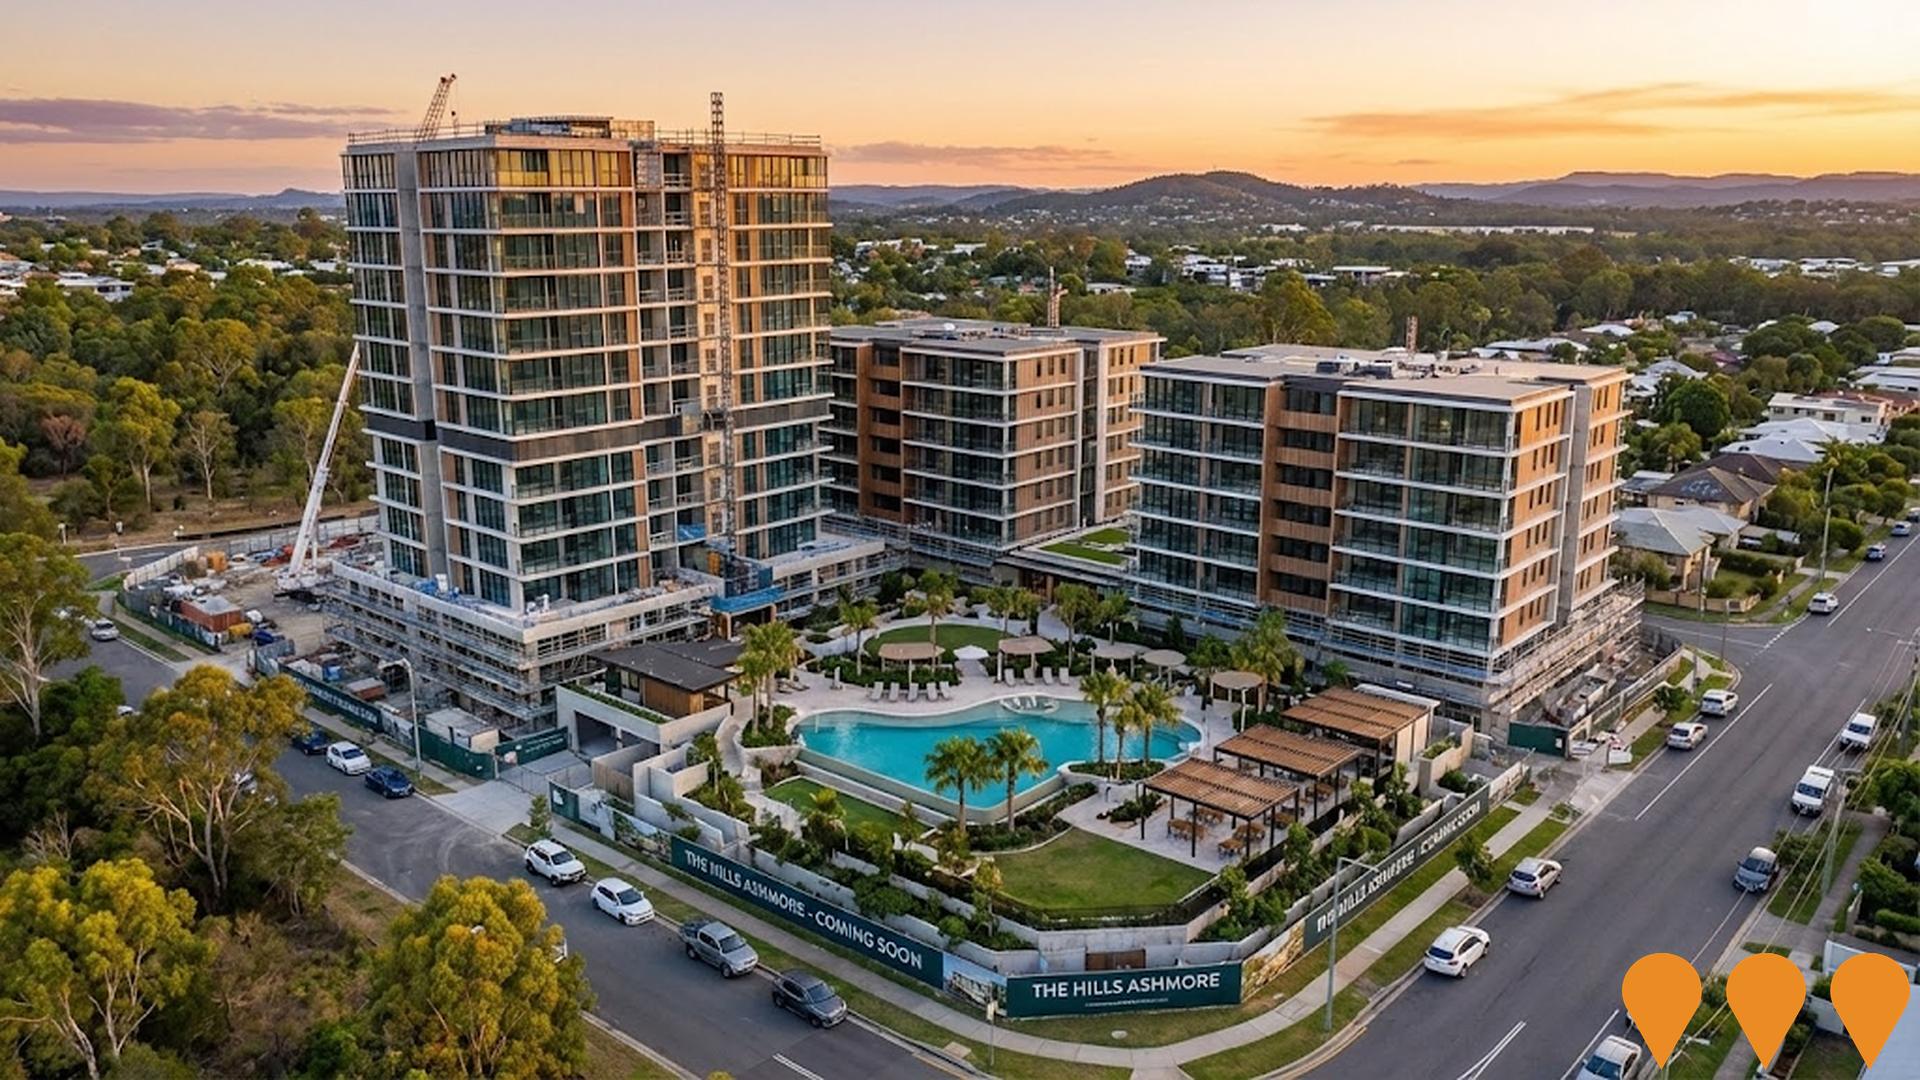
The Hills Ashmore
Mixed-use redevelopment comprising three midrise buildings (one 10-storey and two 7-storey) with 210 apartments and 1,420 sqm of retail/commercial space. Features central resort-style amenities including pool, lounge, barbecue facilities, outdoor dining areas, and landscaped breakout spaces. The development replaces the previously approved Ashmore Markets retail project due to viability concerns.
Coomera Connector Stage 1 South
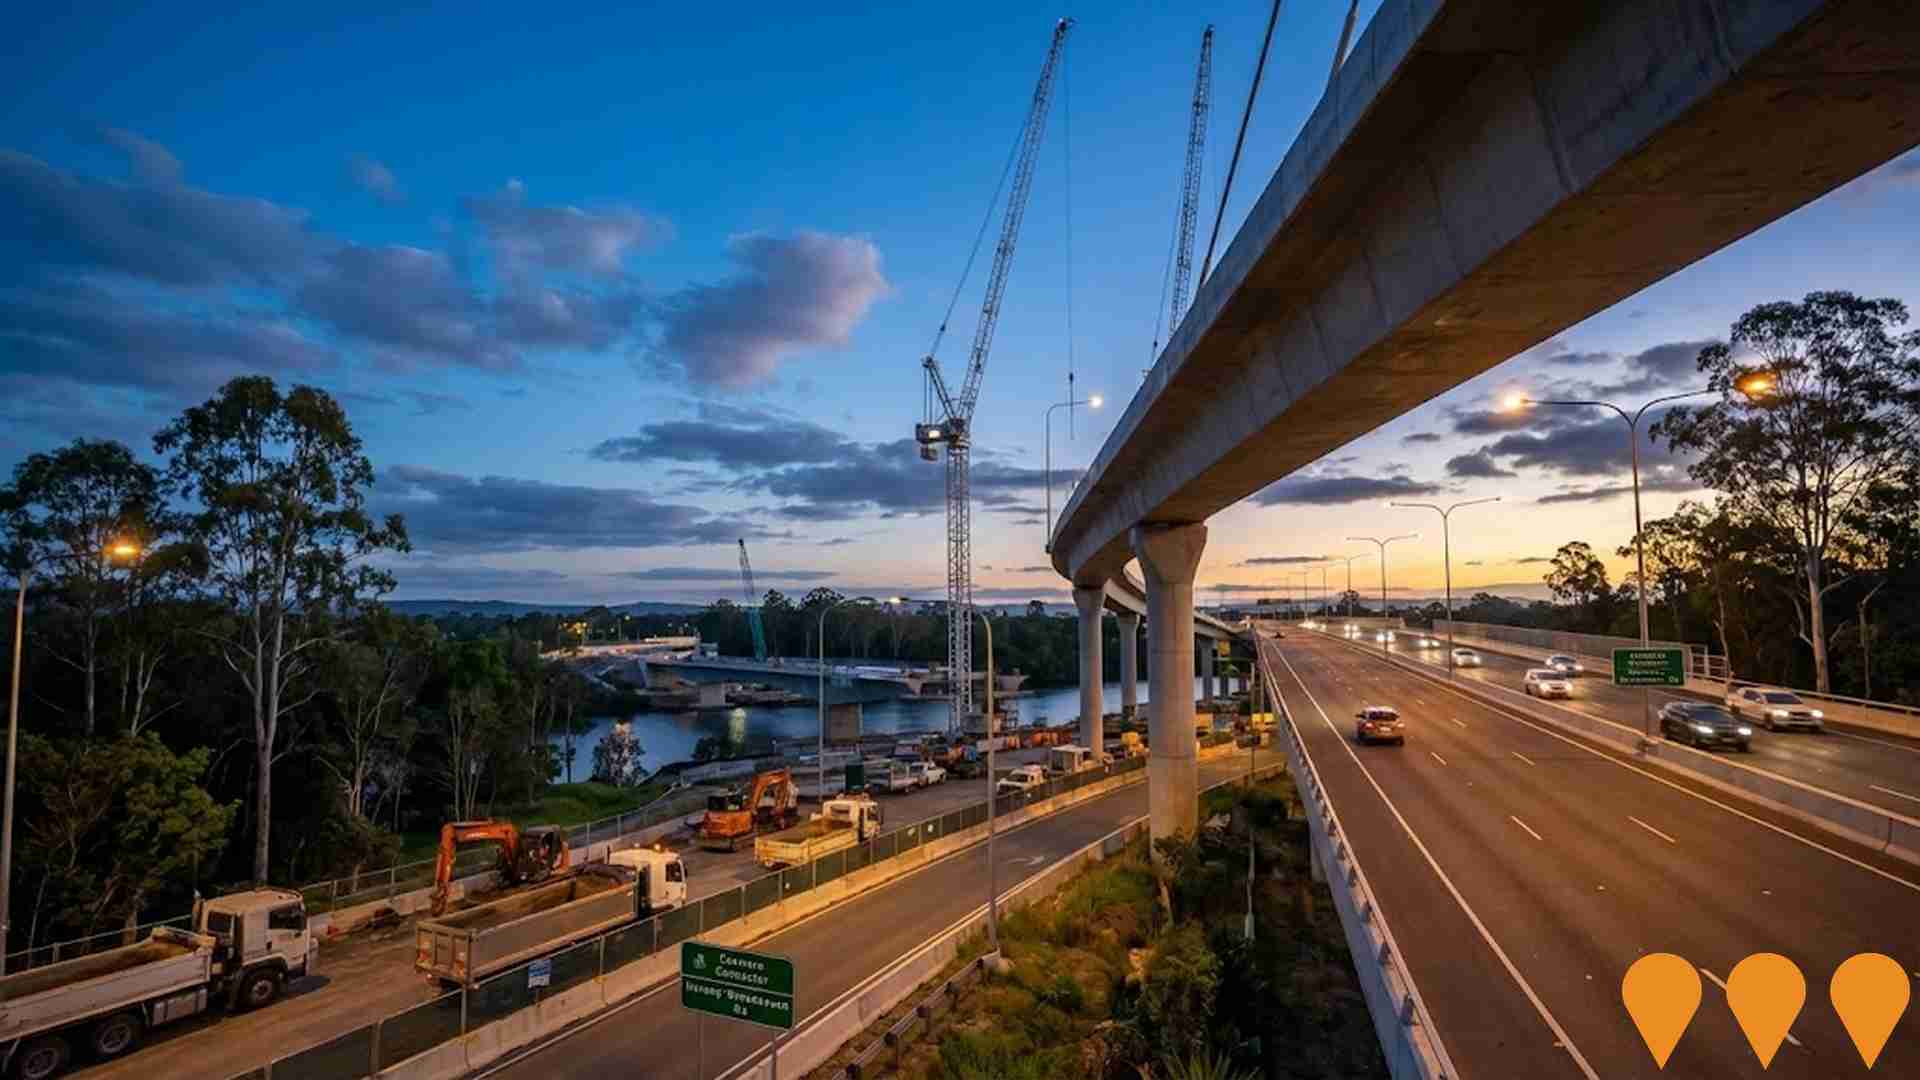
Stage 1 South delivers a new four lane motorway from Smith Street Motorway to Nerang-Broadbeach Road, including a new grade separated interchange at Southport-Nerang Road, a new intersection at Nerang-Broadbeach Road, and an approx. 300 m bridge over the Nerang River. Early works are underway and the main construction contract has been awarded, with construction commenced mid 2025.
Employment
The employment environment in Ashmore shows above-average strength when compared nationally
Ashmore's unemployment rate was 3.2% as of the past year, with an estimated employment growth of 2.3%. As of September 2025, 6,918 residents were employed, with an unemployment rate of 0.9% below Rest of Qld's rate of 4.1%.
Workforce participation was on par with Rest of Qld's 59.1%. The dominant employment sectors included health care & social assistance, construction, and retail trade. Professional & technical services had notable concentration at 1.5 times the regional average, while agriculture, forestry & fishing had limited presence at 0.5% compared to 4.5% regionally. Employment increased by 2.3% over a 12-month period alongside labour force growth of 2.1%, causing unemployment rate to fall by 0.3 percentage points.
State-level data to 25-Nov shows QLD employment contracted by 0.01% with state unemployment rate at 4.2%. National employment forecasts from May-25 project national employment expansion by 6.6% over five years and 13.7% over ten years, suggesting local employment should increase by 6.8% over five years and 13.9% over ten years based on Ashmore's employment mix.
Frequently Asked Questions - Employment
Income
Income levels sit below national averages according to AreaSearch assessment
AreaSearch reports median taxpayer income in Ashmore SA2 was $48,928 and average income was $63,614 based on postcode level ATO data for financial year 2022. These figures are slightly below national averages of $50,780 and $64,844 respectively in Rest of Qld. By September 2025, estimated median income would be approximately $55,773 and average income $72,514, adjusted for Wage Price Index growth of 13.99% since financial year 2022. According to the 2021 Census, incomes in Ashmore rank modestly, between 37th and 40th percentiles for household, family, and personal incomes. The most common income bracket is $1,500 - $2,999, with 31.3% of locals (4,091 people) falling into this category, similar to surrounding regions at 31.7%. Income remaining after housing costs ranks at the 37th percentile, with only 80.9% of income left over. Ashmore's SEIFA income ranking places it in the 5th decile.
Frequently Asked Questions - Income
Housing
Ashmore displays a diverse mix of dwelling types, with above-average rates of outright home ownership
The dwelling structure in Ashmore, as per the latest Census, consisted of 68.6% houses and 31.4% other dwellings (semi-detached, apartments, 'other' dwellings), compared to Non-Metro Qld's 44.5% houses and 55.5% other dwellings. Home ownership in Ashmore was at 33.0%, with mortgaged dwellings at 41.6% and rented dwellings at 25.4%. The median monthly mortgage repayment in the area was $1,950, higher than Non-Metro Qld's average of $1,750. The median weekly rent figure in Ashmore was recorded at $450, compared to Non-Metro Qld's $420. Nationally, Ashmore's mortgage repayments were higher than the Australian average of $1,863, while rents were substantially above the national figure of $375.
Frequently Asked Questions - Housing
Household Composition
Ashmore features high concentrations of group households, with a higher-than-average median household size
Family households account for 69.5% of all households, including 30.6% couples with children, 25.6% couples without children, and 12.2% single parent families. Non-family households make up the remaining 30.5%, with lone person households at 26.1% and group households comprising 4.3%. The median household size is 2.5 people, larger than the Rest of Qld average of 2.3 people.
Frequently Asked Questions - Households
Local Schools & Education
The educational profile of Ashmore exceeds national averages, with above-average qualification levels and academic performance metrics
The area's educational profile is notable regionally, with university qualification rates at 26.0% of residents aged 15+, surpassing the Rest of Qld average of 20.6%. Bachelor degrees are most prevalent at 18.1%, followed by postgraduate qualifications (5.6%) and graduate diplomas (2.3%). Vocational credentials are prominent, with 38.9% of residents aged 15+ holding them – advanced diplomas at 14.0% and certificates at 24.9%.
Educational participation is high, with 32.1% of residents currently enrolled in formal education. This includes 10.0% in primary education, 9.2% in secondary education, and 6.1% pursuing tertiary education.
Frequently Asked Questions - Education
Schools Detail
Nearby Services & Amenities
Transport
Transport servicing is moderate compared to other areas nationally based on assessment of service frequency, route connectivity and accessibility
The public transport analysis indicates that there are 52 active transport stops currently operating within Ashmore. These stops offer a variety of bus services, which are serviced by 7 individual routes in total. Collectively, these routes provide 1,035 weekly passenger trips.
The accessibility of the transport system is rated as excellent, with residents typically located approximately 195 meters from the nearest transport stop. On average, service frequency across all routes amounts to 147 trips per day, equating to around 19 weekly trips per individual stop.
Frequently Asked Questions - Transport
Transport Stops Detail
Health
Ashmore's residents are relatively healthy in comparison to broader Australia with common health conditions slightly more prevalent than average across both younger and older age cohorts
Ashmore's health metrics are near national benchmarks.
Common health conditions are slightly more prevalent than average across both younger and older age groups. Private health cover rate is approximately 51% of the total population (around 6,692 people), which is lower than the average for SA2 areas. The most common medical conditions in the area are arthritis and mental health issues, affecting 8.8% and 7.4% of residents respectively. About 69.2% of residents report being completely free from medical ailments, compared to 69.4% in Rest of Qld. The area has 20.5% of residents aged 65 and over (around 2,678 people), which is higher than the 17.1% in Rest of Qld. This aligns broadly with the general population's health profile.
Frequently Asked Questions - Health
Cultural Diversity
The level of cultural diversity witnessed in Ashmore was found to be above average when compared nationally for a number of language and cultural background related metrics
Ashmore's population was found to be more linguistically diverse than most local markets, with 15.1% speaking a language other than English at home as of 2016 Census data. Additionally, 31.8% were born overseas. Christianity was the predominant religion in Ashmore, making up 49.0% of its population.
However, Judaism was overrepresented compared to broader Queensland figures, comprising 0.3% of Ashmore's population versus 0.2%. In terms of ancestry, the top three groups were English (30.1%), Australian (21.8%), and Other (9.2%). Notably, New Zealanders were overrepresented at 1.7%, compared to 1.4% regionally, while Maori were equally represented at 1.6%. Hungarian ancestry was also slightly overrepresented at 0.4%, versus 0.3% across Queensland.
Frequently Asked Questions - Diversity
Age
Ashmore's median age exceeds the national pattern
The median age in Ashmore is 42 years, close to Rest of Qld's average of 41 years but well above Australia's median of 38 years. Compared to Rest of Qld's average, the 35-44 age cohort is notably over-represented in Ashmore at 14.7%, while the 55-64 year-olds are under-represented at 10.5%. Between the 2021 Census and present day, the 35 to 44 age group has grown from 13.1% to 14.7% of Ashmore's population, while the 25 to 34 cohort increased from 11.3% to 12.4%. Conversely, the 65 to 74 cohort has declined from 10.5% to 9.0%, and the 55 to 64 group dropped from 11.6% to 10.5%. Population forecasts for Ashmore in 2041 indicate substantial demographic changes, with the 25 to 34 age cohort projected to expand by 608 people (37%) from 1,624 to 2,233. Meanwhile, the 65 to 74 and 15 to 24 cohorts are expected to experience population declines.
