Chart Color Schemes
This analysis uses ABS Statistical Areas Level 2 (SA2) boundaries, which can materially differ from Suburbs and Localities (SAL) even when sharing similar names.
SA2 boundaries are defined by the Australian Bureau of Statistics and are designed to represent communities for statistical reporting (e.g., census and ERP).
Suburbs and Localities (SAL) represent commonly-used suburb/locality names (postal-style areas) and may use different geographic boundaries. For comprehensive analysis, consider reviewing both boundary types if available.
est. as @ -- *
ABS ERP | -- people | --
2021 Census | -- people
Sales Activity
Curious about local property values? Filter the chart to assess the volume and appreciation (including resales) trends and regional comparisons, or scroll to the map below view this information at an individual property level.
Find a Recent Sale
Sales Detail
Population
Benowa lies within the top quartile of areas nationally for population growth performance according to AreaSearch analysis of recent, and medium to long-term trends
Benowa's population is approximately 10,678 as of November 2025. This represents an increase of 789 people, or 8.0%, since the 2021 Census which reported a population of 9,889 people. The change is inferred from the estimated resident population of 10,660 from the ABS as of June 2024 and an additional 215 validated new addresses since the Census date. This results in a population density ratio of 1,630 persons per square kilometer, higher than the average seen across national locations assessed by AreaSearch. Over the past decade, Benowa has shown resilient growth patterns with a compound annual growth rate of 2.0%, outperforming non-metro areas. Population growth was primarily driven by overseas migration contributing approximately 71.3% of overall population gains during recent periods.
AreaSearch adopts ABS/Geoscience Australia projections for each SA2 area, released in 2024 with a base year of 2022. For areas not covered and years post-2032, Queensland State Government's SA2 area projections are used, released in 2023 based on 2021 data. However, these state projections do not provide age category splits, so AreaSearch applies proportional growth weightings in line with the ABS Greater Capital Region projections for each age cohort, released in 2023 based on 2022 data. Considering projected demographic shifts, an above median population growth of locations outside capital cities is projected, with Benowa expected to increase by 2,289 persons to 2041 based on the latest annual ERP population numbers, reflecting a total increase of 21.3% over the 17 years.
Frequently Asked Questions - Population
Development
Residential development activity is slightly higher than average within Benowa when compared nationally
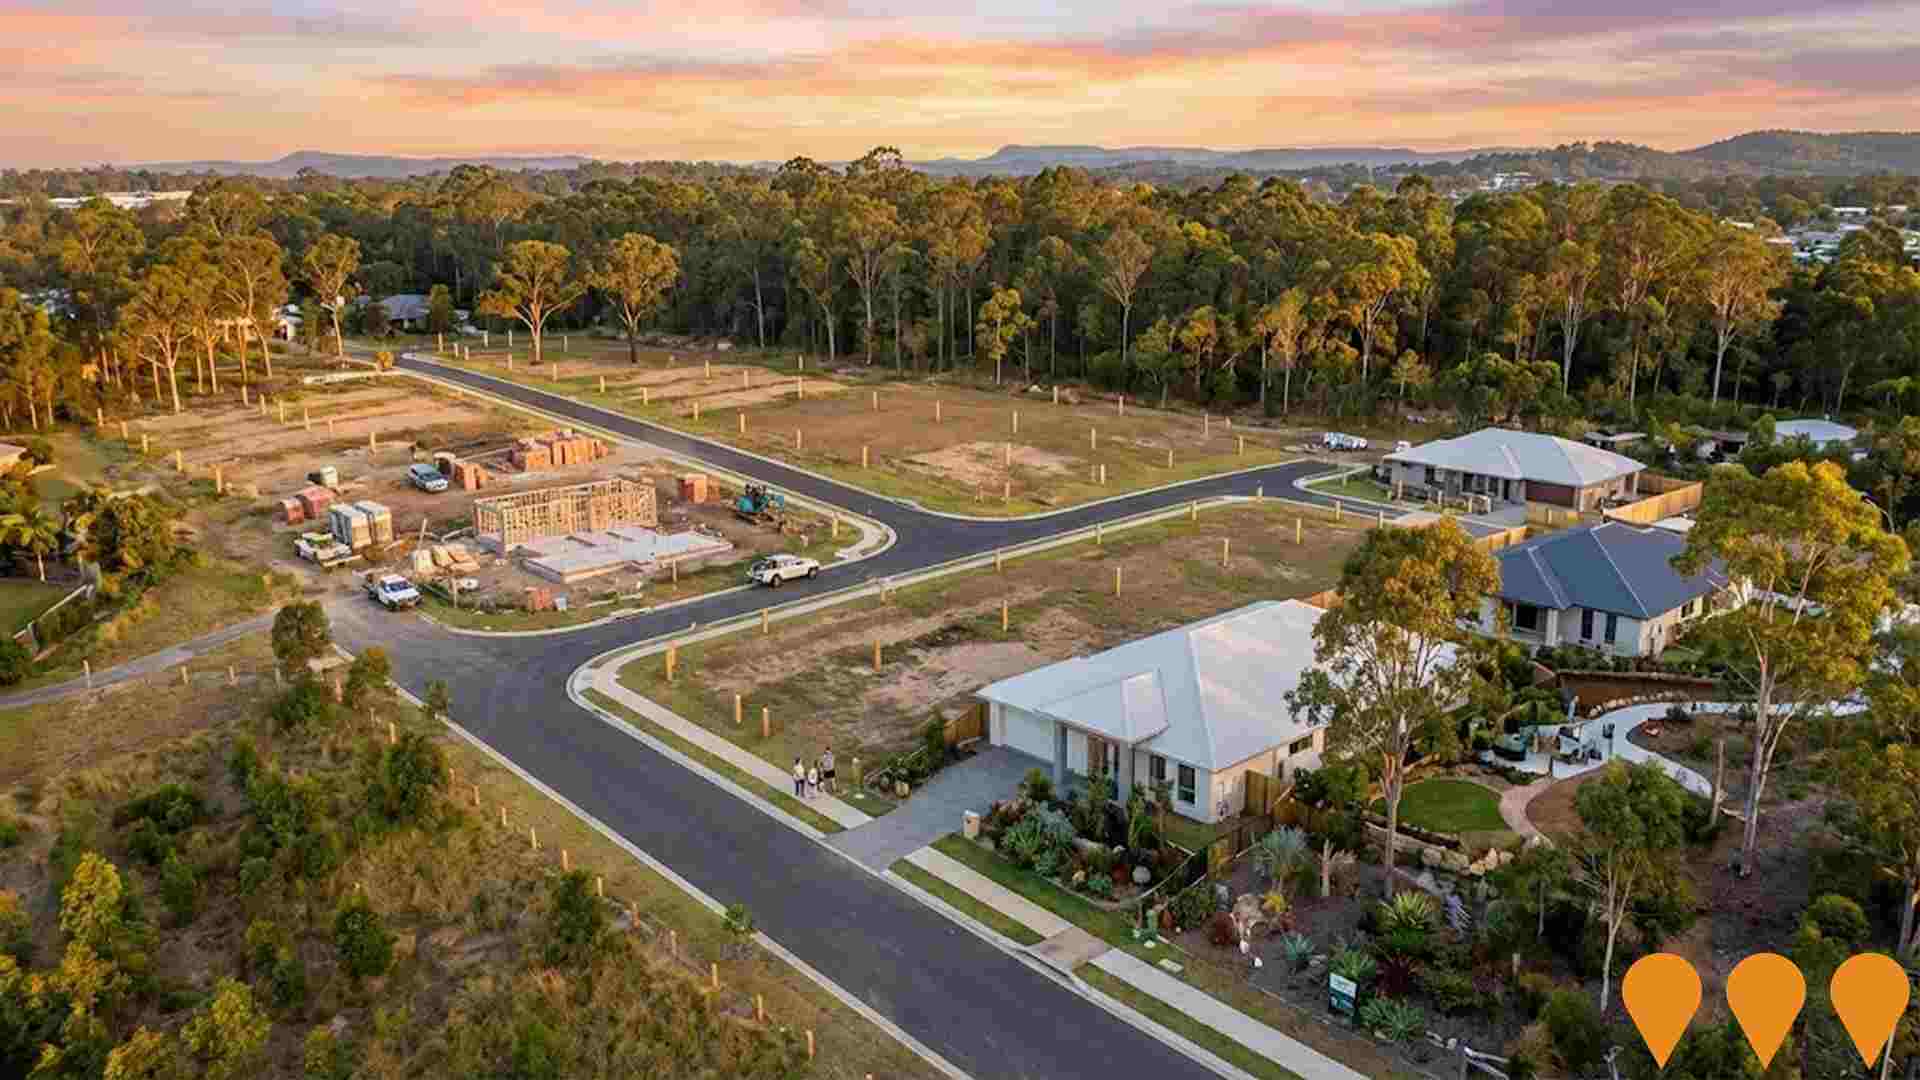
Benowa has averaged approximately 58 new dwelling approvals each year over the past five financial years, totalling 294 homes. As of FY-26 so far, 3 approvals have been recorded. On average, for every home built between FY-21 and FY-25, there were 3.2 new residents. This has led to significant demand exceeding supply, typically resulting in price growth and increased buyer competition.
New properties are constructed at an average expected cost of $408,000. In FY-26, there have been $53.3 million in commercial approvals, indicating high levels of local commercial activity. Compared to the rest of Queensland, Benowa records notably lower building activity, which is 72.0% below the regional average per person. This scarcity of new homes often strengthens demand and prices for existing properties. Recent construction comprises 19.0% standalone homes and 81.0% townhouses or apartments, marking a significant shift from the current housing pattern of 61.0% houses. This change may indicate diminishing developable land availability and responds to evolving lifestyle preferences and housing affordability needs.
Benowa has approximately 700 people per dwelling approval, indicating an established market. By 2041, Benowa is projected to grow by 2,271 residents according to the latest AreaSearch quarterly estimate. Development is keeping pace with projected growth, but buyers may face increasing competition as the population expands.
Frequently Asked Questions - Development
Infrastructure
Benowa has very high levels of nearby infrastructure activity, ranking in the top 10% nationally
Changes to local infrastructure significantly influence an area's performance. AreaSearch has identified 18 projects that may impact the area. Notable ones include Benowa Gardens Redevelopment, Pacific Motorway (M1) Upgrades, Gold Coast Regional Botanic Gardens Biodiversity Centre, and Cross River Rail - New Gold Coast Stations. The following list details those most relevant.
Professional plan users can use the search below to filter and access additional projects.
INFRASTRUCTURE SEARCH
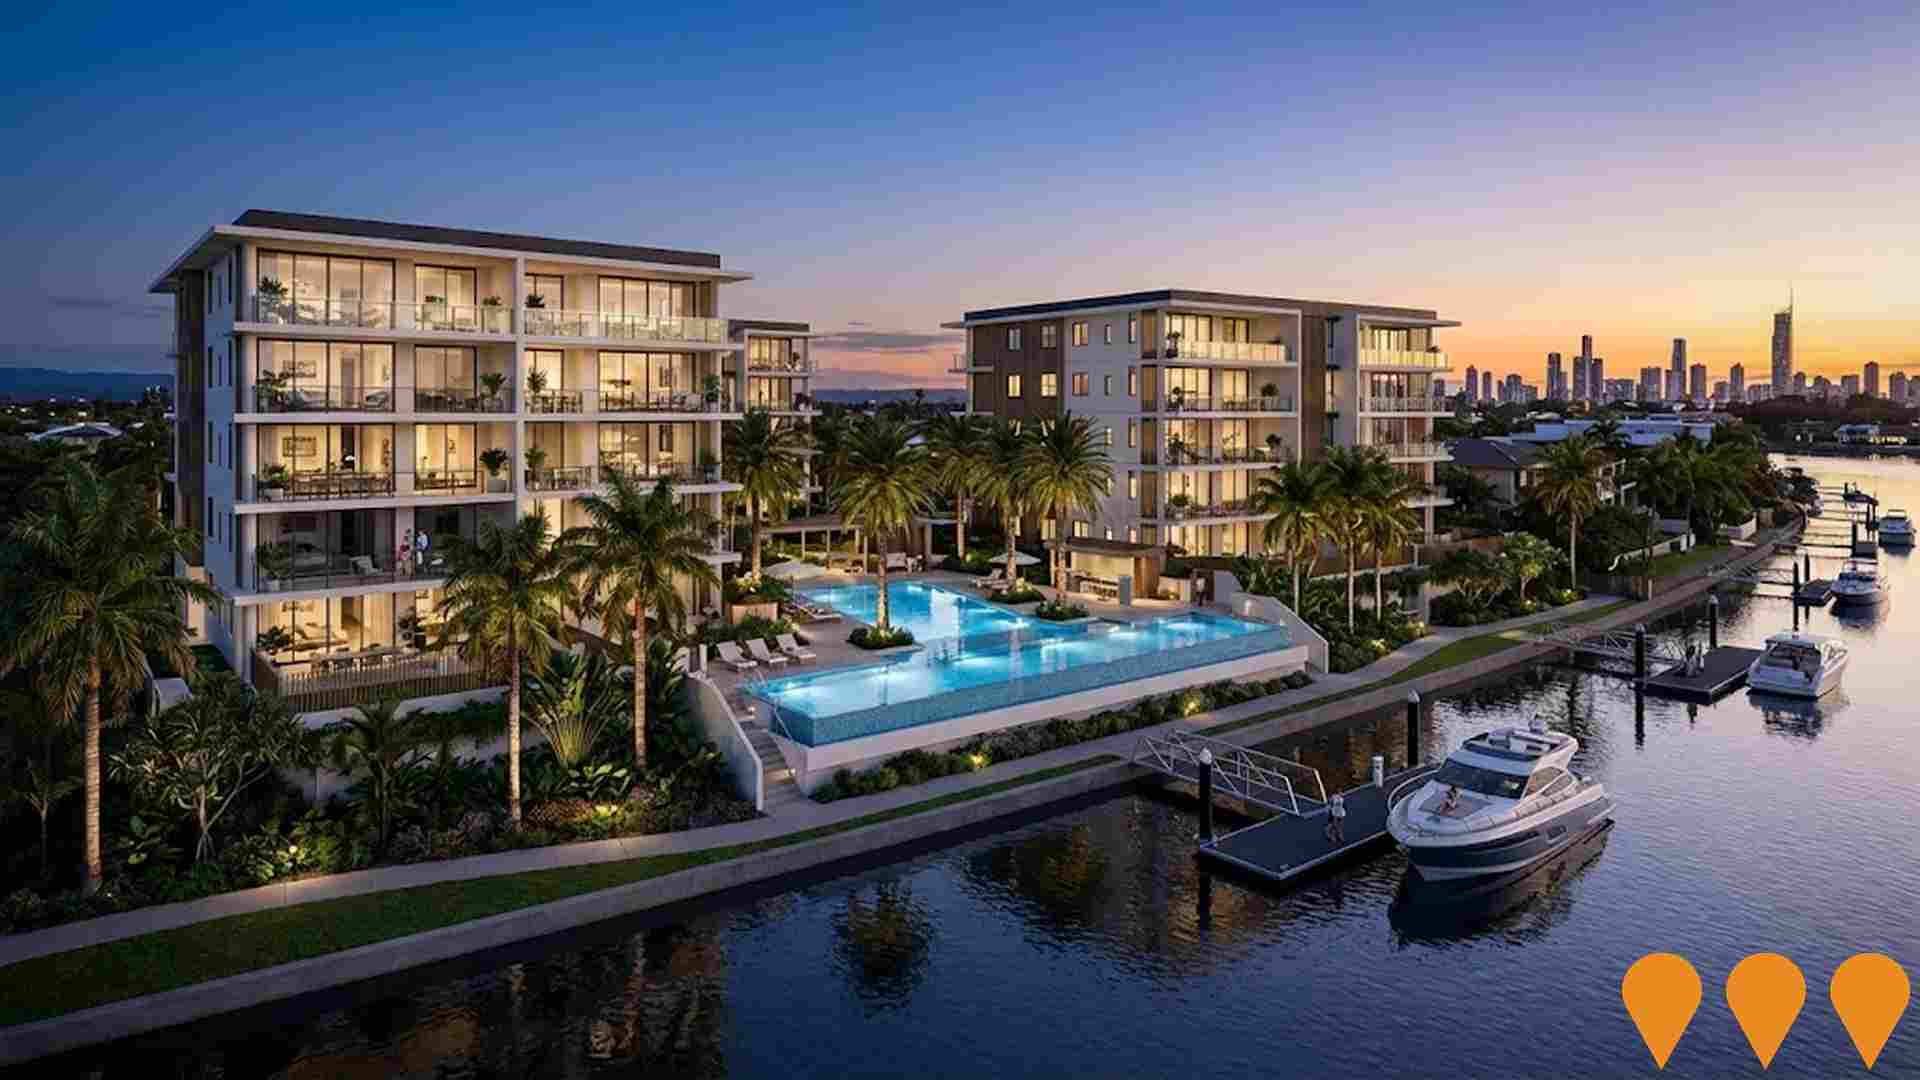
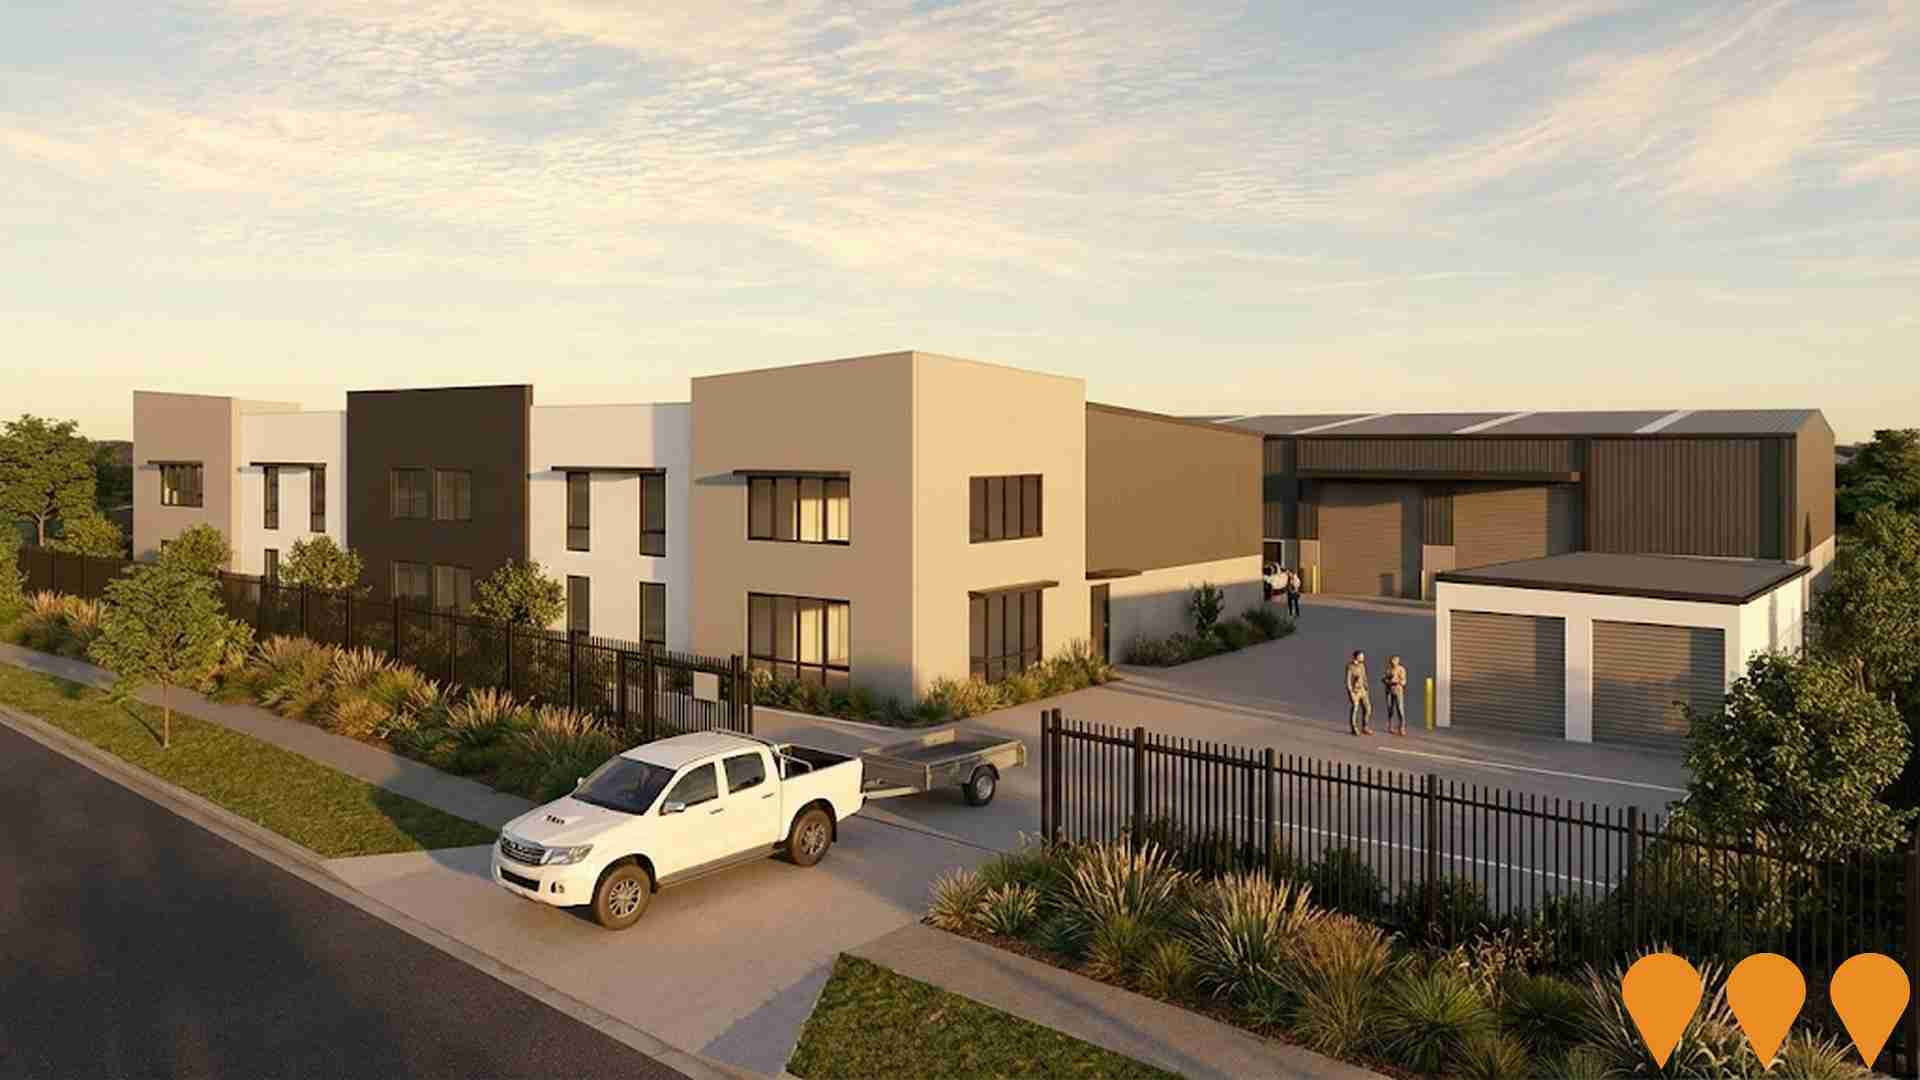
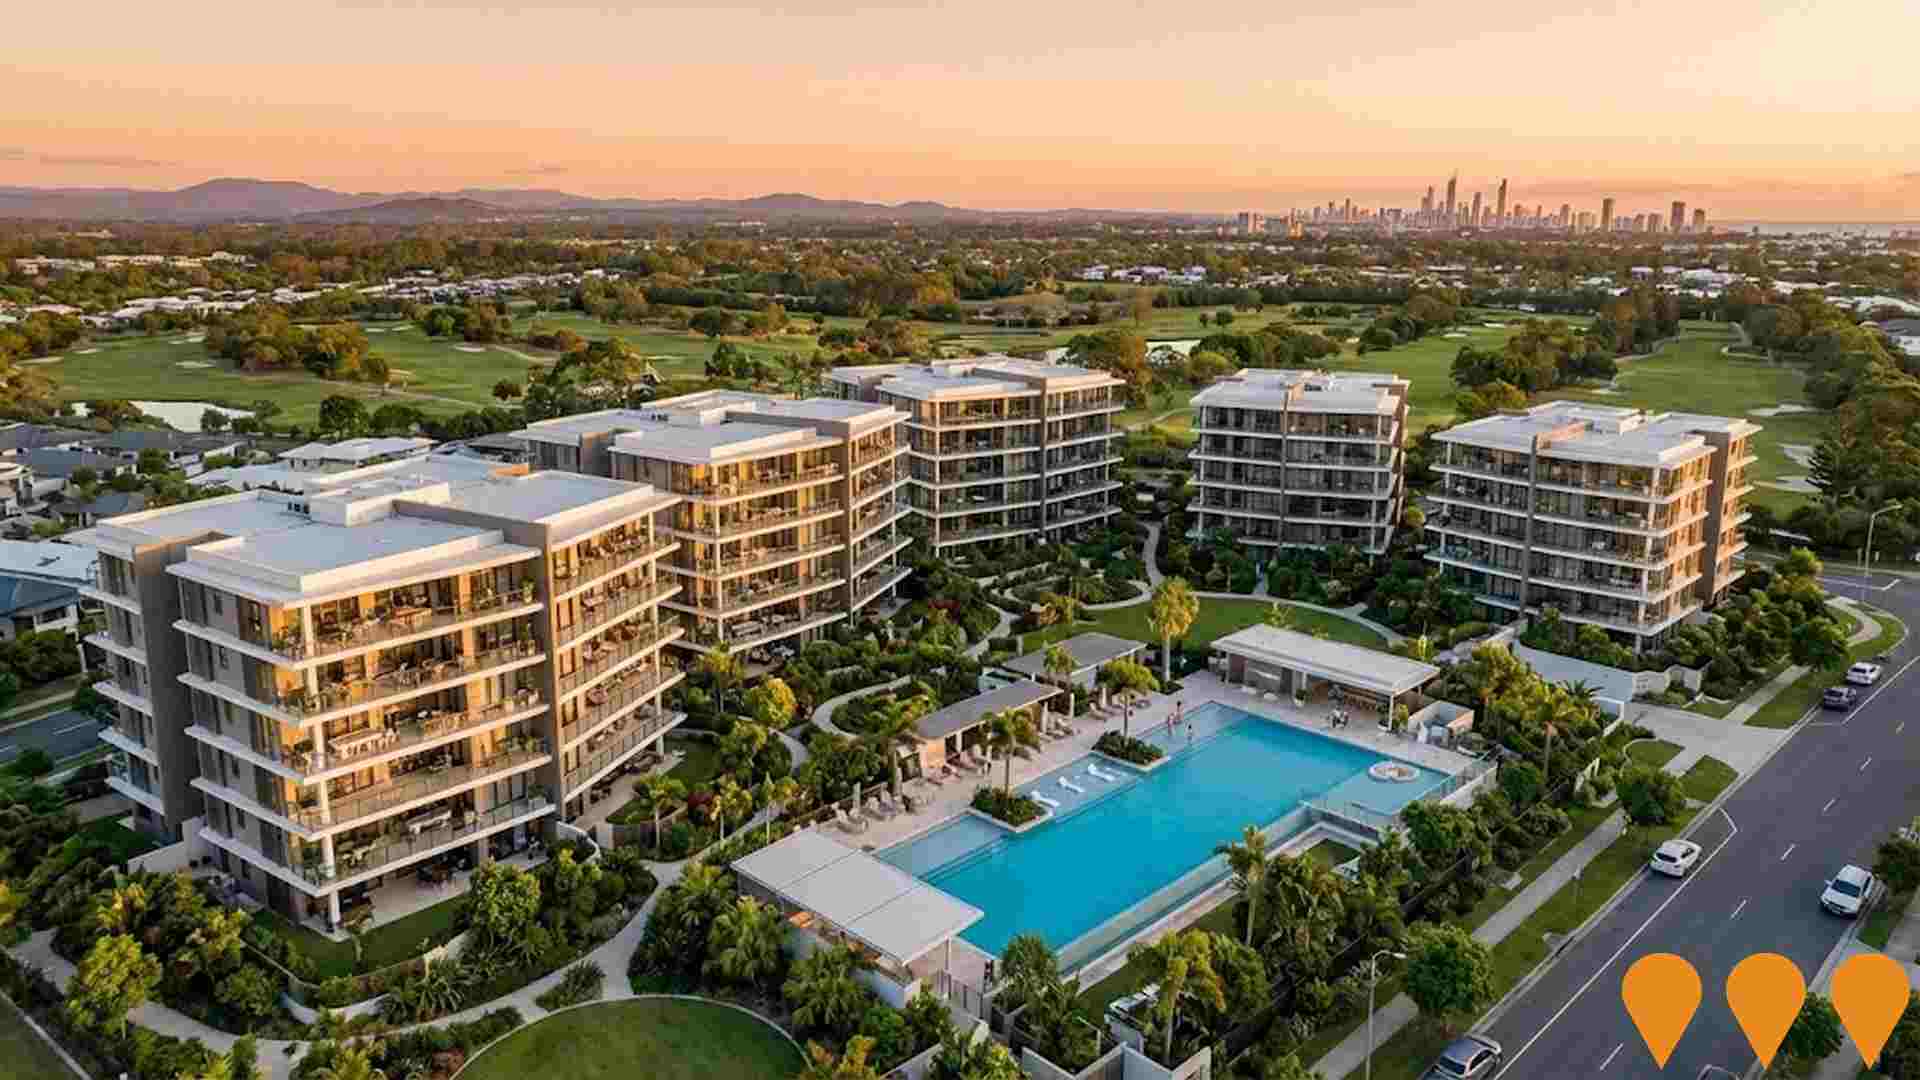
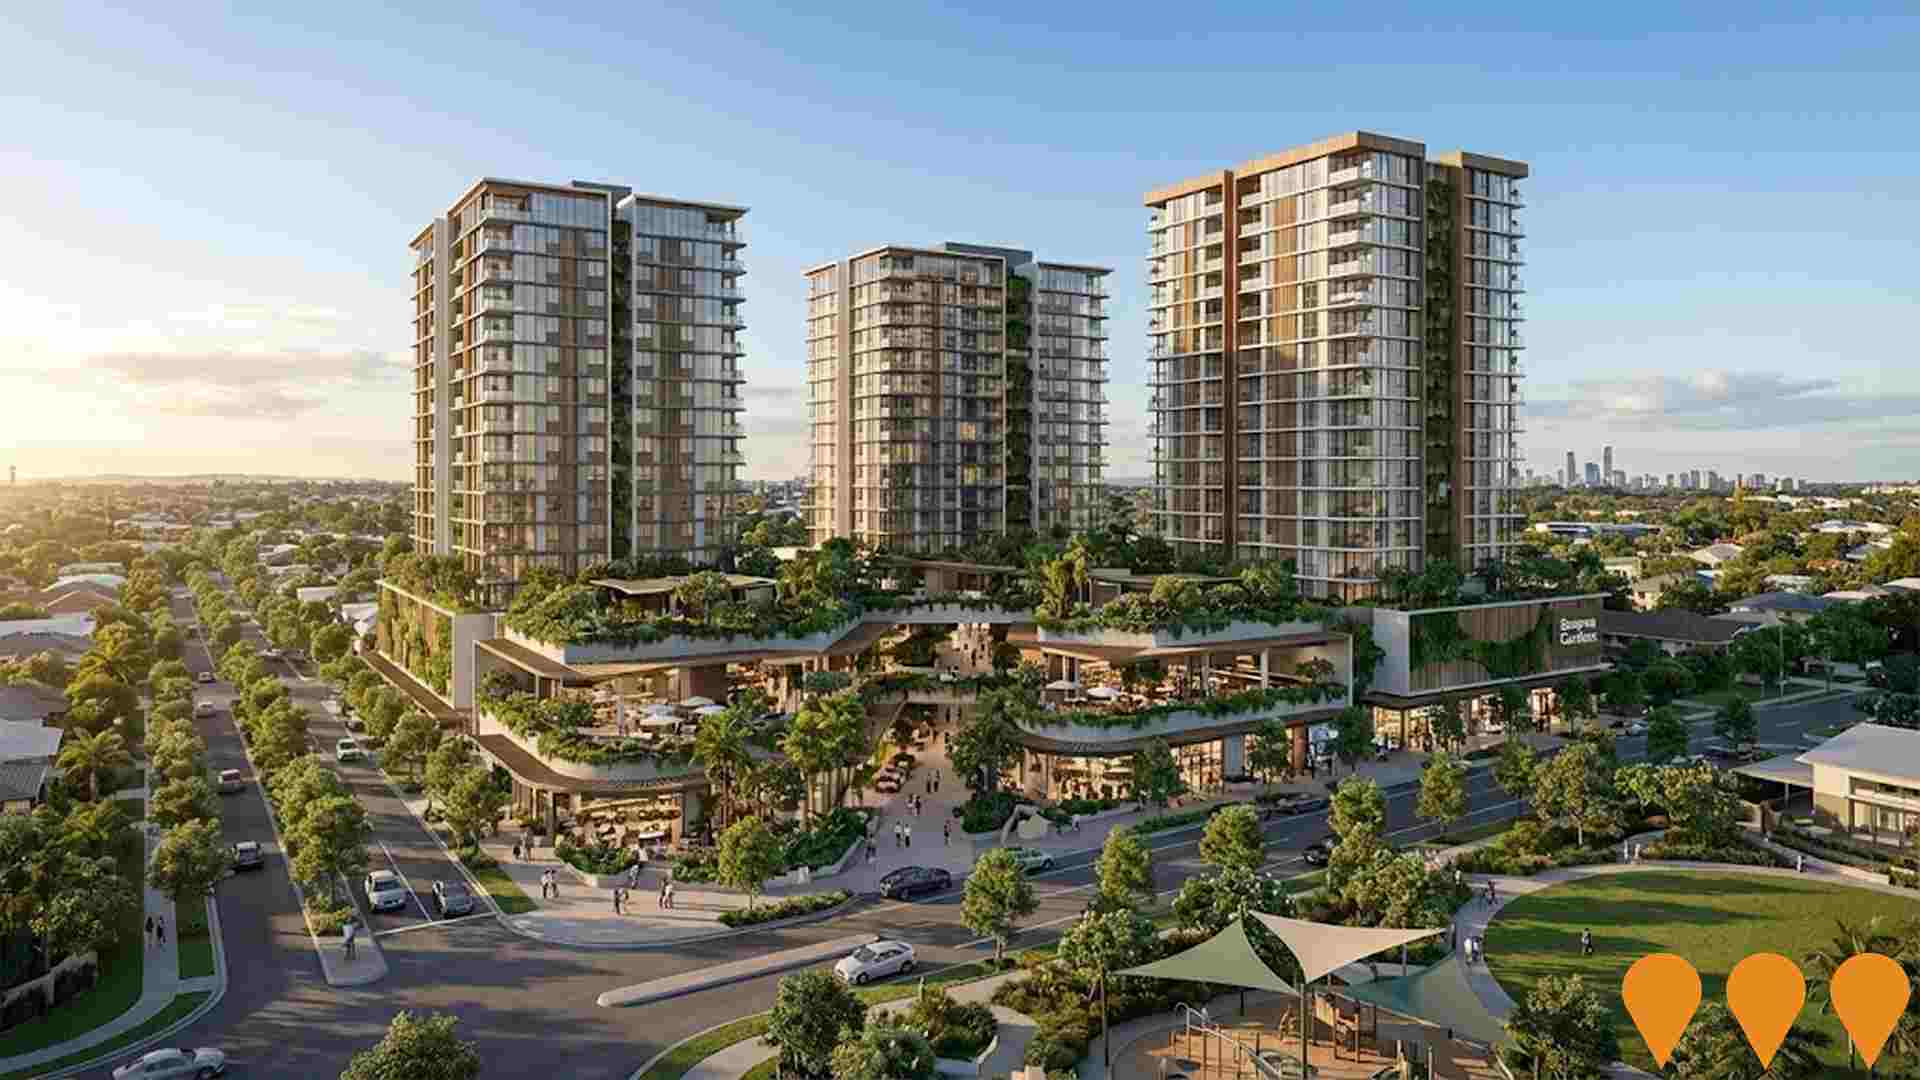
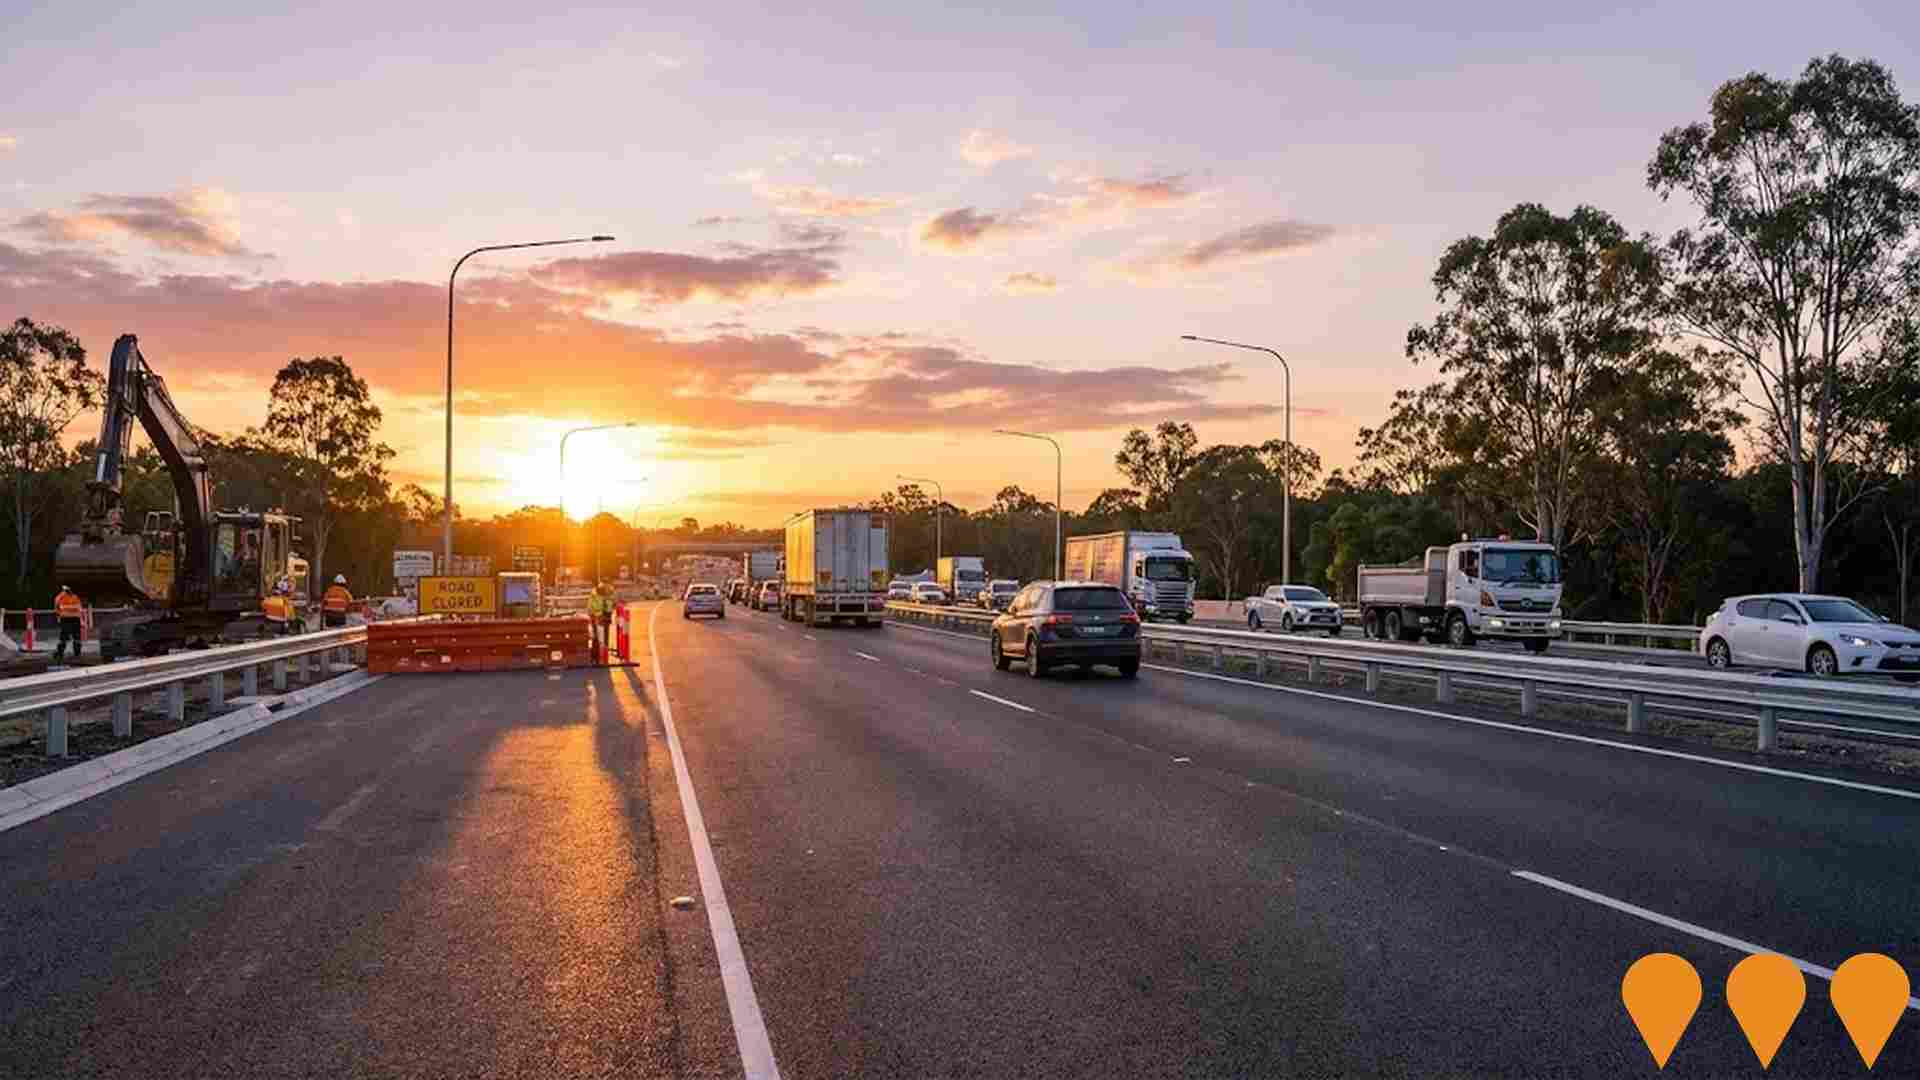
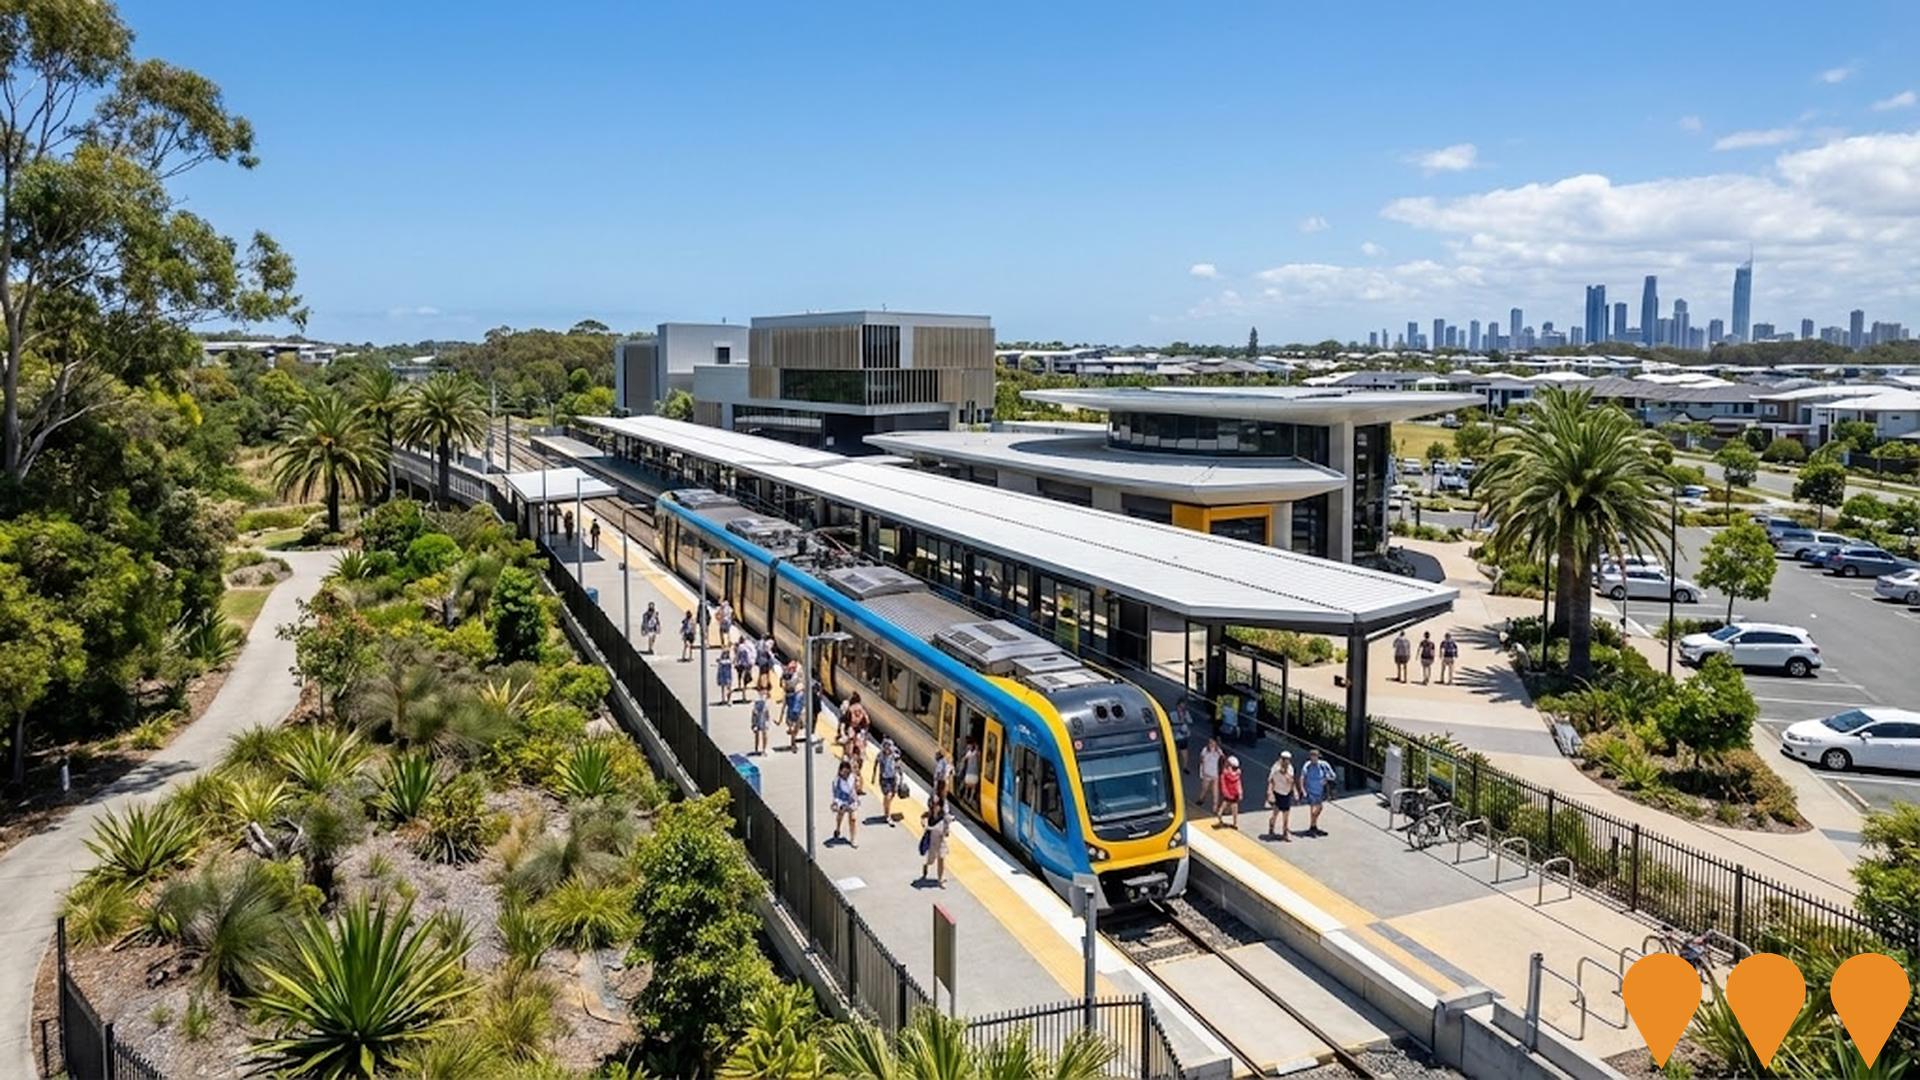
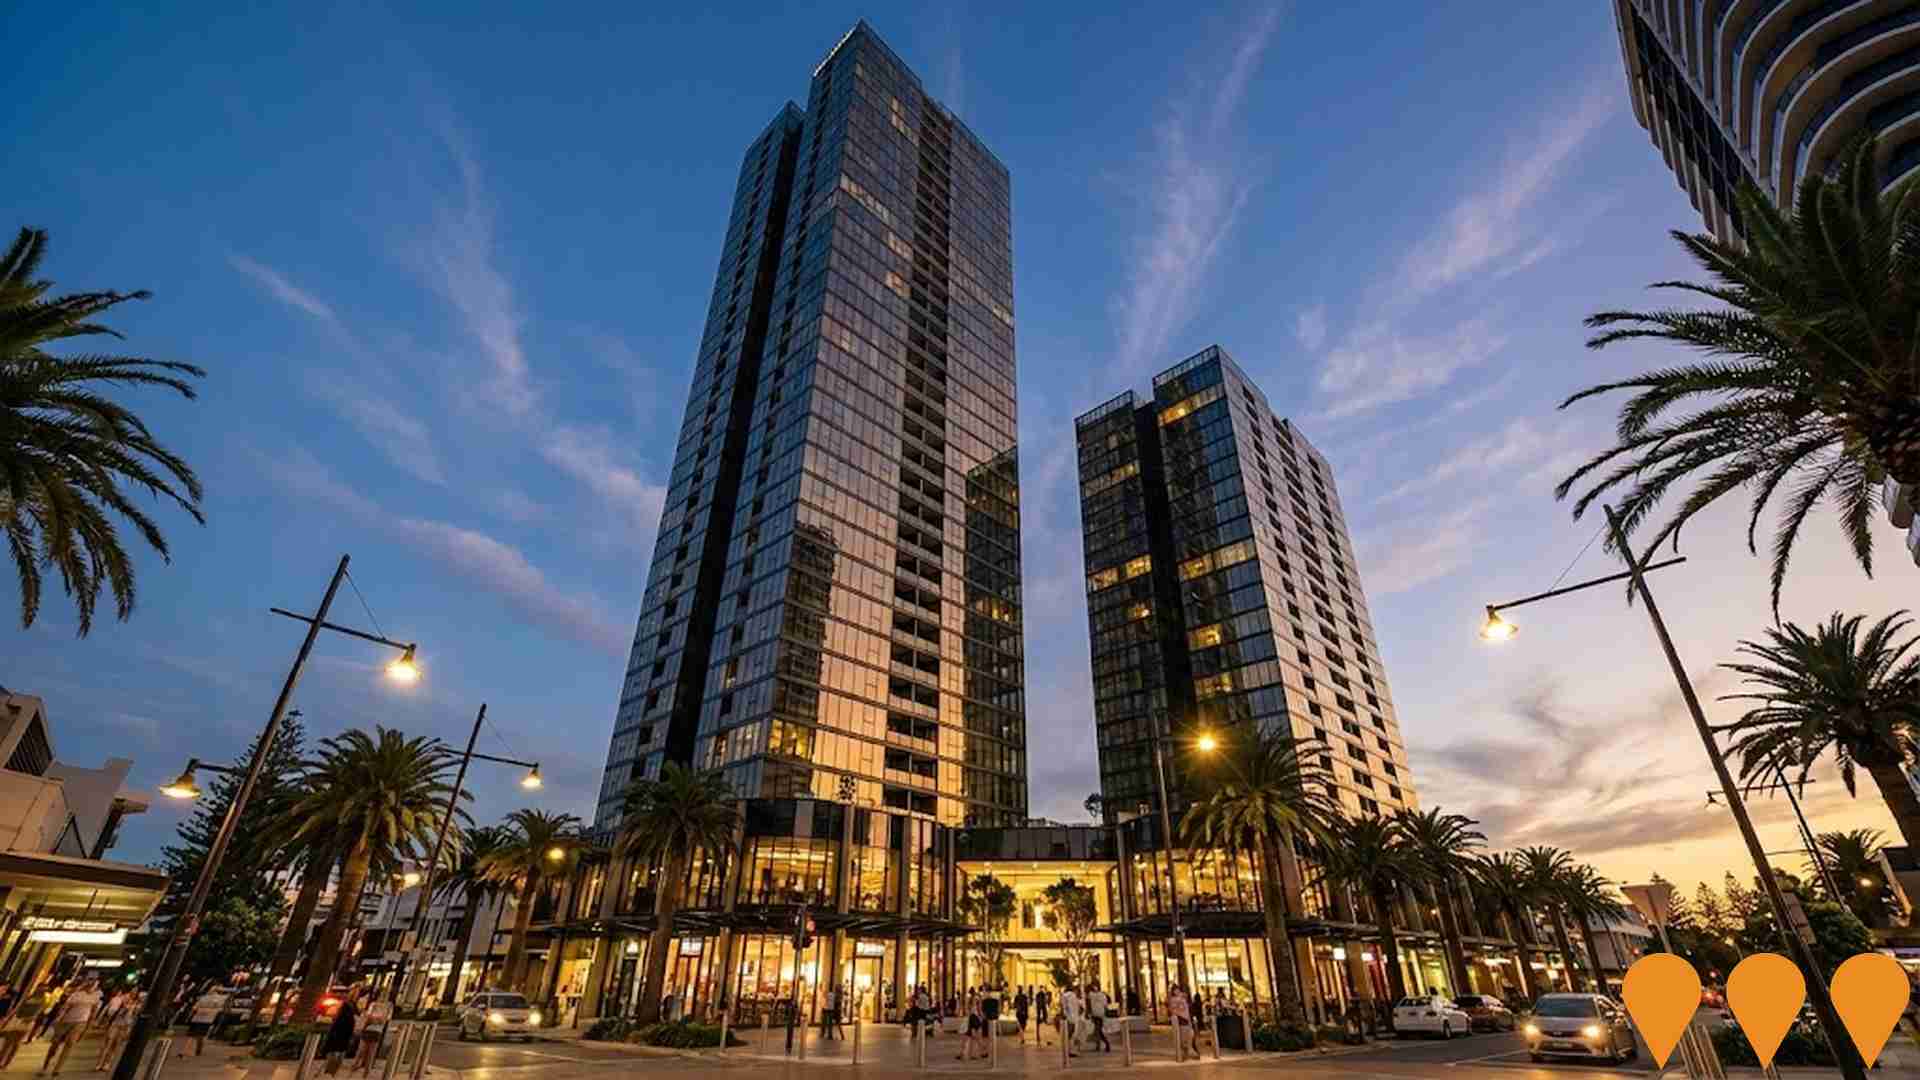
 Denotes AI-based impression for illustrative purposes only, not to be taken as definitive under any circumstances. Please follow links and conduct other investigations from the project's source for actual imagery. Developers and project owners wishing us to use original imagery please Contact Us and we will do so.
Frequently Asked Questions - Infrastructure
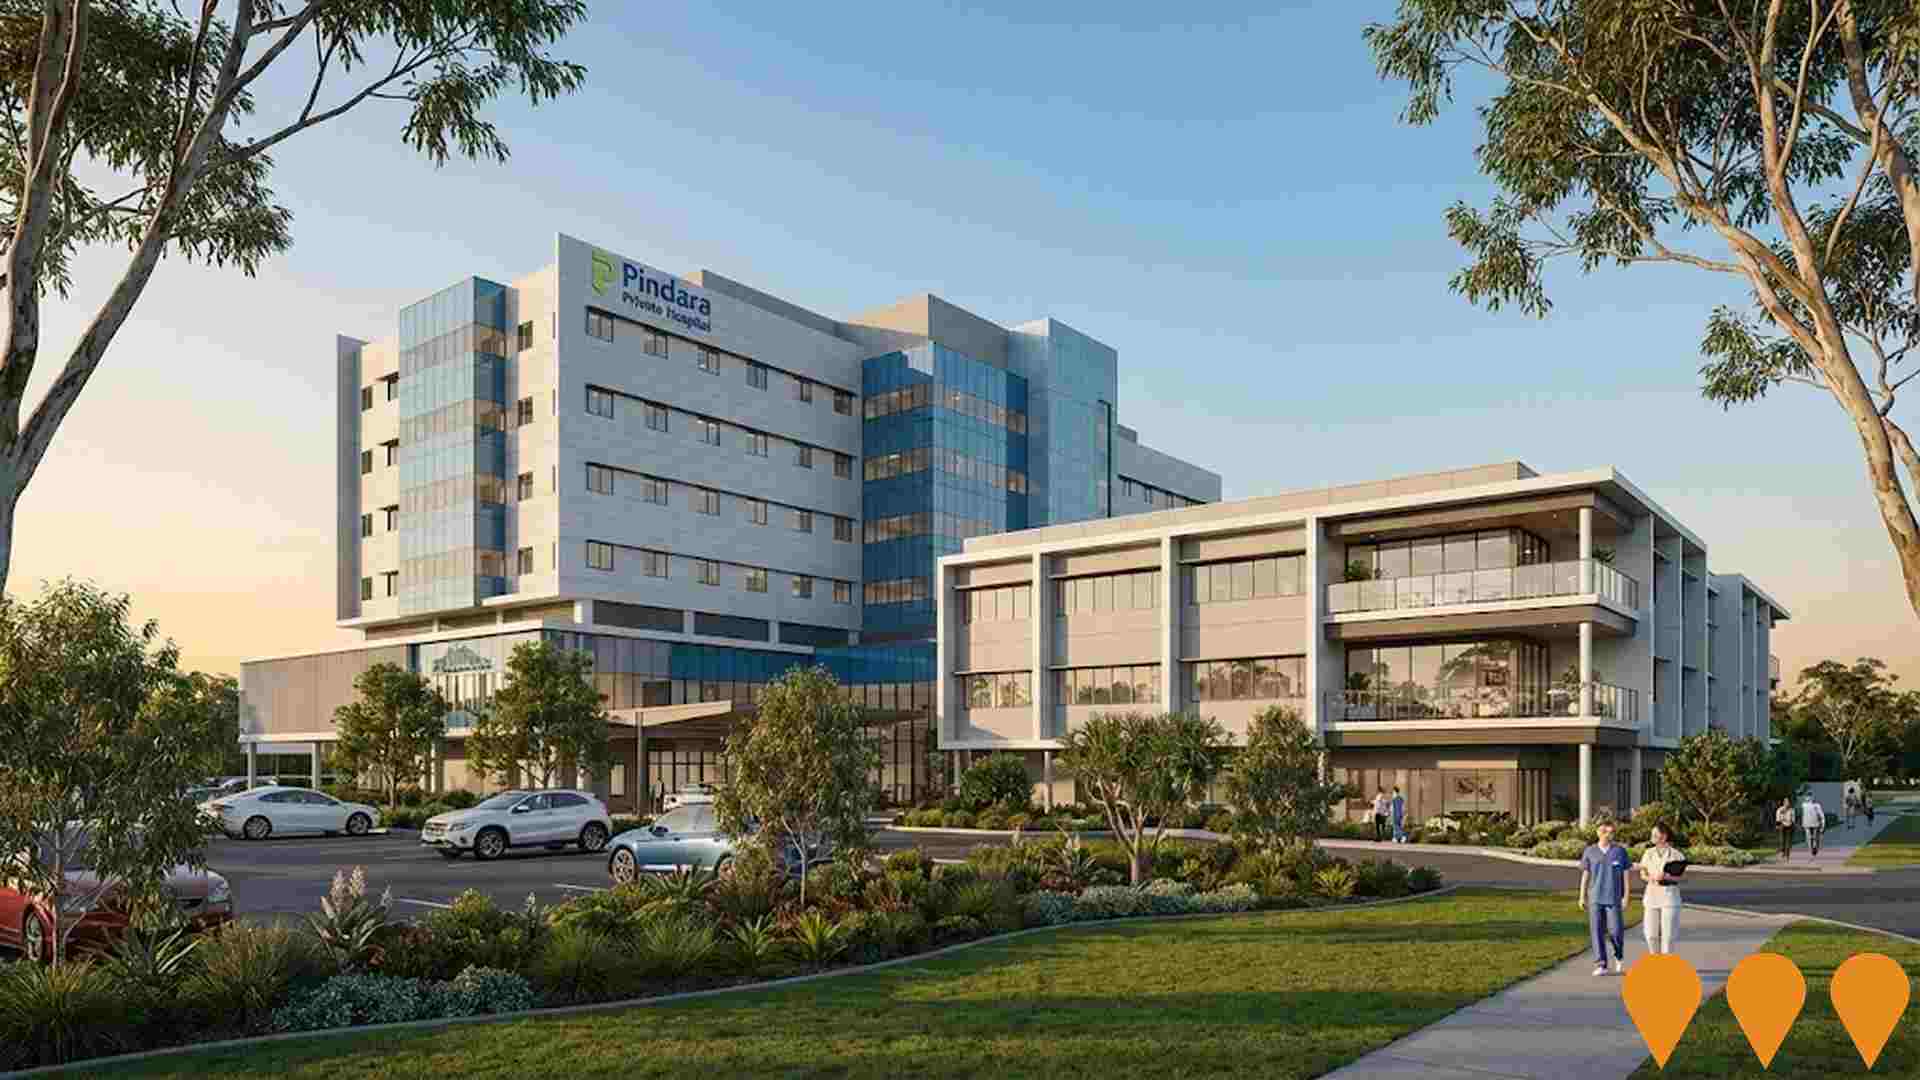
Pindara Private Hospital Stage 3 Expansion
The Stage 3 expansion of Pindara Private Hospital involved the southern extension of the Dr David Lindsay Wing, adding two luxurious wards with spacious private ensuited rooms and two new cutting-edge operating theatres. This increased the total licensed beds to 348, enhanced medical services, and expanded capacity for Day Infusion and Renal Dialysis Services.
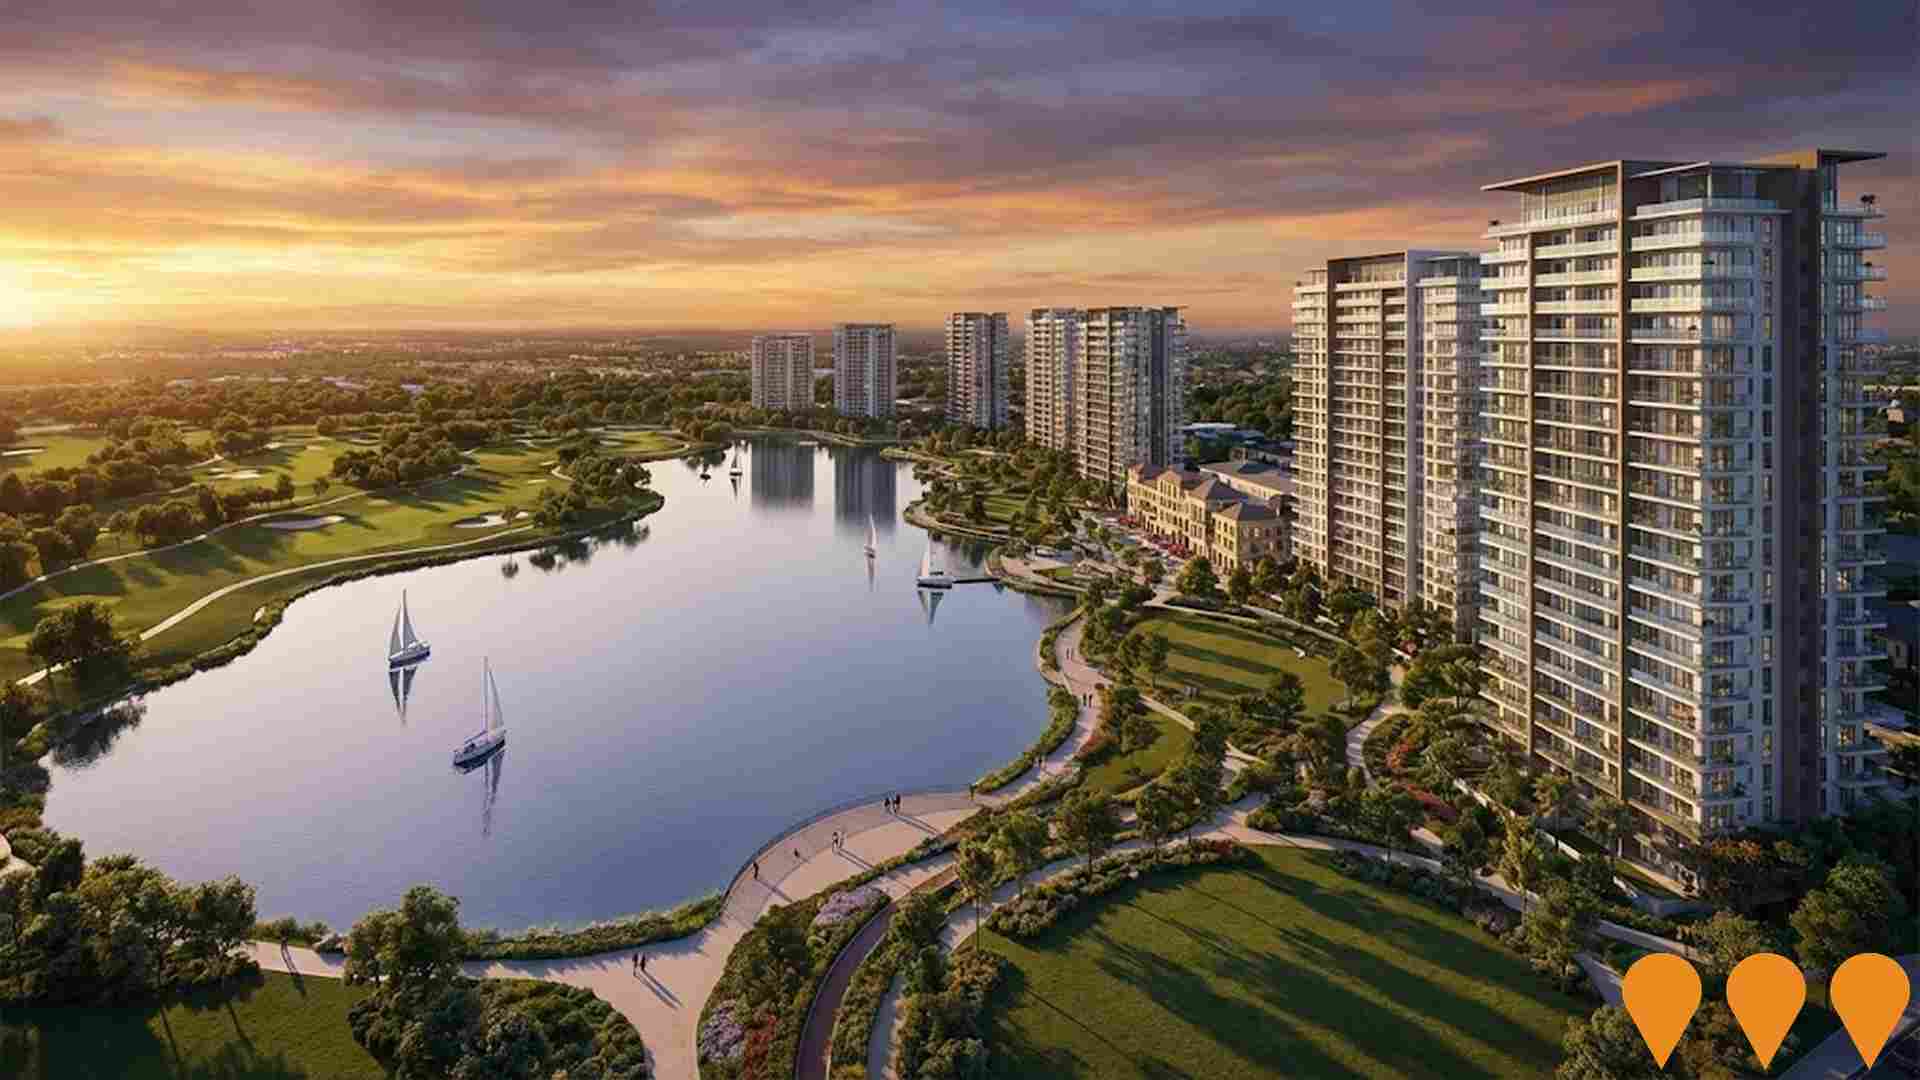
Emerald Lakes Masterplan
A billion-dollar masterplanned community completed in 2018 featuring 1,750 residential dwellings, 25,000sqm of mixed-use commercial space, a 37-hectare lake, an 18-hole Graham Marsh designed championship golf course, shops, restaurants, medical facilities, and over 4.5km of walking paths. The development creates a European-style village environment with easy access to schools, transport, and beaches. The estate includes professional practices, cafes, dining options, and family-friendly amenities including a new playground and parklands.
Cypress Central
Cypress Central is a $2 billion masterplanned mixed-use urban village on approximately 25 hectares in Carrara, Gold Coast. The approved development comprises 11 towers delivering 1,550 apartments, significant retail and commercial floor space, recreational facilities and public open space, creating a new urban centre around the Gooding Drive / Nerang-Broadbeach Road roundabout.
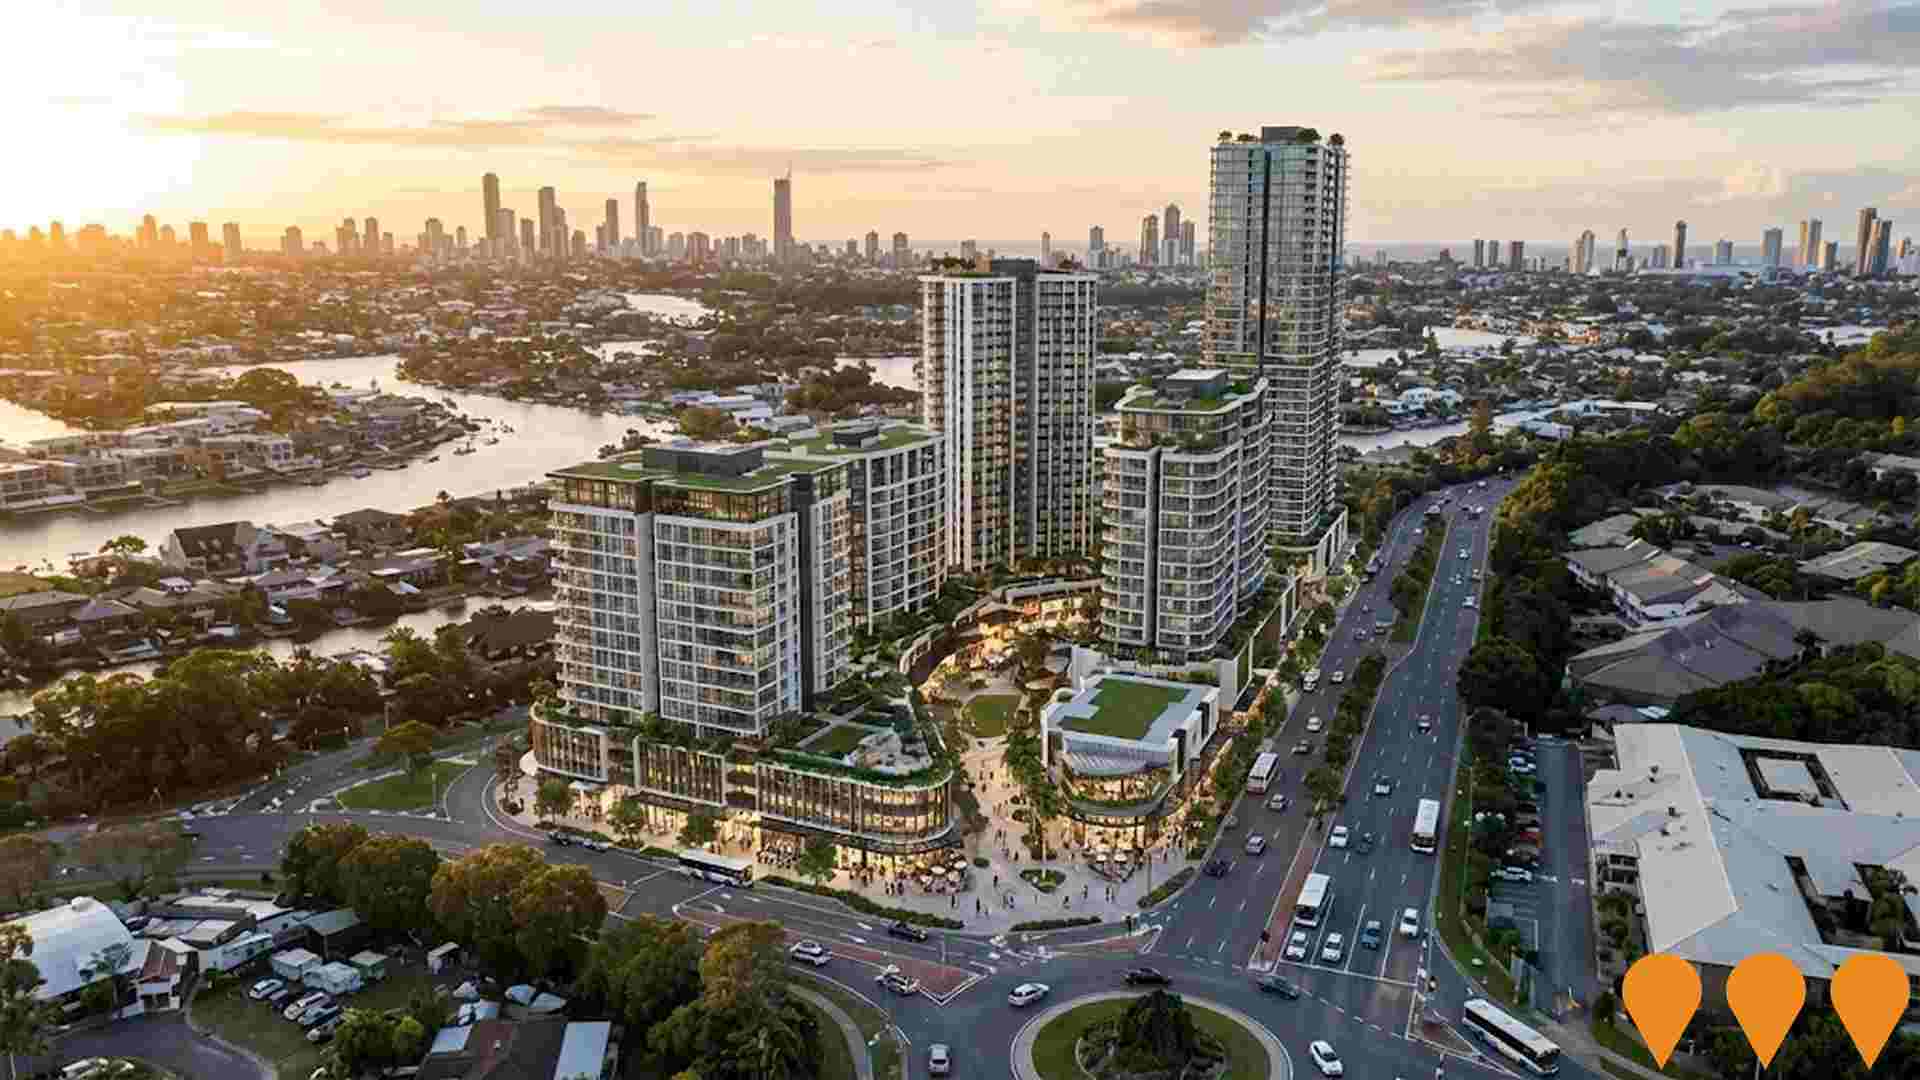
Benowa Gardens Redevelopment
Major mixed-use redevelopment of the existing Benowa Gardens Shopping Centre into a vibrant vertical village. The impact-assessable development application proposes three residential towers (up to 13 storeys) delivering 441 apartments and 41 short-term accommodation units above a revitalised retail and commercial podium of approximately 10,000 sqm GFA retail and 3,000 sqm office/medical suites, with three levels of basement parking.
Pacific Motorway (M1) Upgrades
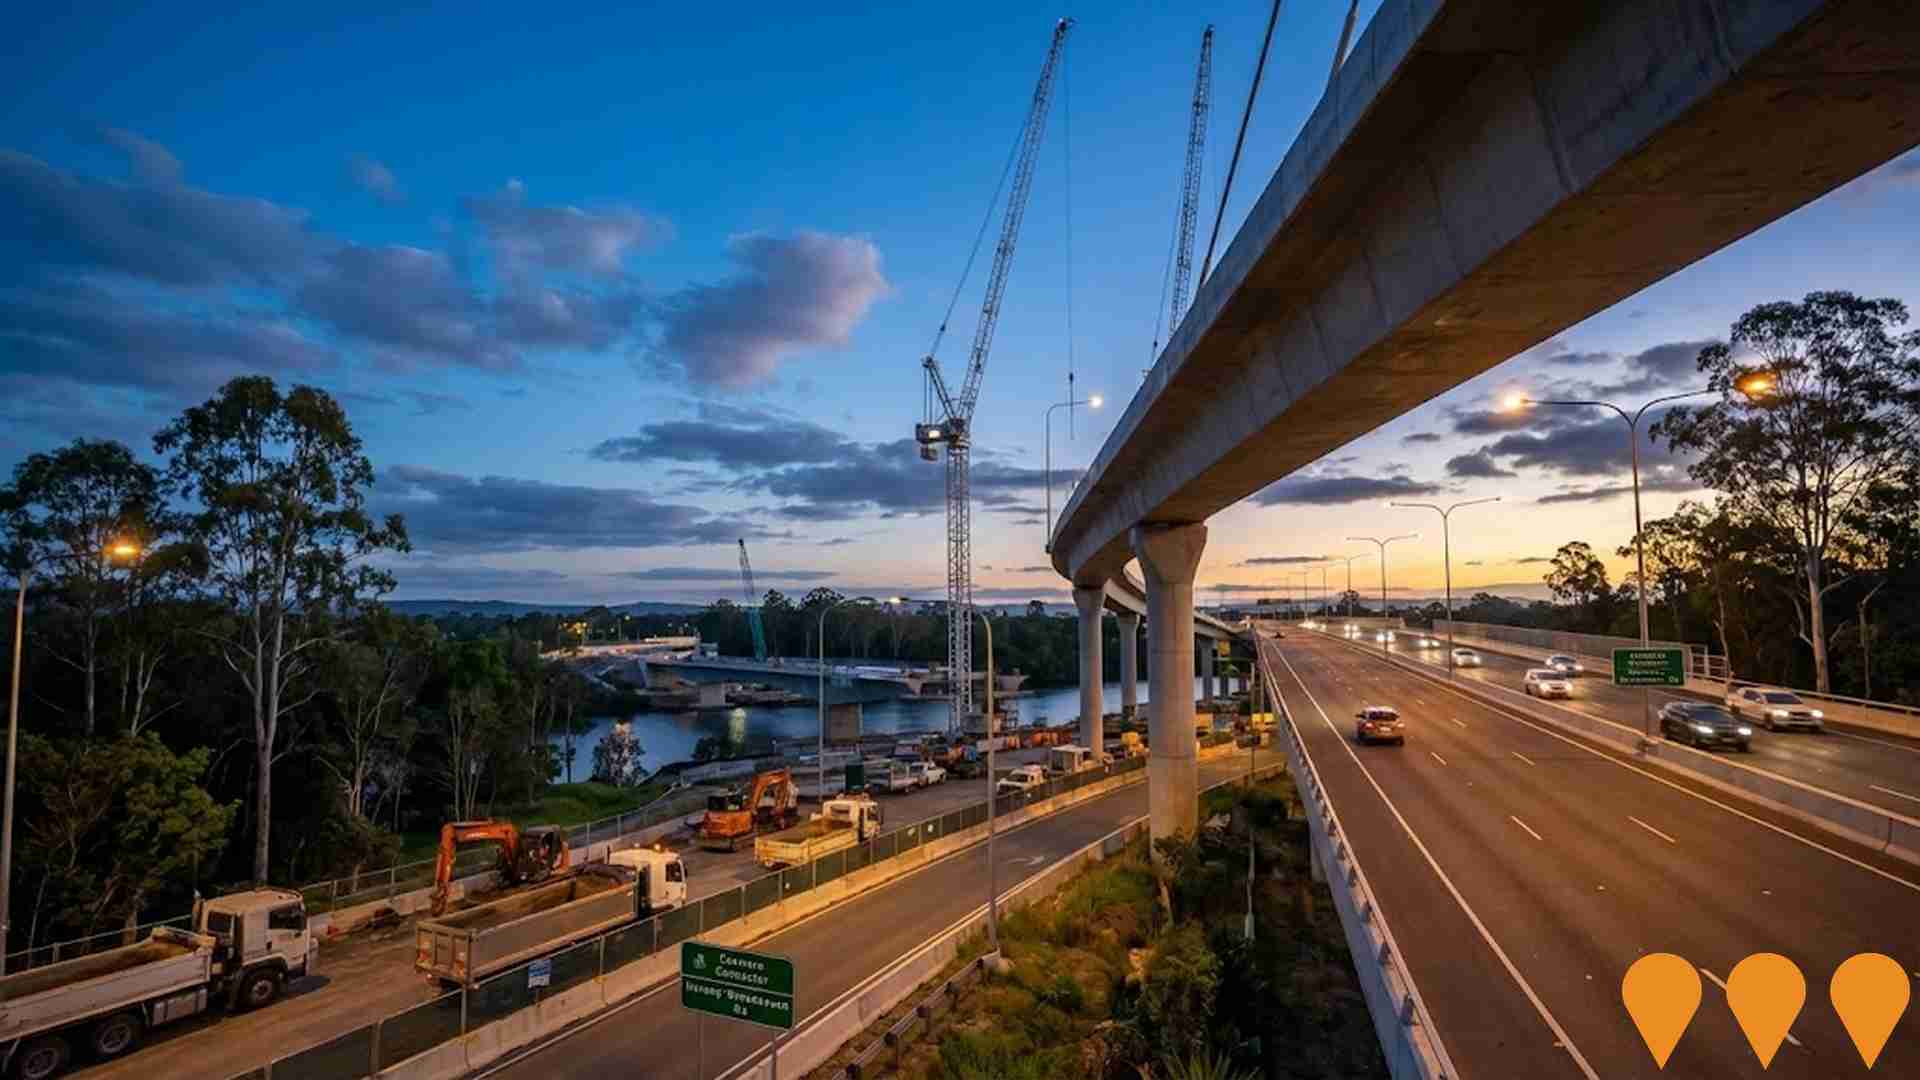
Rolling upgrades to the Pacific Motorway (M1) corridor between Brisbane and the Gold Coast to improve safety, capacity and travel time reliability. Current focus areas include Eight Mile Plains to Daisy Hill (Stage 2, multi-package works), Varsity Lakes to Tugun (VL2T, packages B and C opening progressively from 2024), plus planning for Daisy Hill to Logan Motorway (Stage 3). Works include additional lanes, interchange upgrades, widened creek bridges, active transport links and smart motorway systems.
Cross River Rail - New Gold Coast Stations
Three new stations are being delivered on the Gold Coast line at Pimpama, Hope Island and Merrimac by the Cross River Rail Delivery Authority. Each station includes parking and set-down areas, accessible lifts and wayfinding, pedestrian and cycle connections, public transport integration and upgraded lighting and CCTV. Major construction is underway at all three sites, with ADCO Constructions delivering Pimpama, Acciona Georgiou JV delivering Hope Island and Fulton Hogan delivering Merrimac.
Victoria & Albert Broadbeach
$800 million transformation of landmark Niecon Plaza site featuring 398 apartments across two towers of 56 and 40 storeys. Mixed-use development includes premium offices, commercial facilities, and fresh food and dining retail at street level.
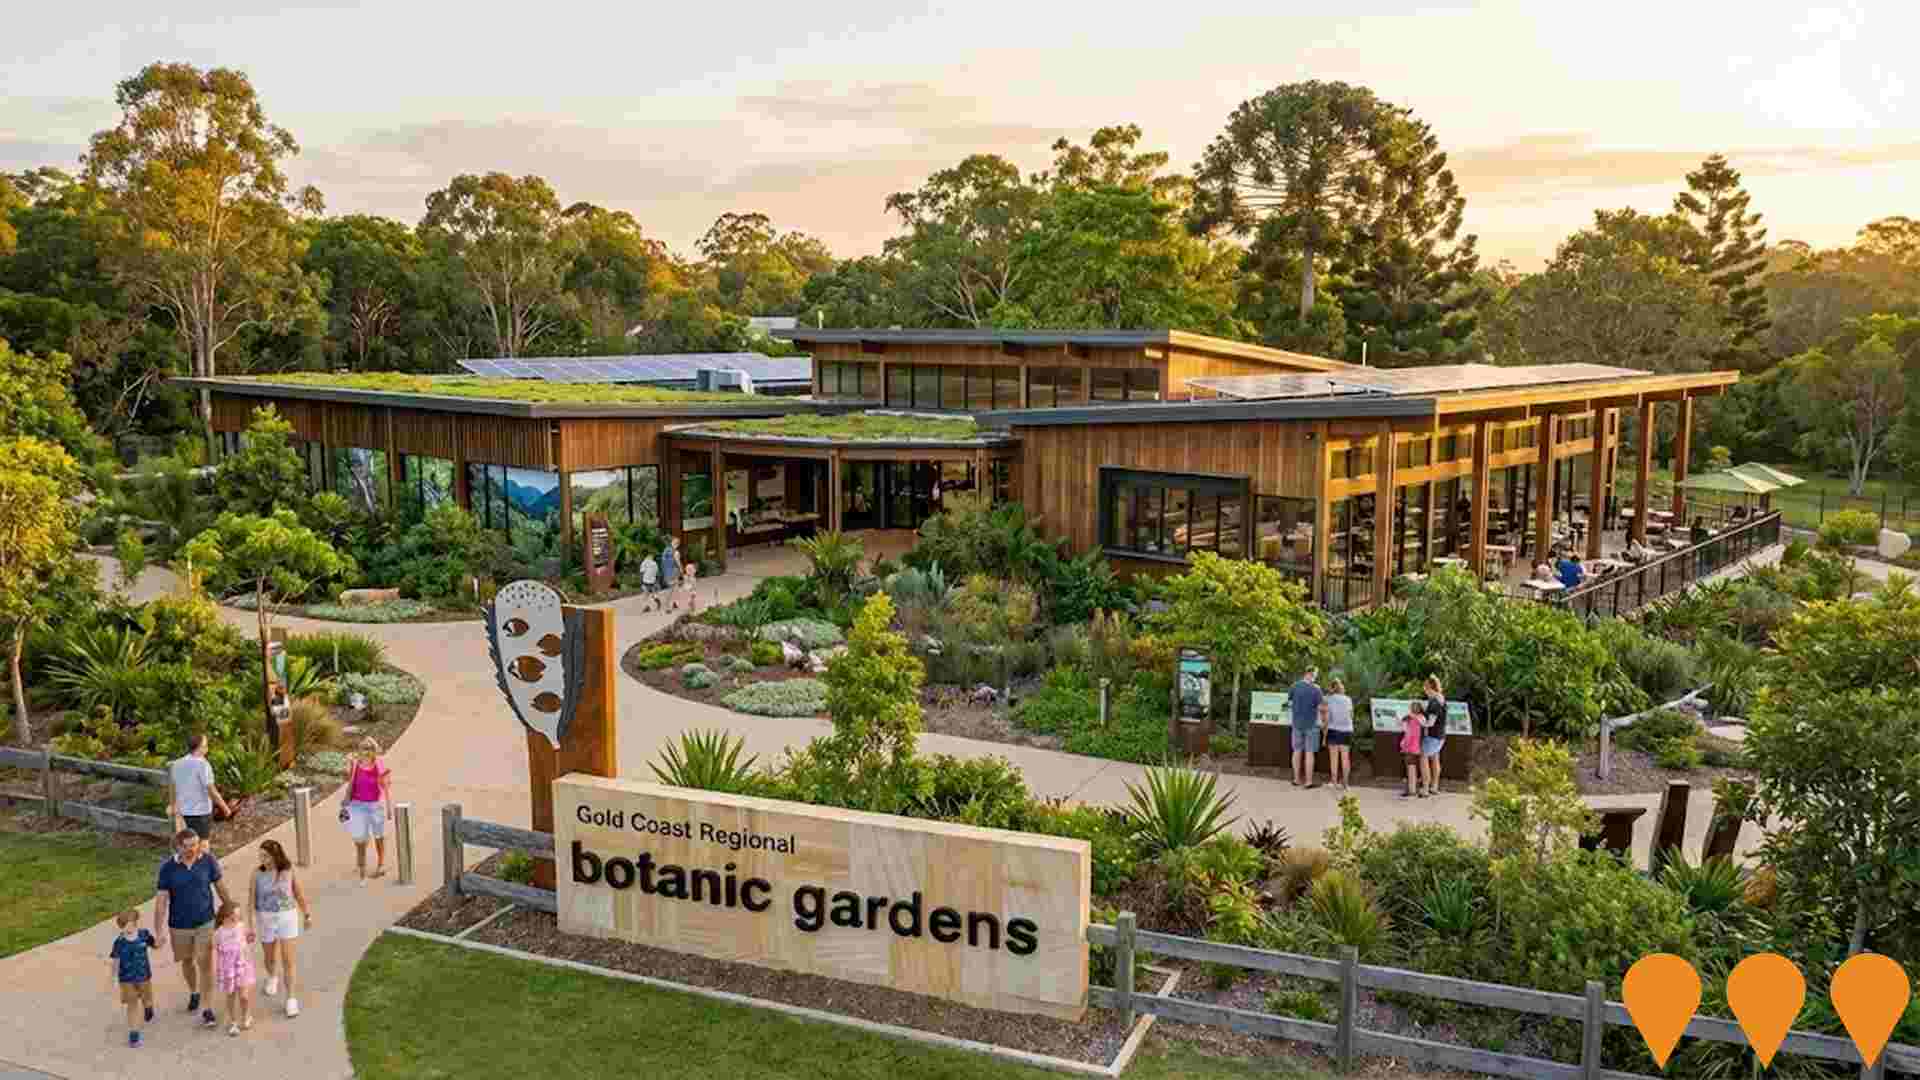
Gold Coast Regional Botanic Gardens Biodiversity Centre
A new biodiversity centre within the Gold Coast Regional Botanic Gardens offering a mountains to mangroves journey through interactive displays and gardens, focusing on local flora, fauna, history, and culture. It includes exhibition spaces, flexible areas for conferences, teaching, and functions, a cafe, merchandise shop, administration, amenities, plaza spaces, additional car parking, pathways, and lighting.
Employment
Benowa ranks among the top 25% of areas assessed nationally for overall employment performance
Benowa has an educated workforce with diverse sector representation. The unemployment rate was 2.3% in the past year, with estimated employment growth of 2.4%.
As of September 2025, 5,563 residents are employed, with an unemployment rate of 1.8%, below Rest of Qld's 4.1%. Workforce participation is at 59.1%, on par with Rest of Qld. Employment is concentrated in health care & social assistance, retail trade, and accommodation & food. Professional & technical employment is notably high, at 1.9 times the regional average.
Conversely, agriculture, forestry & fishing shows lower representation at 0.3% versus the regional average of 4.5%. Many residents commute elsewhere for work based on Census data. Over the year to September 2025, employment increased by 2.4%, labour force by 2.6%, raising unemployment by 0.1 percentage points. In comparison, Rest of Qld saw employment grow by 1.7% and unemployment rise by 0.3 percentage points. Statewide in Queensland, from November 25, employment contracted by 0.01%, with an unemployment rate of 4.2%. National forecasts project total employment growth of 6.6% over five years and 13.7% over ten years. Applying these projections to Benowa's industry mix suggests local employment could increase by 7.0% over five years and 14.2% over ten years.
Frequently Asked Questions - Employment
Income
Income levels sit below national averages according to AreaSearch assessment
AreaSearch's aggregation of latest postcode level ATO data for financial year 2022 indicates Benowa SA2 had a median taxpayer income of $45,050 and an average income of $74,570. These figures are higher than national averages of $50,780 and $64,844 respectively across Rest of Qld. Applying Wage Price Index growth of 13.99% since financial year 2022, estimated incomes as of September 2025 would be approximately $51,352 (median) and $85,002 (average). According to the 2021 Census, household income ranks at the 60th percentile ($1,918 weekly), while personal income is at the 44th percentile. Income analysis shows 29.4% of the population (3,139 individuals) fall within the $1,500 - $2,999 income range, mirroring the region where 31.7% occupy this bracket. High housing costs consume 16.4% of income, but strong earnings place disposable income at the 60th percentile. The area's SEIFA income ranking places it in the 7th decile.
Frequently Asked Questions - Income
Housing
Benowa displays a diverse mix of dwelling types, with above-average rates of outright home ownership
The dwelling structure in Benowa, as per the latest Census data, consisted of 61.2% houses and 38.7% other dwellings (semi-detached, apartments, 'other' dwellings). In comparison, Non-Metro Qld had 25.1% houses and 74.9% other dwellings. Home ownership in Benowa was at 40.8%, with the remaining dwellings either mortgaged (37.1%) or rented (22.1%). The median monthly mortgage repayment in the area was $2,167, higher than Non-Metro Qld's average of $1,950. The median weekly rent figure in Benowa was recorded at $580, compared to Non-Metro Qld's $437. Nationally, Benowa's mortgage repayments were significantly higher than the Australian average of $1,863, while rents were substantially above the national figure of $375.
Frequently Asked Questions - Housing
Household Composition
Benowa features high concentrations of family households, with a higher-than-average median household size
Family households constitute 78.5% of all households, including 37.4% couples with children, 28.9% couples without children, and 11.4% single parent families. Non-family households comprise the remaining 21.5%, with lone person households at 18.5% and group households at 3.1%. The median household size is 2.7 people, larger than the Rest of Qld average of 2.1.
Frequently Asked Questions - Households
Local Schools & Education
Benowa shows strong educational performance, ranking in the upper quartile nationally when assessed across multiple qualification and achievement indicators
Benowa's educational attainment is notably higher than broader averages. Among residents aged 15+, 33.9% have university qualifications compared to 20.6% in the rest of Queensland and 25.4% in the SA4 region. Bachelor degrees are most prevalent at 22.9%, followed by postgraduate qualifications (8.2%) and graduate diplomas (2.8%). Vocational credentials are also common, with 32.3% of residents aged 15+ holding them - advanced diplomas account for 13.7% and certificates for 18.6%.
Educational participation is high, with 32.1% currently enrolled in formal education. This includes 10.8% in secondary education, 10.6% in primary education, and 5.6% pursuing tertiary education.
Frequently Asked Questions - Education
Schools Detail
Nearby Services & Amenities
Transport
Transport servicing is low compared to other areas nationally based on assessment of service frequency, route connectivity and accessibility
Benowa has 17 active public transport stops operating, with a mix of buses serving the area. These stops are covered by 6 individual routes, offering a total of 794 weekly passenger trips. Transport accessibility is rated as good, with residents typically located 387 meters from their nearest transport stop.
Service frequency averages 113 trips per day across all routes, resulting in approximately 46 weekly trips per individual stop.
Frequently Asked Questions - Transport
Transport Stops Detail
Health
Benowa's residents are extremely healthy with very low prevalence of common health conditions across all age groups
Analysis of health metrics shows strong performance throughout Benowa with very low prevalence of common health conditions across all age groups.
The rate of private health cover is very high at approximately 56% of the total population (~6,033 people). The most common medical conditions in the area are arthritis and asthma, impacting 7.4 and 5.9% of residents respectively, while 74.5% declare themselves completely clear of medical ailments compared to 72.6% across Rest of Qld. The area has 21.2% of residents aged 65 and over (2,263 people). Health outcomes among seniors are particularly strong, performing even better than the general population in health metrics.
Frequently Asked Questions - Health
Cultural Diversity
Benowa was found to be more culturally diverse than the vast majority of local markets in Australia, upon assessment of a range of language and cultural background related metrics
Benowa has a high level of cultural diversity, with 26.1% of its population speaking a language other than English at home and 38.8% born overseas. Christianity is the predominant religion in Benowa, making up 51.8% of the population. Notably, Judaism is overrepresented in Benowa compared to the rest of Queensland, with 0.5% of the population identifying as Jewish.
The top three ancestry groups in Benowa are English at 27.2%, Australian at 18.9%, and Other at 11.3%. There are also notable divergences in the representation of certain ethnic groups: Korean is overrepresented at 2.0% compared to the regional average of 0.8%, New Zealand at 1.4% versus 1.1%, and Russian at 0.7% versus 0.6%.
Frequently Asked Questions - Diversity
Age
Benowa hosts a notably older demographic compared to the national average
Benowa's median age is 44 years, which is slightly higher than the Rest of Qld average of 41 and considerably older than Australia's median age of 38. The age profile indicates that individuals aged 15-24 are particularly prominent, making up 13.7% of the population, while those aged 25-34 comprise a smaller proportion at 8.2%. Between 2021 and the present, the percentage of residents aged 15 to 24 has increased from 11.9% to 13.7%, while the 5 to 14 age group has decreased from 14.2% to 13.0% and the 45 to 54 cohort has dropped from 14.7% to 13.7%. Population forecasts for Benowa indicate significant demographic changes by 2041, with the 25-34 age group projected to grow by 43%, adding 377 residents to reach a total of 1,258. Meanwhile, the 15-24 cohort is expected to grow by a modest 1%, gaining 15 people.
