Chart Color Schemes
This analysis uses ABS Statistical Areas Level 2 (SA2) boundaries, which can materially differ from Suburbs and Localities (SAL) even when sharing similar names.
SA2 boundaries are defined by the Australian Bureau of Statistics and are designed to represent communities for statistical reporting (e.g., census and ERP).
Suburbs and Localities (SAL) represent commonly-used suburb/locality names (postal-style areas) and may use different geographic boundaries. For comprehensive analysis, consider reviewing both boundary types if available.
est. as @ -- *
ABS ERP | -- people | --
2021 Census | -- people
Sales Activity
Curious about local property values? Filter the chart to assess the volume and appreciation (including resales) trends and regional comparisons, or scroll to the map below view this information at an individual property level.
Find a Recent Sale
Sales Detail
Population
Population growth drivers in Bundall are strong compared to national averages based on AreaSearch's ranking of recent, and medium to long-term trends
AreaSearch's analysis indicates Bundall's population is approximately 5,087 as of November 2025. This figure reflects a growth of 192 people, representing a 3.9% increase since the 2021 Census, which reported a population of 4,895. The change is inferred from the estimated resident population of 5,080 in June 2024 and an additional 14 validated new addresses since the Census date. This results in a population density ratio of 1,304 persons per square kilometer, higher than the average across national locations assessed by AreaSearch. Overseas migration contributed approximately 70.8% of overall population gains during recent periods.
AreaSearch adopts ABS/Geoscience Australia projections for each SA2 area, released in 2024 with a base year of 2022. For areas not covered and years post-2032, Queensland State Government's SA2 area projections from 2023, based on 2021 data, are used. However, these state projections do not provide age category splits; thus, AreaSearch applies proportional growth weightings in line with ABS Greater Capital Region projections released in 2023, based on 2022 data for each age cohort. Future population dynamics anticipate a significant increase in the top quartile of Australian non-metropolitan areas, with Bundall expected to gain an additional 1,184 persons by 2041, reflecting a total growth of 23.1% over the 17 years based on the latest annual ERP population numbers.
Frequently Asked Questions - Population
Development
Residential development activity is lower than average in Bundall according to AreaSearch's national comparison of local real estate markets
Bundall averaged approximately 13 new dwelling approvals annually over the past five financial years, from FY21 to FY25, with a total of 69 homes approved during this period and an additional 8 approved so far in FY26. The average number of new residents per year per dwelling constructed over these five years was 1.7. This suggests a balanced supply and demand, maintaining stable market conditions.
The average construction value of new homes was $820,000, indicating a focus on premium developments. In the current financial year, there have been $9.6 million in commercial approvals, showing moderate levels of commercial development. Compared to the rest of Queensland, Bundall has significantly lower construction activity, at 87.0% below the regional average per person, which typically reinforces demand and pricing for existing homes. However, recent periods have seen an increase in development activity. This activity remains lower than the national average, suggesting market maturity and possible development constraints. Recent construction comprises 55.0% detached dwellings and 45.0% attached dwellings, with a growing mix of townhouses and apartments offering options across different price points.
This shift from the area's existing housing composition (currently 74.0% houses) indicates decreasing availability of developable sites and reflects changing lifestyles and demand for diverse, affordable housing options. Bundall has approximately 351 people per dwelling approval, reflecting its established status. Population forecasts estimate an increase of 1,177 residents by 2041. If current development rates continue, housing supply may not keep pace with population growth, potentially intensifying competition among buyers and supporting stronger price growth.
Frequently Asked Questions - Development
Infrastructure
Bundall has very high levels of nearby infrastructure activity, ranking in the top 10% nationally
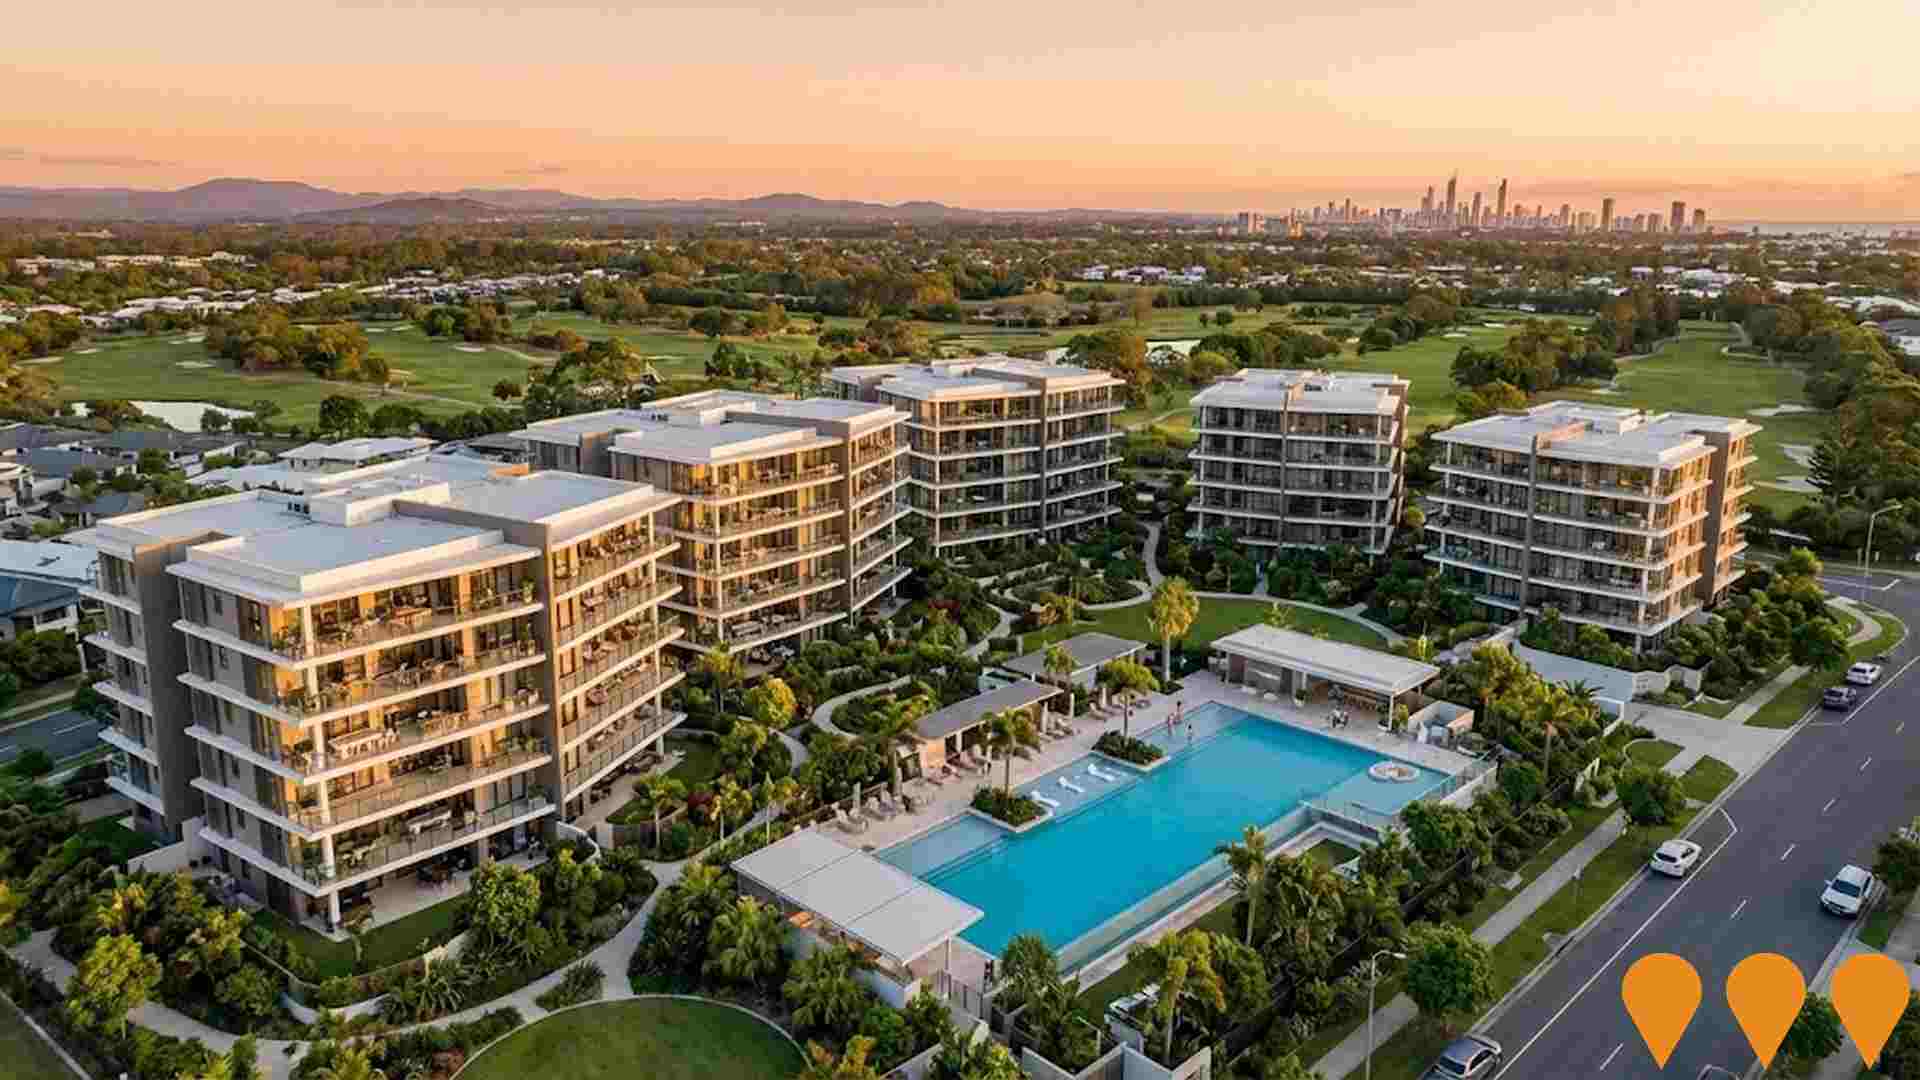
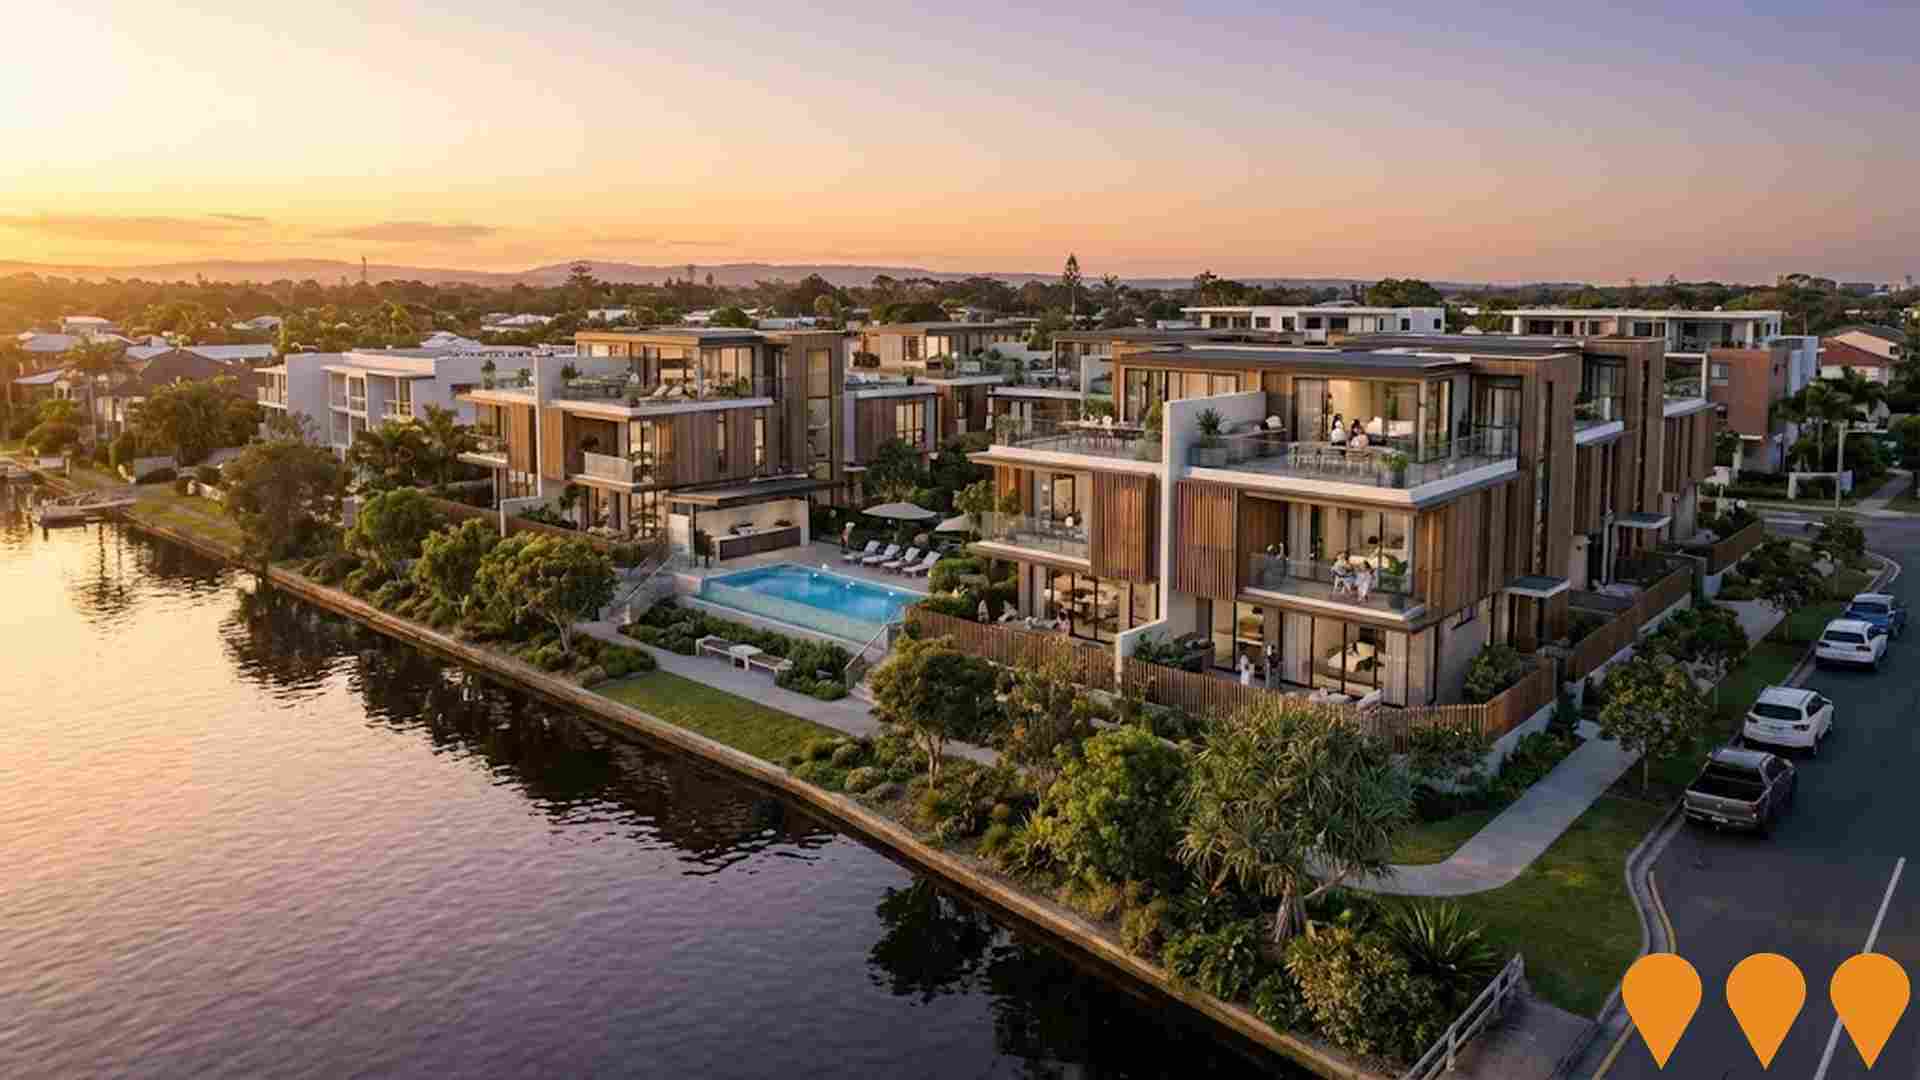
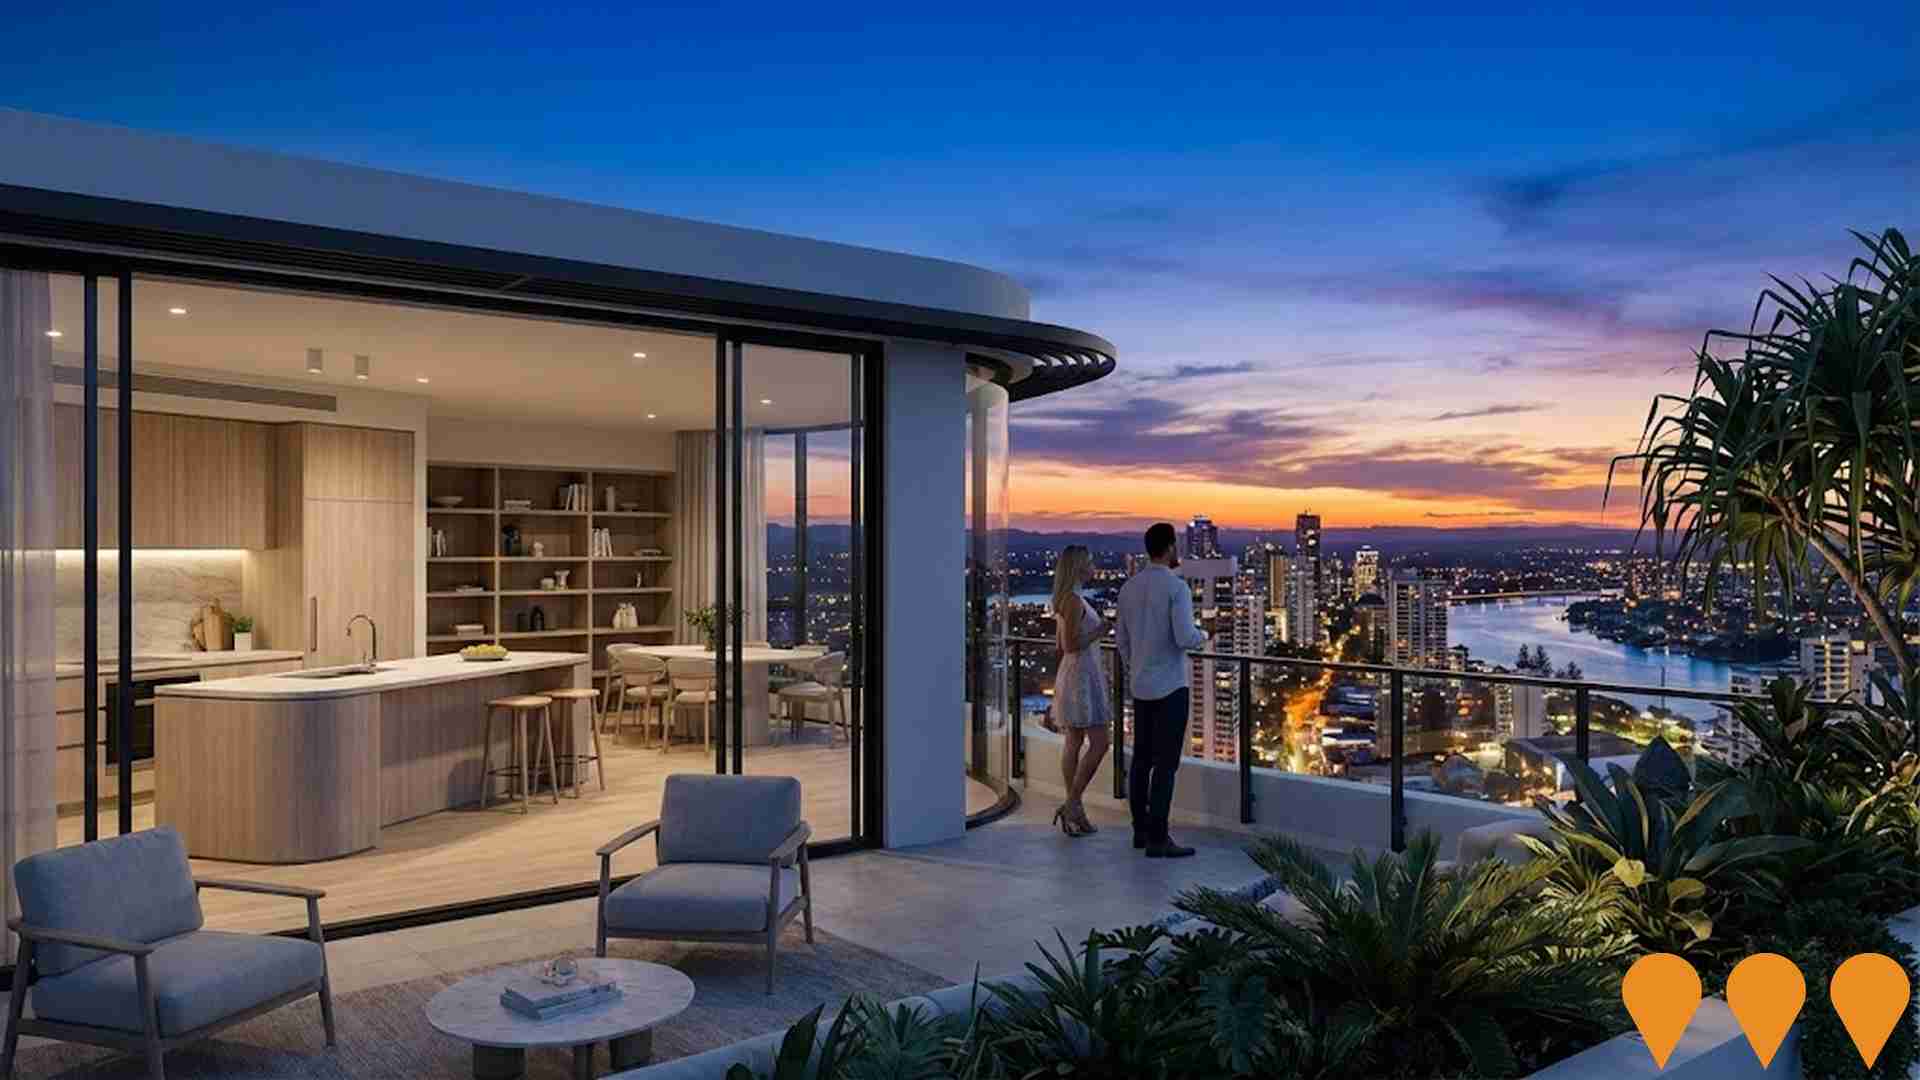
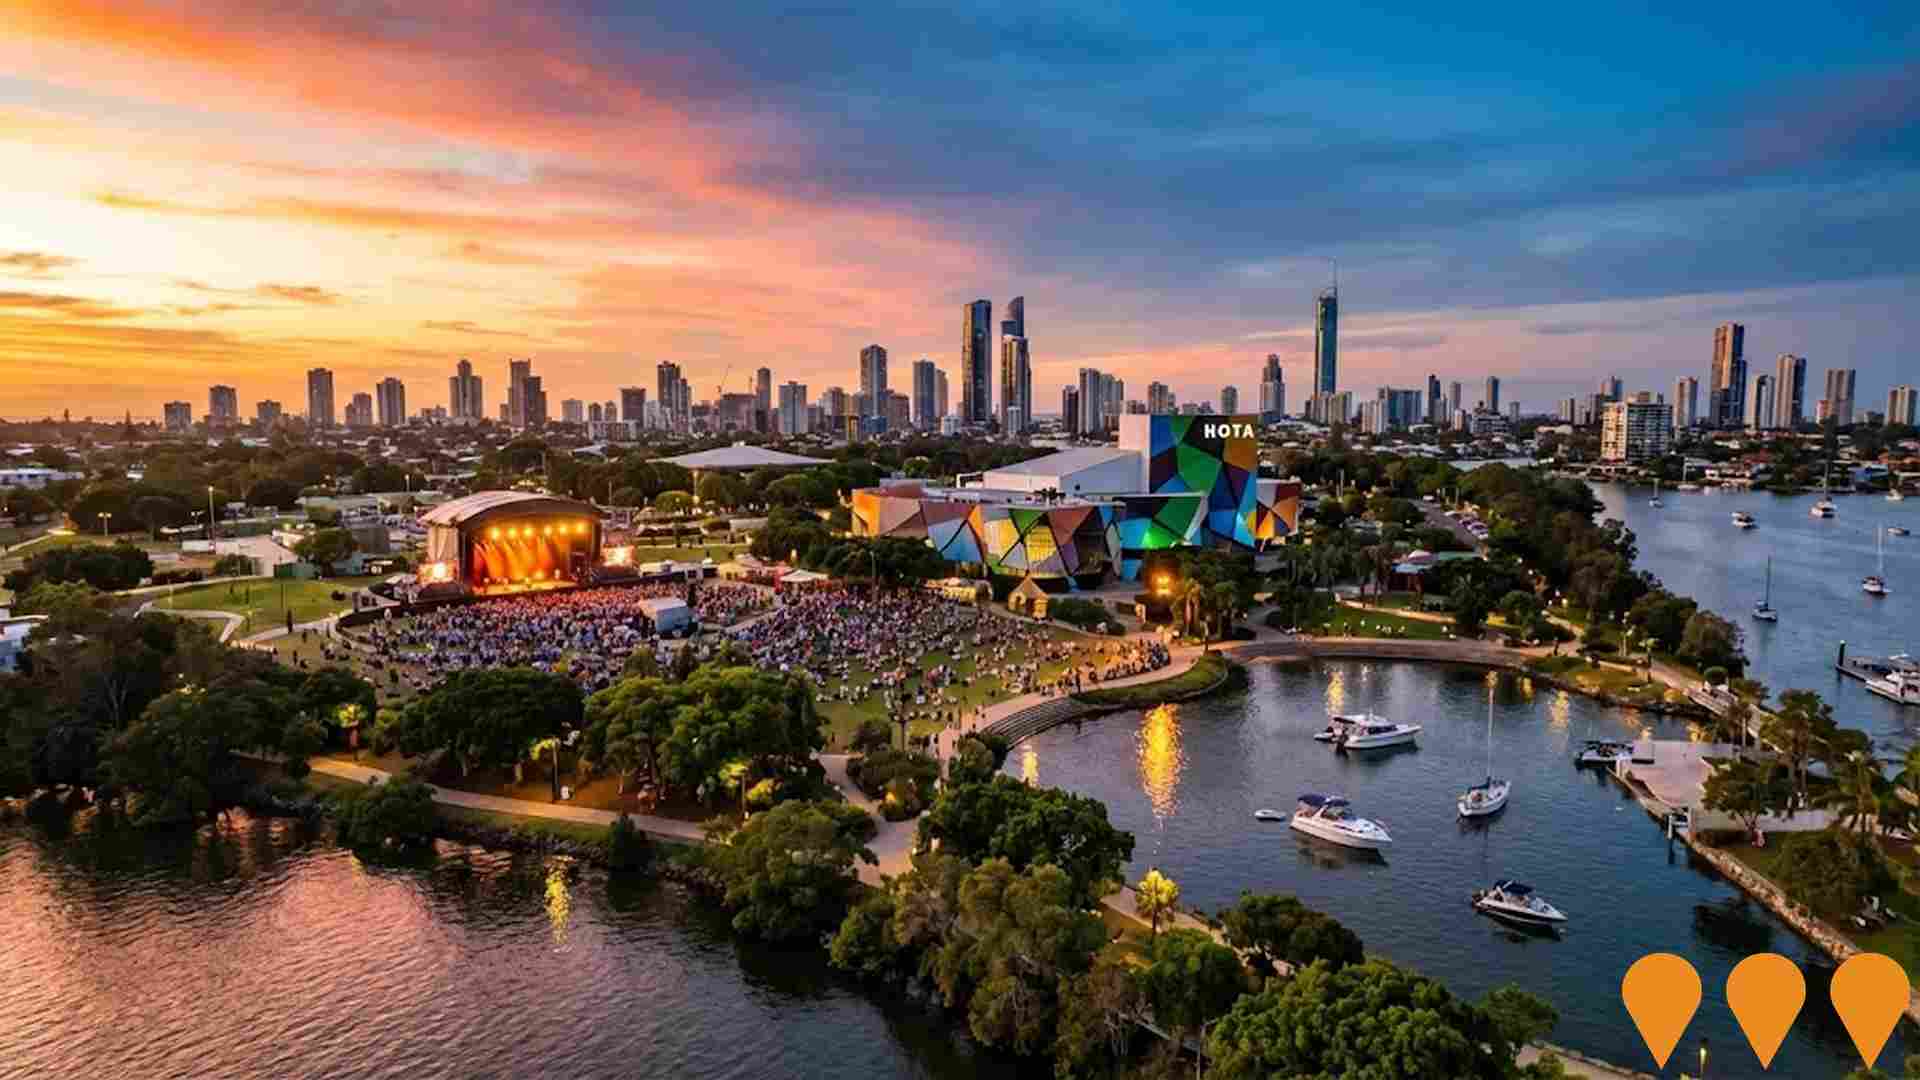
Changes to local infrastructure significantly impact an area's performance. AreaSearch has identified 11 projects likely influencing the region. Notable initiatives include Cross River Rail - New Gold Coast Stations, UNIQ Bundall, Sunlight Lifestyle Precinct, and Benowa Gardens Redevelopment. The following list details those most relevant.
Professional plan users can use the search below to filter and access additional projects.
INFRASTRUCTURE SEARCH
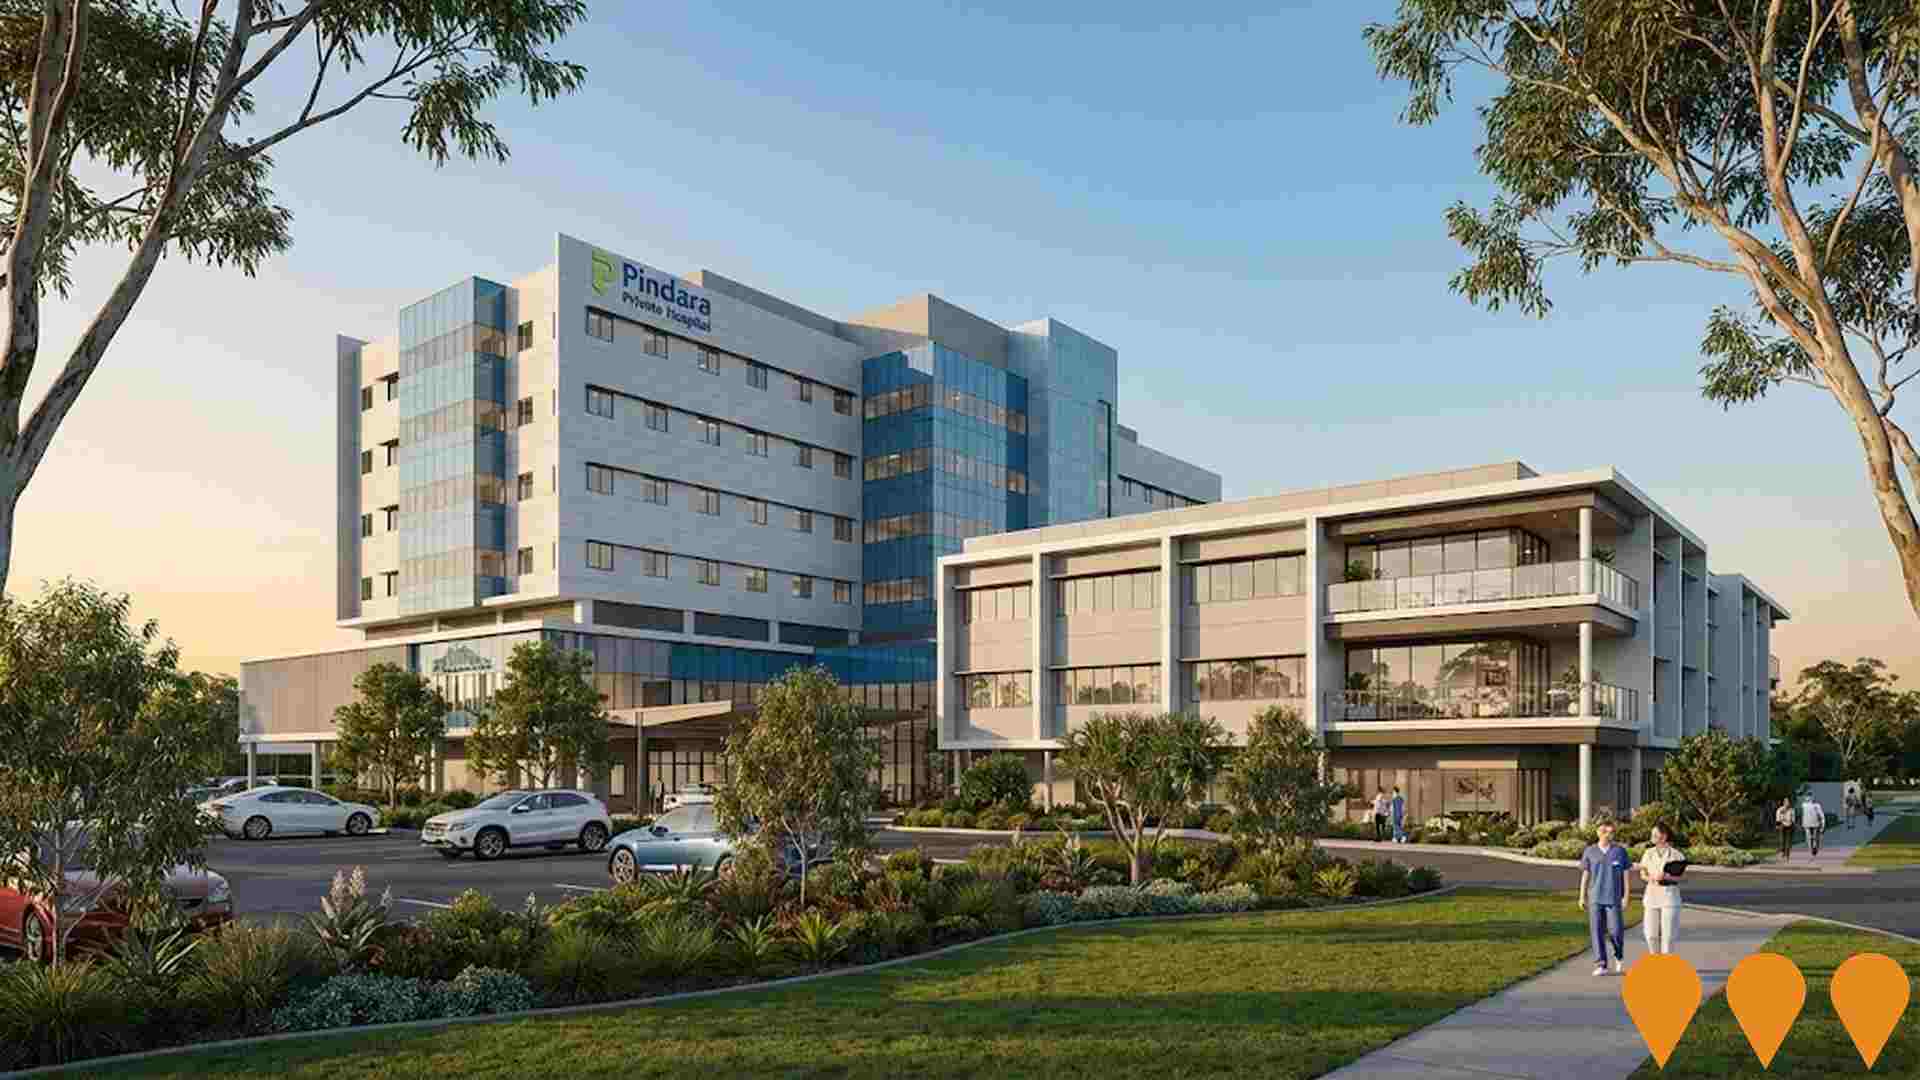
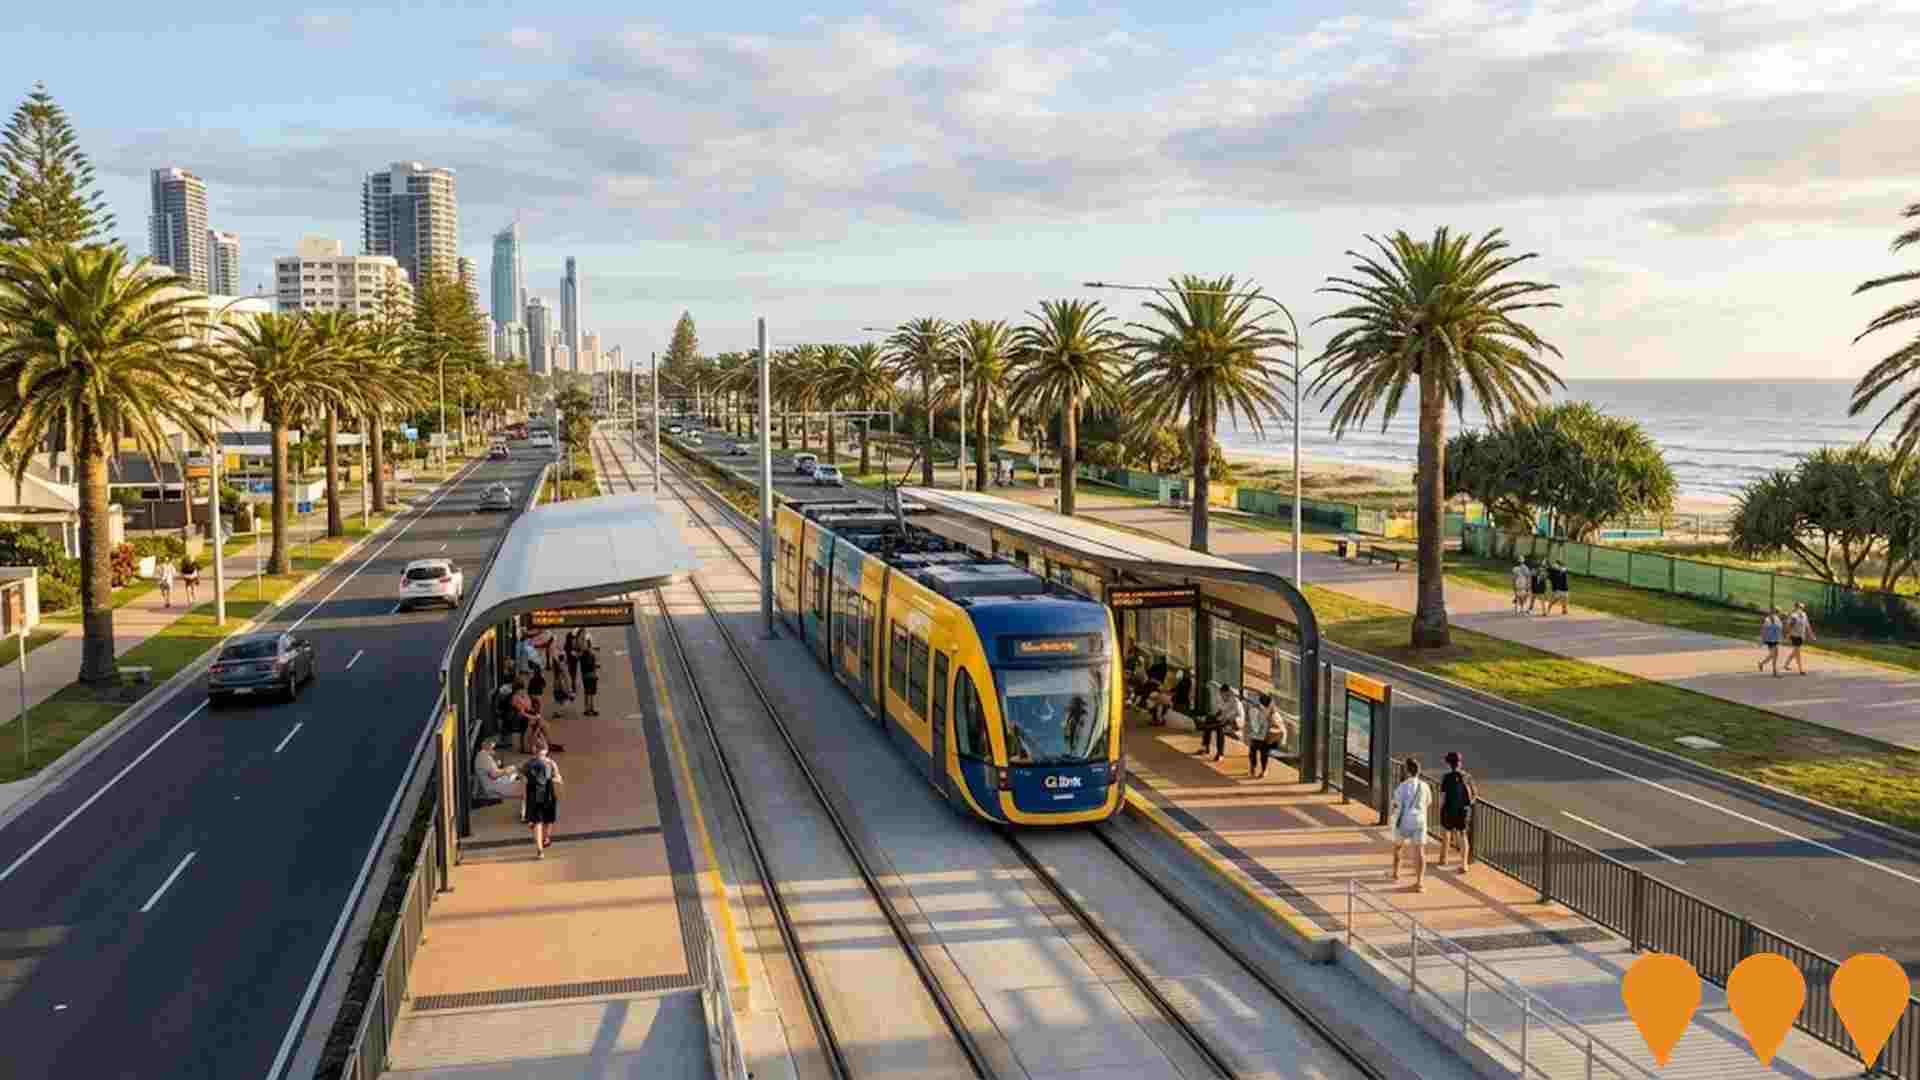
 Denotes AI-based impression for illustrative purposes only, not to be taken as definitive under any circumstances. Please follow links and conduct other investigations from the project's source for actual imagery. Developers and project owners wishing us to use original imagery please Contact Us and we will do so.
Frequently Asked Questions - Infrastructure
Pindara Private Hospital Stage 3 Expansion
The Stage 3 expansion of Pindara Private Hospital involved the southern extension of the Dr David Lindsay Wing, adding two luxurious wards with spacious private ensuited rooms and two new cutting-edge operating theatres. This increased the total licensed beds to 348, enhanced medical services, and expanded capacity for Day Infusion and Renal Dialysis Services.
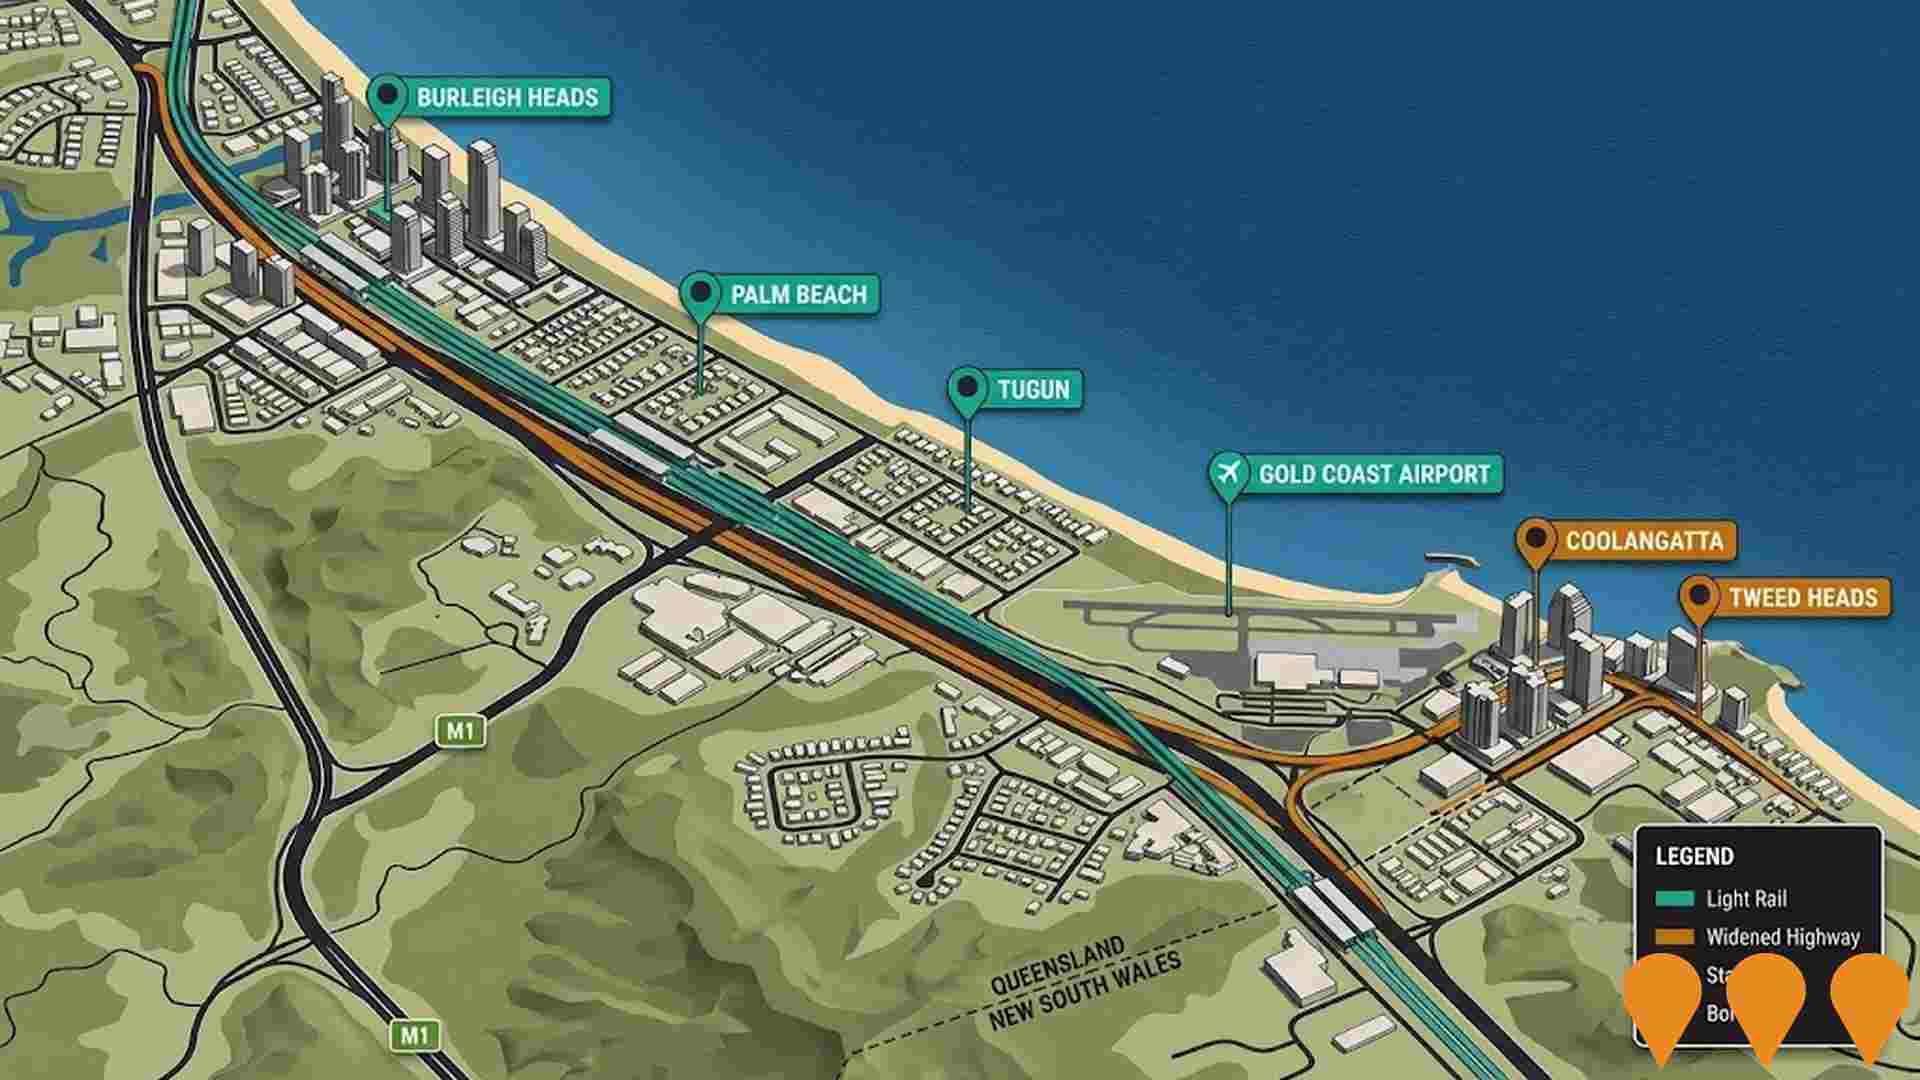
Gold Coast Light Rail Stage 3 (Broadbeach South to Burleigh Heads)
6.7-kilometre, dual-track extension of the Gold Coast Light Rail (G:link) from Broadbeach South to Burleigh Heads. The $1.5 billion project includes 8 new stations, 5 additional light rail vehicles, an upgrade and expansion of the existing depot, and new bus/light rail connections at Burleigh Heads and Miami. Major construction commenced in July 2022. Once complete, the total G:link network will span 27km from Helensvale to Burleigh Heads, reducing congestion and supporting population growth. Rail installation is underway in the center of the Gold Coast Highway, with the first tram successfully travelling on the new northern tracks in November 2025. Completion for passenger services is expected in mid-2026.
Cypress Central
Cypress Central is a $2 billion masterplanned mixed-use urban village on approximately 25 hectares in Carrara, Gold Coast. The approved development comprises 11 towers delivering 1,550 apartments, significant retail and commercial floor space, recreational facilities and public open space, creating a new urban centre around the Gooding Drive / Nerang-Broadbeach Road roundabout.
Cross River Rail - New Gold Coast Stations
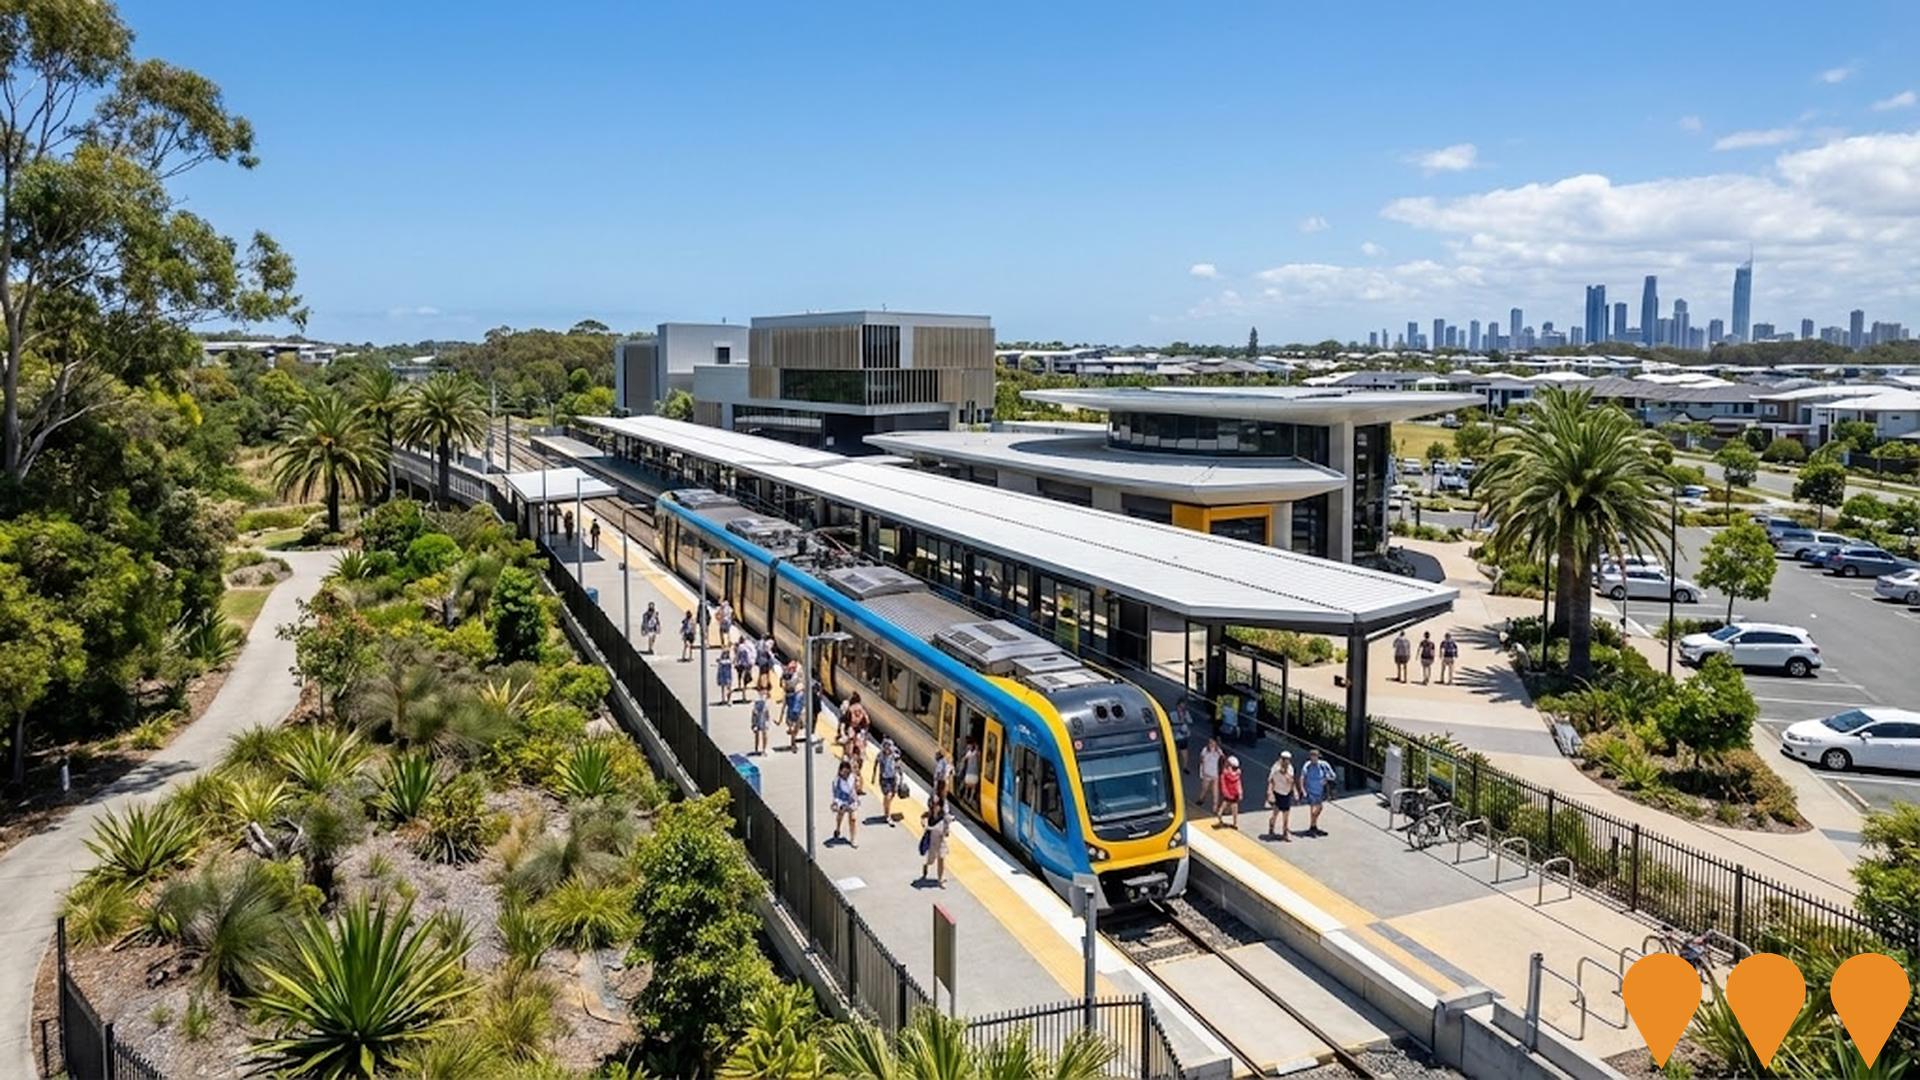
Three new stations are being delivered on the Gold Coast line at Pimpama, Hope Island and Merrimac by the Cross River Rail Delivery Authority. Each station includes parking and set-down areas, accessible lifts and wayfinding, pedestrian and cycle connections, public transport integration and upgraded lighting and CCTV. Major construction is underway at all three sites, with ADCO Constructions delivering Pimpama, Acciona Georgiou JV delivering Hope Island and Fulton Hogan delivering Merrimac.
Benowa Gardens Redevelopment
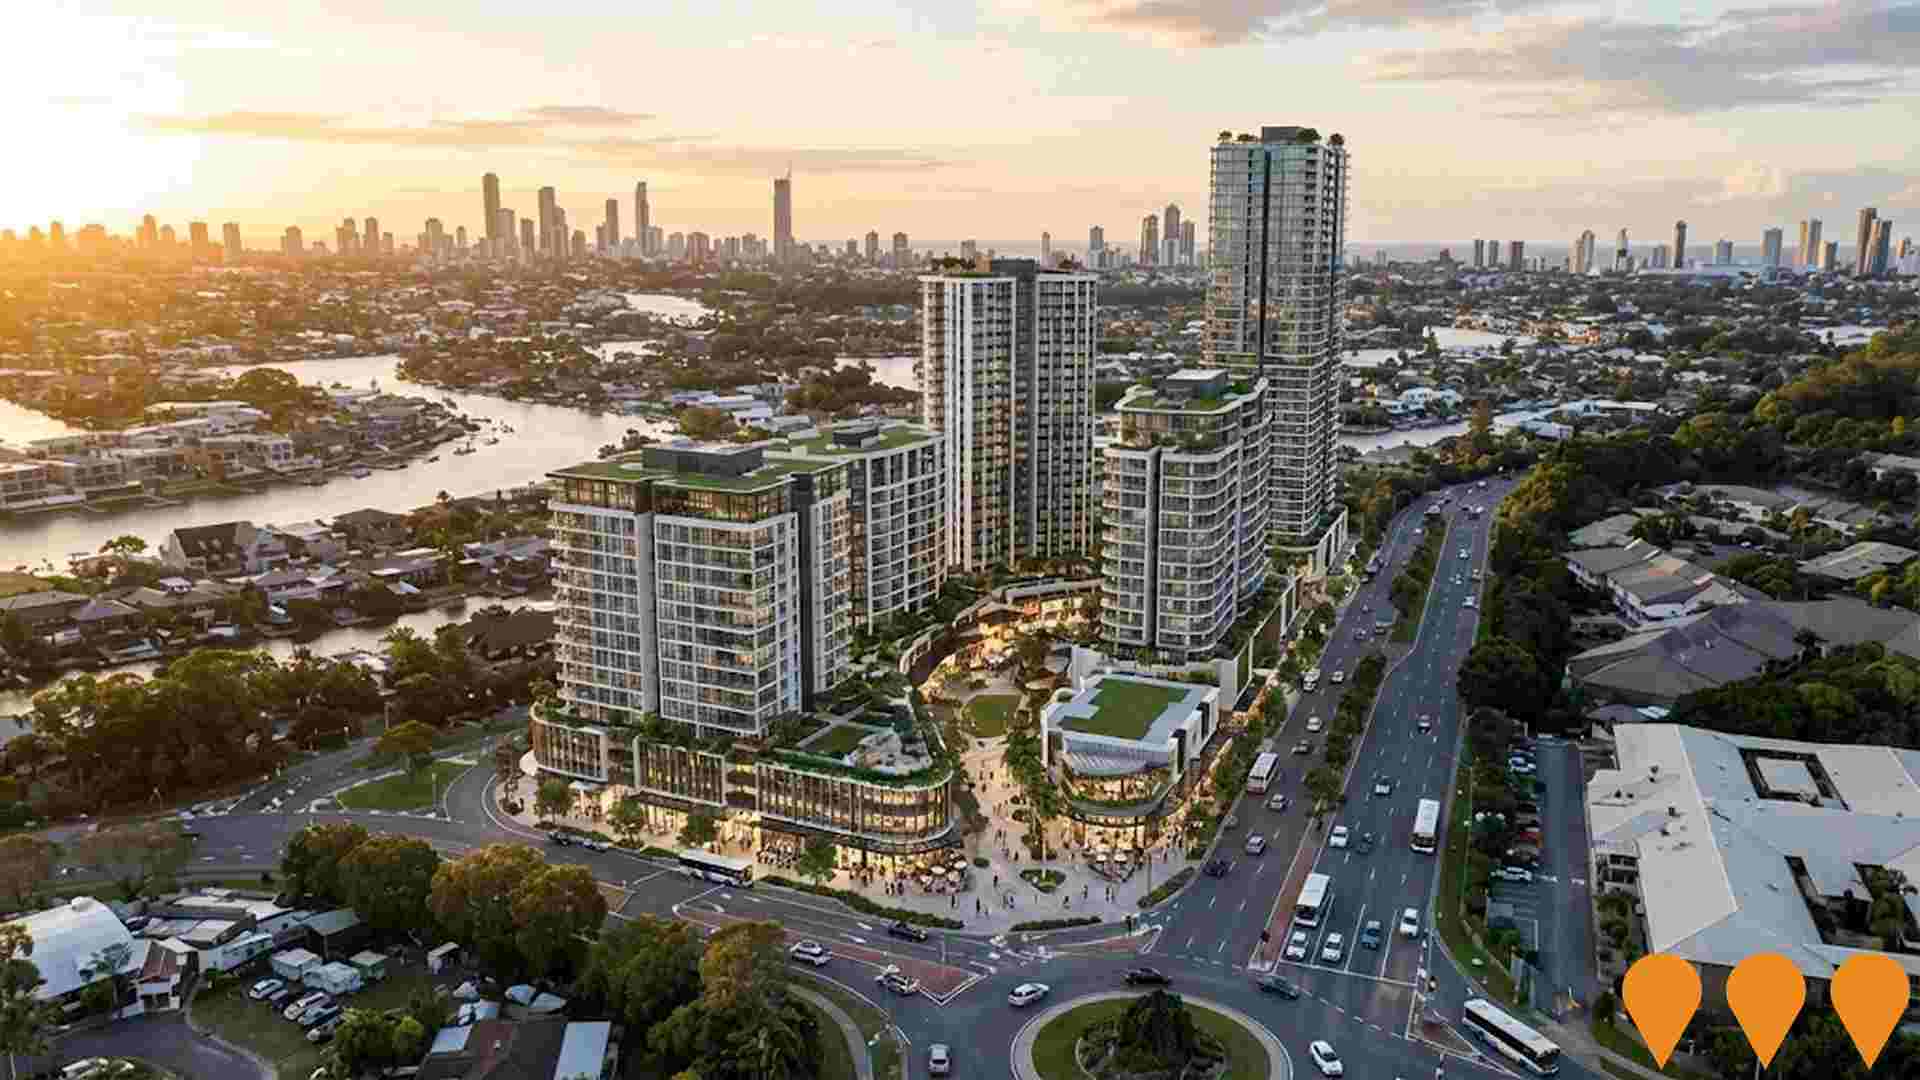
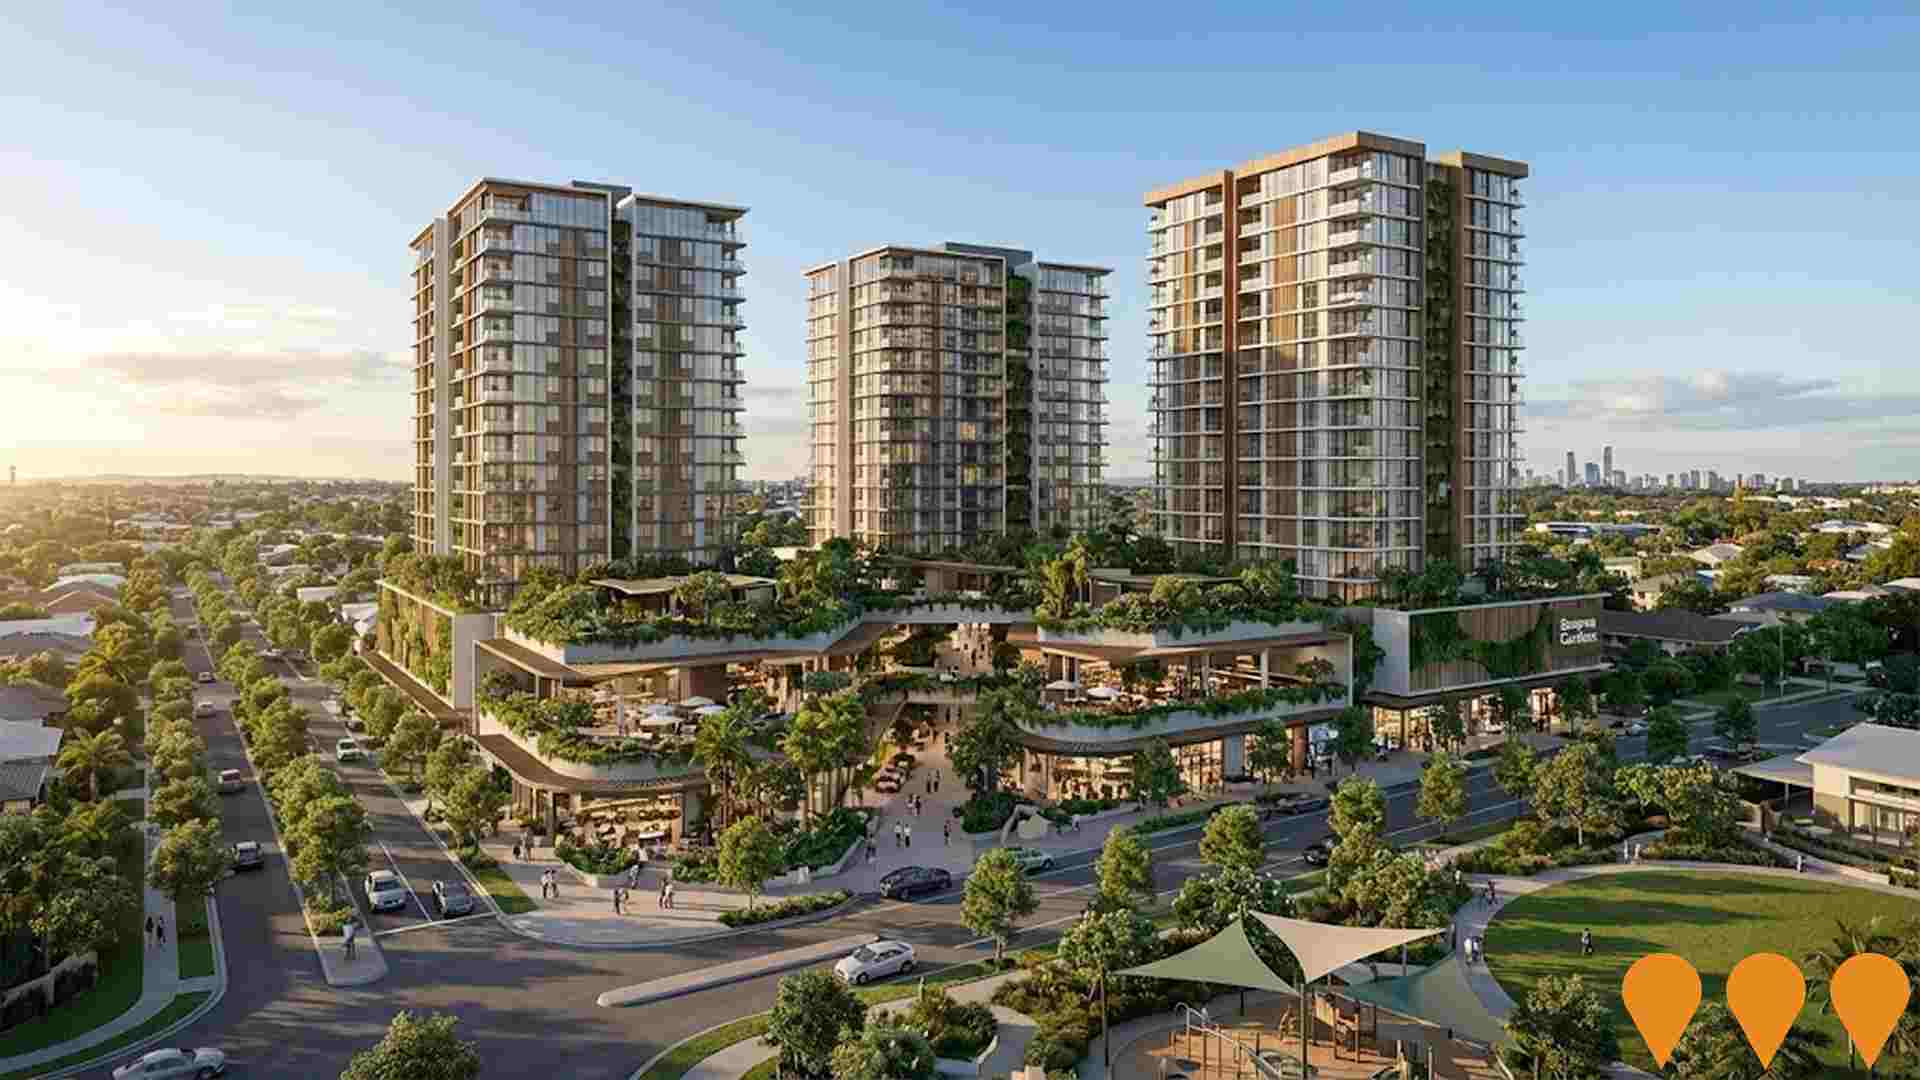
Major mixed-use redevelopment of the existing Benowa Gardens Shopping Centre into a vibrant vertical village. The impact-assessable development application proposes three residential towers (up to 13 storeys) delivering 441 apartments and 41 short-term accommodation units above a revitalised retail and commercial podium of approximately 10,000 sqm GFA retail and 3,000 sqm office/medical suites, with three levels of basement parking.
Gold Coast Regional Botanic Gardens Biodiversity Centre
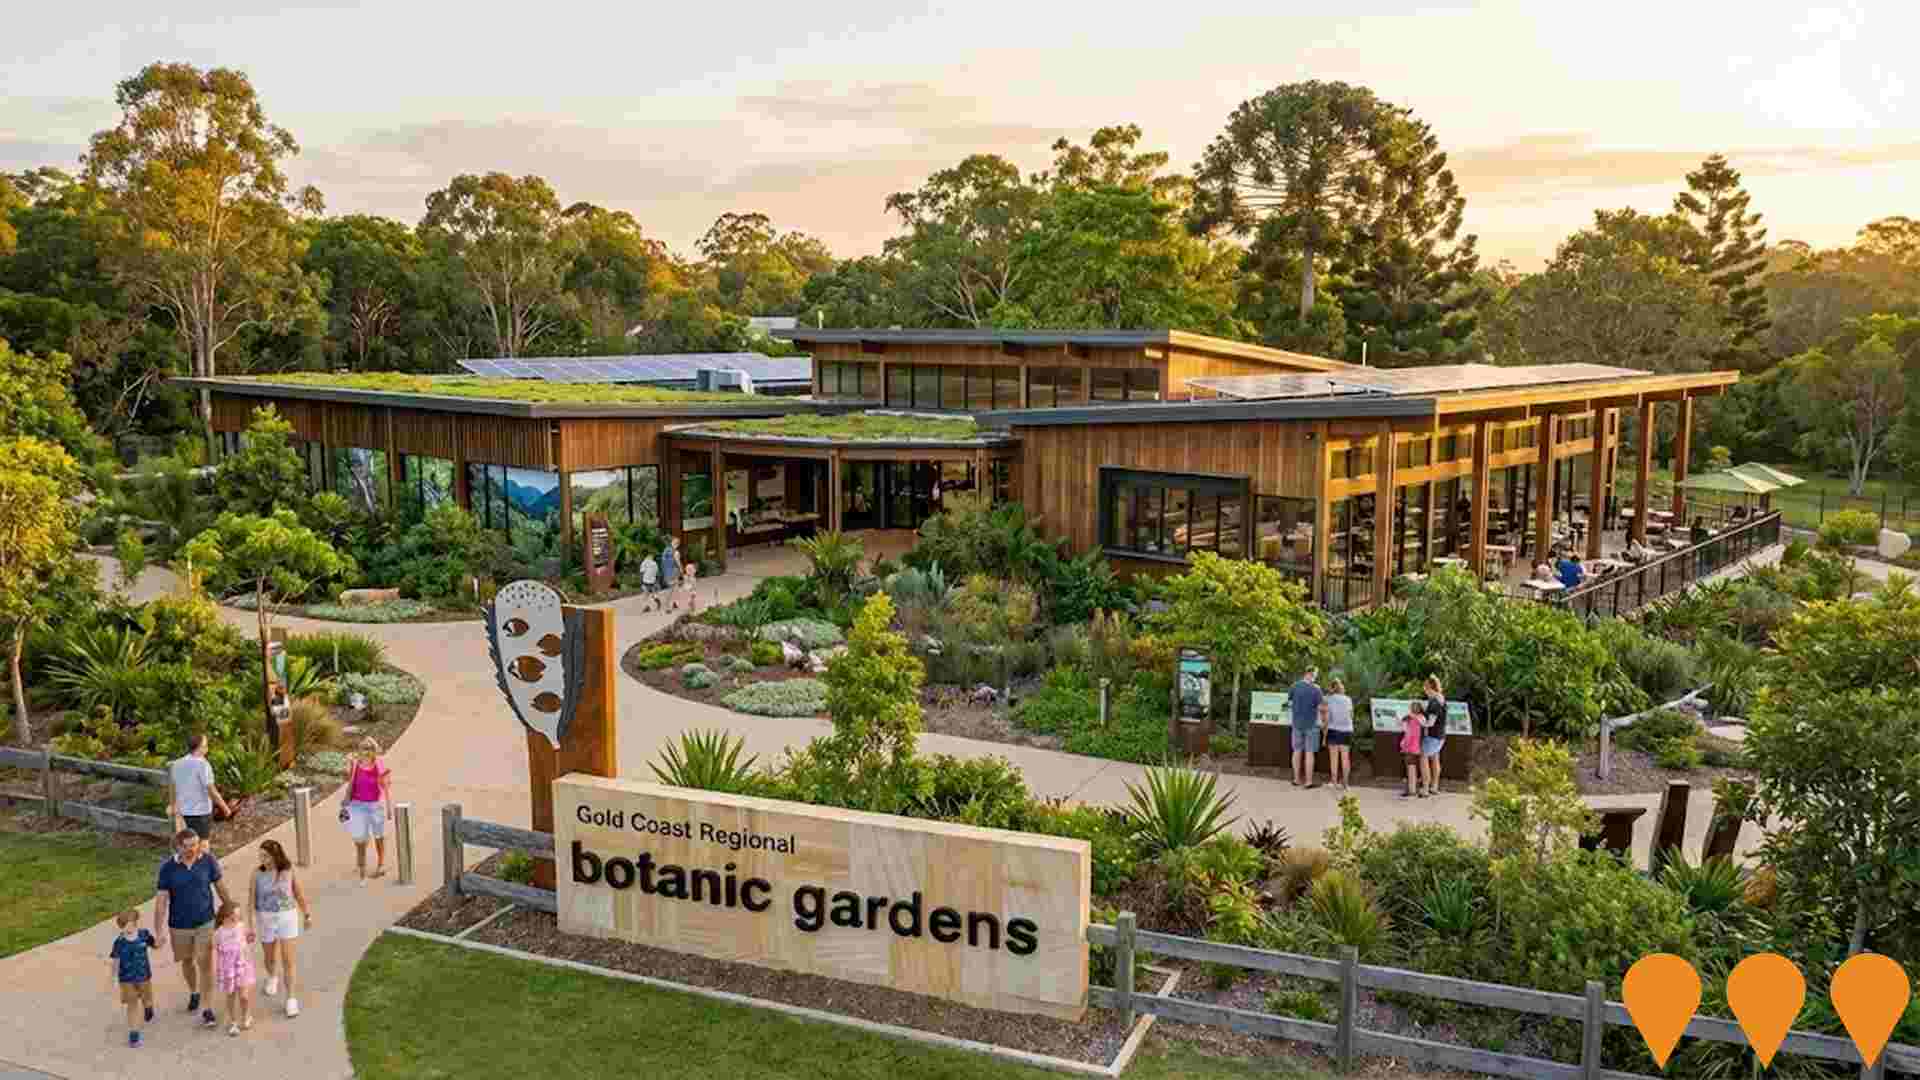
A new biodiversity centre within the Gold Coast Regional Botanic Gardens offering a mountains to mangroves journey through interactive displays and gardens, focusing on local flora, fauna, history, and culture. It includes exhibition spaces, flexible areas for conferences, teaching, and functions, a cafe, merchandise shop, administration, amenities, plaza spaces, additional car parking, pathways, and lighting.
Coomera Connector Stage 1 South
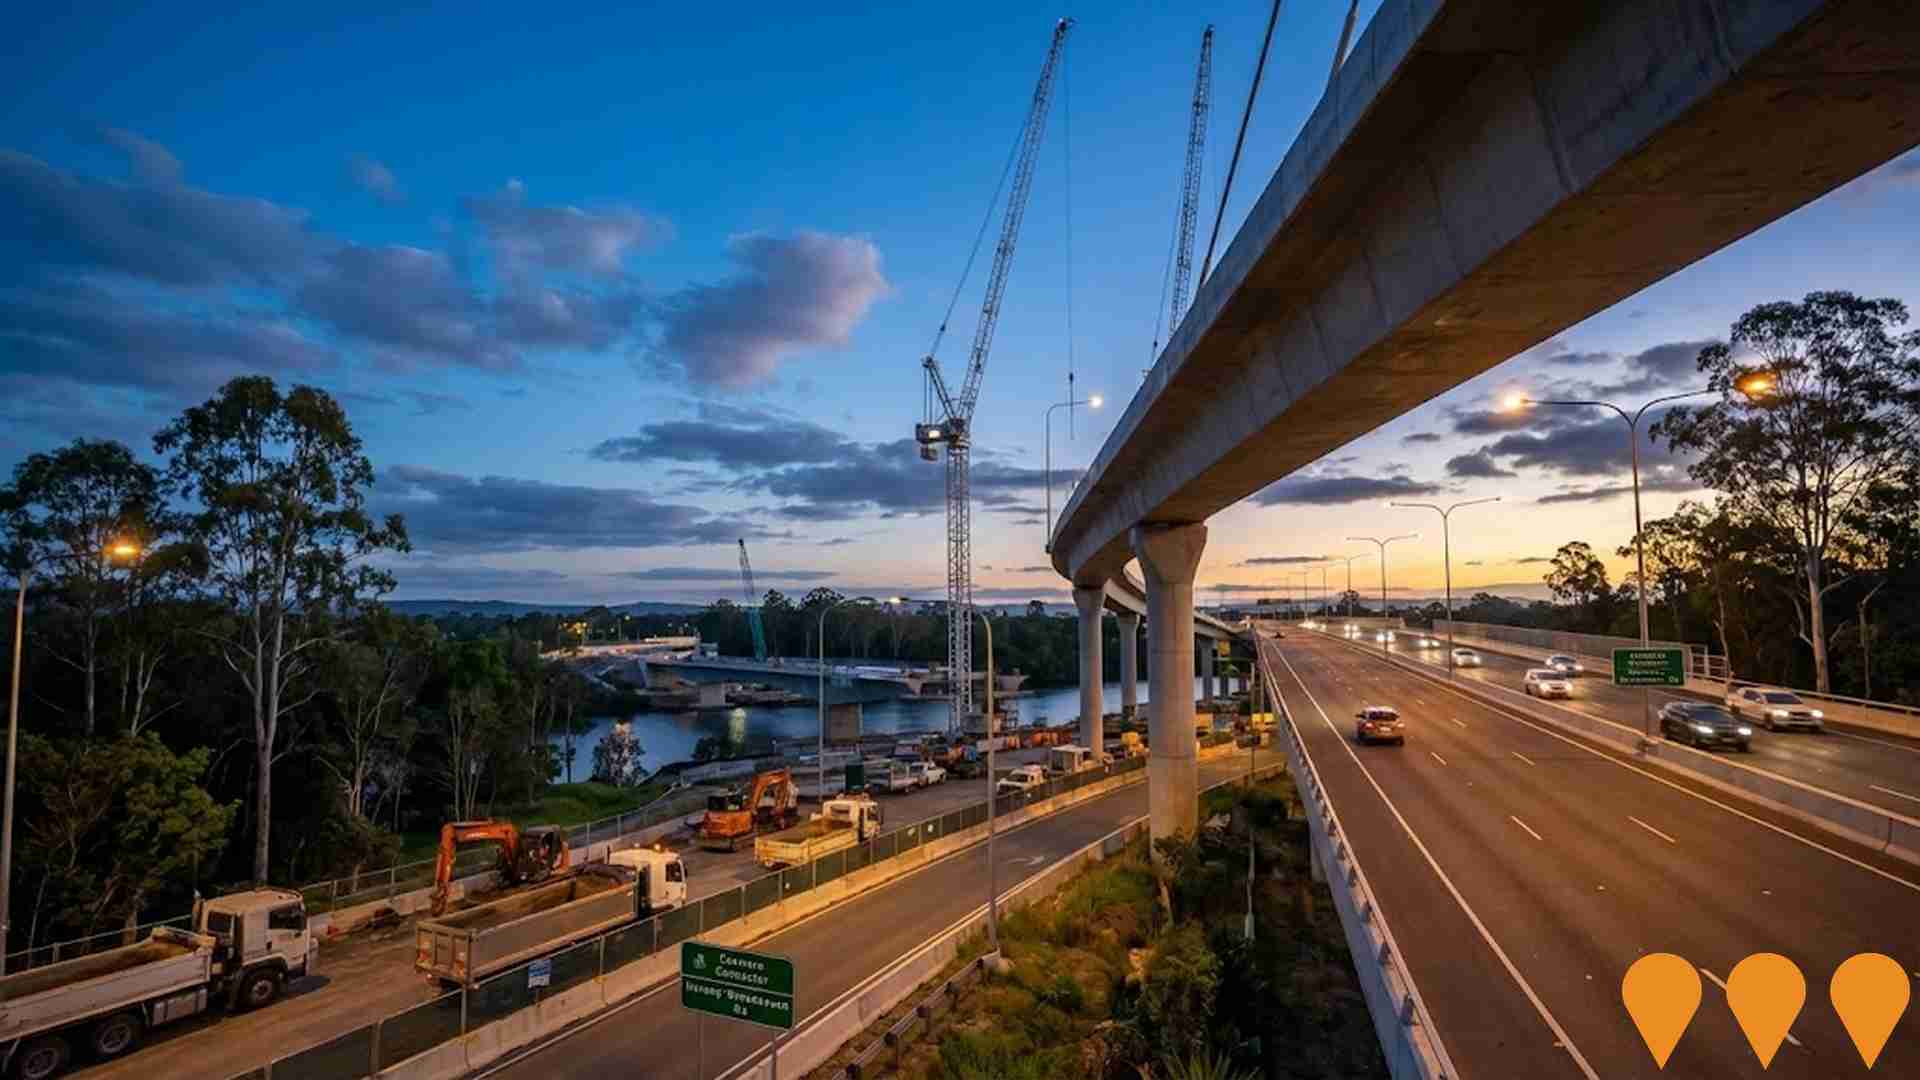
Stage 1 South delivers a new four lane motorway from Smith Street Motorway to Nerang-Broadbeach Road, including a new grade separated interchange at Southport-Nerang Road, a new intersection at Nerang-Broadbeach Road, and an approx. 300 m bridge over the Nerang River. Early works are underway and the main construction contract has been awarded, with construction commenced mid 2025.
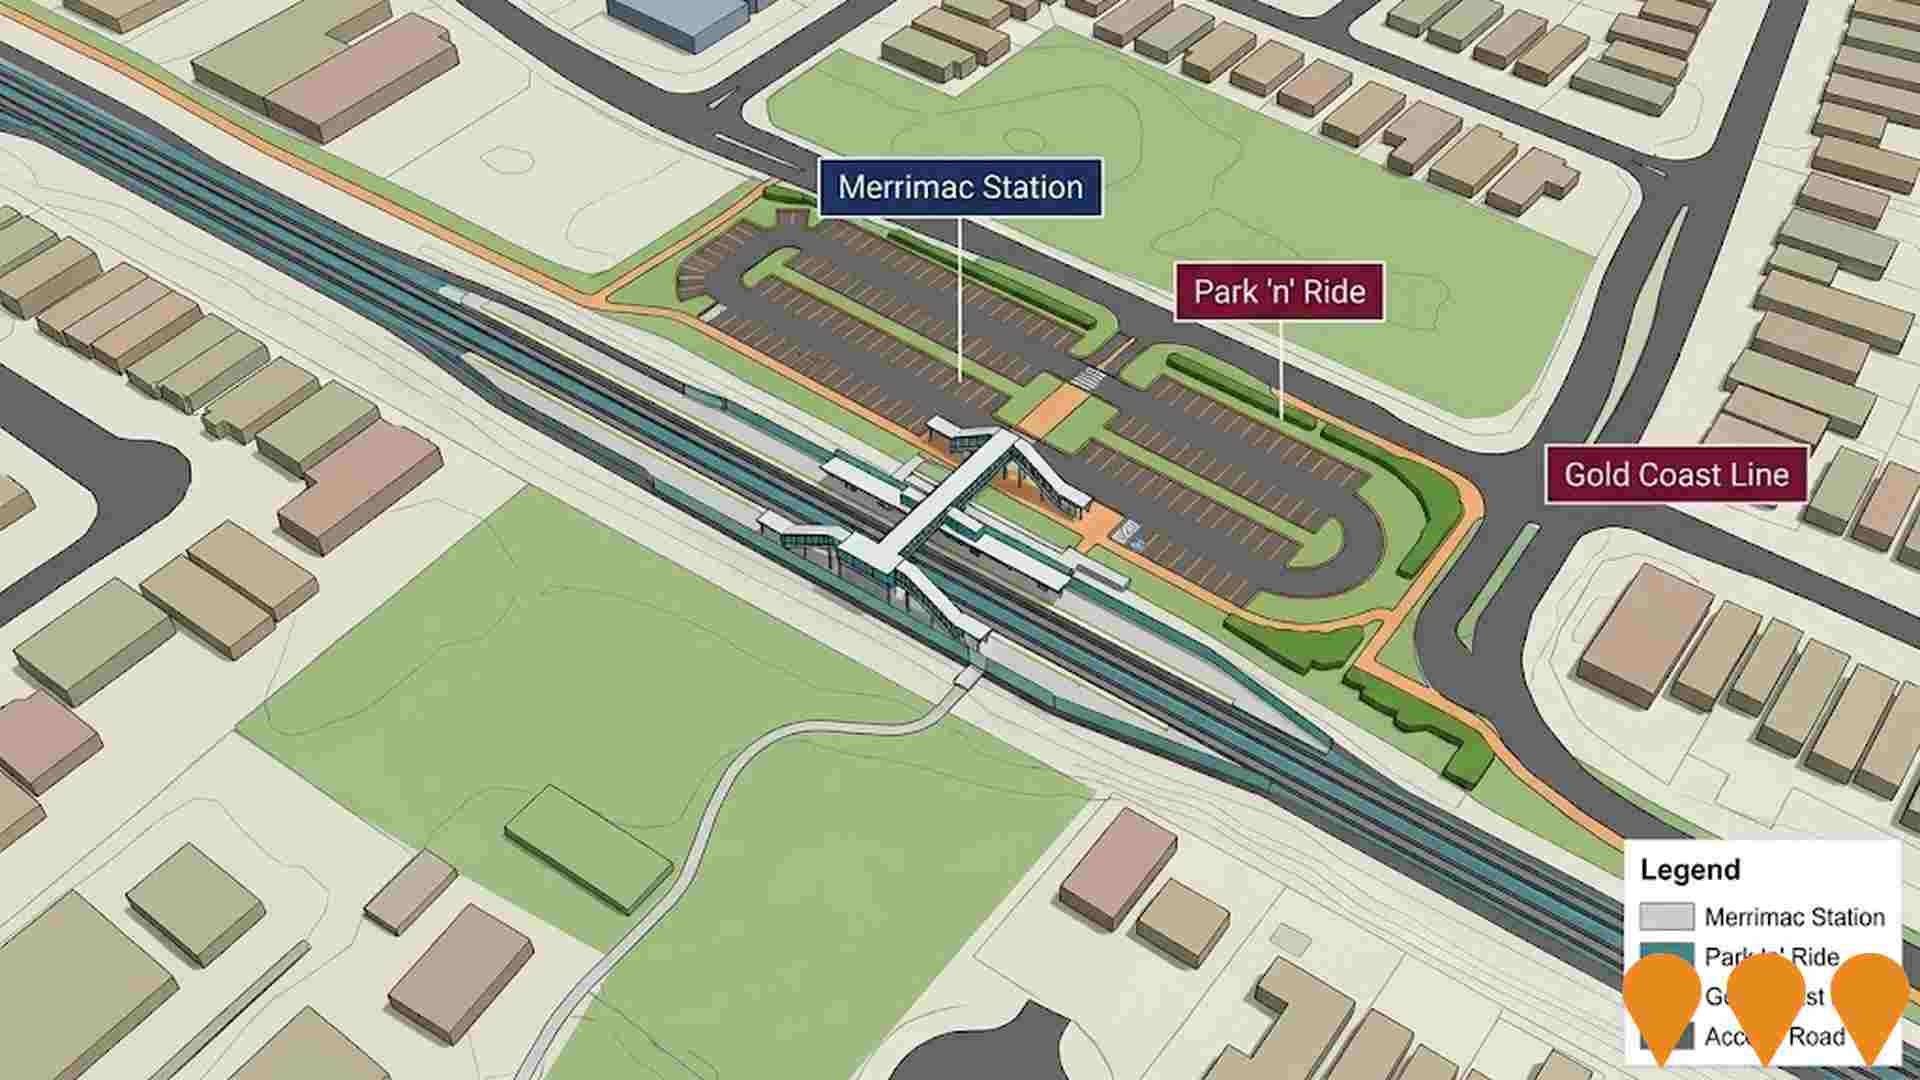
Merrimac Railway Station
New railway station on the Gold Coast Line, part of the Cross River Rail project. Located between Nerang and Robina stations, serving Merrimac, Worongary, and Carrara suburbs. Constructed by Fulton Hogan, it features accessible design, passenger amenities, and improved connectivity for southern Gold Coast communities.
Employment
Employment conditions in Bundall demonstrate exceptional strength compared to most Australian markets
Bundall has an educated workforce with professional services well represented. Its unemployment rate was 2.4% in the past year, with estimated employment growth of 1.9%.
As of September 2025, 2843 residents are employed, with a 1.6% lower unemployment rate than Rest of Qld's 4.1%, and workforce participation at 64.3% compared to Rest of Qld's 59.1%. Employment is concentrated in health care & social assistance, construction, and accommodation & food services. The area specializes in professional & technical jobs, with an employment share twice the regional level, but has lower representation in agriculture, forestry & fishing at 0.4% versus the regional average of 4.5%. There are 1.5 workers per resident, indicating Bundall functions as an employment hub attracting workers from surrounding areas.
From September 2024 to September 2025, employment increased by 1.9%, labour force by 2.0%, and unemployment rose by 0.1 percentage points. In contrast, Rest of Qld saw employment growth of 1.7% and labour force growth of 2.1%, with a 0.3 percentage point rise in unemployment. State-level data to 25-Nov-25 shows Queensland's employment contracted by 0.01%, losing 1210 jobs, with the state unemployment rate at 4.2%, closely aligned with the national rate of 4.3%. Jobs and Skills Australia's forecasts from May-25 project national employment growth of 6.6% over five years and 13.7% over ten years. Applying these projections to Bundall's employment mix suggests local employment should increase by 6.9% over five years and 13.9% over ten years, though this is a simple extrapolation for illustrative purposes and does not consider local population projections.
Frequently Asked Questions - Employment
Income
The economic profile demonstrates above-average performance, with income metrics exceeding national benchmarks based on AreaSearch comparative assessment
The Bundall SA2 had a median taxpayer income of $52,364 and an average of $86,678 in the latest postcode level ATO data aggregated by AreaSearch for financial year 2022. This is notably higher than the national figures of $50,780 (median) and $64,844 (average) for Rest of Qld during the same period. By September 2025, estimated median income would be approximately $59,690 and average income around $98,804 based on Wage Price Index growth since financial year 2022. According to the 2021 Census, incomes in Bundall cluster around the 65th percentile nationally. Income distribution shows that 29.1% of residents (1,480 people) fall within the $1,500 - 2,999 bracket, consistent with broader metropolitan trends at 31.7%. Economic strength is evident with 31.4% of households earning high weekly incomes exceeding $3,000. Despite high housing costs consuming 18.2% of income, disposable income remains at the 59th percentile nationally. The area's SEIFA income ranking places it in the 8th decile.
Frequently Asked Questions - Income
Housing
Bundall is characterized by a predominantly suburban housing profile, with above-average rates of outright home ownership
The dwelling structure in Bundall, as per the latest Census, consisted of 73.7% houses and 26.3% other dwellings (semi-detached, apartments, 'other' dwellings). This contrasts with Non-Metro Qld's figures of 25.1% houses and 74.9% other dwellings. Home ownership in Bundall stood at 35.5%, with mortgaged dwellings at 38.0% and rented dwellings at 26.6%. The median monthly mortgage repayment was $2,600, higher than Non-Metro Qld's average of $1,950. The median weekly rent in Bundall was $480, compared to Non-Metro Qld's $375. Nationally, Bundall's mortgage repayments were significantly higher at $2,600 against the Australian average of $1,863, while rents were substantially above the national figure of $375.
Frequently Asked Questions - Housing
Household Composition
Bundall features high concentrations of group households, with a higher-than-average median household size
Family households constitute 75.0% of all households, including 32.9% couples with children, 29.3% couples without children, and 11.5% single parent families. Non-family households account for the remaining 25.0%, with lone person households at 20.6% and group households comprising 4.6%. The median household size is 2.6 people, larger than the Rest of Qld average of 2.1.
Frequently Asked Questions - Households
Local Schools & Education
The educational profile of Bundall exceeds national averages, with above-average qualification levels and academic performance metrics
Bundall's educational attainment is notably higher than broader benchmarks. Among residents aged 15 and above, 32.8% possess university qualifications, compared to 20.6% in the rest of Queensland and 25.4% in the SA4 region. The area has a substantial advantage in education, with bachelor degrees being the most prevalent at 23.9%, followed by postgraduate qualifications (6.5%) and graduate diplomas (2.4%). Vocational credentials are also prominent, with 33.2% of residents holding such qualifications - advanced diplomas (12.8%) and certificates (20.4%).
Educational participation is high in Bundall, with 31.2% of residents currently enrolled in formal education. This includes 10.0% in secondary education, 9.7% in primary education, and 5.4% pursuing tertiary education.
Frequently Asked Questions - Education
Schools Detail
Nearby Services & Amenities
Transport
Transport servicing is moderate compared to other areas nationally based on assessment of service frequency, route connectivity and accessibility
Public transport analysis indicates nine active transport stops operating within Bundall, consisting of a mix of buses. These stops are served by five individual routes, collectively facilitating 938 weekly passenger trips. Transport accessibility is rated as moderate, with residents typically situated 530 meters from the nearest transport stop.
Service frequency averages 134 trips per day across all routes, equating to approximately 104 weekly trips per individual stop.
Frequently Asked Questions - Transport
Transport Stops Detail
Health
Bundall's residents boast exceedingly positive health performance metrics with very low prevalence of common health conditions across all age groups
Health outcomes data shows excellent results across Bundall, with very low prevalence of common health conditions across all age groups. As of [insert date], approximately 64% of Bundall's total population (3,245 people) have private health cover, compared to 58.1% in the rest of Queensland and a national average of 55.3%. The most prevalent medical conditions are arthritis and asthma, affecting 6.9 and 5.9% of residents respectively, while 74.8% report being completely free from medical ailments, compared to 72.6% in the rest of Queensland.
As of [insert date], Bundall has 14.9% of residents aged 65 and over (759 people), which is lower than the 21.8% in the rest of Queensland. Health outcomes among seniors are notably strong, broadly aligning with the general population's health profile.
Frequently Asked Questions - Health
Cultural Diversity
The level of cultural diversity witnessed in Bundall was found to be above average when compared nationally for a number of language and cultural background related metrics
Bundall's population, as of 2016 Census data, showed higher cultural diversity than most local markets with 18.8% speaking a language other than English at home and 33.0% born overseas. Christianity was the predominant religion in Bundall, accounting for 53.8%. Judaism, however, was slightly overrepresented at 0.5%, compared to 0.6% regionally.
The top three ancestry groups were English (28.7%), Australian (20.0%), and Irish (9.3%). Other ethnic groups with notable divergences included Hungarian (0.6% vs regional 0.4%) and Spanish (0.8% vs regional 1.1%).
Frequently Asked Questions - Diversity
Age
Bundall's population is slightly older than the national pattern
Bundall has a median age of 40, close to Rest of Qld's figure of 41 and exceeding the national norm of 38. The 45-54 age group is strongly represented at 14.7%, higher than Rest of Qld, while the 65-74 cohort is less prevalent at 8.6%. Post-2021 Census, the 35 to 44 age group grew from 13.4% to 14.9%, and the 15 to 24 cohort increased from 12.0% to 13.1%. Conversely, the 65 to 74 cohort declined from 10.1% to 8.6%. Demographic modeling indicates Bundall's age profile will significantly evolve by 2041, with the 35 to 44 group leading this shift, growing by 36% (275 people) to reach 1,033 from 757.
