Chart Color Schemes
This analysis uses ABS Statistical Areas Level 2 (SA2) boundaries, which can materially differ from Suburbs and Localities (SAL) even when sharing similar names.
SA2 boundaries are defined by the Australian Bureau of Statistics and are designed to represent communities for statistical reporting (e.g., census and ERP).
Suburbs and Localities (SAL) represent commonly-used suburb/locality names (postal-style areas) and may use different geographic boundaries. For comprehensive analysis, consider reviewing both boundary types if available.
est. as @ -- *
ABS ERP | -- people | --
2021 Census | -- people







Curious about local property values? Filter the chart to assess the volume and appreciation (including resales) trends and regional comparisons, or scroll to the map below view this information at an individual property level.

Find a Recent Sale

Sales Detail
Moreton Island has an estimated 334 residents, up from 309 at the 2021 Census — a change of 25 people, or 8.1%. Overseas migration accounts for 100.0% of that increase. Fewer than ten people live on each square kilometre, across a boundary that takes in surrounding rural land. Population is estimated from ABS Estimated Resident Population releases and GNAF address data, re-based from the 2021 Census and updated annually.
Detail
Based on AreaSearch's analysis, Moreton Island's population is around 334 as of Nov 25. This reflects an increase of 25 people (8.1%) since the 2021 Census, which reported a population of 309 people. The change is inferred from the estimated resident population of 333 from the ABS as of June 2024 and address validation since the Census date. This level of population equates to a density ratio of 1.9 persons per square kilometer, a level providing ample space per person. Moreton Island's 8.1% growth since census positions it within 0.8 percentage points of the national average (8.9%), demonstrating competitive growth fundamentals.
Population growth for the area was primarily driven by overseas migration, which was essentially the sole driver of population gains during recent periods. AreaSearch is adopting ABS/Geoscience Australia projections for each SA2 area, as released in 2024 with 2022 as the base year. For any SA2 areas not covered by this data, and for years post-2032, Queensland State Government's SA2 area projections, released in 2023 and based on 2021 data, are adopted. It should be noted that these state projections do not provide age category splits; hence where utilised, AreaSearch is applying proportional growth weightings in line with the ABS Greater Capital Region projections (released in 2023, based on 2022 data) for each age cohort. Considering the projected demographic shifts, Over this period, projections indicate a decline in overall population, with the area's population expected to decline by 11 persons by 2041 according to this methodology. However, growth across specific age cohorts is anticipated, led by the 75 to 84 age group, which is projected to grow by 3 people. <i>See the age section for more details.</i>
Frequently Asked Questions - Population
Detail
Moreton Island experiences very limited development activity averaging 1 approvals per year (totalling 8 across the past five years). These low development levels reflect the rural nature of the area, where development is typically driven by specific local housing needs rather than broad market demand. Note; the small sample size means that individual development projects can substantially influence annual growth and relativity statistics. Moreton Island shows significantly less construction activity than Greater Brisbane. The development pattern is also well below national averages. Further, recent building activity consists entirely of detached dwellings, maintaining the area's rural nature with emphasis on space.
At around 218 people per approval, Moreton Island reflects a transitioning market. With population expected to remain stable or decline, Moreton Island should see reduced pressure on housing, potentially creating opportunities for buyers.
Frequently Asked Questions - Development
Development applications around Moreton Island
Loading development applications…
| Lodged | Address | Description | Type | Distance | Status |
|---|
SOURCE: Planning portals and council registers, compiled by AreaSearch. Distance & bearing measured from the suburb midpoint.
AreaSearch tracks 114 current infrastructure and development projects close to Moreton Island, worth an estimated $13.2 billion. 41 are already under construction and 57 are due for completion within three years. The pipeline spans residential development, communities, precincts & urban renewal and transport & logistics. Records are compiled from Infrastructure Australia, state agencies, council planning portals and public announcements, reviewed and updated daily, then ranked by proximity, construction stage, completion horizon and project scale.
Detail
Nothing can influence an area's performance as much as changes to local infrastructure, major projects and planning initiatives. In total 0 projects have been identified by AreaSearch that are likely to have an impact on the area. Key projects include Queensland Energy and Jobs Plan - South East Queensland, Cross River Rail - European Train Control System, South East Queensland Level Crossing Program 2024, and Queensland Energy and Jobs Plan, with the below list detailing those likely to be of most relevance. Moreton Island has moderate levels of nearby infrastructure activity, ranking in the 41stth percentile nationally
Professional plan users can use the search below to filter and access additional projects.
INFRASTRUCTURE SEARCH
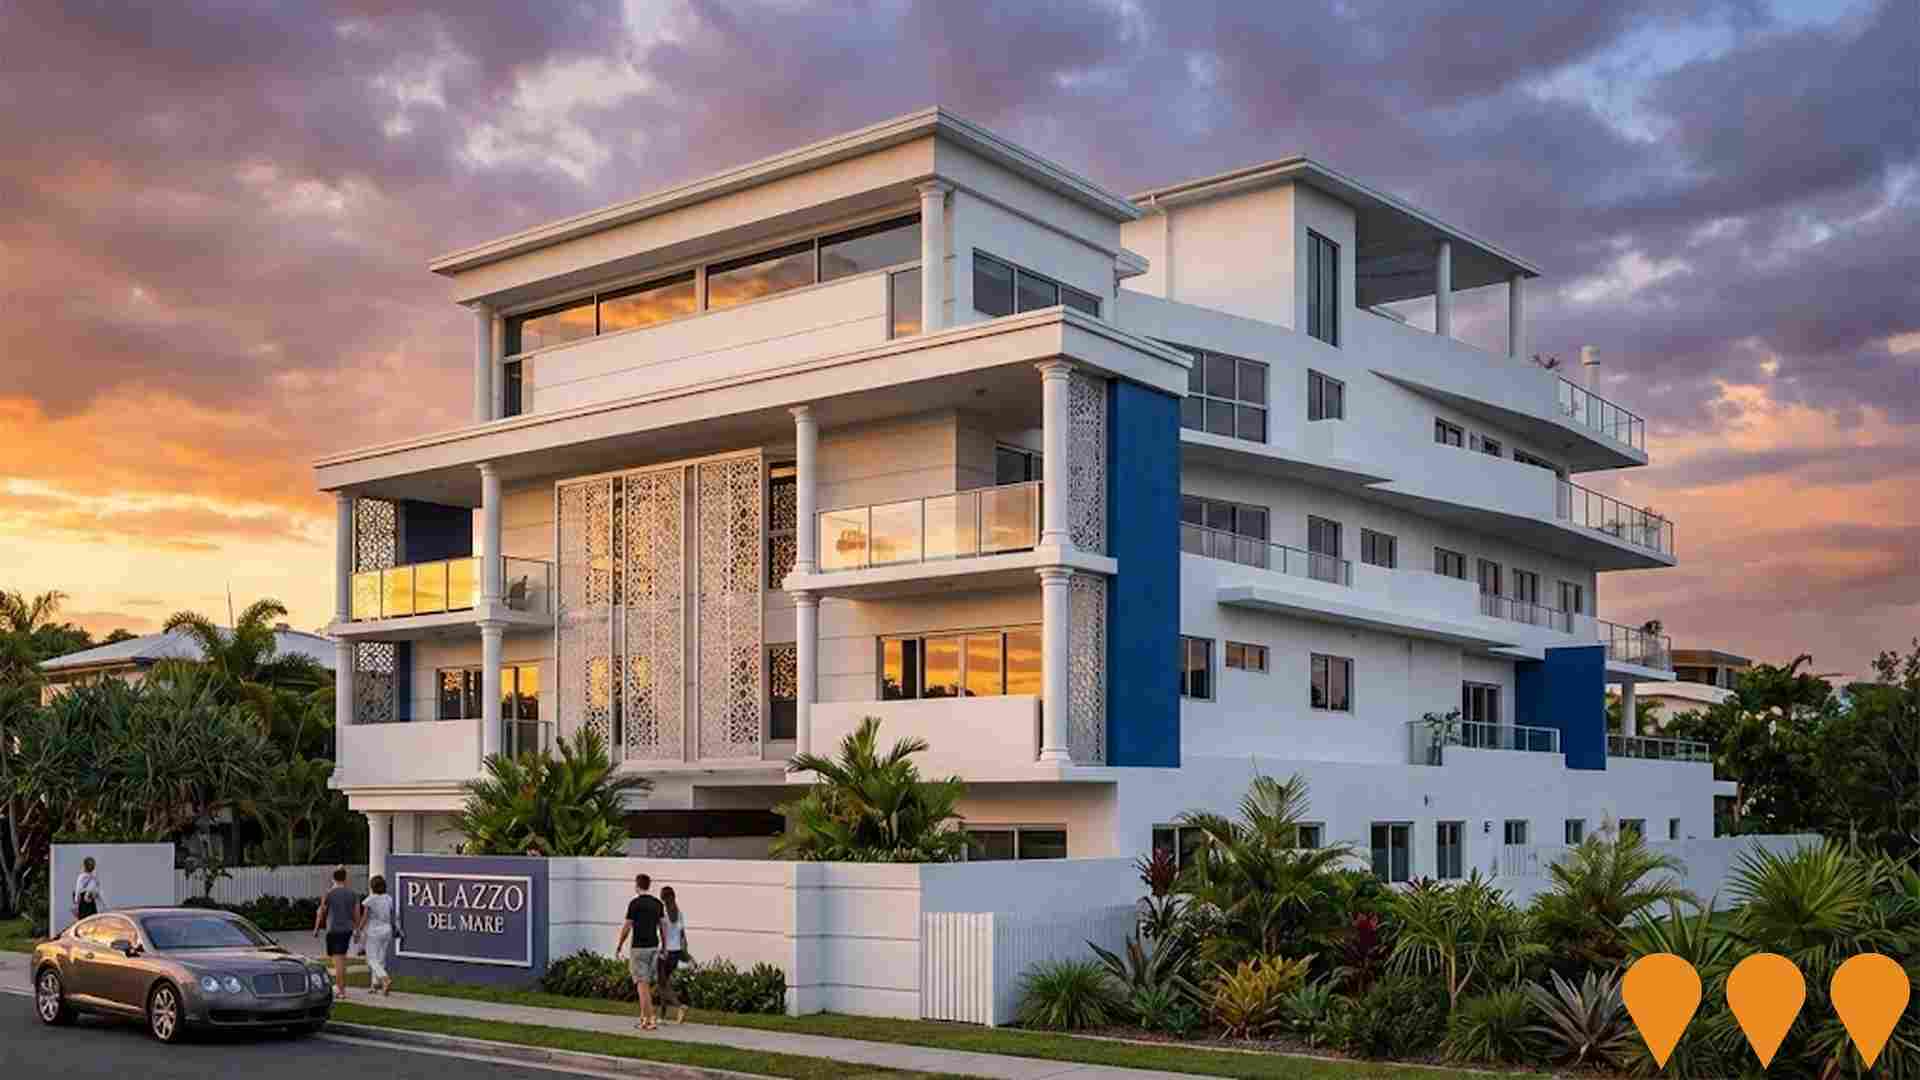
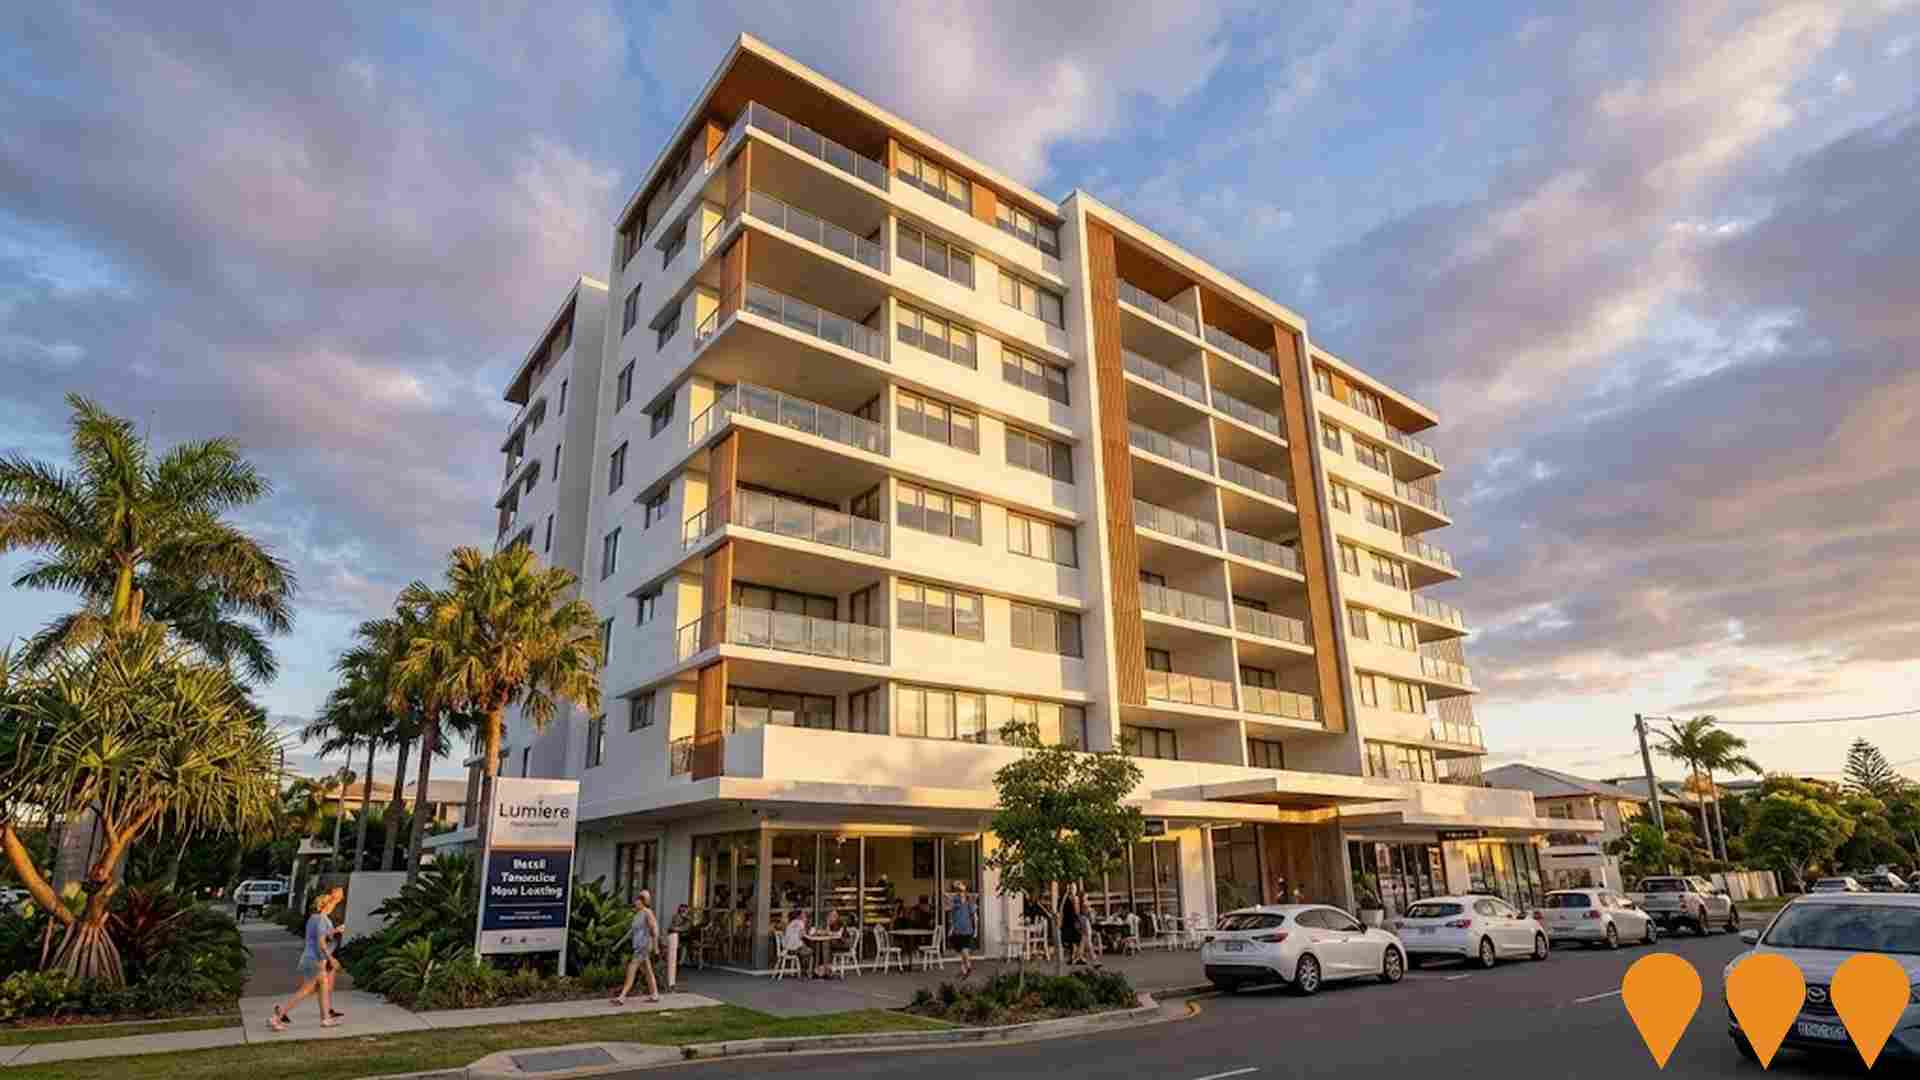
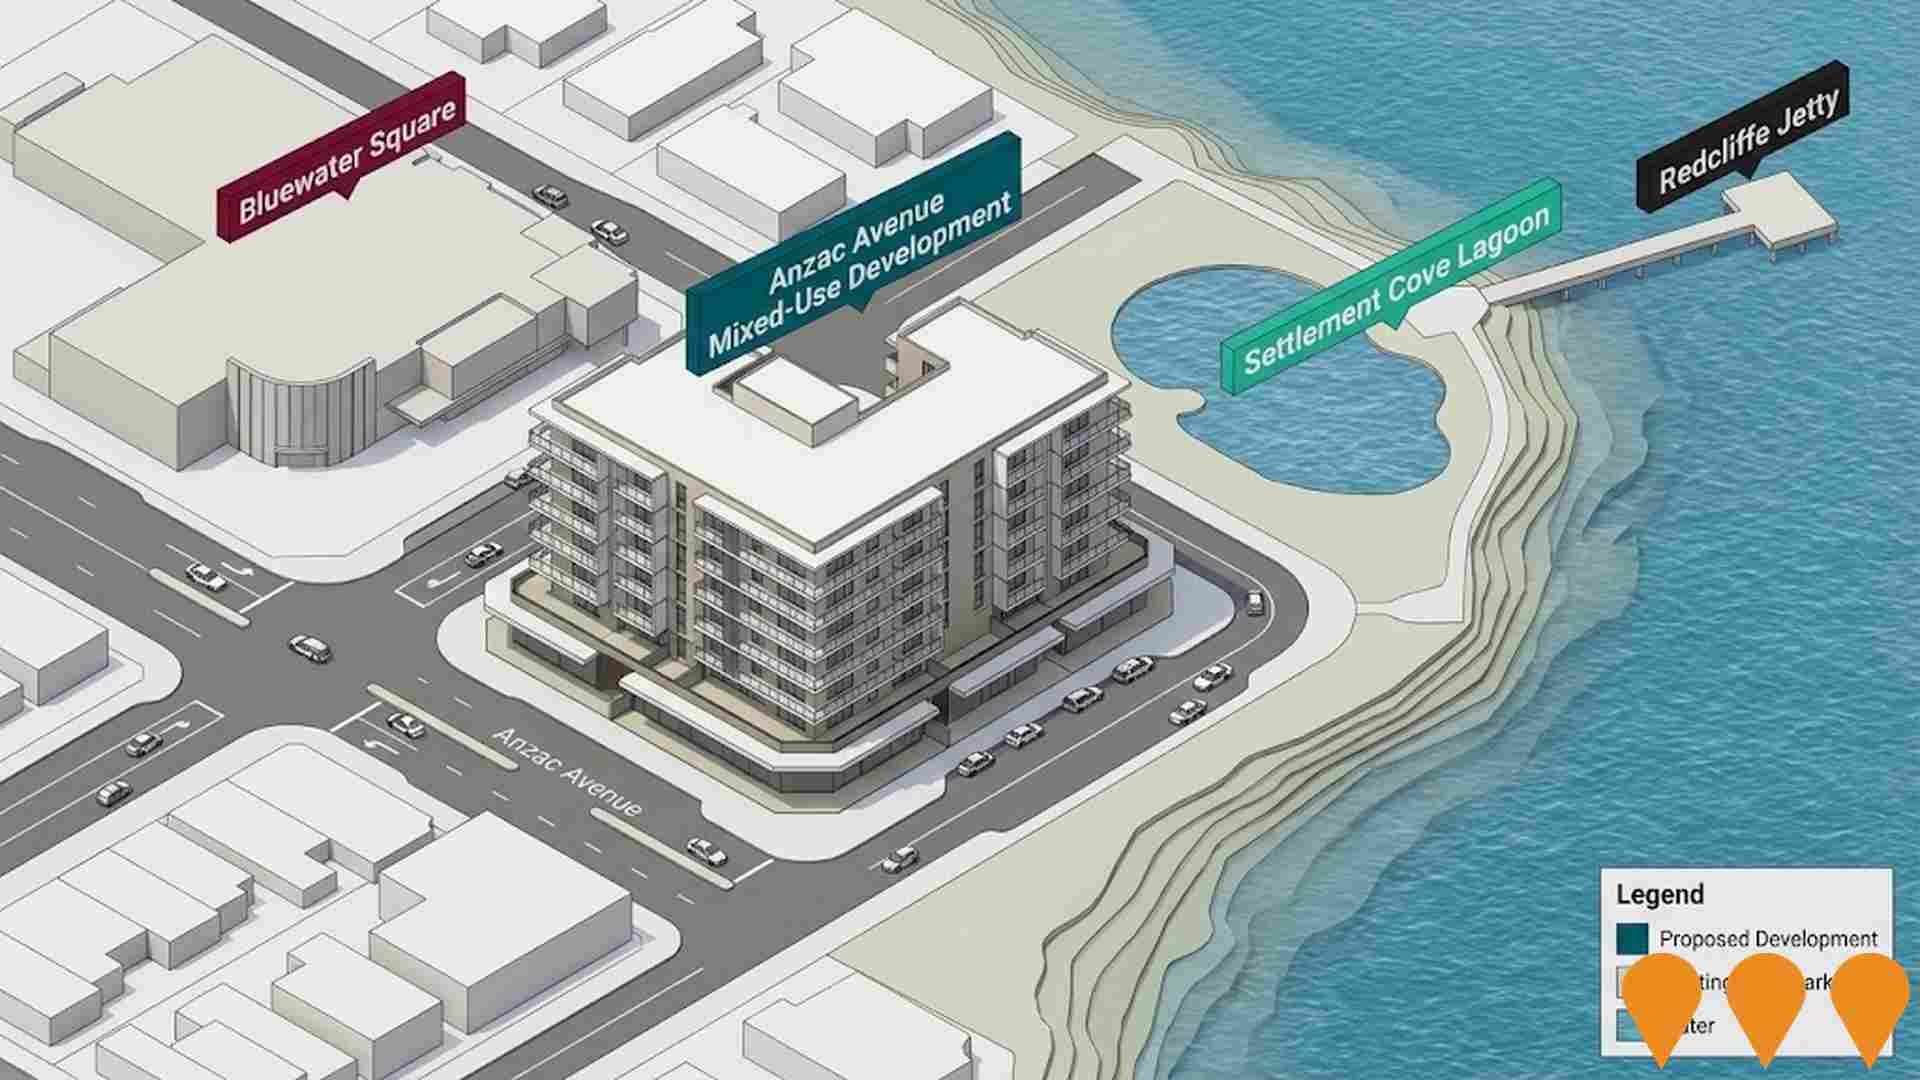
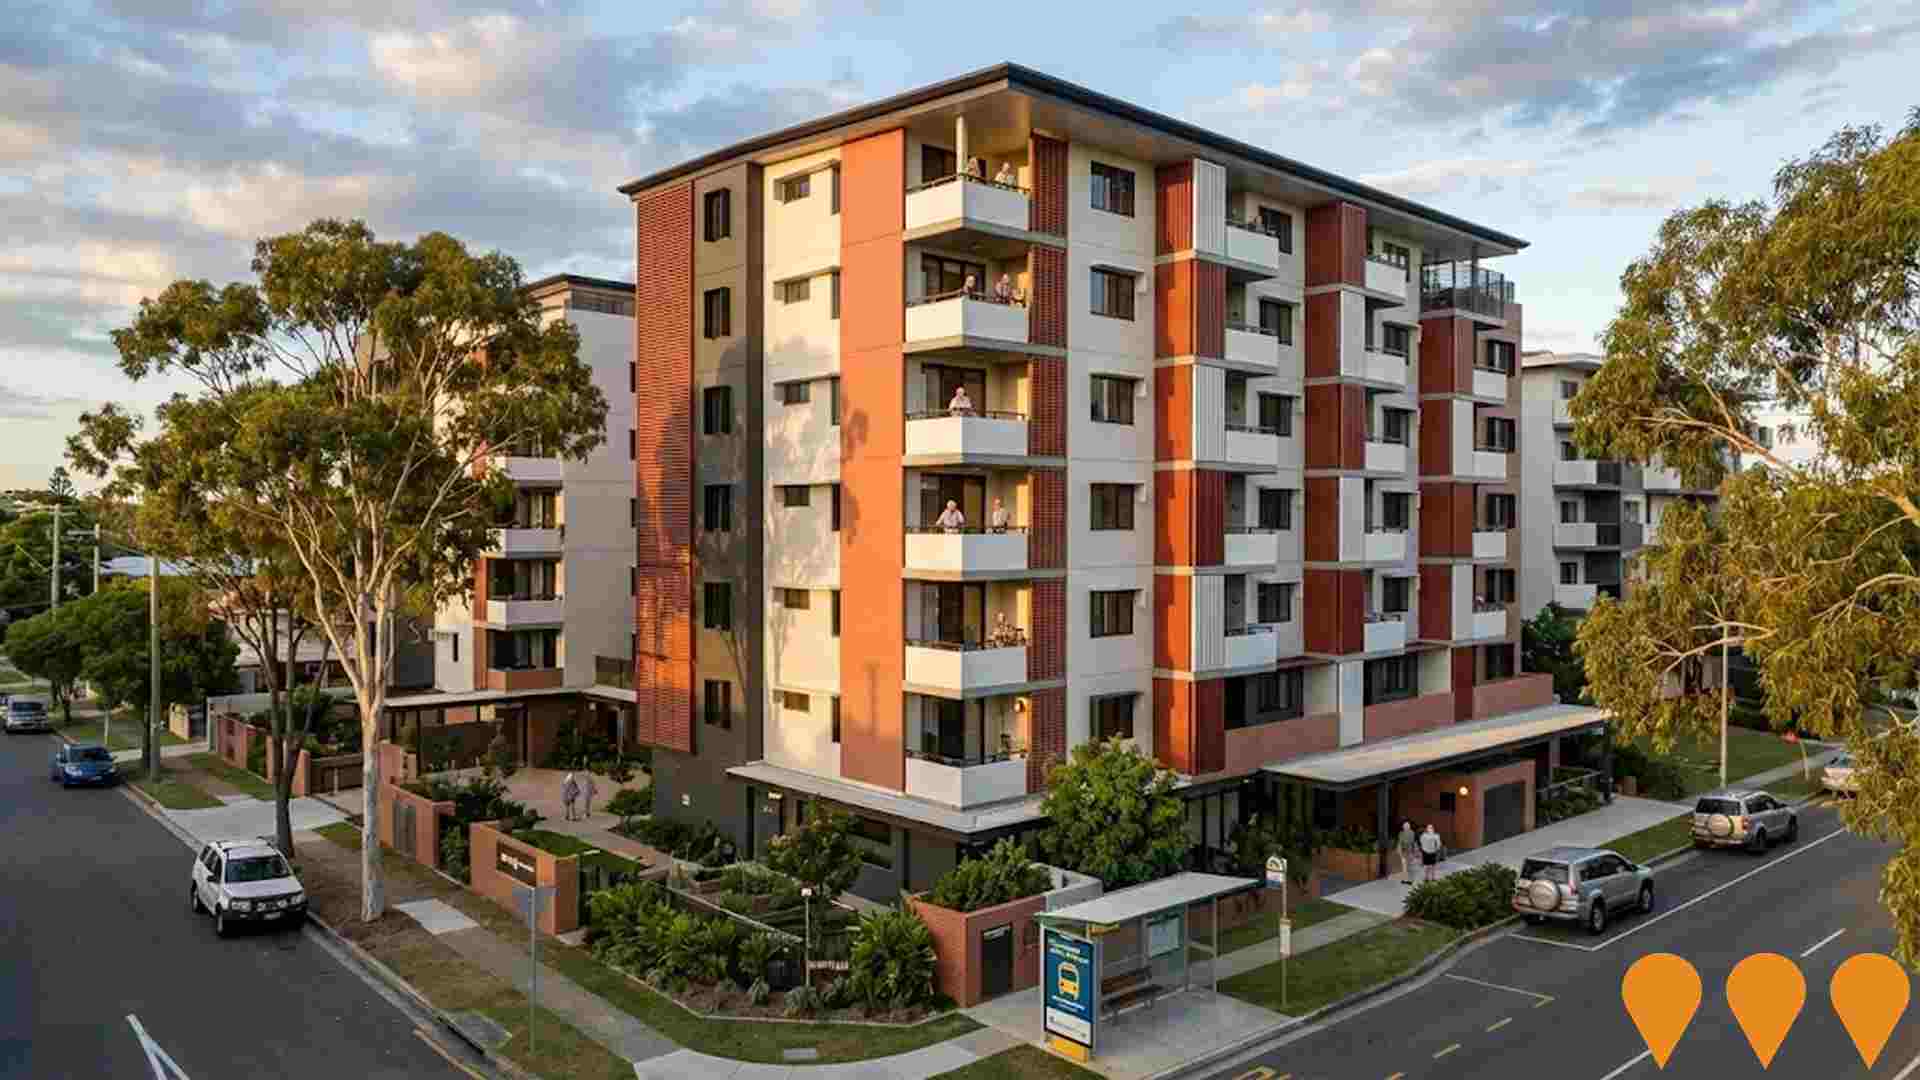
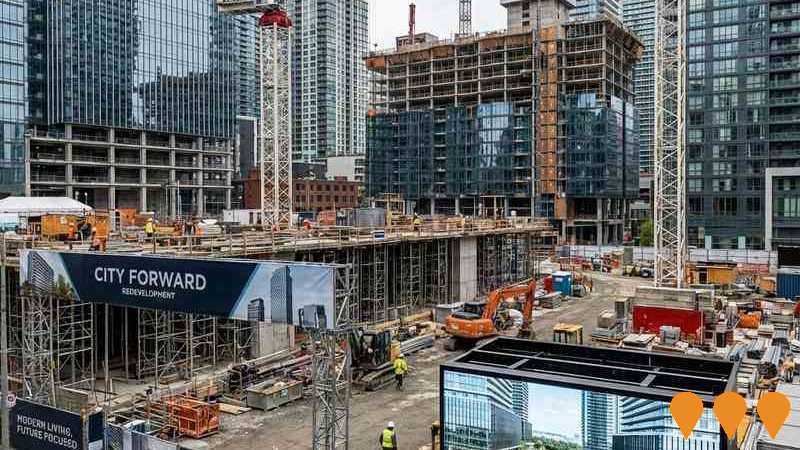
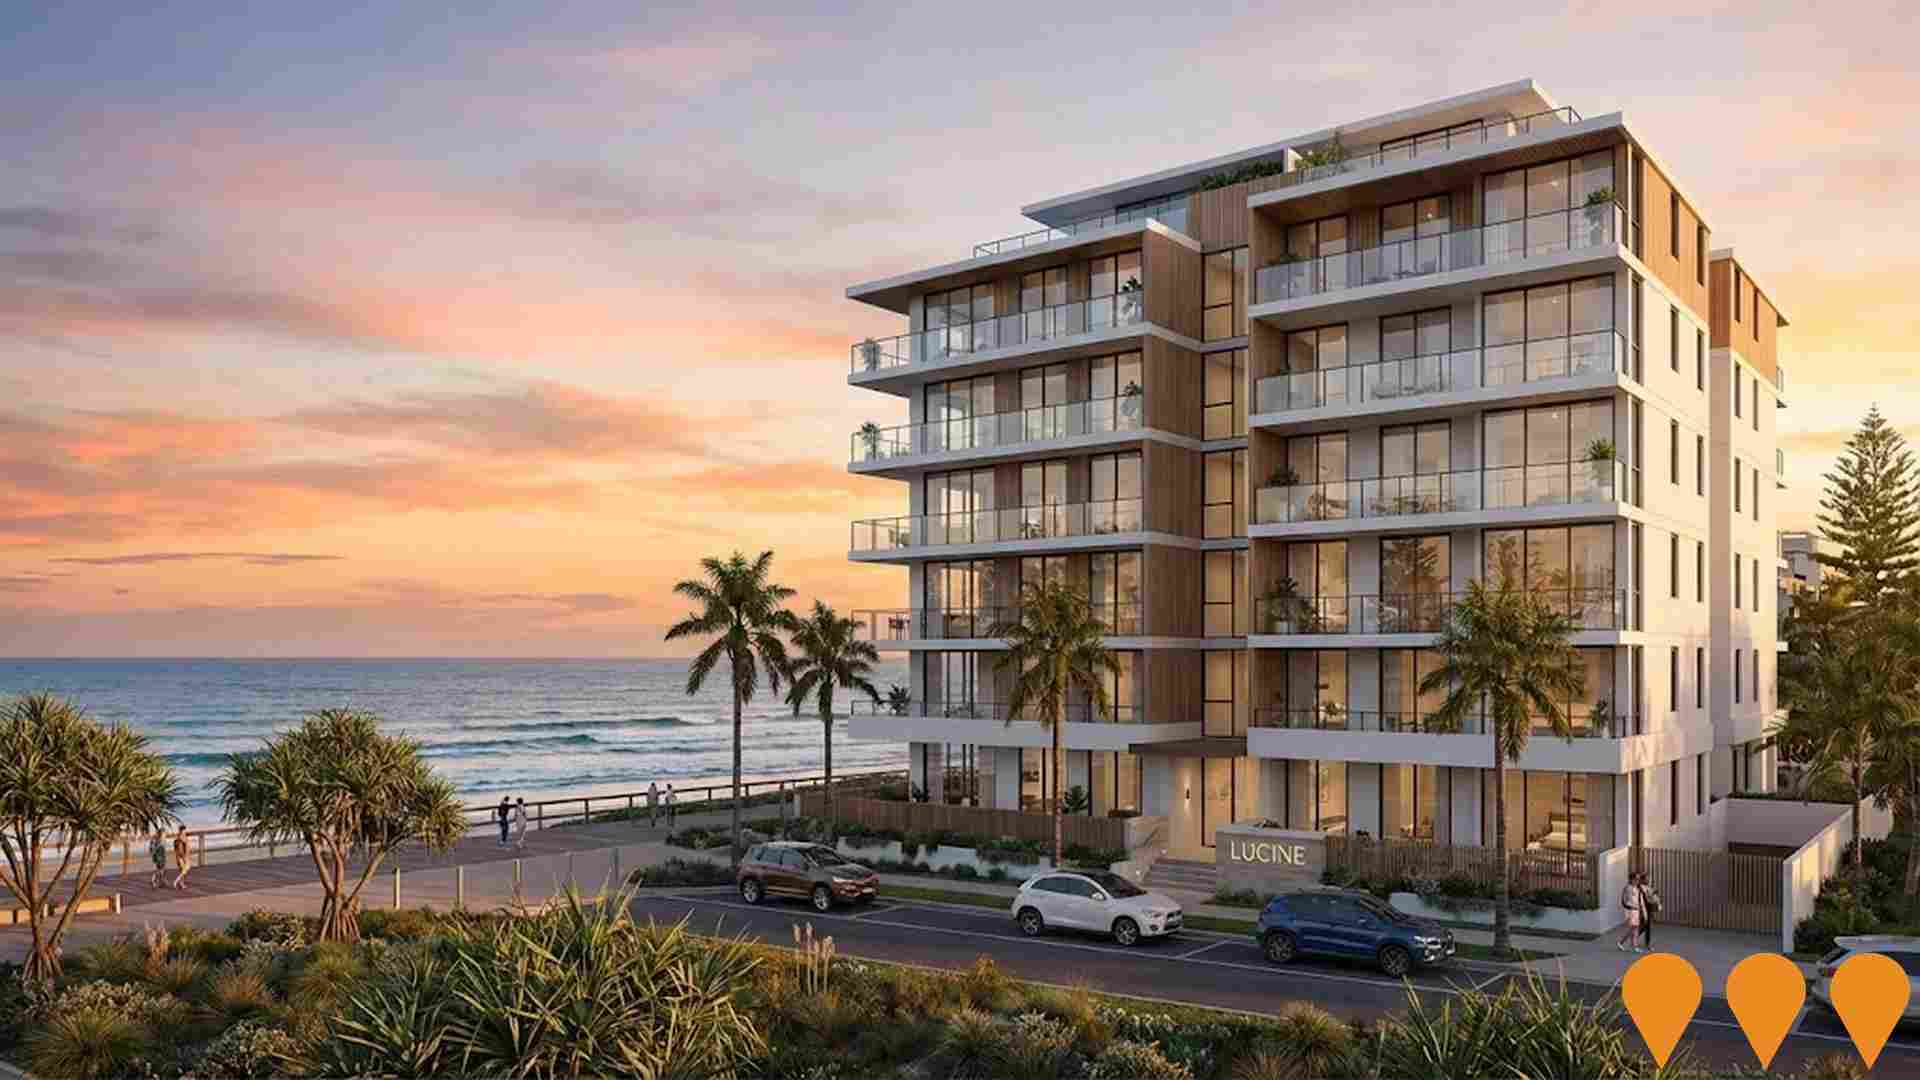
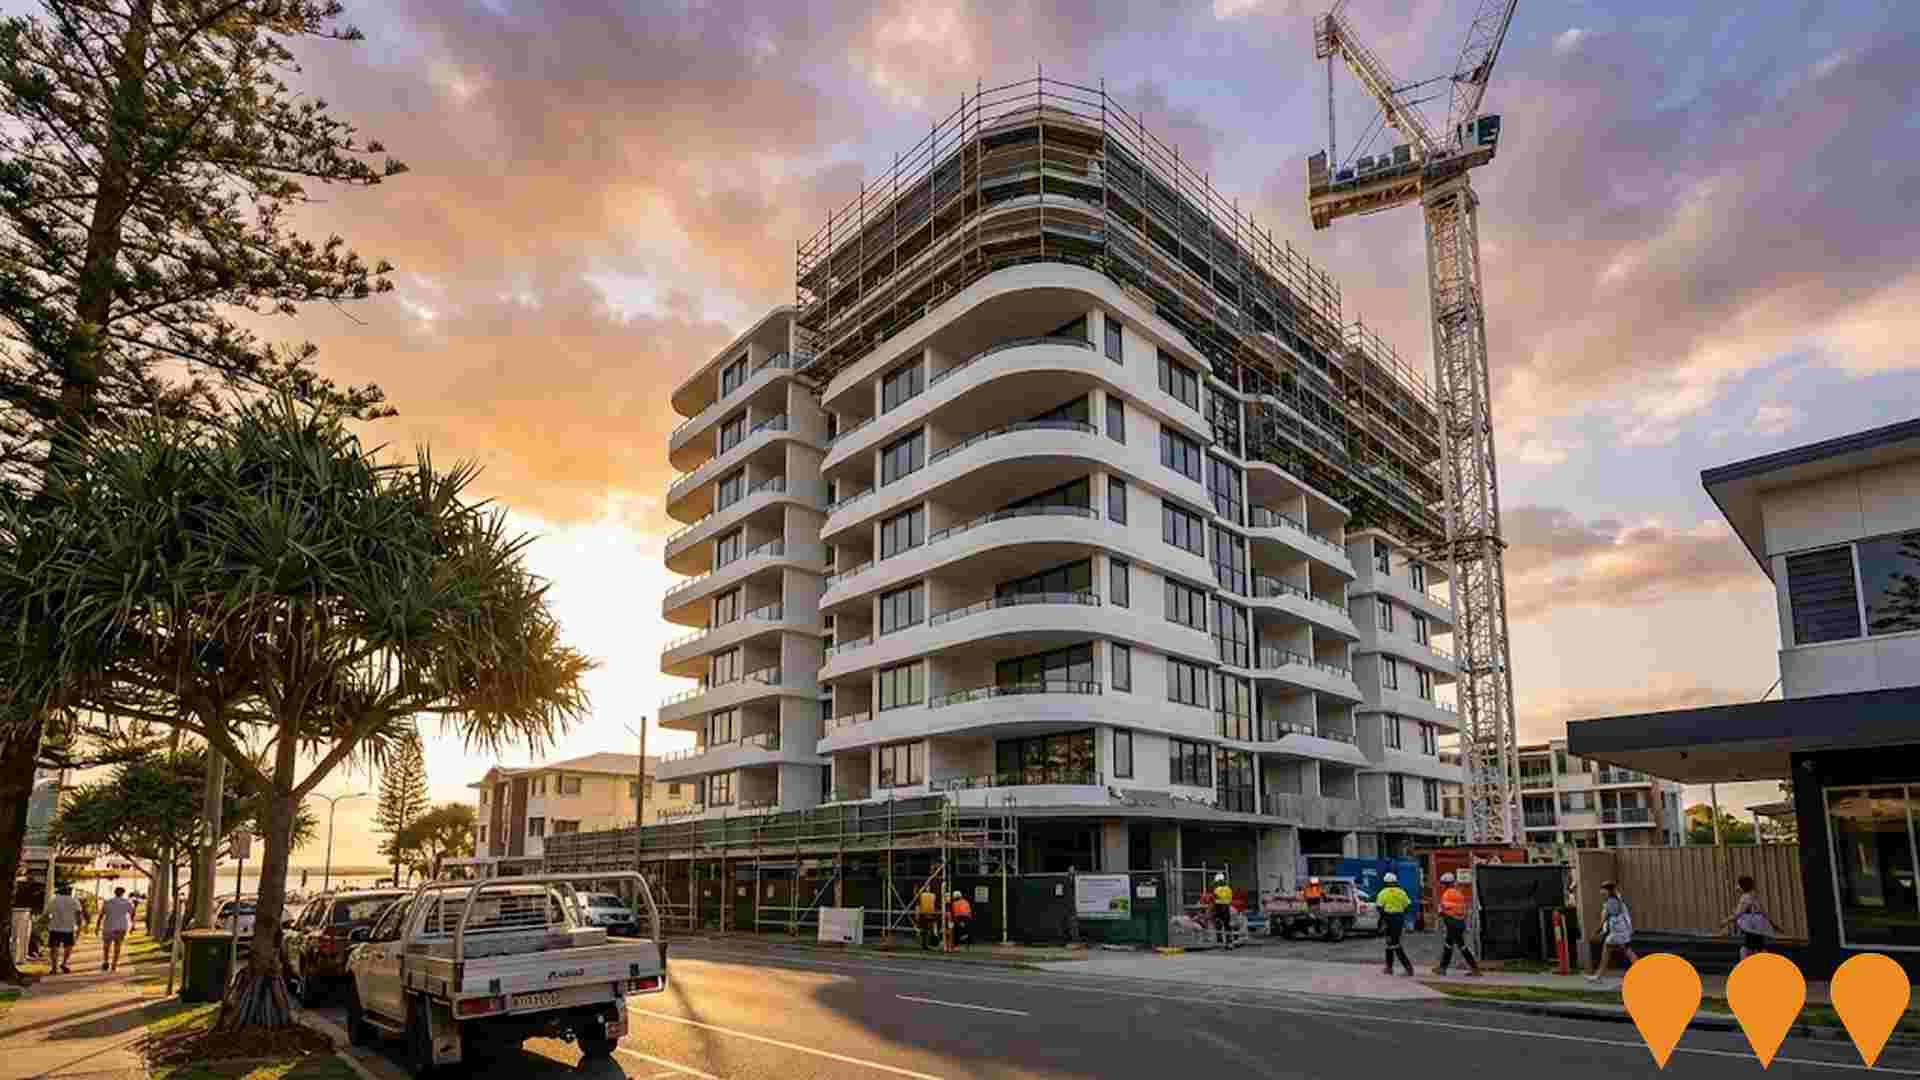
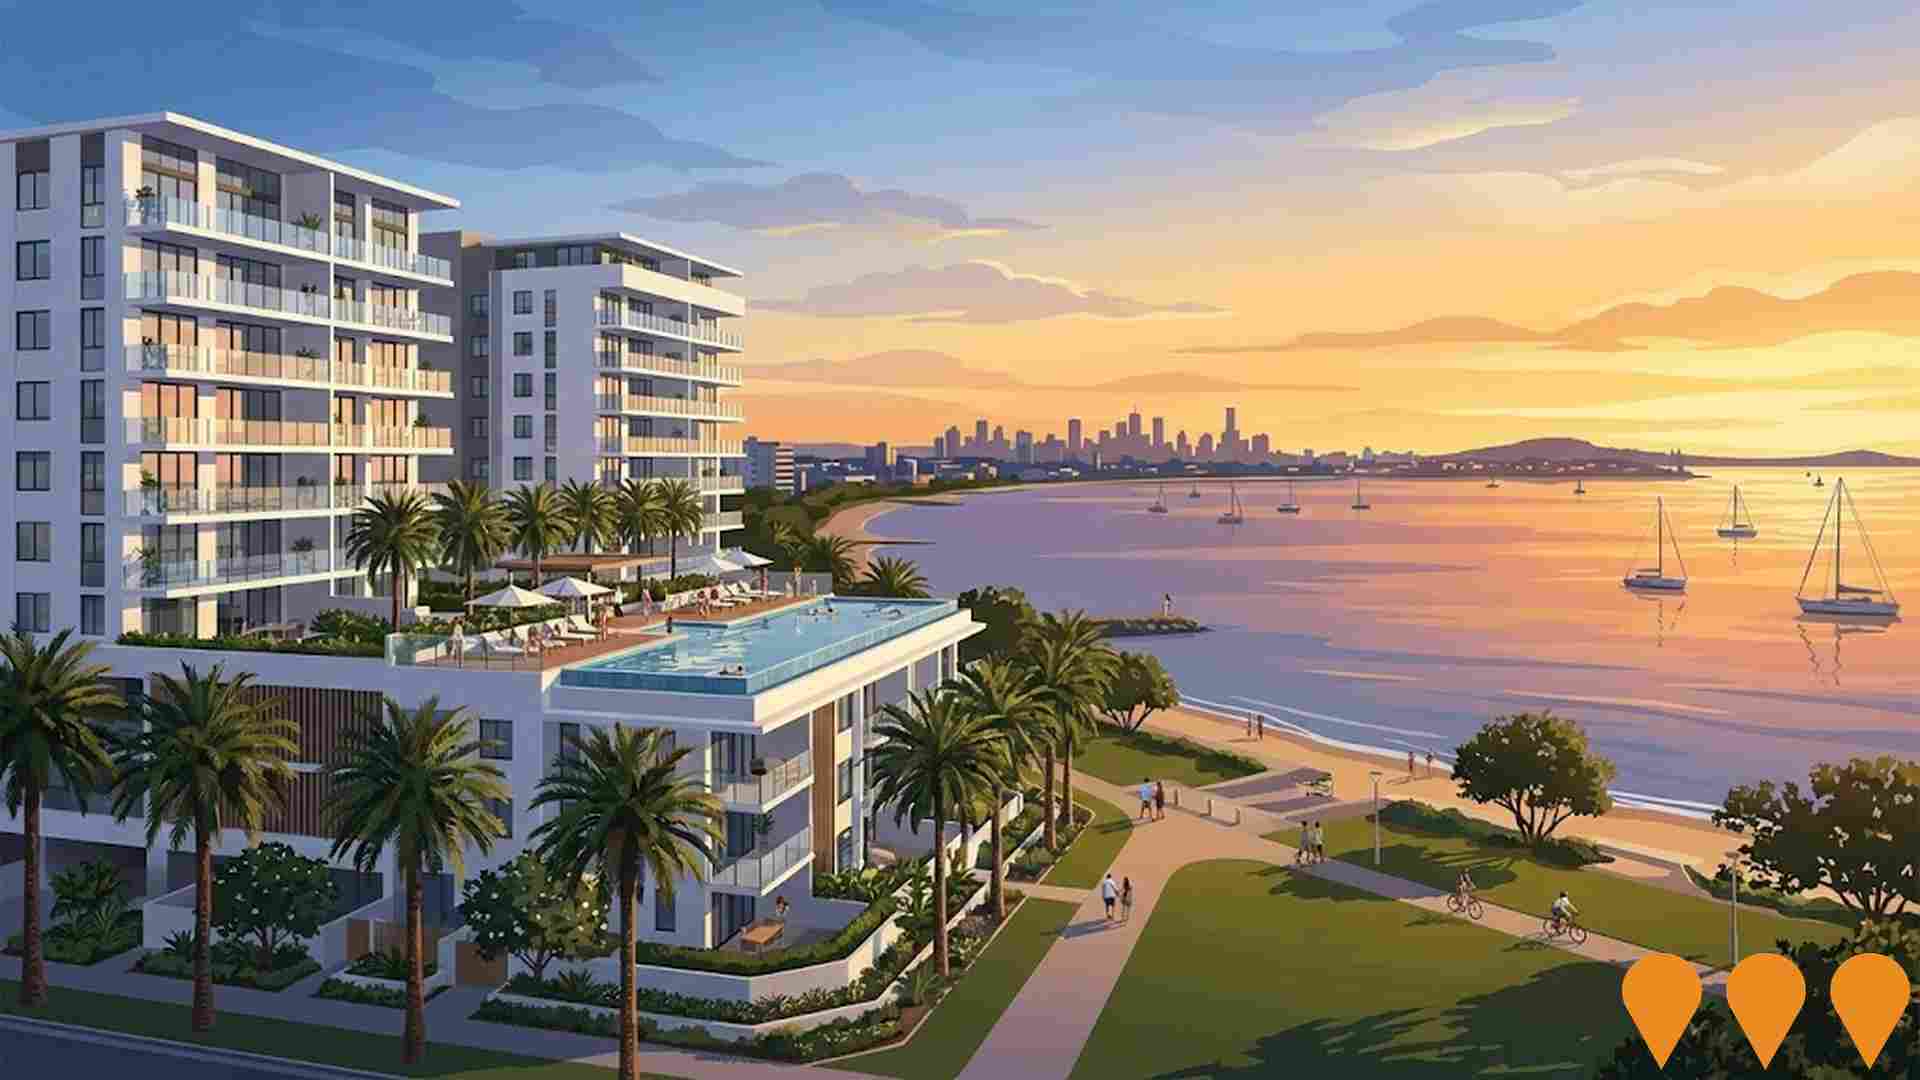
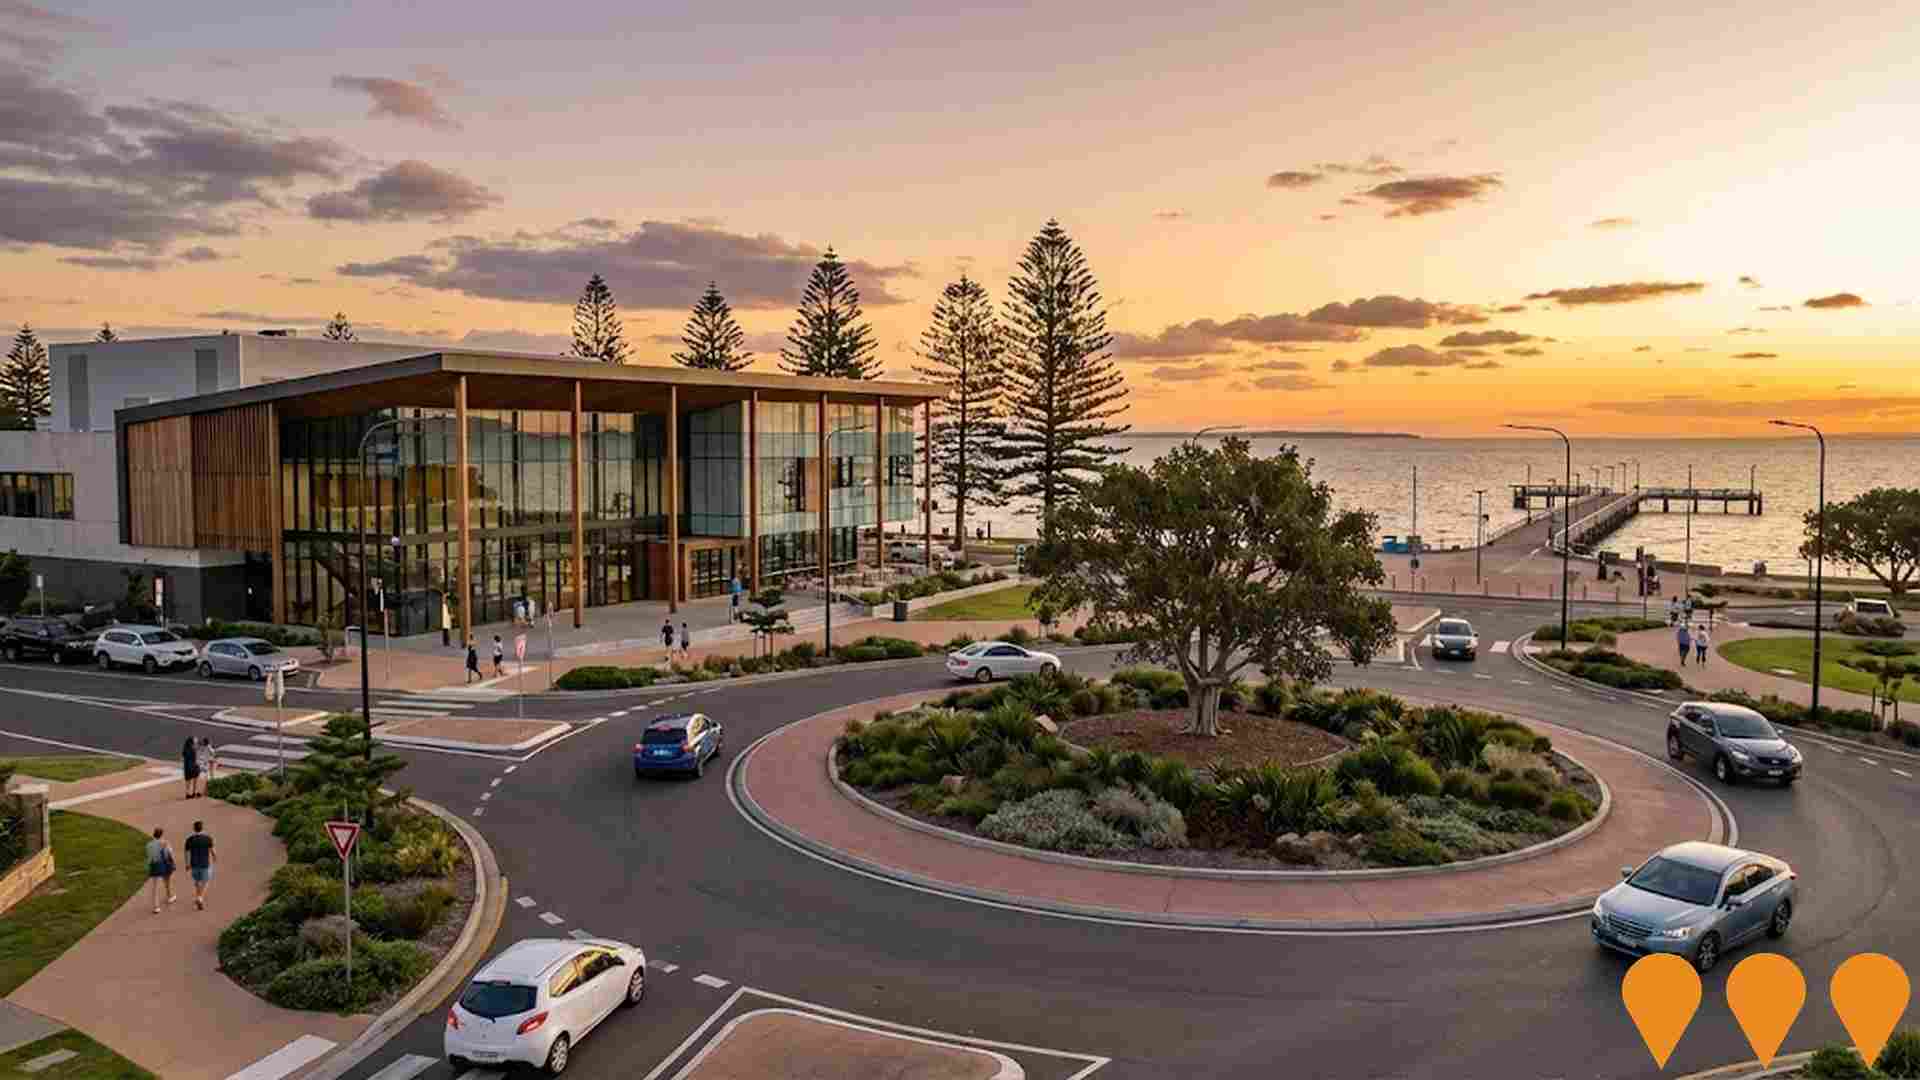
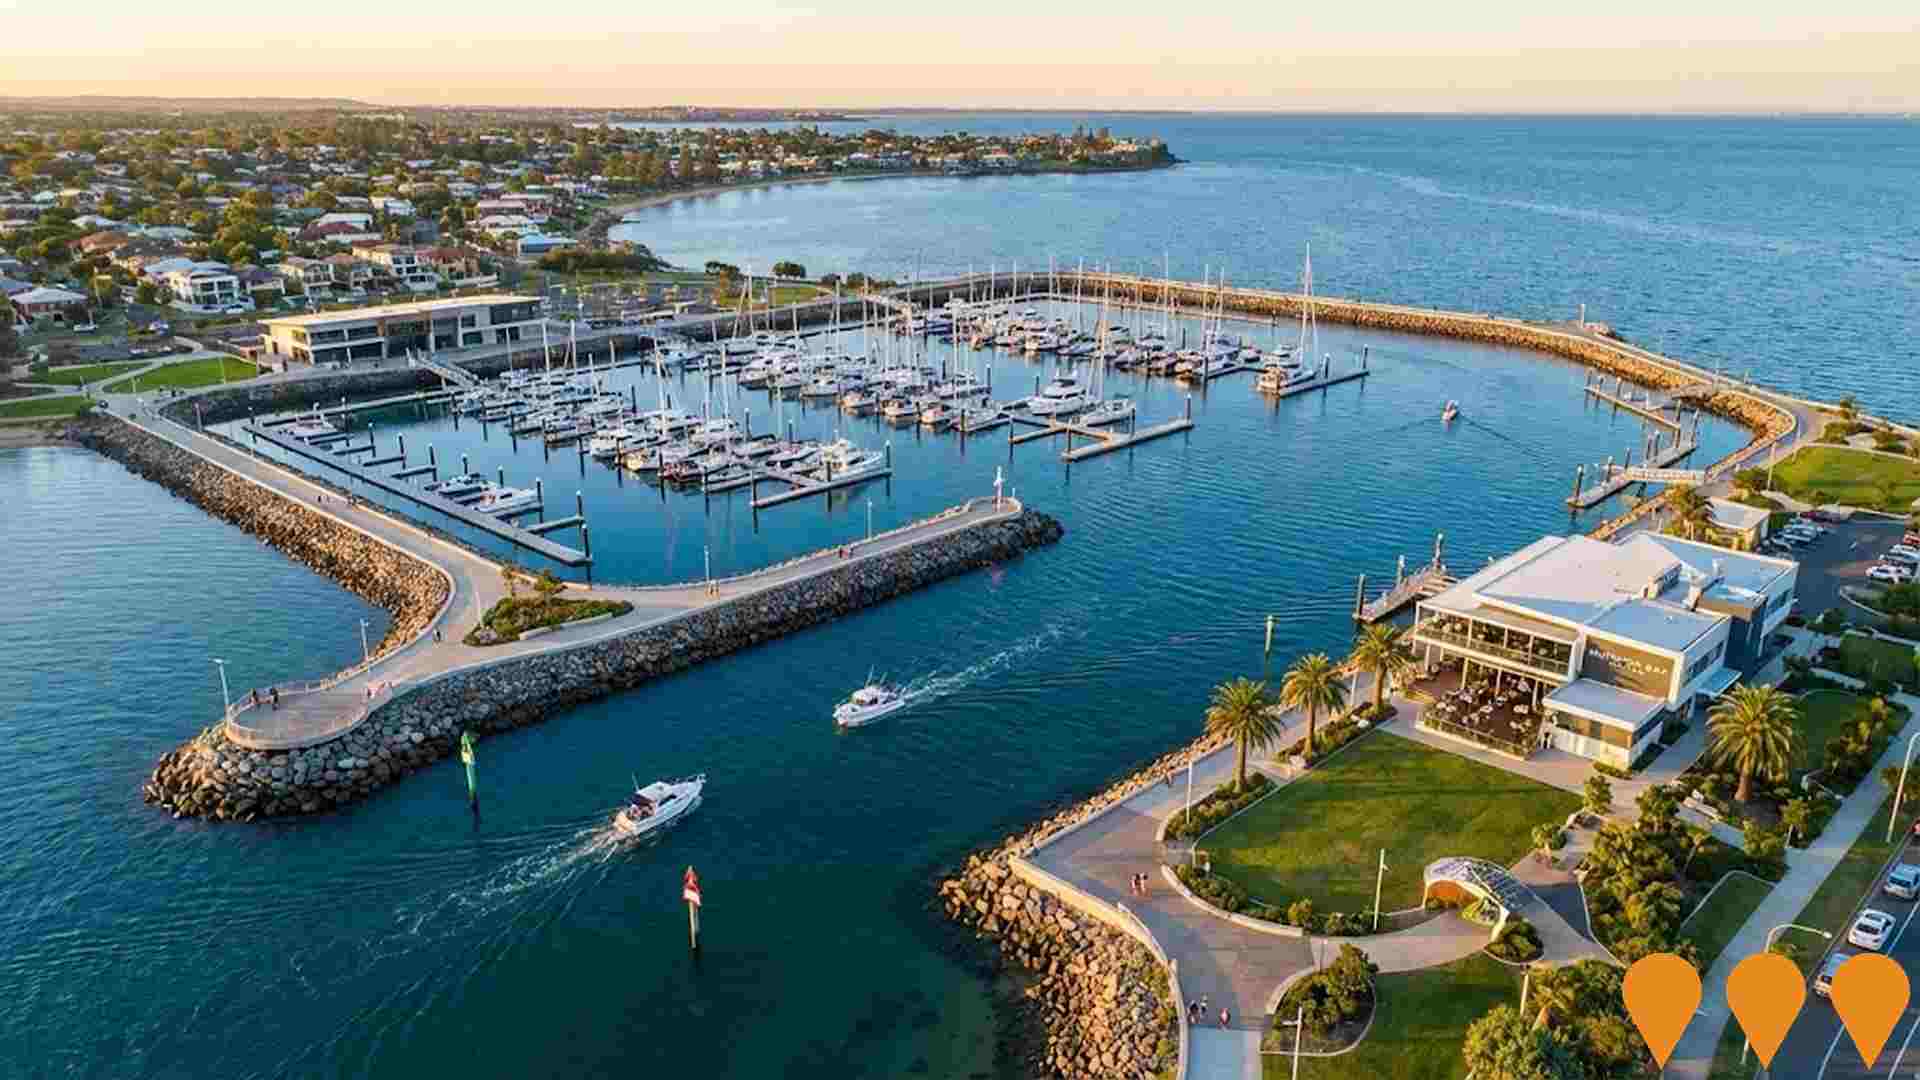
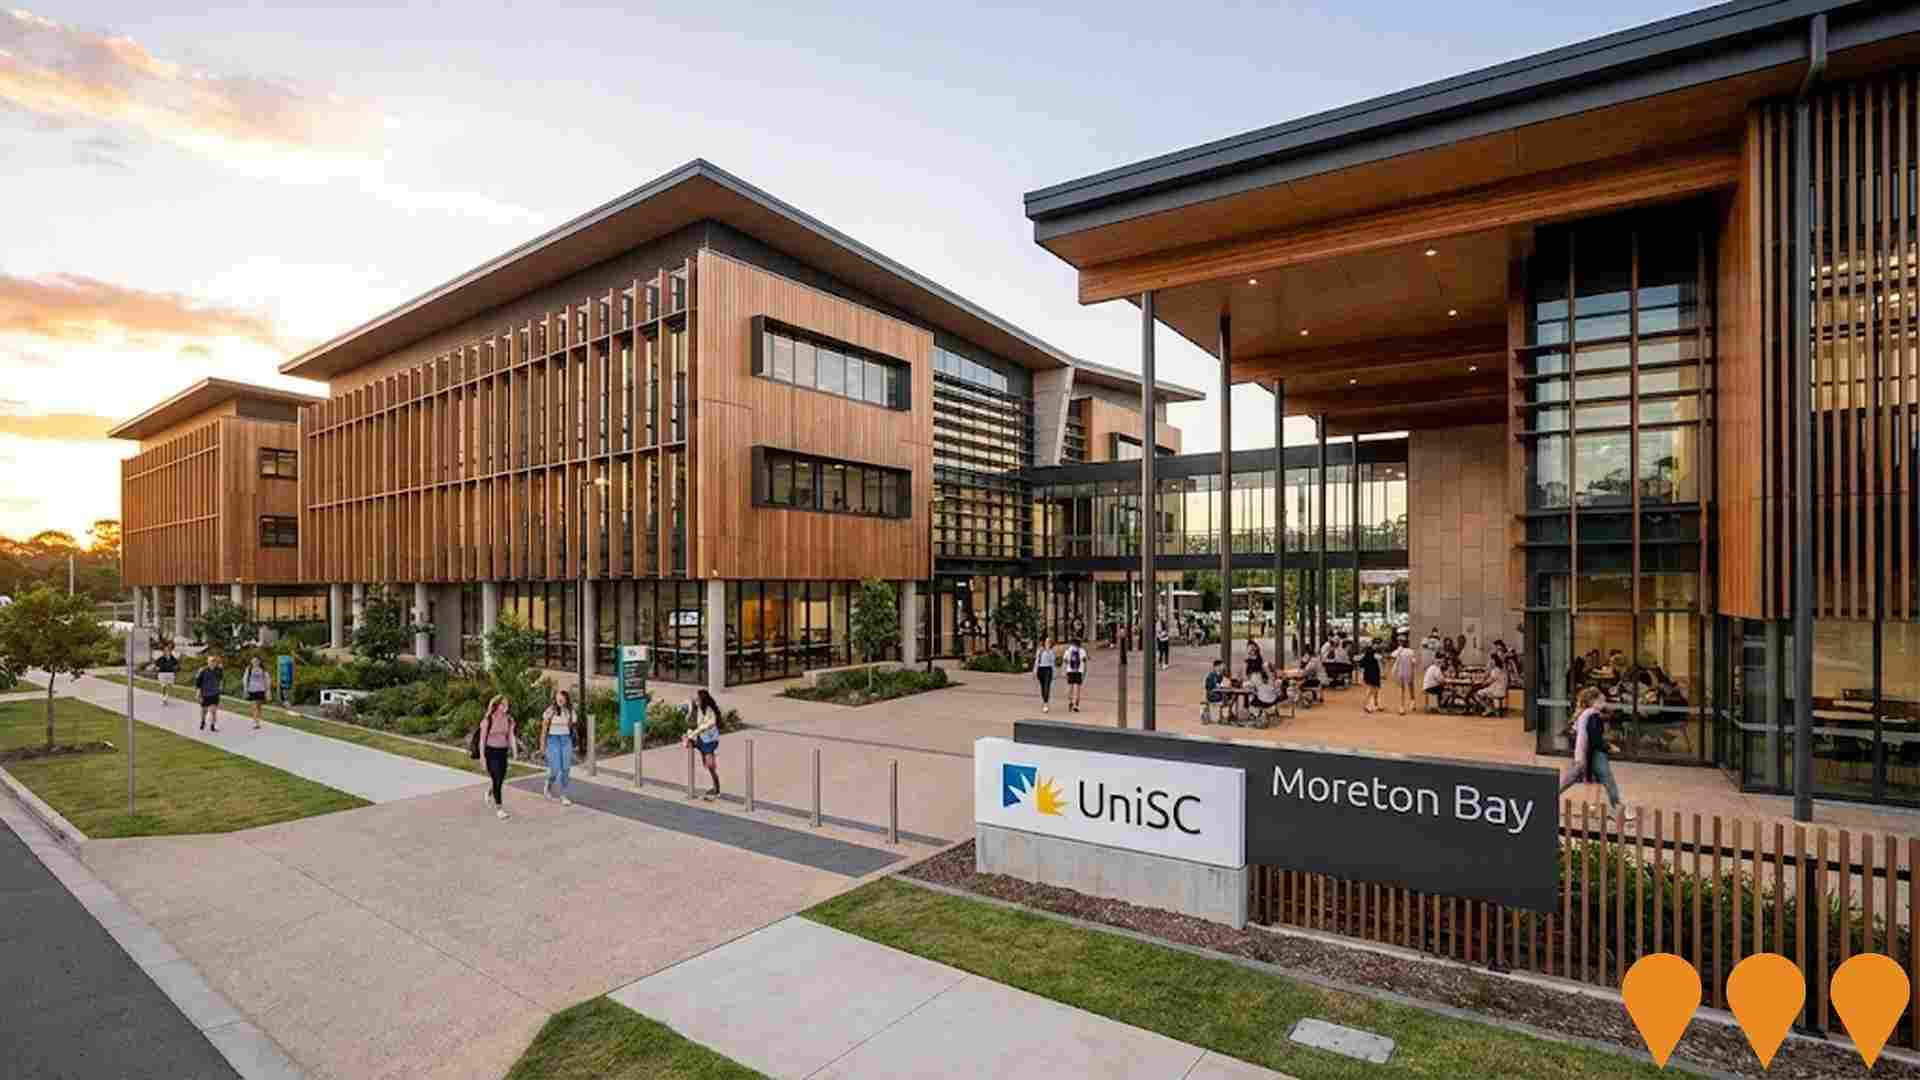
 Denotes AI-based impression for illustrative purposes only, not to be taken as definitive under any circumstances. Please follow links and conduct other investigations from the project's source for actual imagery. Developers and project owners wishing us to use original imagery please Contact Us and we will do so.
Frequently Asked Questions - Infrastructure
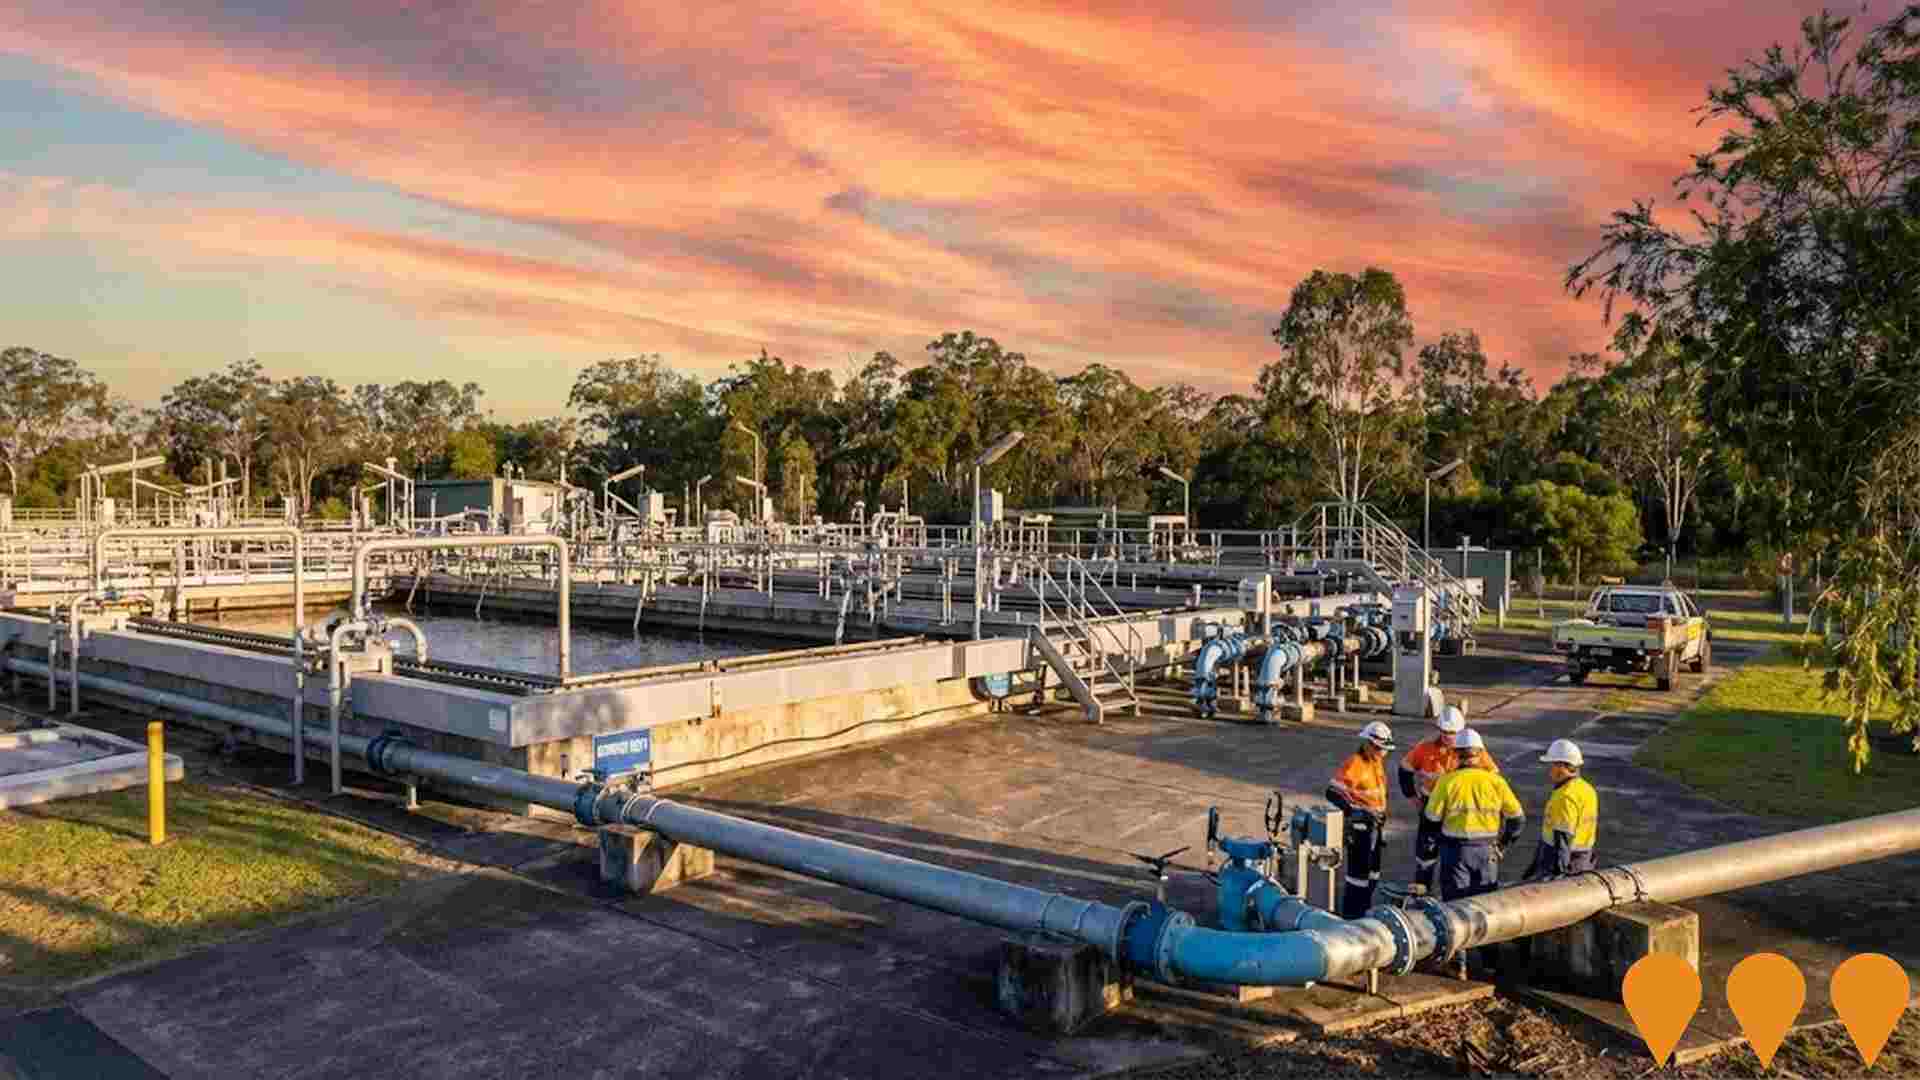
Burpengary East Wastewater Treatment Plant Upgrade
Significant upgrade to Burpengary East Wastewater Treatment Plant by Unitywater and Ventia to increase capacity and improve water quality. Essential infrastructure to support population growth and environmental protection in the Moreton Bay region.
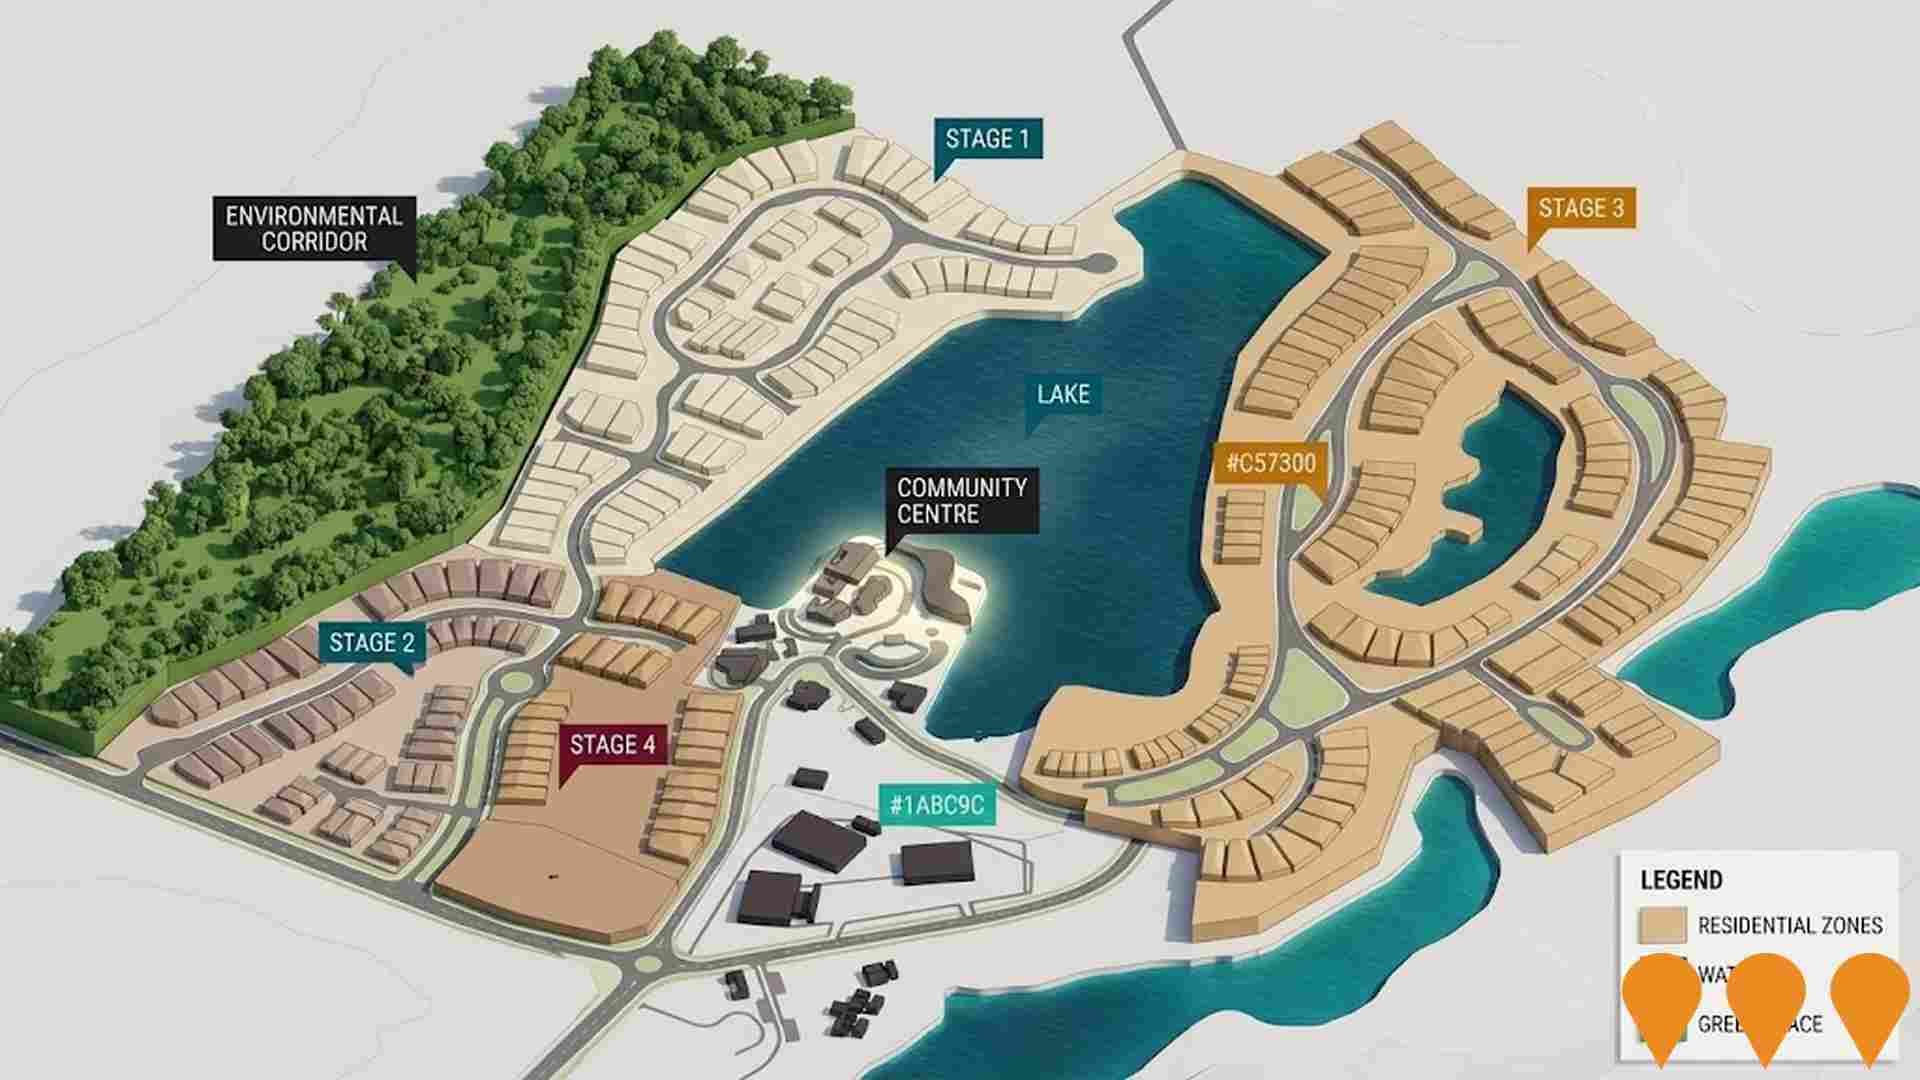
Brolga Lakes Development
A 219-lot residential subdivision in Burpengary East featuring open spaces, lakes, and conservation areas. Designed to integrate with the natural environment while providing quality housing options for families.
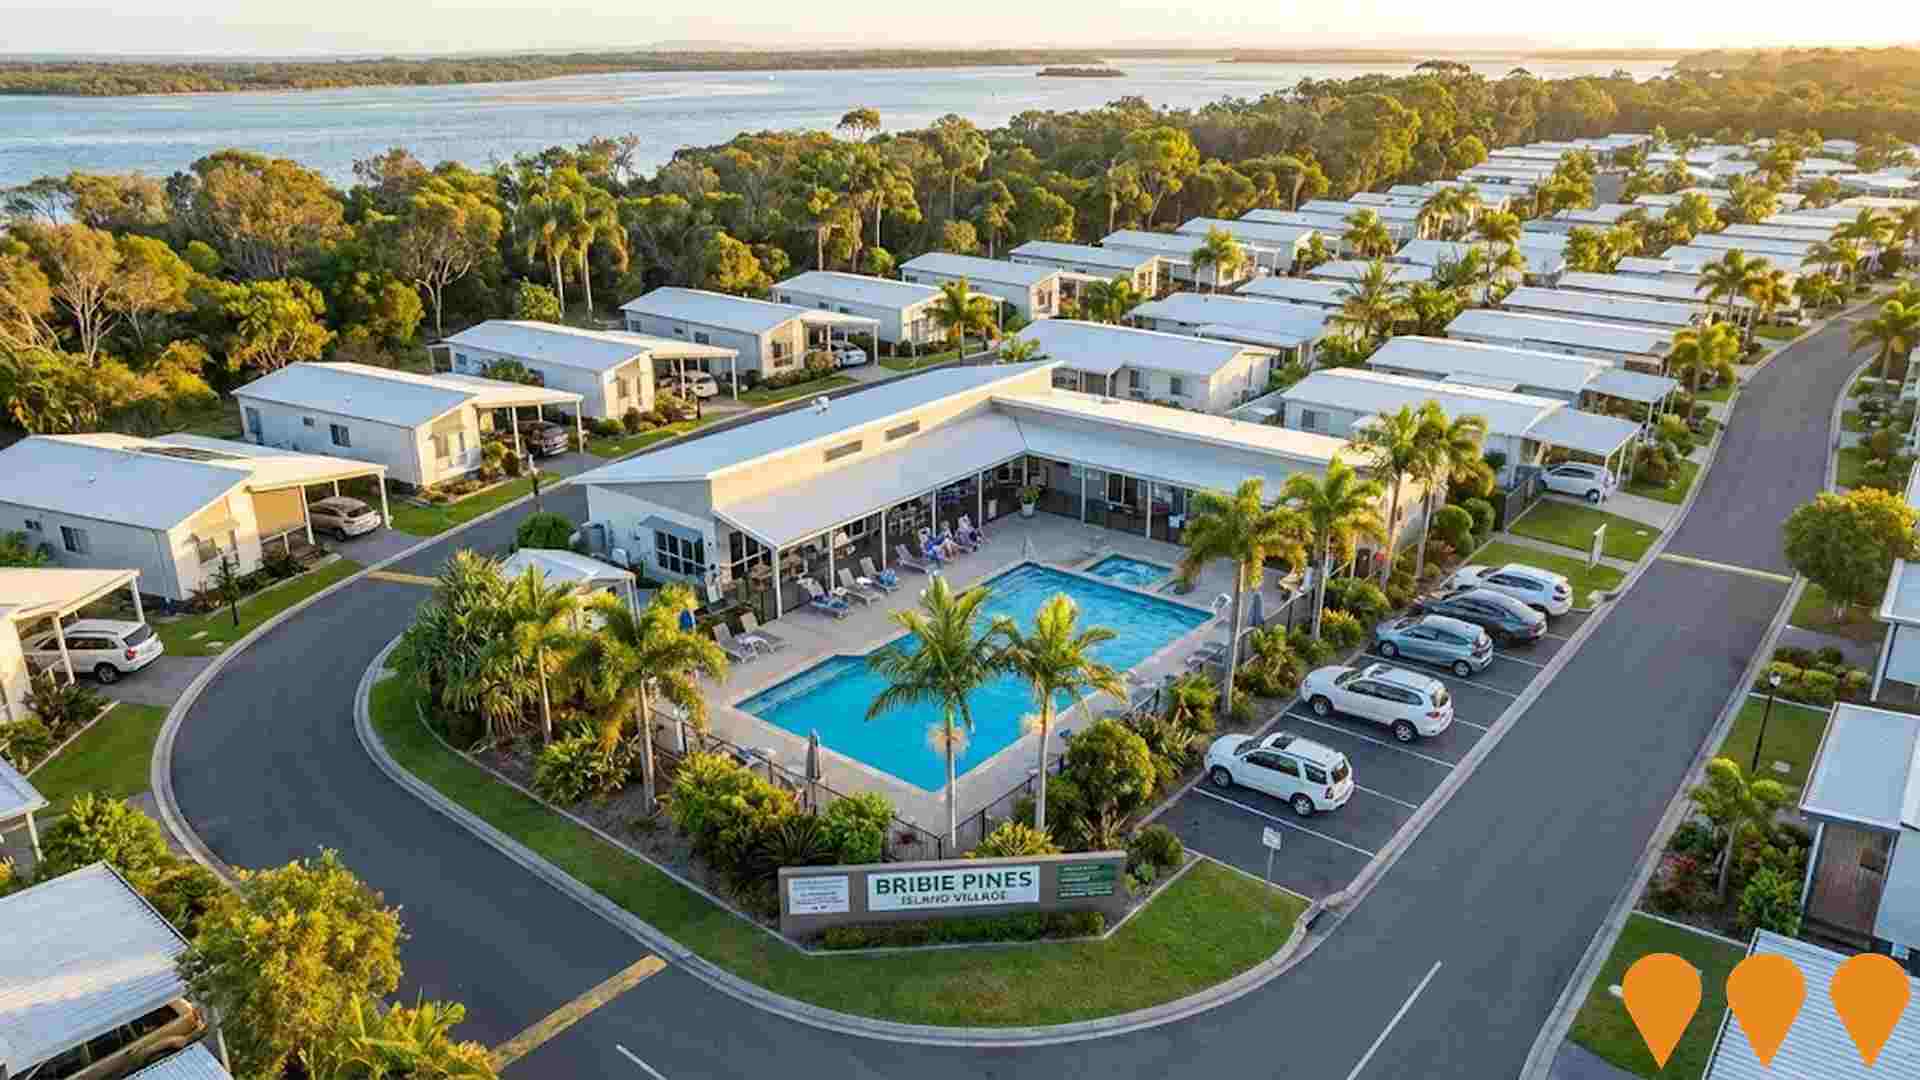
Bribie Pines Island Village
Bribie Pines Island Village is an over 50s manufactured home estate on Bribie Island, offering around 200 low maintenance homes in a land lease community. Set on roughly 15 acres close to Pumicestone Passage, the village includes a community centre, library, gym, indoor bowls, pool, spa and other shared facilities with on site management and nightly security patrols. Residents own their home and lease the site, targeting downsizers seeking a secure, resort style coastal lifestyle.
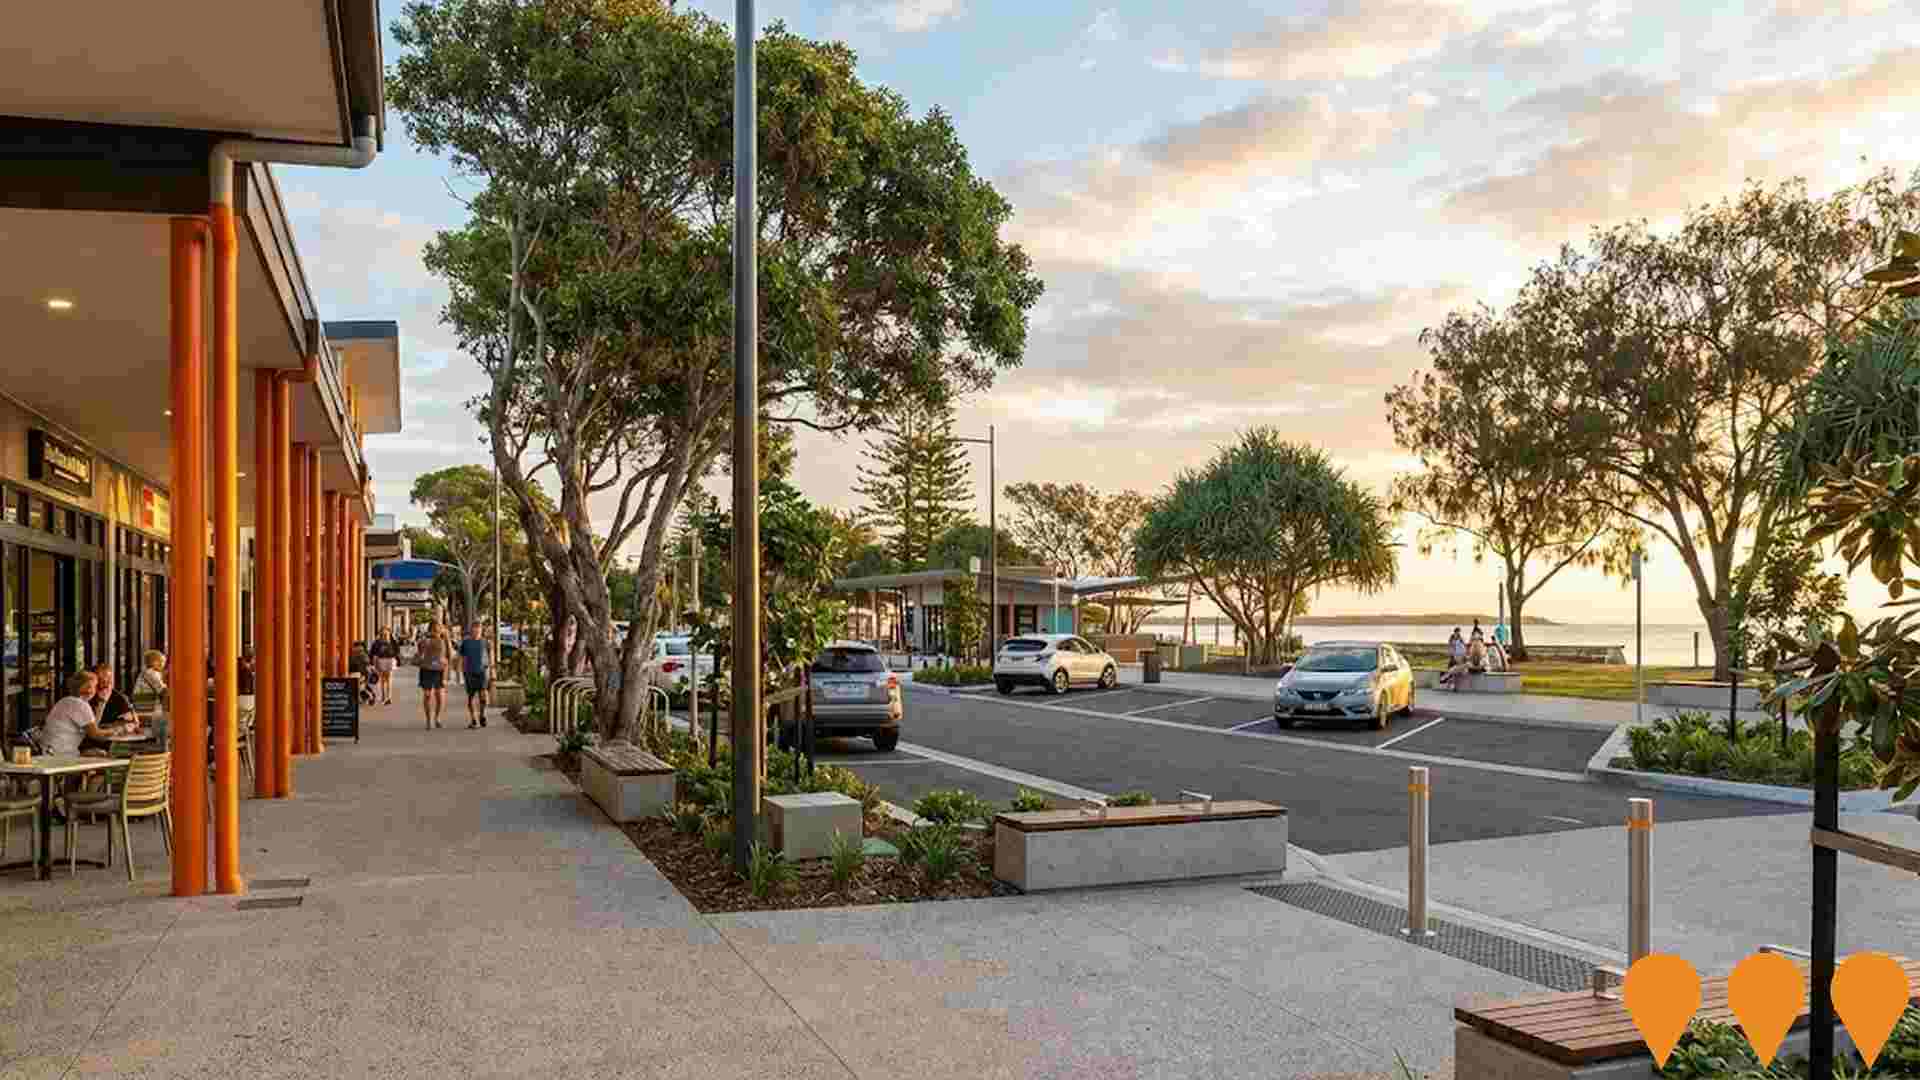
Bongaree Village Shopping Centre Expansion
Council-led upgrade and expansion of the Bongaree Village Shopping Precinct on Bribie Island, delivering additional small format retail tenancies, upgraded streetscape and public realm, improved pedestrian links and foreshore connections, and reconfigured parking as part of the Bongaree Village master plan and wider investment in the City of Moreton Bay coastal villages.
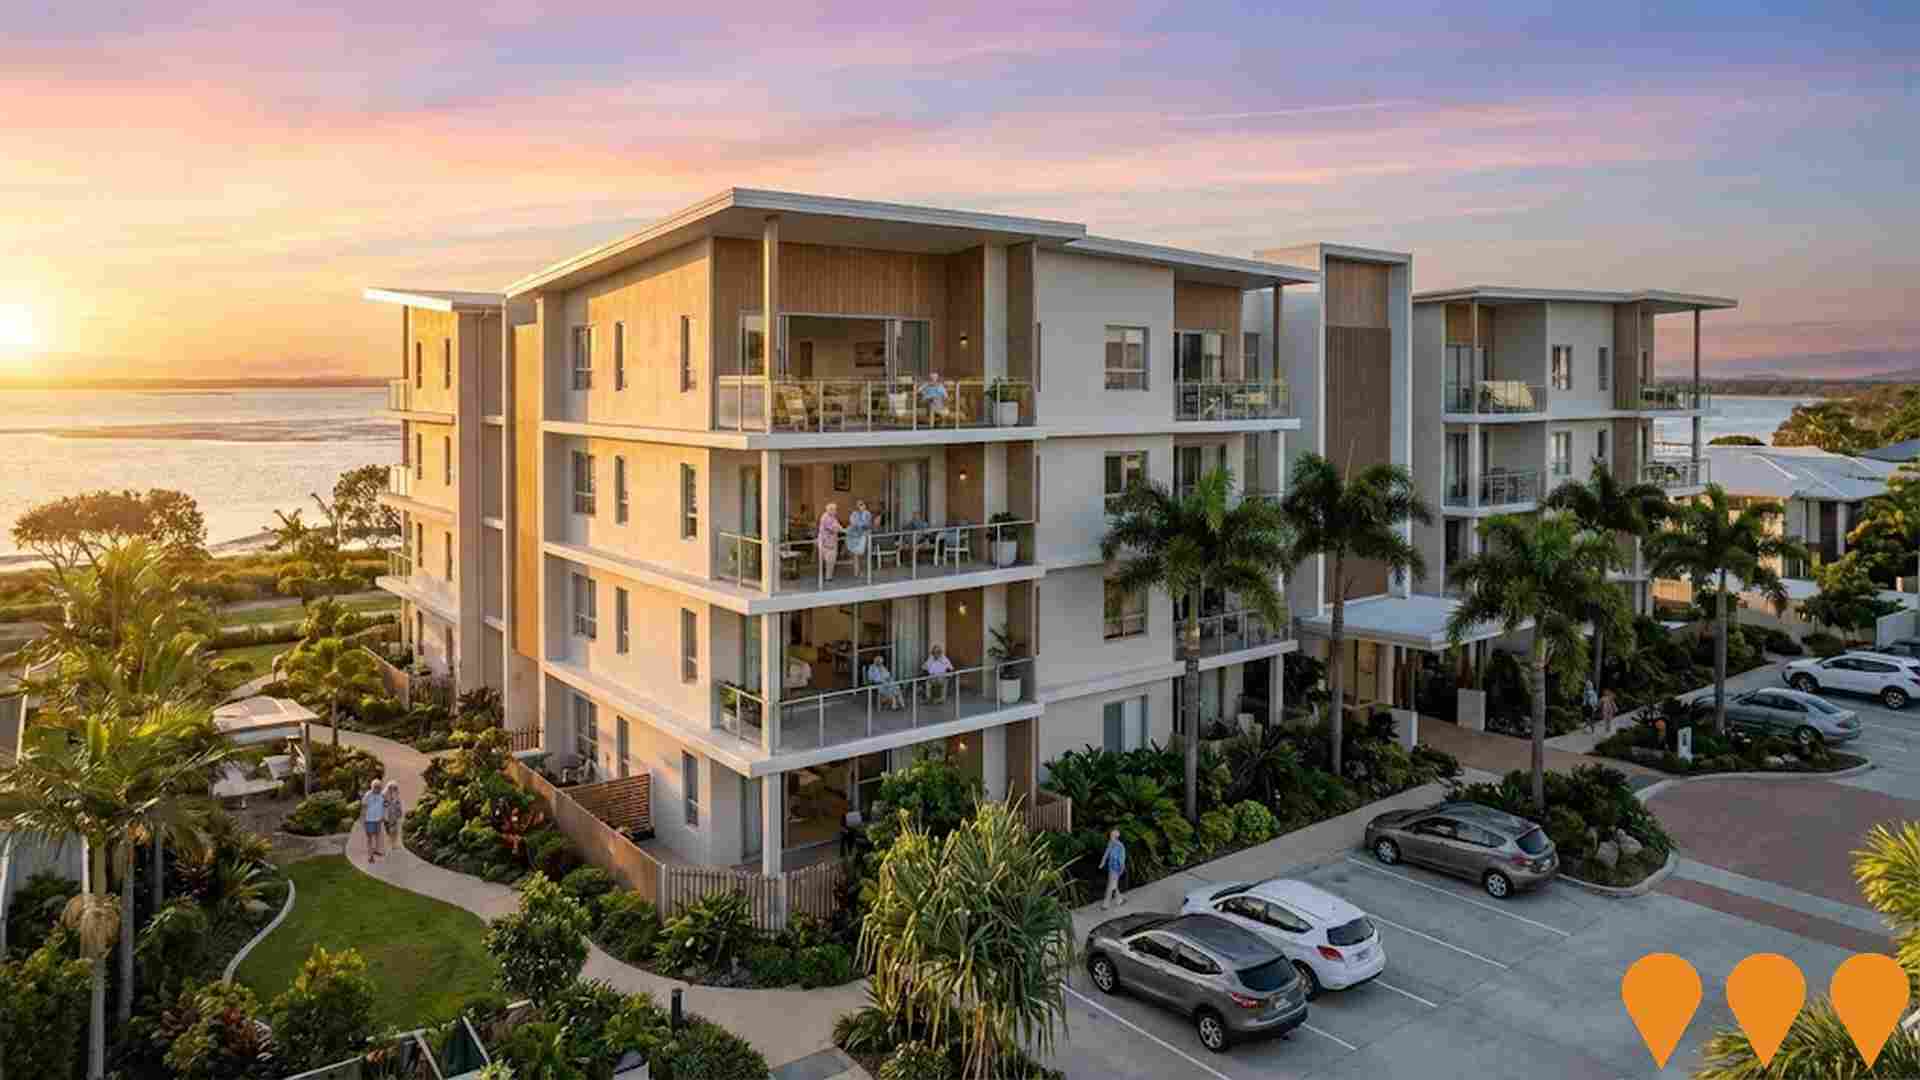
Bribie Island Retirement Community
New 5 storey retirement living community by Sundale comprising 84 independent living units with coastal views, shared lounges, landscaped gardens and onsite community facilities designed for seniors.
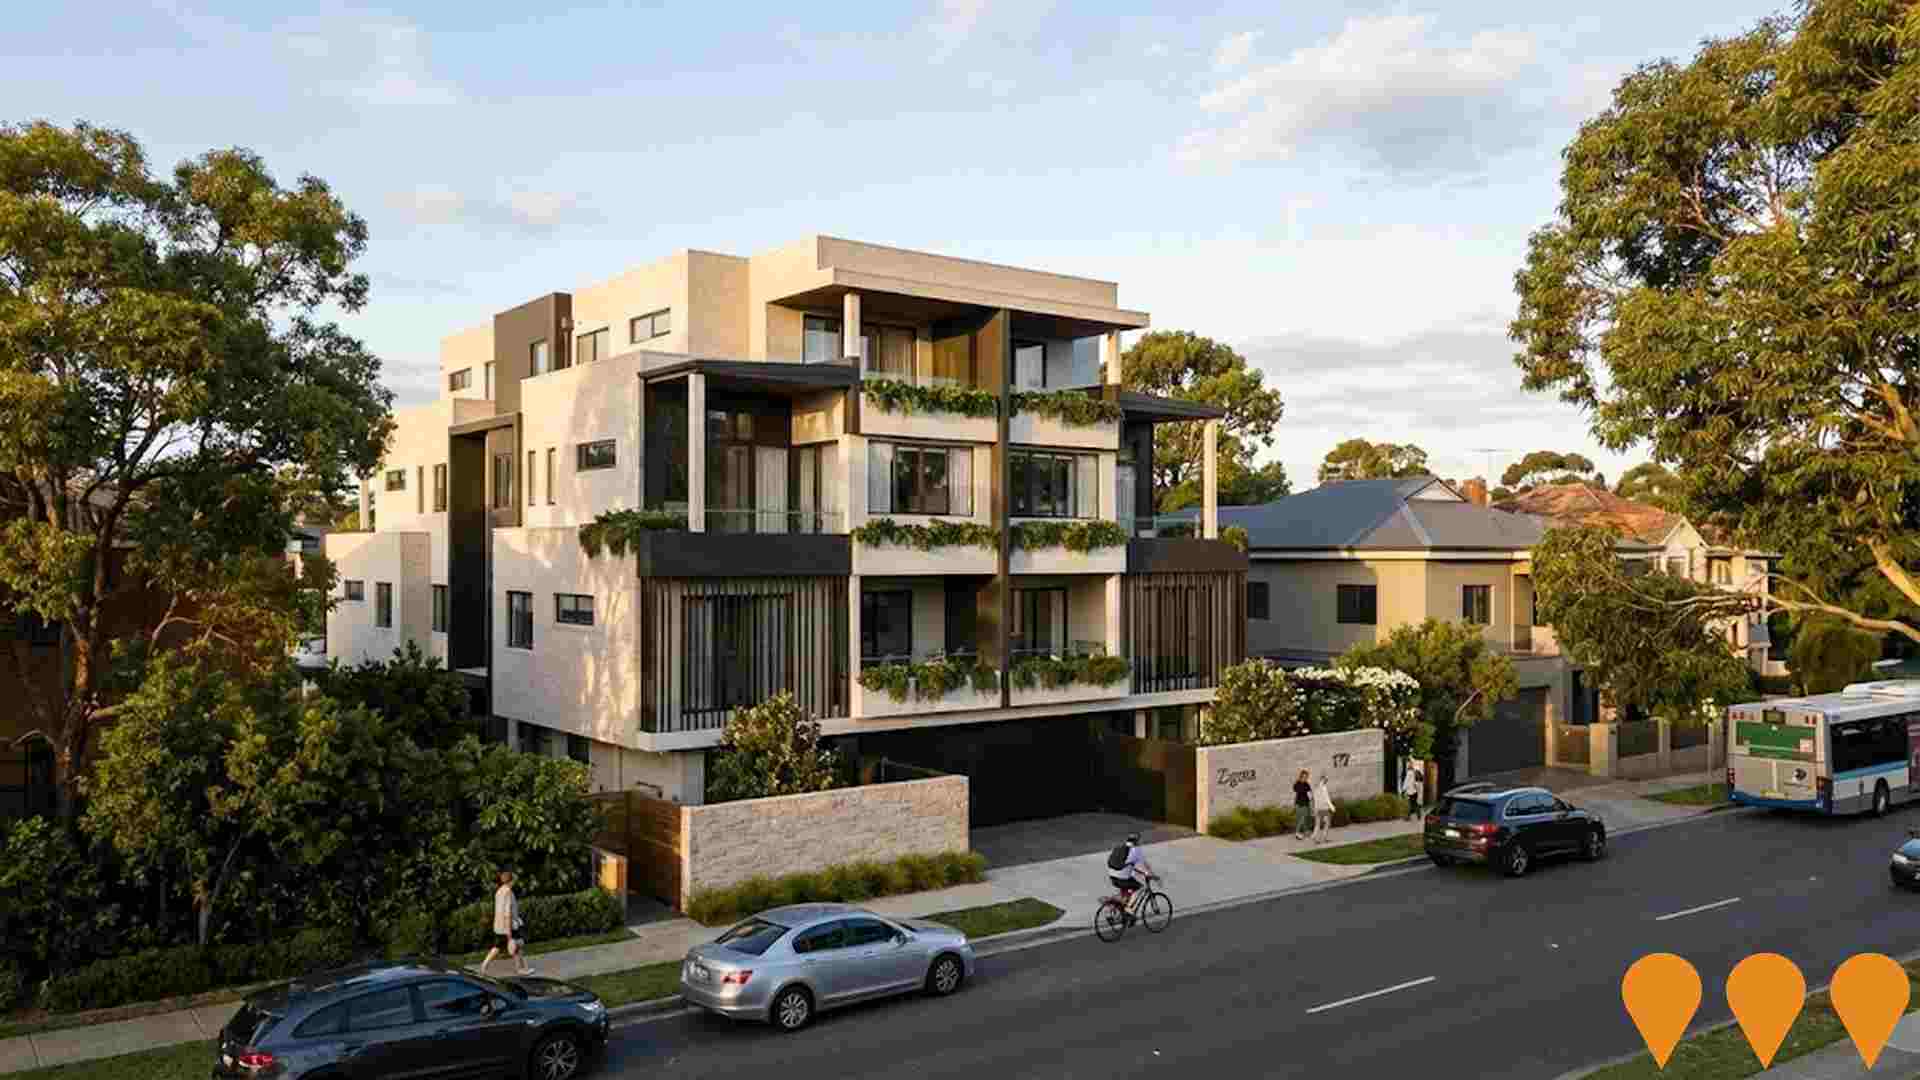
170-172 Prince Edward Parade Residential Development
Development application approval for a 5-storey medium-rise residential apartment building comprising 15 multi-bedroom dwellings following the amalgamation and demolition of existing residential sites. The development features private balconies, communal open space amenities, and integrated basement car parking along the Scarborough foreshore. Planning assessment was managed under the City of Moreton Bay planning scheme.
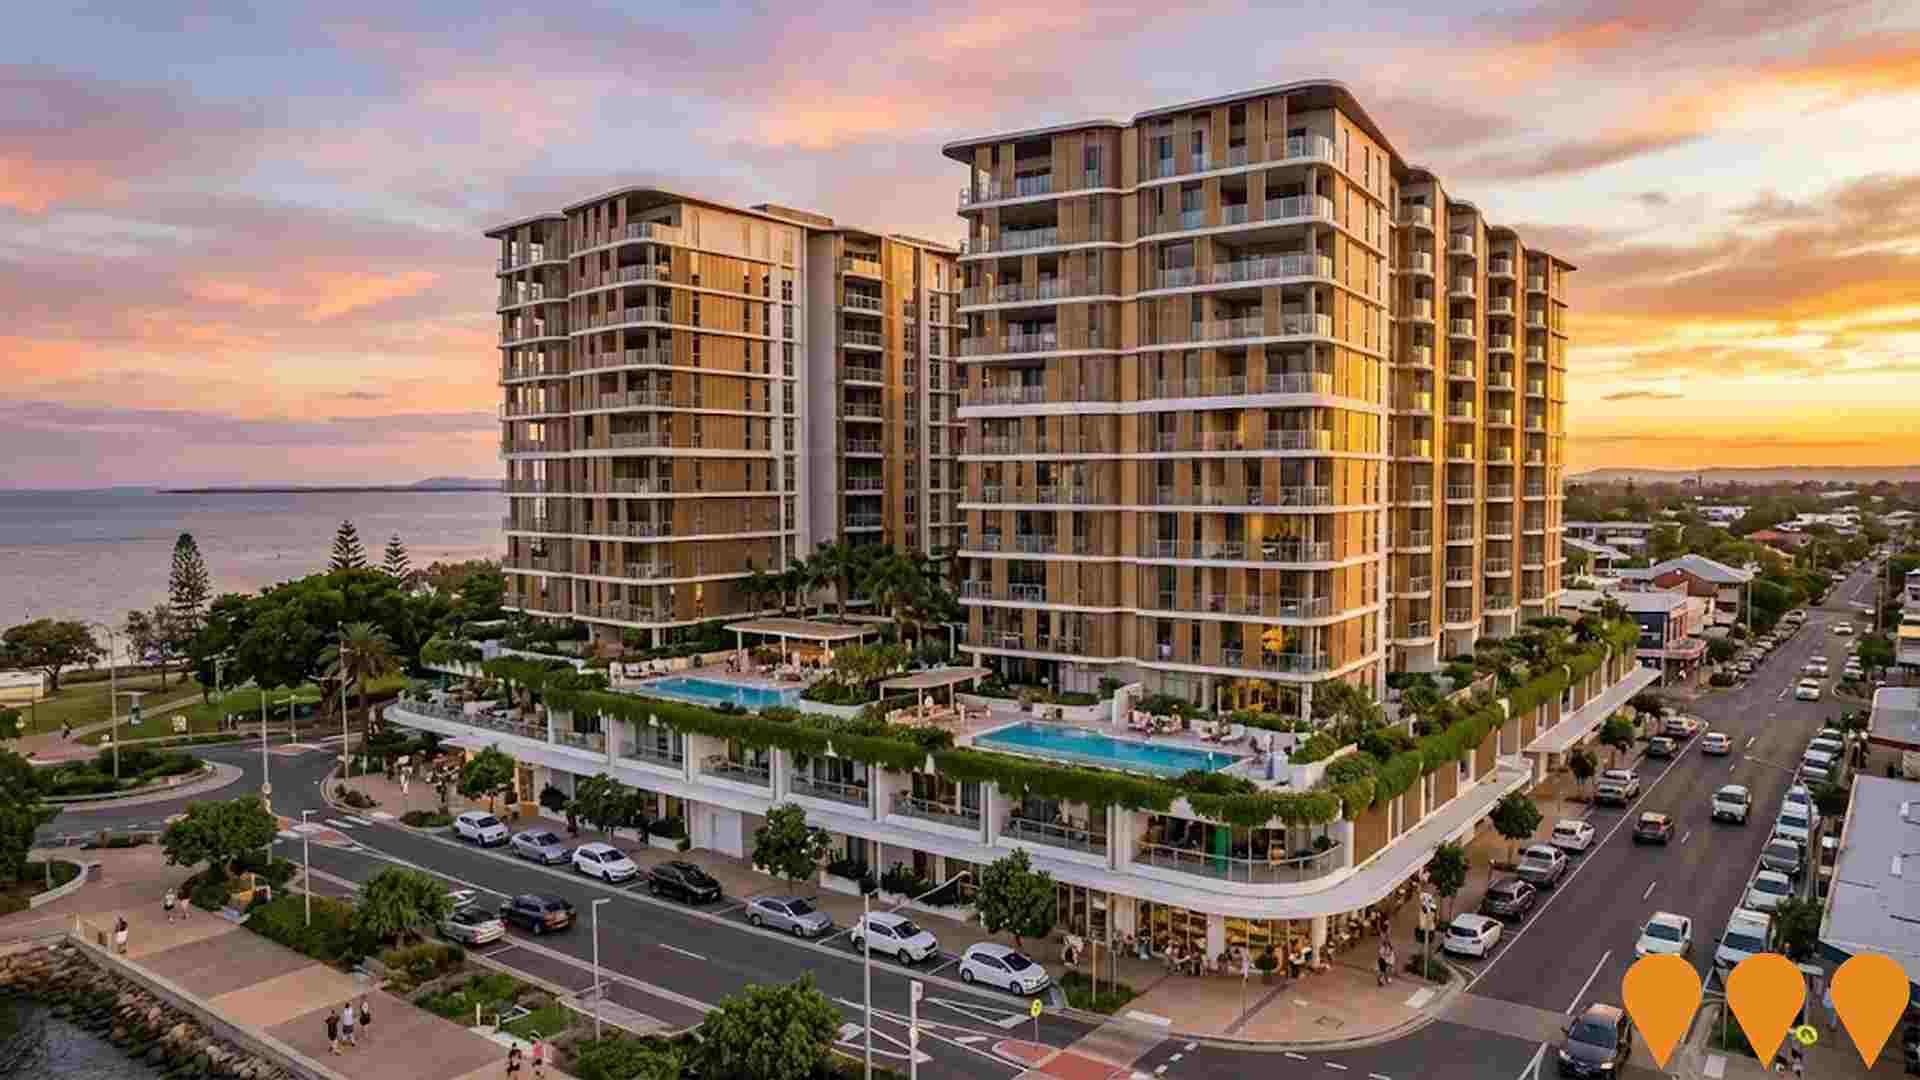
One Redcliffe
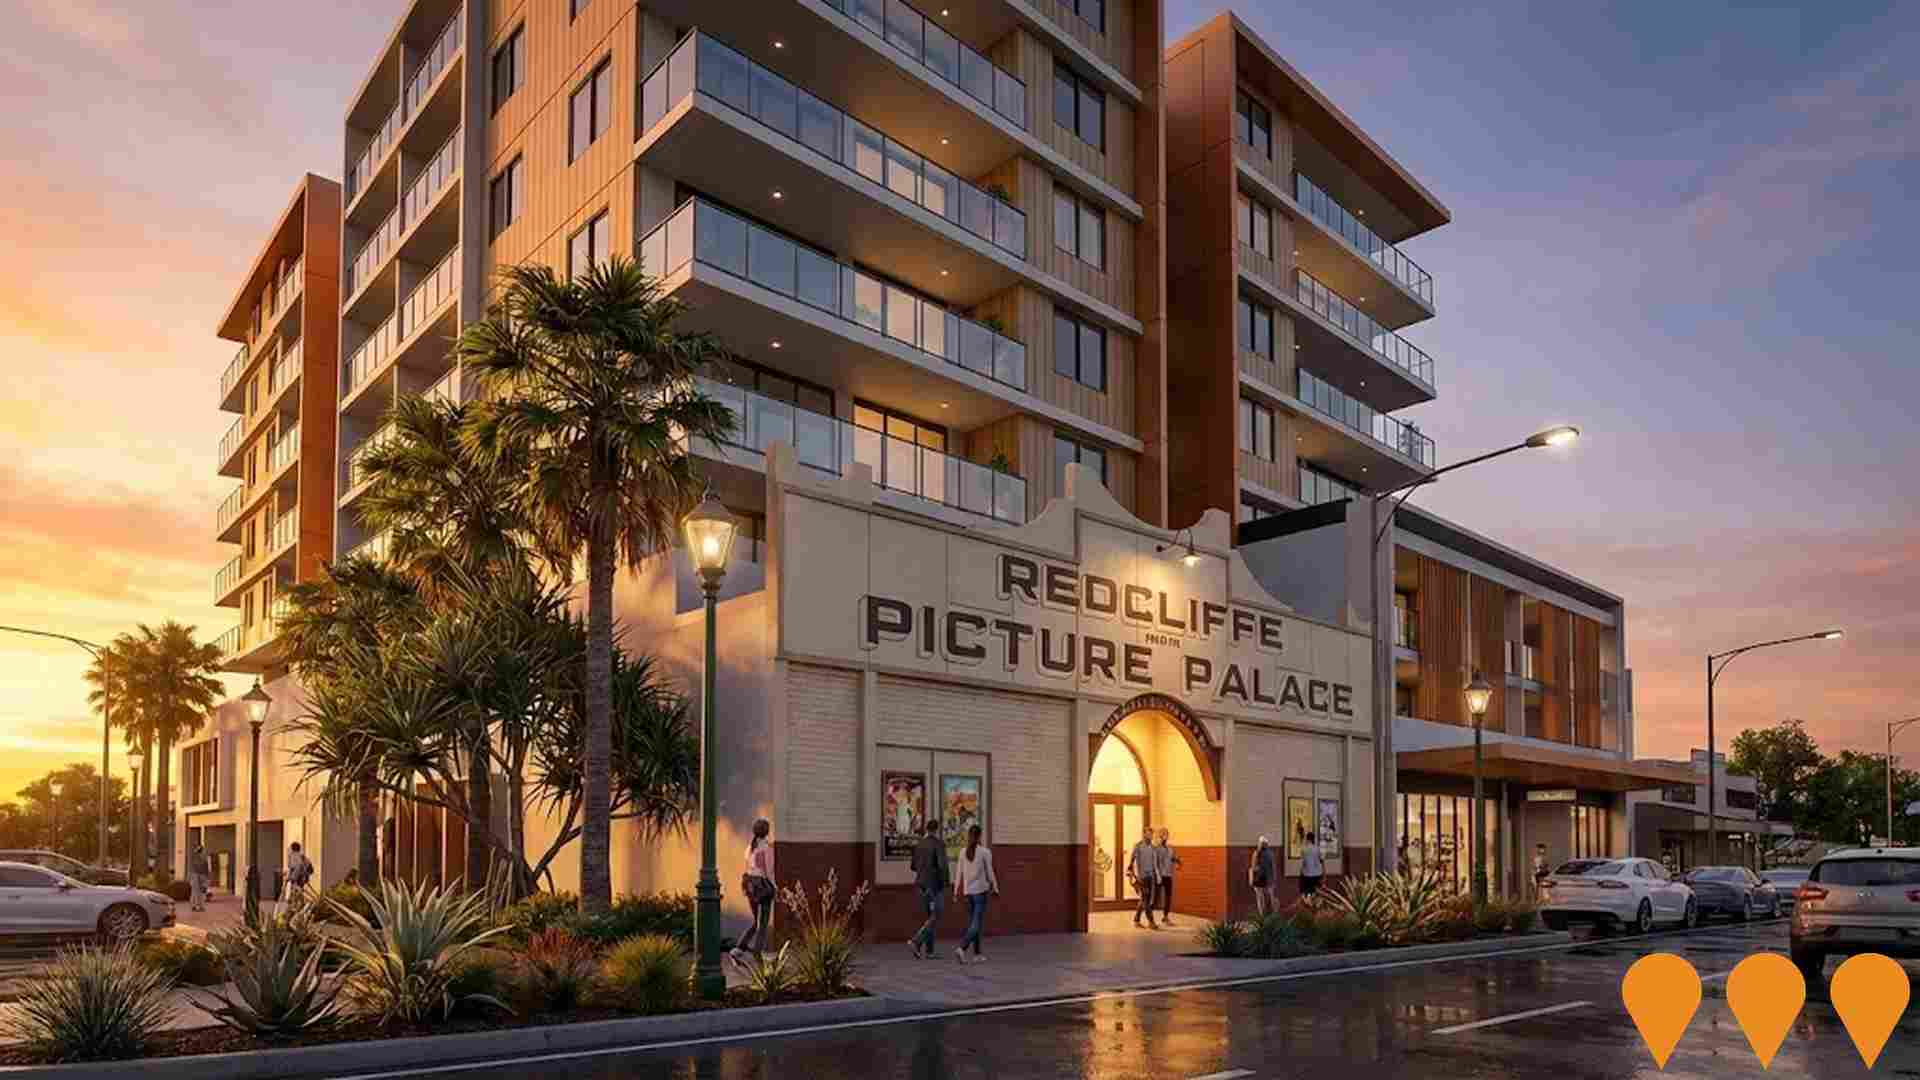
One Redcliffe is a landmark luxury mixed-use development by Gardner Vaughan Group featuring 214 apartments across two iconic 11-storey towers. The project includes 14 ground-floor retail and commercial tenancies designed to create a vibrant lifestyle precinct. Residents have access to resort-style amenities including two outdoor pools, a gymnasium, barbecue terraces, function rooms, and secure parking with EV charging stations. Construction reached significant excavation milestones in late 2025, with Stage 1 (Moreton Tower) expected to finish by early 2028 and Stage 2 (Stradbroke Tower) by mid-2029.
Cliff Stabilisation and Beach Nourishment - Flinders Parade Scarborough
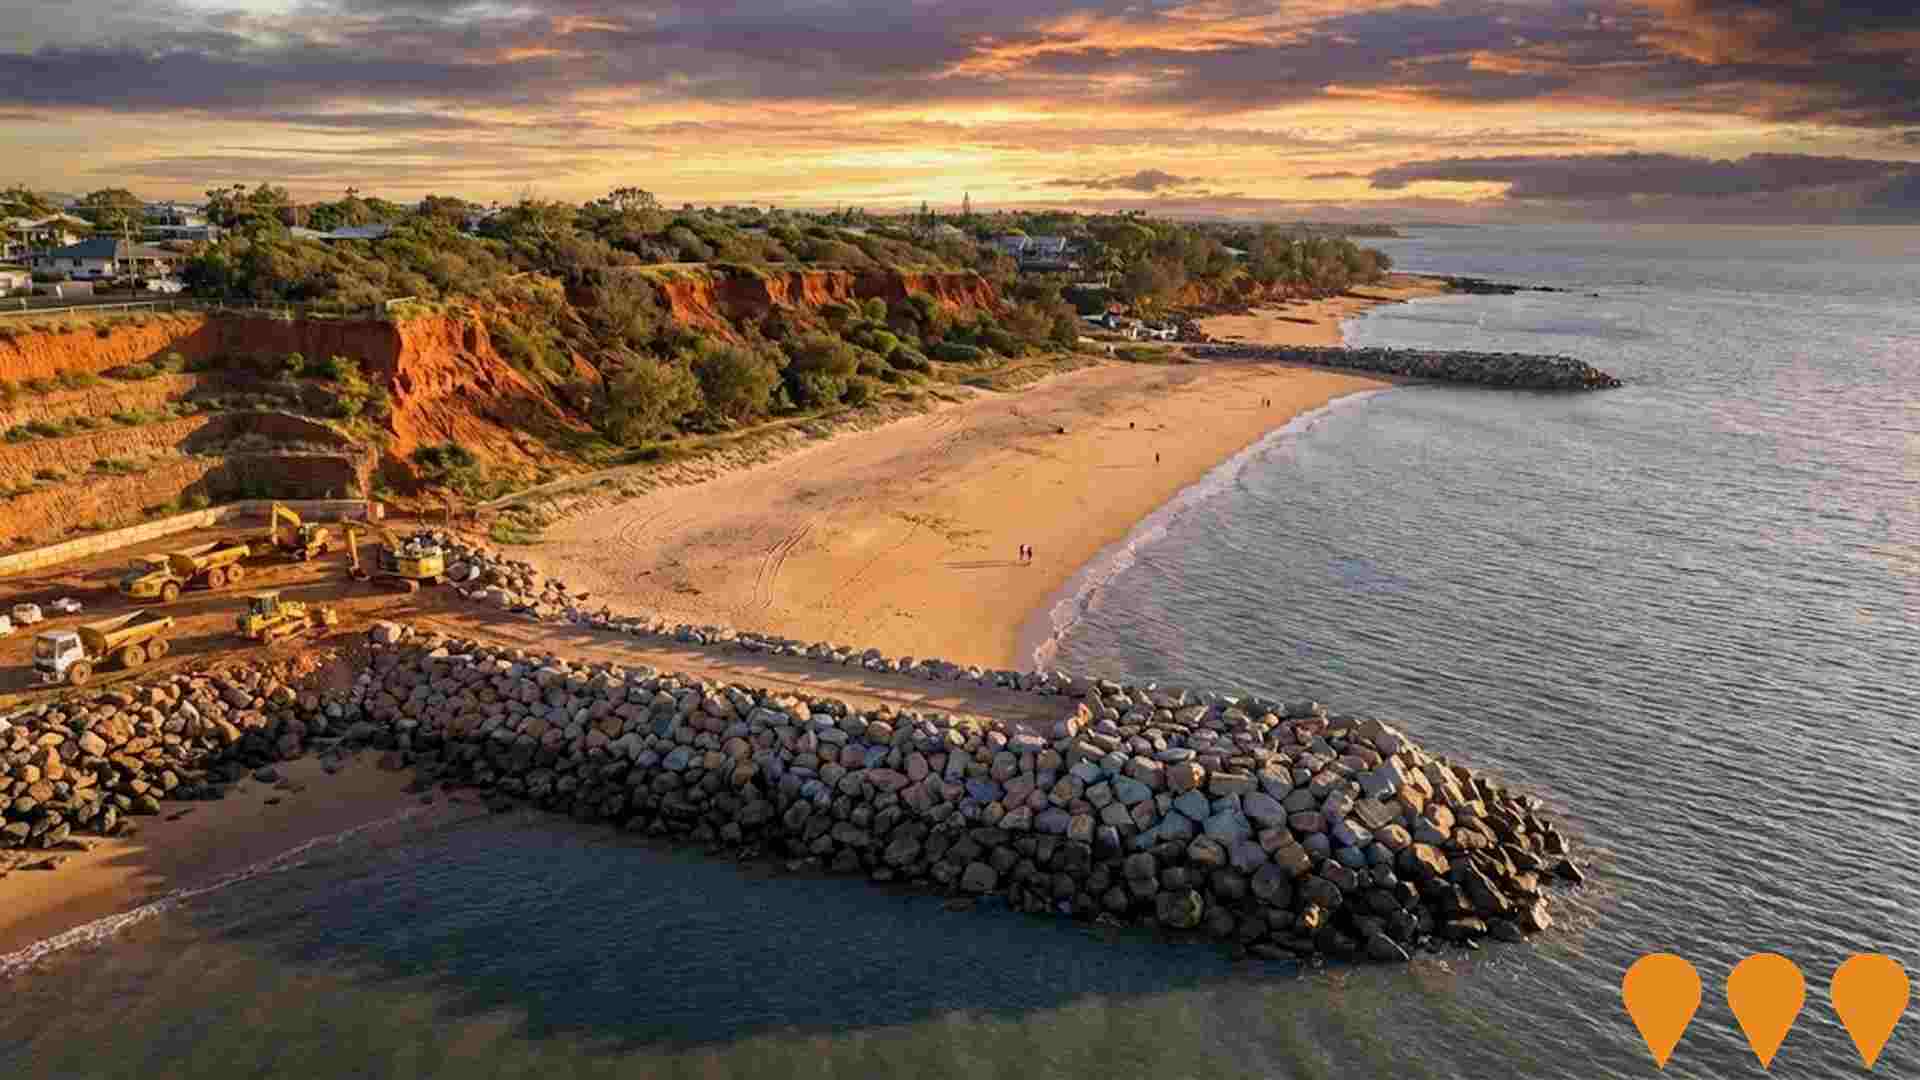
Coastal protection works along the foreshore opposite 133 to 153 Flinders Parade in Scarborough to mitigate erosion and stabilise the cliff line. The project entails extending the existing Drury Point rock groyne by approximately 50 metres and depositing around 10,000 cubic metres of sand for beach nourishment. Delivered by the City of Moreton Bay, the initiative forms part of a broader $15.1 million regional coastal mitigation program.


247 residents of Moreton Island are employed, from a labour force of 248. Unemployment sits at 0.4%, with participation at 52.9%. Weighted for its industry mix, the area's sectors are forecast to grow about 6.1% nationally over five years. That reflects industry composition only and makes no allowance for local population growth. Unemployment and labour force come from ABS Small Area Labour Markets, updated quarterly; the industry and occupation profile is from the 2021 Census.
Detail
Moreton Island has a skilled workforce, with tourism and hospitality sectors prominently featured, an unemployment rate of just 0.4%, and 8.8% in estimated employment growth over the past year. As of June 2025, 247 residents are in work while the unemployment rate is 3.7% below Greater Brisbane's rate of 4.1%, and workforce participation lags significantly (52.9% compared to Greater Brisbane's 64.5%). The key industries of employment among residents are accommodation & food, rental, hiring & real estate, and construction. The area shows particularly strong specialization in accommodation & food, with an employment share of 8.4 times the regional level.
Conversely, health care & social assistance shows lower representation at 2.7% versus the regional average of 16.1%. The ratio of 0.7 workers for each resident, as at the Census, indicates a level of local employment opportunities above the norm. Based on AreaSearch analysis of SALM and ABS data, over the 12 months to June 2025, employment increased by 8.8% while labour force increased by 8.3%, causing the unemployment rate to fall by 0.5 percentage points. In contrast, Greater Brisbane experienced employment growth of 4.4% and labour force growth of 4.0%, with a 0.4 percentage point drop. Jobs and Skills Australia's national employment forecasts from May 2025 can offer further insight into potential future demand within Moreton Island. These projections, covering five and ten-year periods, have been mapped against the local employment profile to estimate growth patterns. While national employment is forecast to expand by 6.6% over five years and 13.7% over ten years, growth rates differ significantly between industry sectors. Applying these industry-specific projections to Moreton Island's employment mix suggests local growth of approximately increase by 6.1%% over five years and 12.2% over ten years (please note this is a simple weighting extrapolation for illustrative purposes and does not take into account localised population projections).
Frequently Asked Questions - Employment
Moreton Island had 62 occupied dwellings at the 2021 Census, 94% detached houses and 0% apartments. 23% are owned with a mortgage, 23% rented and 54% owned outright. At that Census the median rent was $213 a week and the median mortgage repayment $1,517 a month. Rent absorbs 17.4% of household income here and mortgage repayments 28.6%. Dwelling stock, tenure and housing costs are 2021 Census measures — the only source that counts dwellings at this boundary size.
Detail
Dwelling structure within Moreton Island, as evaluated at the latest Census, comprised 93.9% houses and 6.1% other dwellings (semi-detached, apartments, 'other' dwellings), in comparison to Brisbane metro's 68.2% houses and 31.8% other dwellings. Meanwhile, the level of home ownership within Moreton Island was well beyond that of Brisbane metro, at 54.2%, with the remainder of dwellings either mortgaged (22.9%) or rented (22.9%). The median monthly mortgage repayment in the area was well below the Brisbane metro average at $1,517, while the median weekly rent figure was recorded at $213, compared to Brisbane metro's $1,733 and $350.
Nationally, Moreton Island's mortgage repayments are significantly lower than the Australian average of $1,863, while rents are substantially below the national figure of $375.
Frequently Asked Questions - Housing
Moreton Island counted 62 households at the 2021 Census, an estimated 67 today, averaging 1.9 people each. 6% are couples with children, against 43% couples without children. 40% of households are people living alone, and families average 1.1 children. Household and family composition is measured only by the Census, so these are 2021 figures.
Detail
Family households dominate at 59.7% of all households, comprising 6.3% couples with children, 42.9% couples without children, and 11.1% single parent families. Non-family households make up the remaining 40.3%, with lone person households at 39.7% and group households comprising 0.0% of the total. The median household size of 1.9 people is smaller than the Greater Brisbane average of 2.3.
Frequently Asked Questions - Households
21.7% of adults in Moreton Island hold a university qualification, including 17.6% with a bachelor degree and 4.1% with postgraduate qualifications. A further 39.7% hold a vocational qualification. Qualifications come from the 2021 Census.
Detail
Educational qualifications in Moreton Island trail regional benchmarks, with 21.7% of residents aged 15+ holding university degrees compared to 30.5% in Greater Brisbane. This gap highlights potential for educational development and skills enhancement. Bachelor degrees lead at 17.6%, followed by postgraduate qualifications (4.1%) and graduate diplomas (0.0%). Trade and technical skills feature prominently, with 54.3% of residents aged 15+ holding vocational credentials – advanced diplomas (14.6%) and certificates (39.7%). Educational participation is notably high, with 37.2% of residents currently enrolled in formal education. This includes 10.3% in tertiary education, 6.2% in secondary education, and 0.0% pursuing primary education.
Educational facilities appear to be located outside the immediate catchment boundaries, requiring families to access schools in neighboring areas.
Frequently Asked Questions - Education
Schools Detail
Detail
No transport stops were observed in the latest assessment of GTFS data for this area.
Frequently Asked Questions - Transport
Transport Stops Detail
75.4% of residents in Moreton Island report no long-term health condition, a healthier profile than 92% of areas nationally. 1.9% need daily assistance with core activities. Health conditions, assistance needs and insurance are 2021 Census measures; the death rate comes from current ABS releases.
Detail
Health outcomes data demonstrates outstanding results across Moreton Island with very low prevalence of common health conditions across all age groups , and the rate of private health cover found to be extremely low at approximately 0% of the total population (~0 people). This compares to 51.3% across Greater Brisbane. The national average is 55.3%. The most common medical conditions in the area were found to be arthritis and asthma, impacting 7.2 and 6.3% of residents, respectively, while 75.4% declared themselves as completely clear of medical ailments compared to 59.7% across Greater Brisbane.
The area has 15.6% of residents aged 65 and over (51 people), which is lower than the 28.2% in Greater Brisbane. Health outcomes among seniors are particularly strong, broadly in line with the general population's health profile. Overall 1.9% of the total population registered as requiring assistance with day to day activities, which is well below average. In Greater Brisbane, 8.8% require assistance. Nationally, 5.8% require assistance.
Frequently Asked Questions - Health
26.2% of Moreton Island residents were born overseas and 14.8% speak a language other than English at home. The largest reported ancestries are English (29.1%) and Australian (24.0%). Ancestry, language and country of birth are counted only by the Census, so these are 2021 figures.
Detail
Moreton Island was found to be more culturally diverse than the vast majority of local markets, with 14.8% of its population speaking a language other than English at home and 26.2% born overseas. The main religion in Moreton Island was found to be Christianity, which makes up 43.9% of people in Moreton Island. This compares to 52.8% across Greater Brisbane. In terms of ancestry (country of birth of parents), the top three represented groups in Moreton Island are English, comprising 29.1% of the population, Australian, comprising 24.0% of the population, and Scottish, comprising 7.7% of the population.
Additionally, there are notable divergences in the representation of certain other ethnic groups: Dutch is notably overrepresented at 2.9% of Moreton Island (vs 1.4% regionally), French at 1.3% (vs 0.5%) and Russian at 1.3% (vs 0.3%).
Frequently Asked Questions - Diversity
The median resident of Moreton Island is 42, older than 78% of areas nationally. That is 3 years younger than at the 2021 Census. 41.1% of residents are aged 15 to 34. Age cohorts are not raw Census counts: the Census split is re-based to the latest ABS population estimates and state projections.
Detail
At 42 years, Moreton Island's median age is significantly above the Greater Brisbane average of 36 as well as considerably older than the Australian median of 38. Compared to the Greater Brisbane average, the 25 - 34 cohort is notably over-represented (31.1% locally), while 5 - 14 year-olds are under-represented (2.2%). This 25 - 34 concentration is well above the national 14.5%. Following the 2021 Census, younger residents have shifted the median age down by 2.7 years to 42. In particular, the 25 to 34 age group has grown from 21.8% to 31.1% of the population, while the 35 to 44 cohort increased from 7.6% to 12.0%.
Conversely, the 15 to 24 cohort has declined from 18.8% to 9.9% and the 65 to 74 group dropped from 14.2% to 10.2%. Demographic modeling suggests Moreton Island's age profile will evolve significantly by 2041. The 65 to 74 cohort shows the strongest projected growth at 0%, adding 0 residents to reach 34. Notably, the combined 65+ age groups will account for 72% of total population growth, reflecting the area's aging demographic profile. In contrast, population declines are projected for the 75 to 84 and 0 to 4 cohorts.
Frequently Asked Questions - Age
Data & MethodBoundaries, Sources & Method for Moreton Island
9 of 14 data sections on this page were updated within the last 12 months — the newest current to Sep 2026.
Everything is aggregated to the SA2 boundary shown above, on a 2021 Census baseline. Only 3 sections — housing, households and cultural diversity — still wait on the 2026 Census.
The ledger — source, cycle and currency by section
| Section | Source & update cycle | Currency |
|---|---|---|
| Updated within the last 12 months 9 sections | ||
| Population | ABS, GNAF, Geoscience Australia Annual (ABS ERP) | Aug 2026 last month headline measures · 2021 Census baseline |
| Re-based to the ABS Estimated Resident Population (June 2024 release) and updated with new dwellings from GNAF address data. Current to Aug 2026, with the 2021 Census supplying the small-area baseline. | ||
| Age profile | ABS, Geoscience Australia, State governments Annual | Aug 2026 last month headline measures · 2021 Census baseline |
| Age cohorts are re-based to the latest ABS population estimates and state projections, current to Aug 2026. Each cohort is held as a Census baseline and a current estimate. | ||
| Development & approvals | ABS, GNAF Monthly (ABS approvals) | Aug 2026 last month headline measures · Jul 2026 baseline |
| Property sales & rents | Valuer General, Rental Board, ABS Weekly sales, quarterly rents | Sep 2026 this month all 21 measures |
| Sales from the state Valuer General register, refreshed weekly, and rents from quarterly rental bond lodgements. Both are read live each time this page loads, current to Sep 2026. | ||
| Infrastructure projects | Infrastructure Australia, Local governments Daily | May 2026 4 months ago all 2 projects tracked here |
| Project pipeline maintained continuously from Infrastructure Australia, state agencies, local government and public announcements. Records are added and revised daily; this area was last updated May 2026. | ||
| Employment | ABS, DEWR, JSA Quarterly (ABS SALM) | Mar 2026 6 months ago headline measures · 2021 Census baseline |
| Unemployment and labour force from ABS Small Area Labour Markets, current to Mar 2026. The growth outlook applies Department of Employment (now Jobs and Skills Australia) forecasts for all 19 industry divisions to the local industry mix, so it measures sector composition rather than local expansion and makes no allowance for population growth. Job demand comes from the same agency via its Internet Vacancy Index; industry and occupation structure from the 2021 Census. | ||
| Education | ABS, ACARA Annual (ACARA) | Aug 2026 last month headline measures · 2021 Census baseline |
| Transport | ABS, State Transport Departments Each timetable release | Jul 2026 2 months ago headline measures · 2021 Census baseline |
| Services & amenities | Provider directories, ACECQA Continuous | Jul 2026 2 months ago all 14 measures |
| Annual and financial-year sources 2 sections | ||
| Income | ABS, ATO Annual (ATO) | FY 2023 3 years ago headline measures · 2021 Census baseline |
| ATO taxable income statistics for FY 2022, indexed forward using the Wage Price Index. Census household income provides the distribution detail. | ||
| Health | ABS, ATO Annual | 2024 2 years ago headline measures · 2021 Census baseline |
| Census-measured — next update: 2026 Census 3 sections No more current small-area source exists for these, so they are labelled as Census-measured rather than implied to be current. | ||
| Housing | ABS 5-yearly (Census) | 2021 Census next update 2026 all 30 measures |
| Households | ABS 5-yearly (Census) | 2021 Census next update 2026 all 18 measures |
| Cultural diversity | ABS, Geoscience Australia 5-yearly (Census) | 2021 Census next update 2026 all 44 measures |
"Currency" is the most recent release feeding that section. Where the Census supplies the structural baseline underneath a current headline figure, the row says so.
How the numbers are built
Population
The Census provides the small-area baseline, aggregated from mesh blocks to this boundary. It is then re-based to the ABS Estimated Resident Population (June 2024 release), and new dwellings built since Census night are counted from address data. The headline figure is therefore a current estimate for Nov 2025, not a 2021 count (316 at the 2021 Census → 334 now). Annual growth rates are compound (CAGR), not simple averages.
Age profile
Cohort shares are not raw Census counts. Every cohort is held as a pair — the Census baseline and a current estimate — and the split is re-based using ERP and state population projections, current to Nov 2025. Median age is the Census median plus modelled change since. Charts that show both are labelled "2021 Census vs Current Estimate".
Property sales
Sourced from the state valuation authority's sales register — current, not Census, and refreshed weekly. Medians are calculated from settled transactions in the period shown; periods with very low transaction counts are flagged or suppressed, because a handful of sales can move a median substantially.
Rents
Derived from state rental bond lodgement data, by dwelling type and bedroom count. Bonds are lodged at the start of a new tenancy, so this reflects new lettings, not the whole rented stock.
Development & infrastructure
Building approvals come from current ABS releases; development applications are collected from council and state planning portals; the infrastructure pipeline is compiled from Infrastructure Australia and local government sources. Applications are matched to this boundary by address or coordinates, so very recent lodgements may not yet appear.
Employment & income
Industry and occupation structure comes from the Census, but the headline labour-market indicators do not. Unemployment and labour force are derived from ABS Small Area Labour Markets (quarterly). The employment outlook applies Department of Employment forecasts for all 19 industry divisions to this area's own industry mix (the agency is now Jobs and Skills Australia), as does the Internet Vacancy Index used for job demand. Because it is weighted on industry composition alone, that outlook carries no allowance for local population growth — in fast-growing areas the real rise in local jobs will typically be higher. Income combines Census household income with ATO taxable-income statistics for FY 2022, indexed forward using the Wage Price Index.
Education, transport & amenities
School enrolments, ICSEA and performance come from ACARA's current release, not the Census. Public transport stops and service frequency are derived from GTFS timetable feeds published by state transport departments. Services and amenities are proximity and count scores built from provider directories, refreshed on their own cycle. The Census contributes only the travel-to-work and qualification measures.
Rankings and benchmarks. Where we rank this area, the comparison set is every area of the same boundary type — suburbs against suburbs, SA2s against SA2s. Benchmarks compare this area against its greater capital city region and the national figure for the same measure and period.
Limits worth knowing. Small areas carry larger error margins, and the ABS introduces small random adjustments to Census counts to protect confidentiality — so totals may not sum exactly. Estimates re-based from regional data describe the area's expected trajectory, not a direct count of it. Figures are indicative for research and are not financial, planning or valuation advice.
Cross-check us. The Census baseline for this boundary is at ABS 2021 Census QuickStats (313051574). QuickStats reports 2021 only — the figures on this page are more current wherever the ledger shows a later date.