Chart Color Schemes
This analysis uses ABS Statistical Areas Level 2 (SA2) boundaries, which can materially differ from Suburbs and Localities (SAL) even when sharing similar names.
SA2 boundaries are defined by the Australian Bureau of Statistics and are designed to represent communities for statistical reporting (e.g., census and ERP).
Suburbs and Localities (SAL) represent commonly-used suburb/locality names (postal-style areas) and may use different geographic boundaries. For comprehensive analysis, consider reviewing both boundary types if available.
est. as @ -- *
ABS ERP | -- people | --
2021 Census | -- people
Sales Activity
Curious about local property values? Filter the chart to assess the volume and appreciation (including resales) trends and regional comparisons, or scroll to the map below view this information at an individual property level.
Find a Recent Sale
Sales Detail
Population
Population growth drivers in Bribie Island are strong compared to national averages based on AreaSearch's ranking of recent, and medium to long-term trends
Bribie Island's population was approximately 20,612 people as of March 2021. By November 2025, the population had increased to around 22,161, a rise of 1,549 people (7.5%). This increase is inferred from the estimated resident population of 22,137 in June 2024 and an additional 304 validated new addresses since March 2021. The population density was approximately 152 persons per square kilometer as of November 2025. Over the decade ending in March 2021, Bribie Island's population grew at a compound annual growth rate of 1.9%, outpacing its SA3 area. Interstate migration contributed about 79.2% of overall population gains during this period.
AreaSearch uses ABS/Geoscience Australia projections for each SA2 area released in October 2024 with a base year of 2022. For areas not covered by this data and years post-2032, Queensland State Government's SA2 area projections released in June 2023, based on 2021 data, are adopted. These state projections do not provide age category splits, so AreaSearch applies proportional growth weightings in line with ABS Greater Capital Region projections released in December 2023, based on 2022 data, for each age cohort. Based on projected demographic shifts and latest annual ERP population numbers, Bribie Island is expected to grow by approximately 2,387 persons to reach around 25,000 people by March 2041, reflecting a total increase of about 10.7% over the 17 years.
Frequently Asked Questions - Population
Development
AreaSearch assessment of residential approval activity sees Bribie Island among the top 30% of areas assessed nationwide
Bribie Island has seen approximately 136 new homes approved annually over the past five financial years, totalling 683 homes. As of FY-26, 15 approvals have been recorded. On average, 3.4 new residents per year arrive for each dwelling constructed between FY-21 and FY-25, indicating demand outpaces supply, which may put upward pressure on prices and increase competition among buyers. The average construction value of new properties is $238,000, lower than regional levels, suggesting more affordable housing choices for buyers.
In FY-26, commercial approvals totalled $8.1 million, indicating limited commercial development focus compared to Greater Brisbane, where development levels are similar per person, preserving market equilibrium. Recent construction comprises 97.0% detached houses and 3.0% medium and high-density housing, maintaining the area's low density nature and attracting space-seeking buyers despite increasing density pressures. The estimated population per dwelling approval is 490 people, reflecting its quiet development environment.
By 2041, Bribie Island is projected to gain 2,363 residents. At current development rates, new housing supply should comfortably meet demand, providing favourable conditions for buyers and potentially supporting growth beyond current population projections.
Frequently Asked Questions - Development
Infrastructure
Bribie Island has very high levels of nearby infrastructure activity, ranking in the top 20% nationally
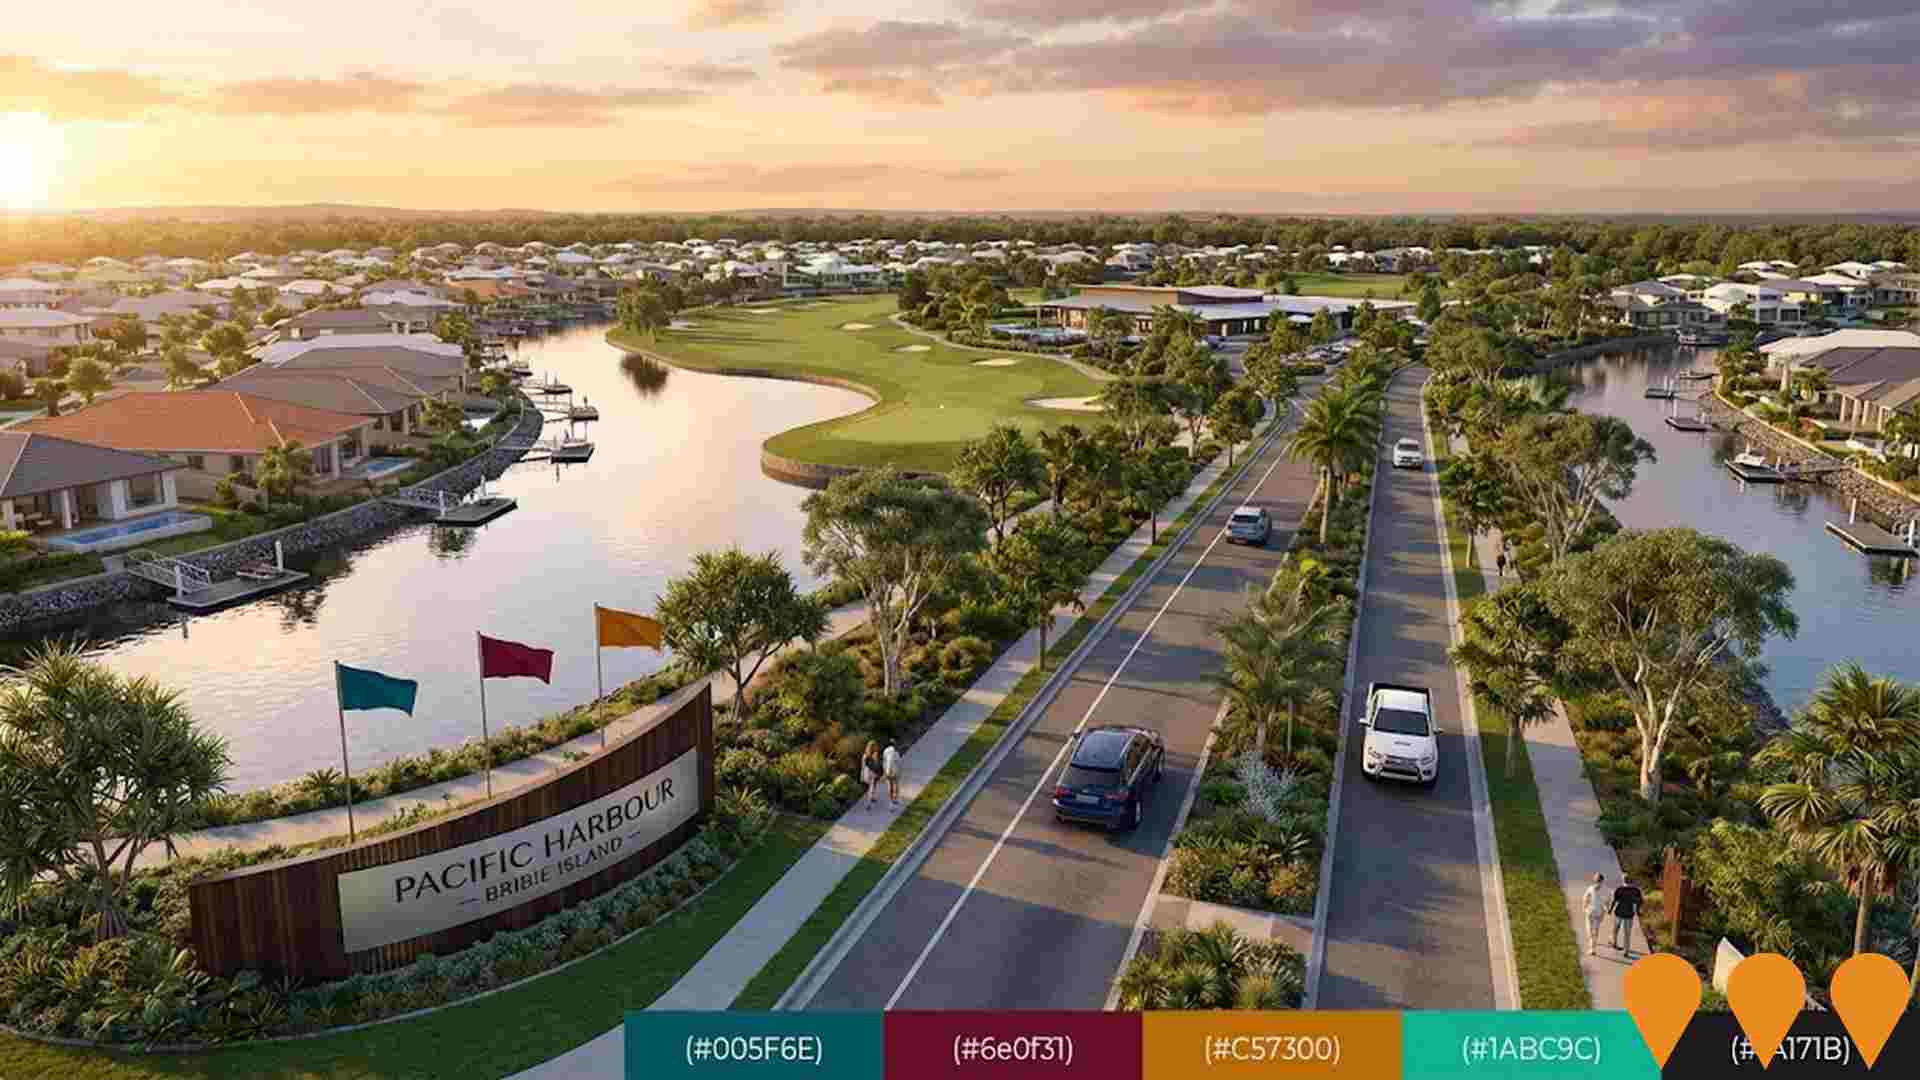
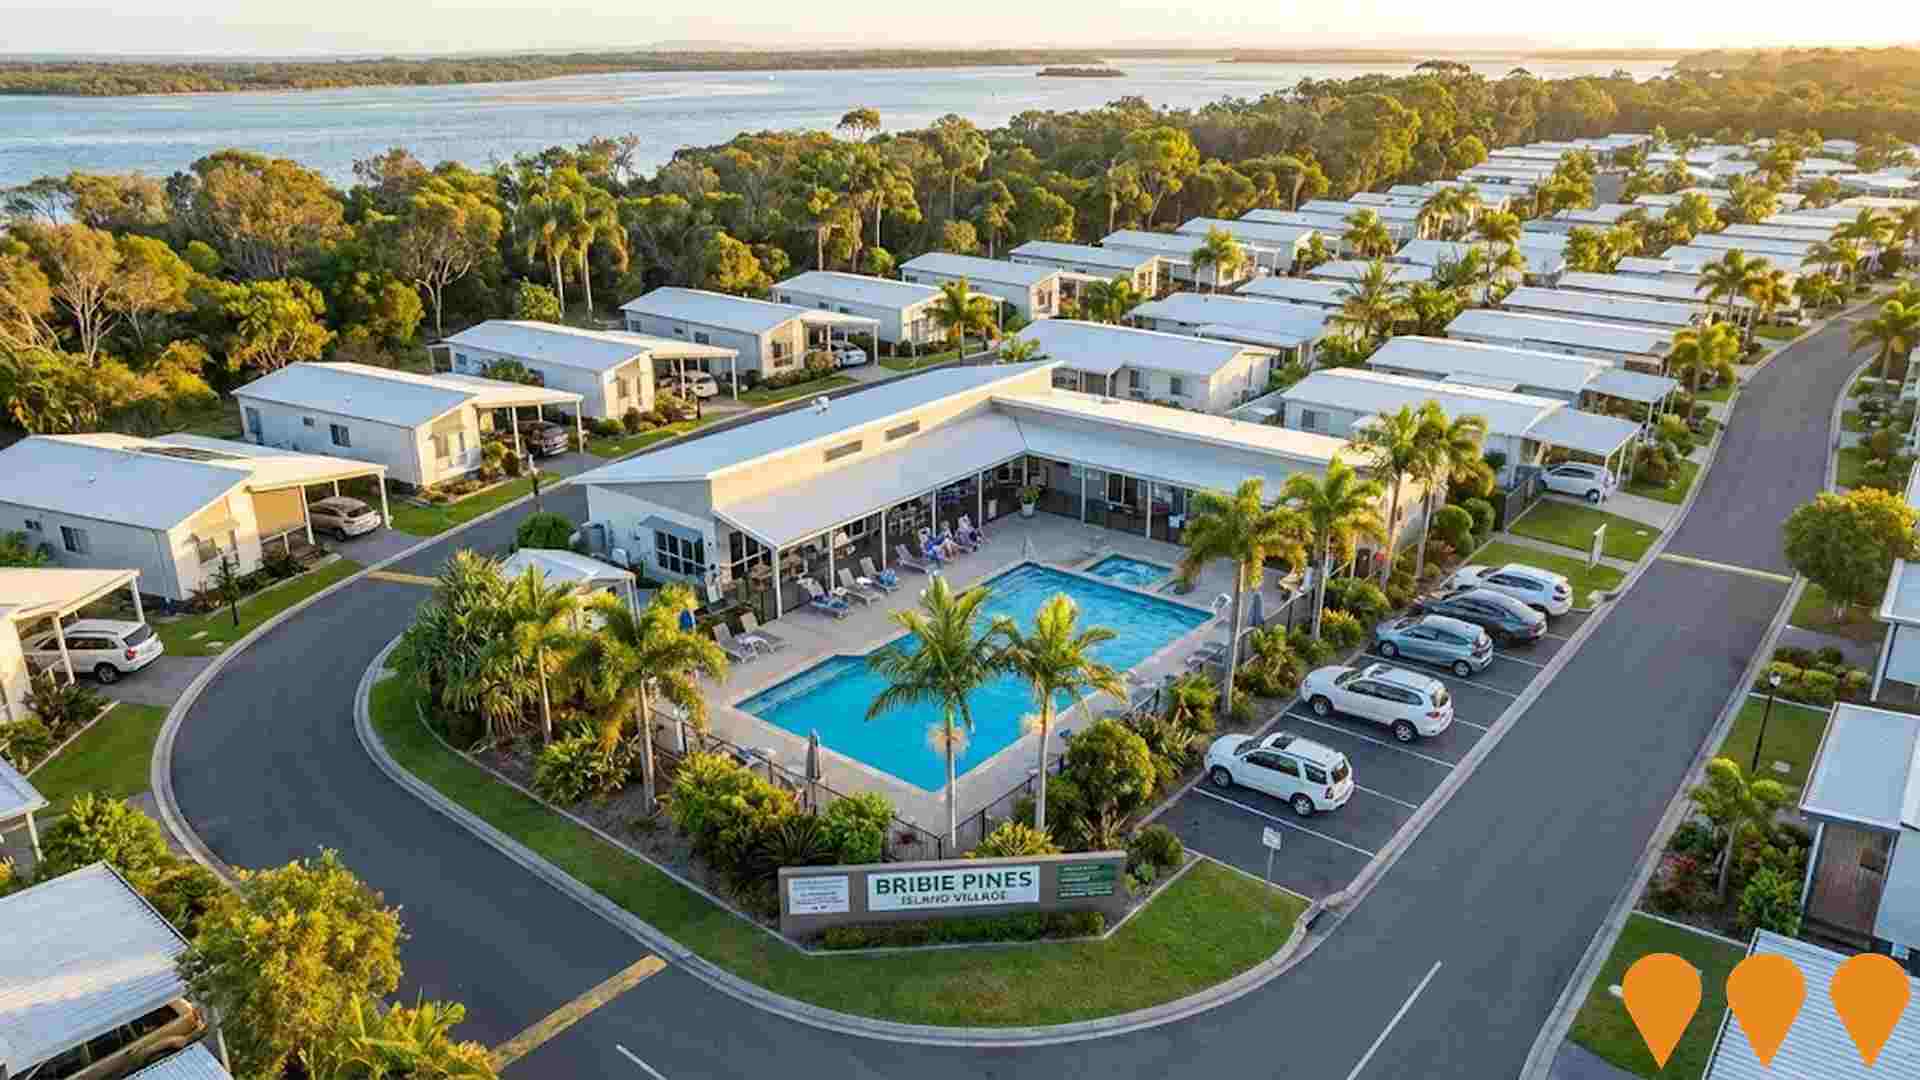
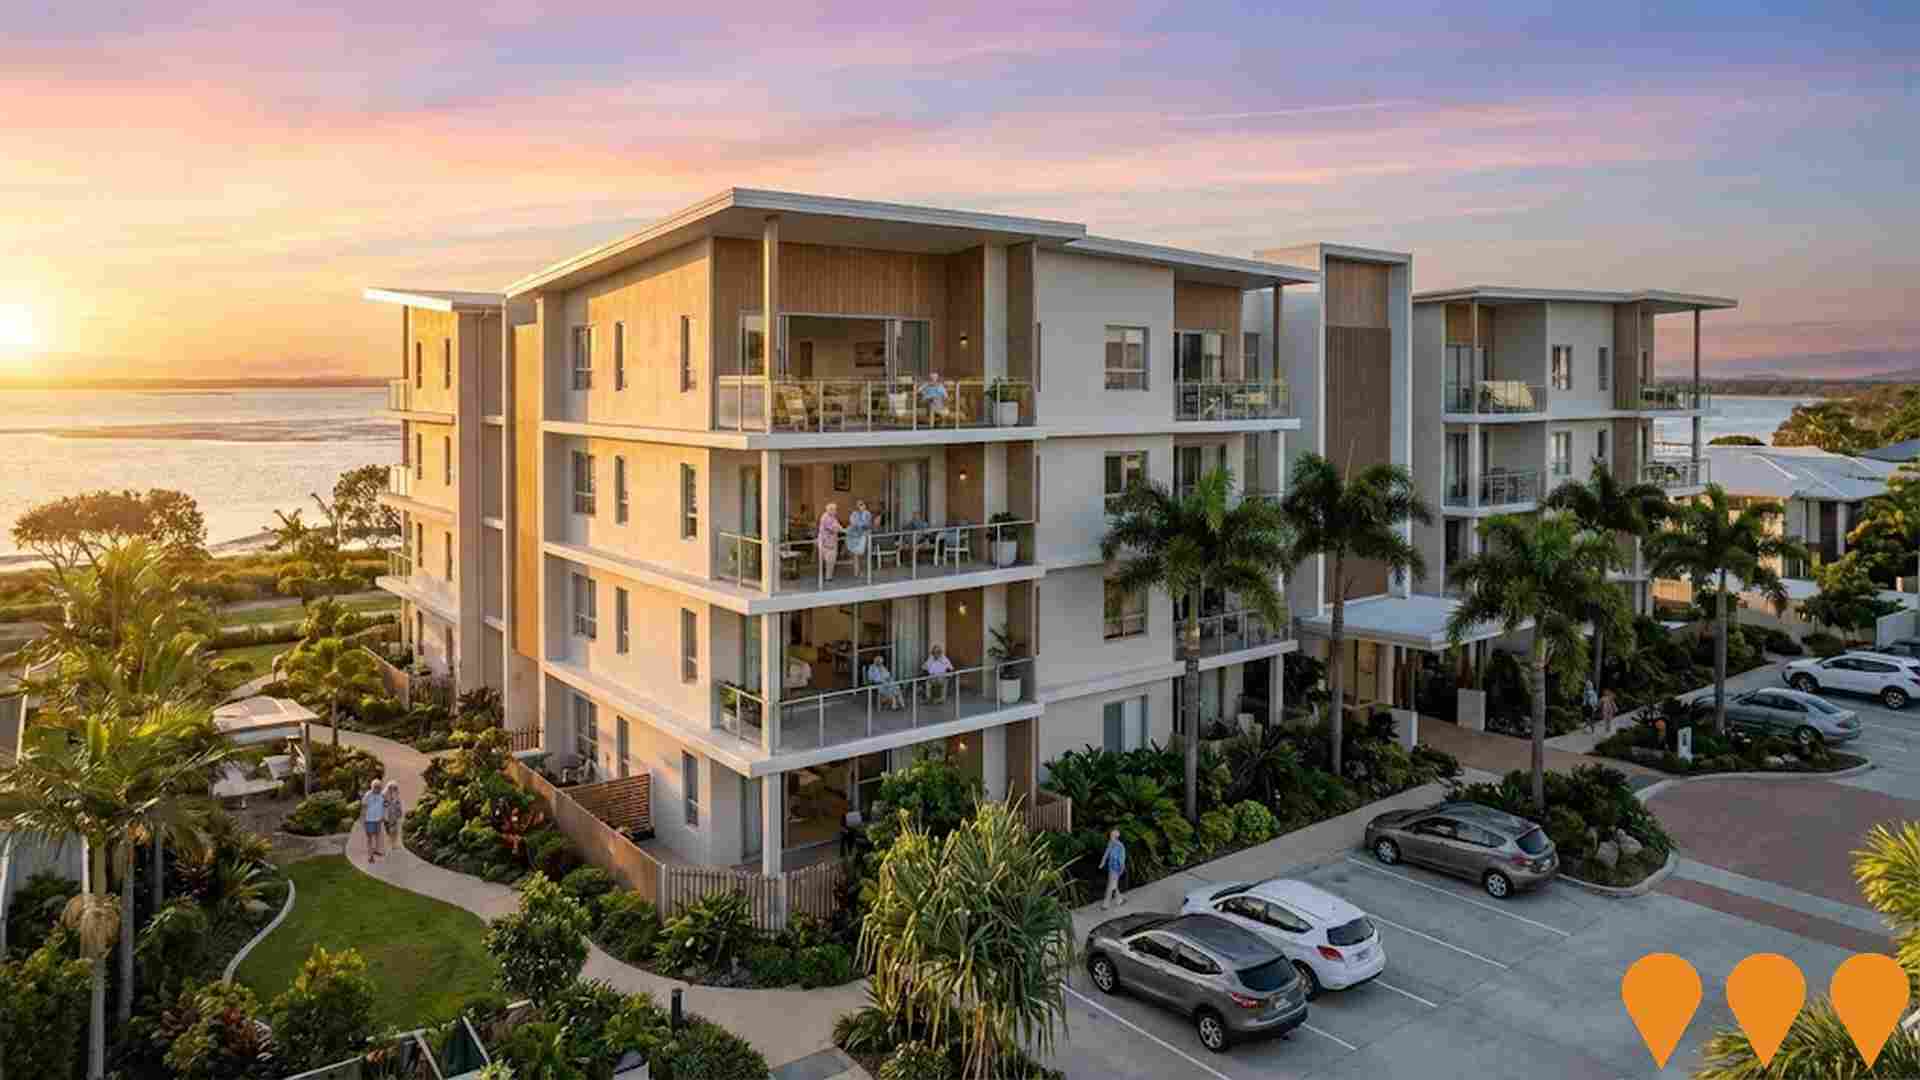
Changes to local infrastructure significantly impact an area's performance. AreaSearch has identified 15 projects likely affecting the region. Notable initiatives include Sunderland Drive Residential Estate in Pacific Harbour, Bribie Island Retiree Resort at Sundale, redevelopment of Bribie Island Central Coles Precinct, and expansion of Bongaree Village Shopping Centre. The following list details those most relevant.
Professional plan users can use the search below to filter and access additional projects.
INFRASTRUCTURE SEARCH
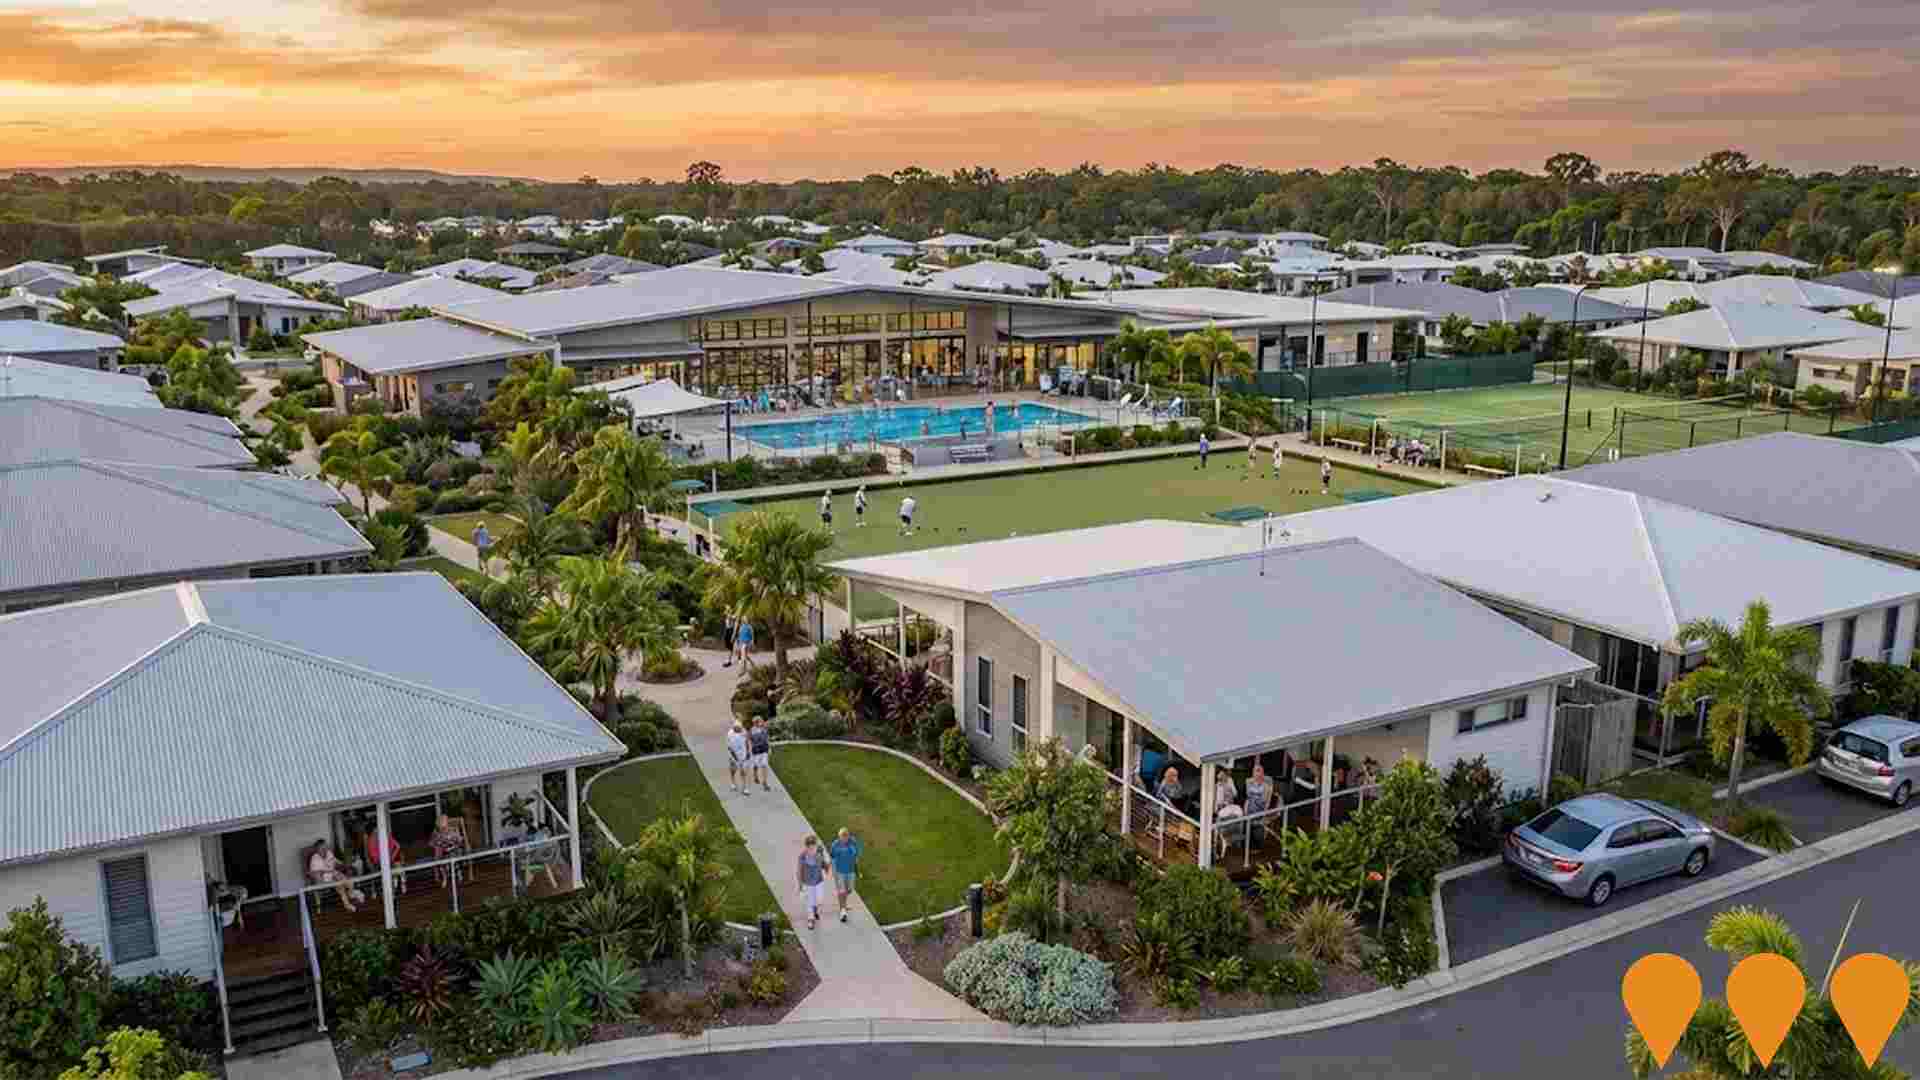
 Denotes AI-based impression for illustrative purposes only, not to be taken as definitive under any circumstances. Please follow links and conduct other investigations from the project's source for actual imagery. Developers and project owners wishing us to use original imagery please Contact Us and we will do so.
Frequently Asked Questions - Infrastructure
Queensland Energy Roadmap 2025
The Queensland Energy Roadmap 2025 is the successor to the Queensland Energy and Jobs Plan. It is a five-year plan for Queensland's energy system, focused on delivering affordable, reliable, and sustainable energy, with a greater emphasis on private sector investment. Key elements include the $1.6 billion Electricity Maintenance Guarantee to keep existing assets reliable, a $400 million investment to drive private-sector development in renewables (solar, hydro) and storage, and a new focus on gas generation (at least 2.6 GW by 2035) for system reliability. The plan formally repeals the previous renewable energy targets while maintaining a net-zero by 2050 commitment. It also continues major transmission projects like CopperString's Eastern Link. The associated Energy Roadmap Amendment Bill 2025 is currently before Parliament.

Stockland Aura
A $5.3 billion master-planned community (also known as Caloundra South Priority Development Area) being developed over 30 years. The project spans 2,400 hectares and will feature 20,000 dwellings housing approximately 50,000 residents upon completion. It includes four suburbs (Baringa, Nirimba, Banya, and Gagalba), a major city centre, district and neighbourhood centres, 20 schools/learning centres, and 200km of cycleways. As of 2025, it is home to over 14,000 residents.

Queensland Energy and Jobs Plan - South East Queensland
The Queensland Energy and Jobs Plan (QEJP) is the state's 30-year roadmap to deliver a publicly-owned renewable energy future for Queensland. In South East Queensland the plan drives new renewable generation zones, large-scale long-duration storage (including the flagship 2,000 MW / 24 GWh Borumba Pumped Hydro Project), and the CopperString 2032 and SuperGrid transmission programs led by Powerlink. As of December 2025, the Borumba Pumped Hydro EIS is in public exhibition (closing early 2026), multiple Renewable Energy Zones are designated, and the first SuperGrid projects are in SEQ are in detailed planning and early procurement. The plan is legislated under the Energy (Renewable Transformation and Jobs) Act 2024.
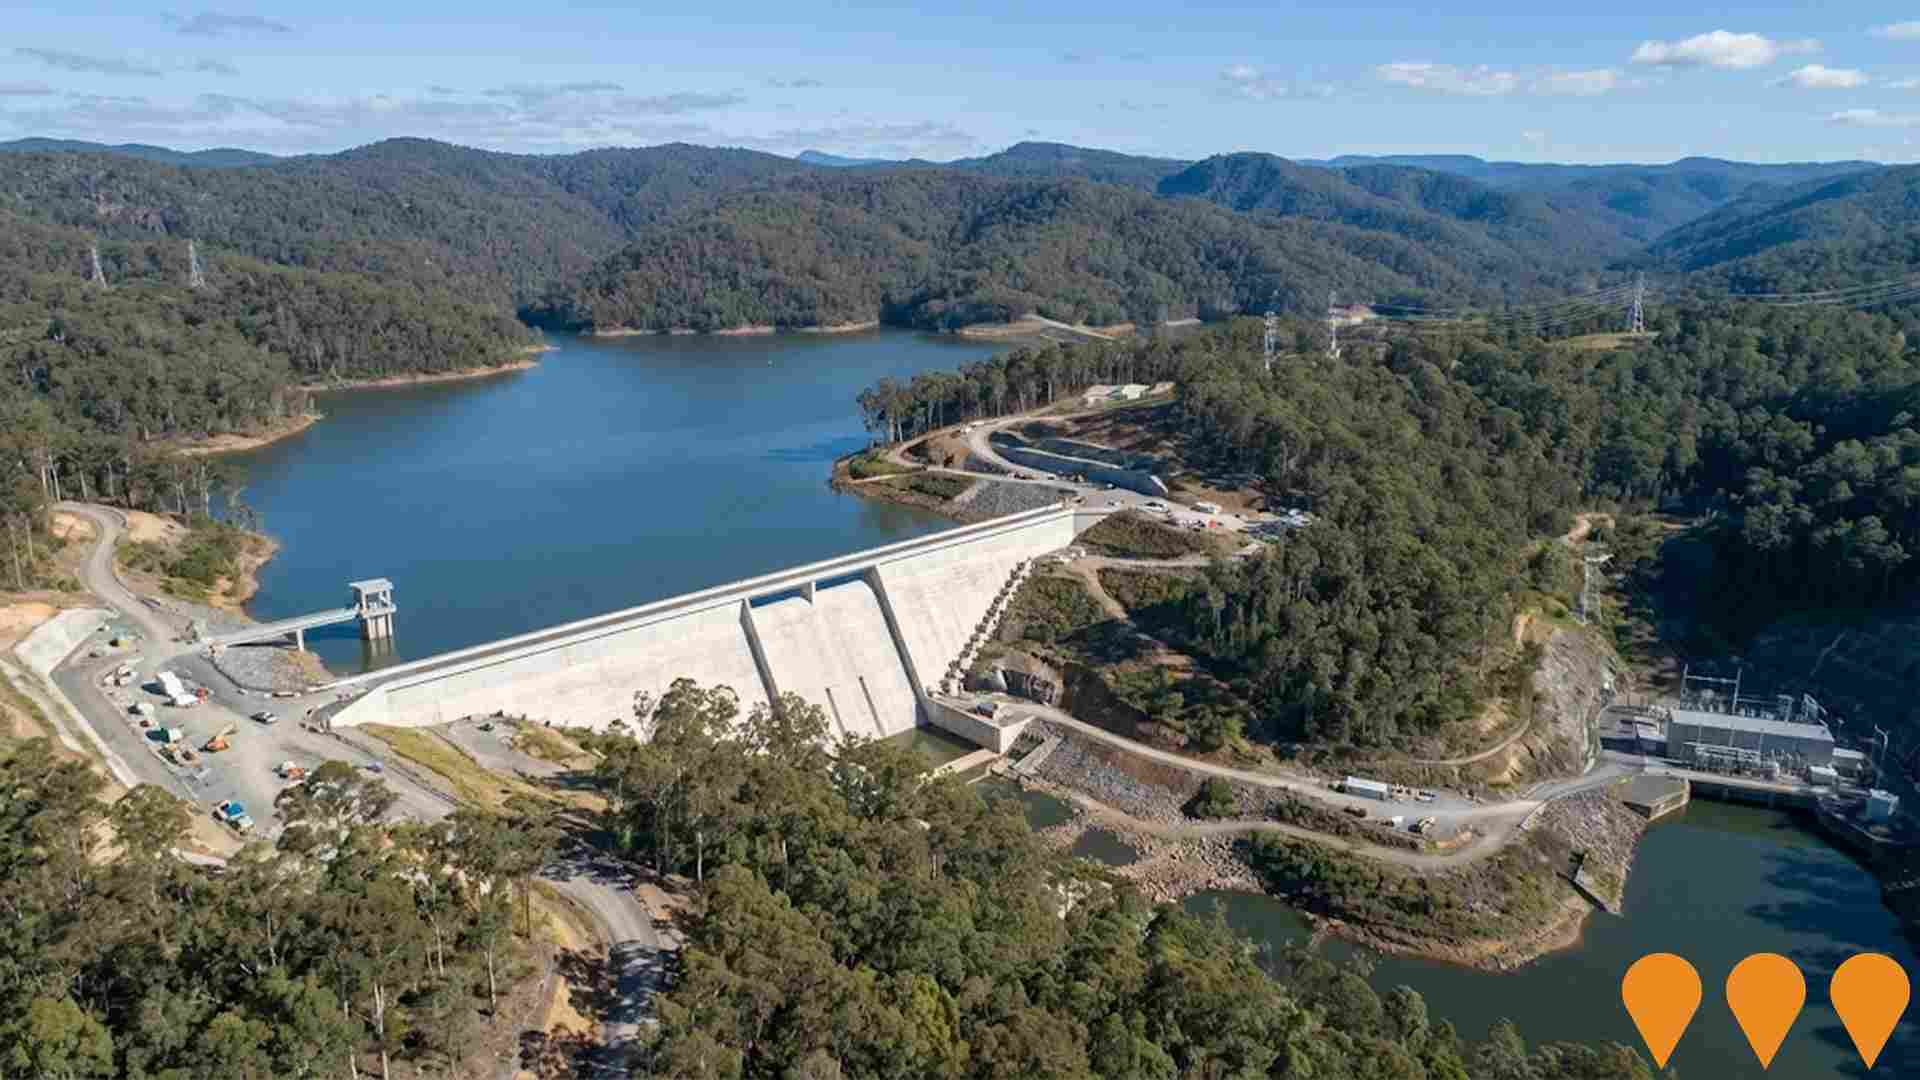
Bribie Island Central Coles Precinct Redevelopment
Proposed expansion and refresh of the existing Bribie Island Central (formerly Bribie Island Shopping Centre) neighbourhood centre. The project, which is anchored by Coles, includes additional specialty retail, medical and a potential small-format supermarket. Development Application DA-2023-380/A was lodged with Moreton Bay Regional Council.
Moreton Bay Rail Link Stage 2
Proposed extension of the Redcliffe Peninsula Line (formerly Moreton Bay Rail Link) from Kippa-Ring to Bribie Island. While the first stage to Kippa-Ring was completed in 2016, this extension remains a long-term strategic proposal to connect Sandstone Point and Bribie Island to the SEQ rail network. Current Queensland Government priorities in the corridor focus on the $700 million duplication of the Bribie Island Road Bridge and upgrades to Caboolture-Bribie Island Road to improve immediate transport capacity.
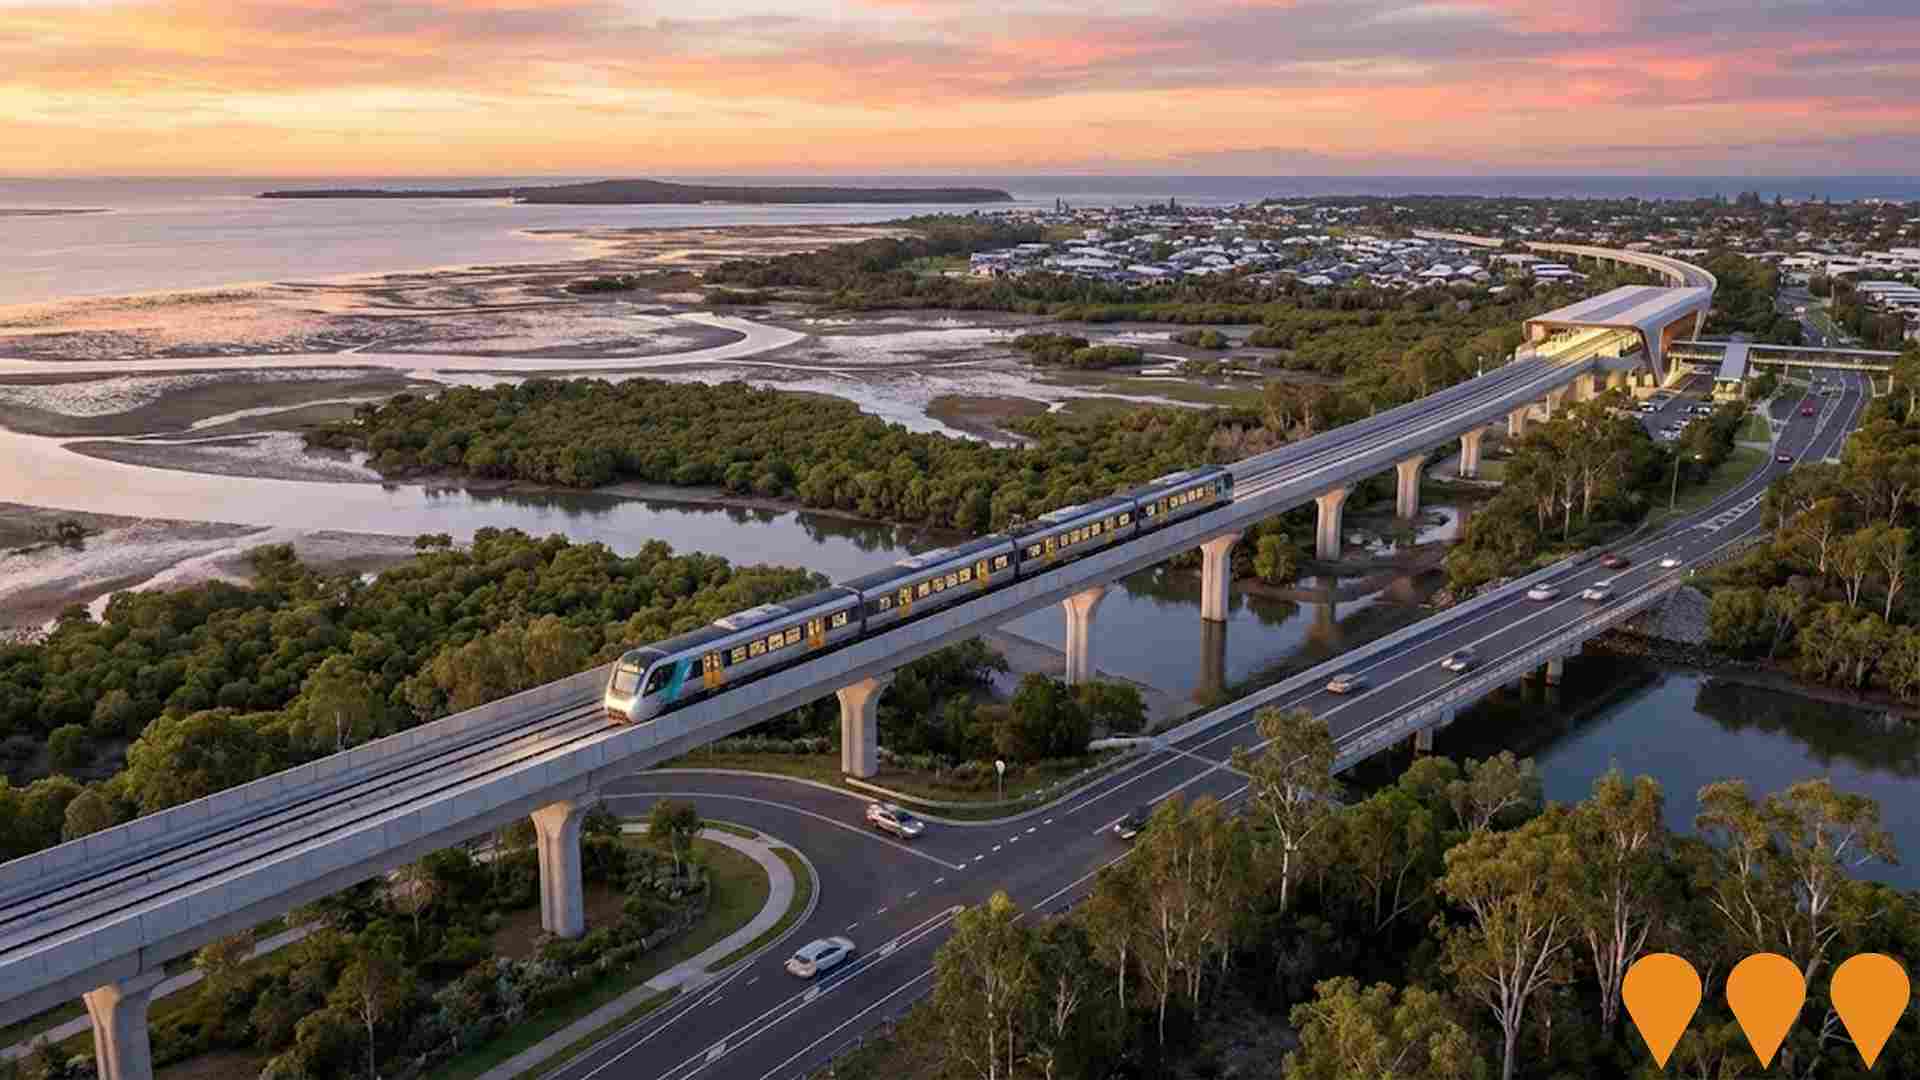
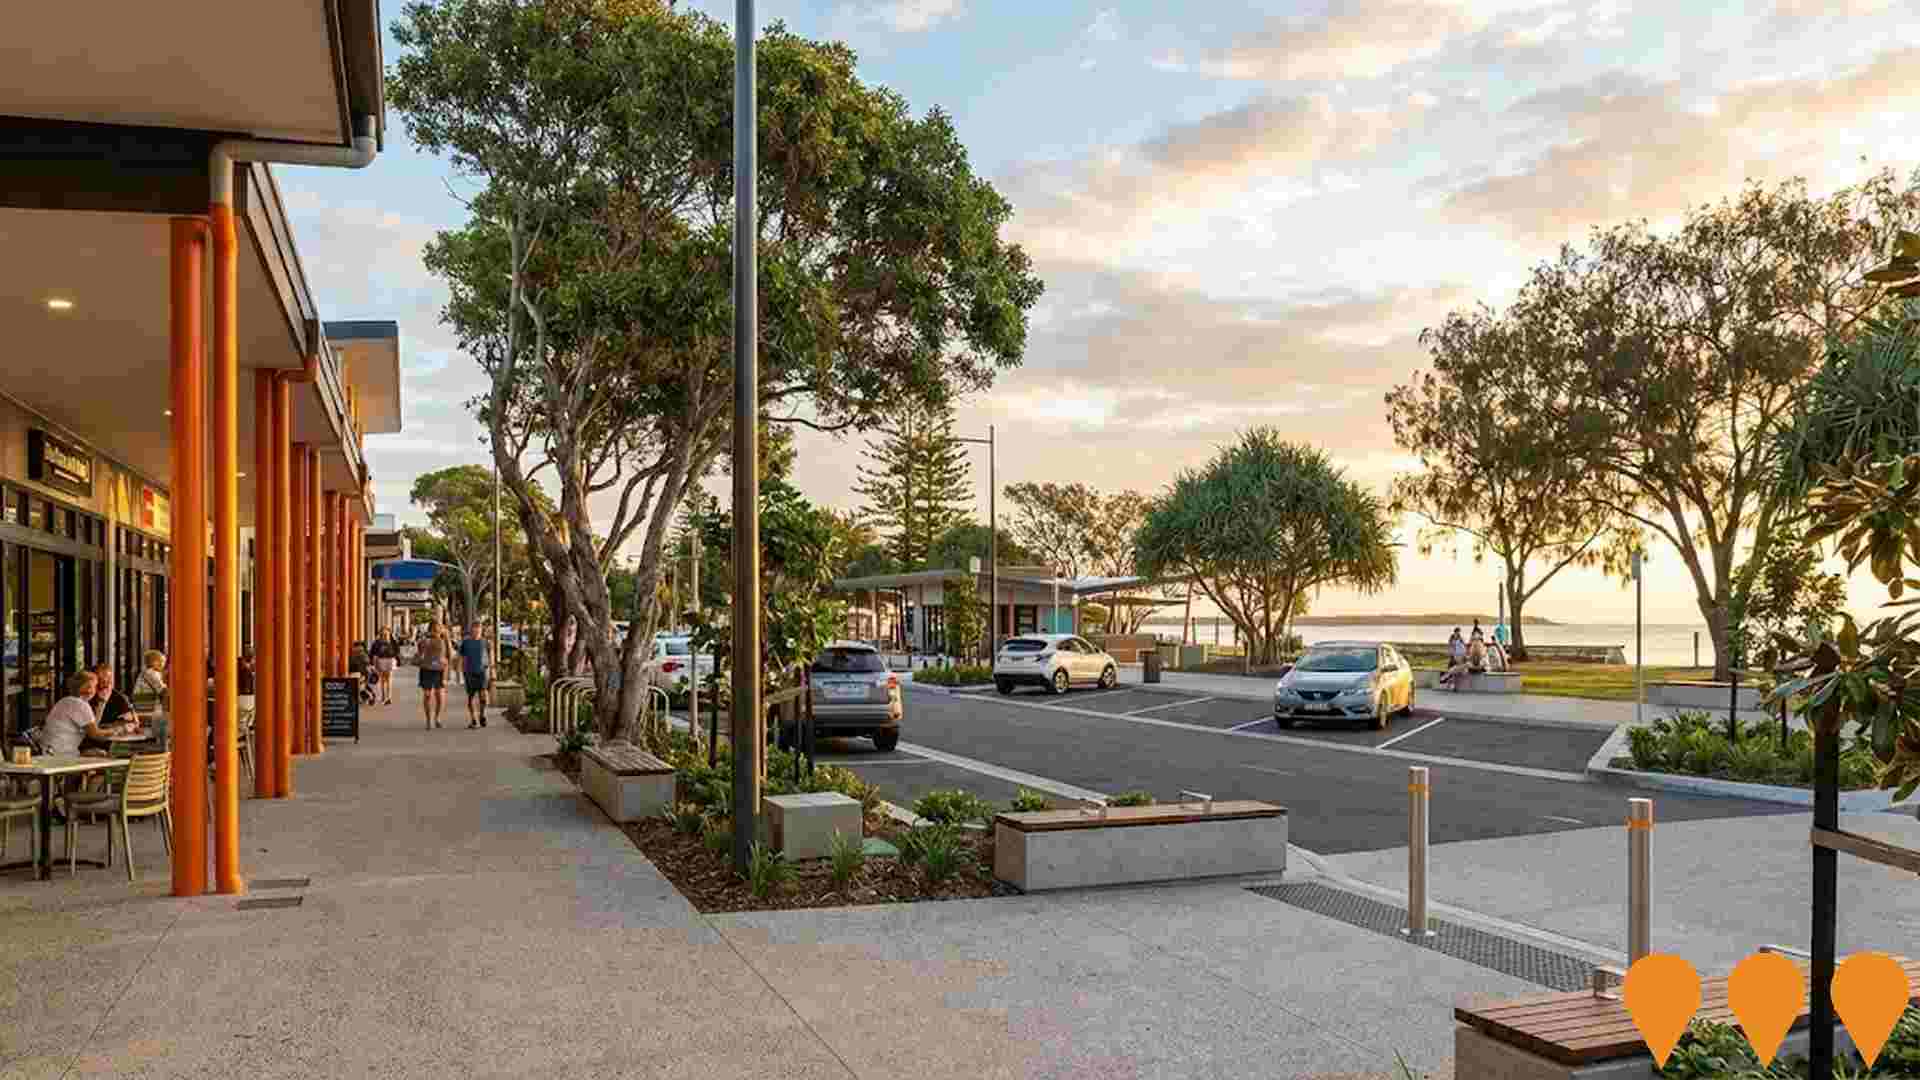
Bongaree Village Shopping Centre Expansion
Council led upgrade and expansion of the Bongaree Village Shopping Precinct on Bribie Island, delivering additional small format retail tenancies, upgraded streetscape and public realm, improved pedestrian links and foreshore connections, and reconfigured parking as part of the Bongaree Village master plan and wider investment in the City of Moreton Bay coastal villages.
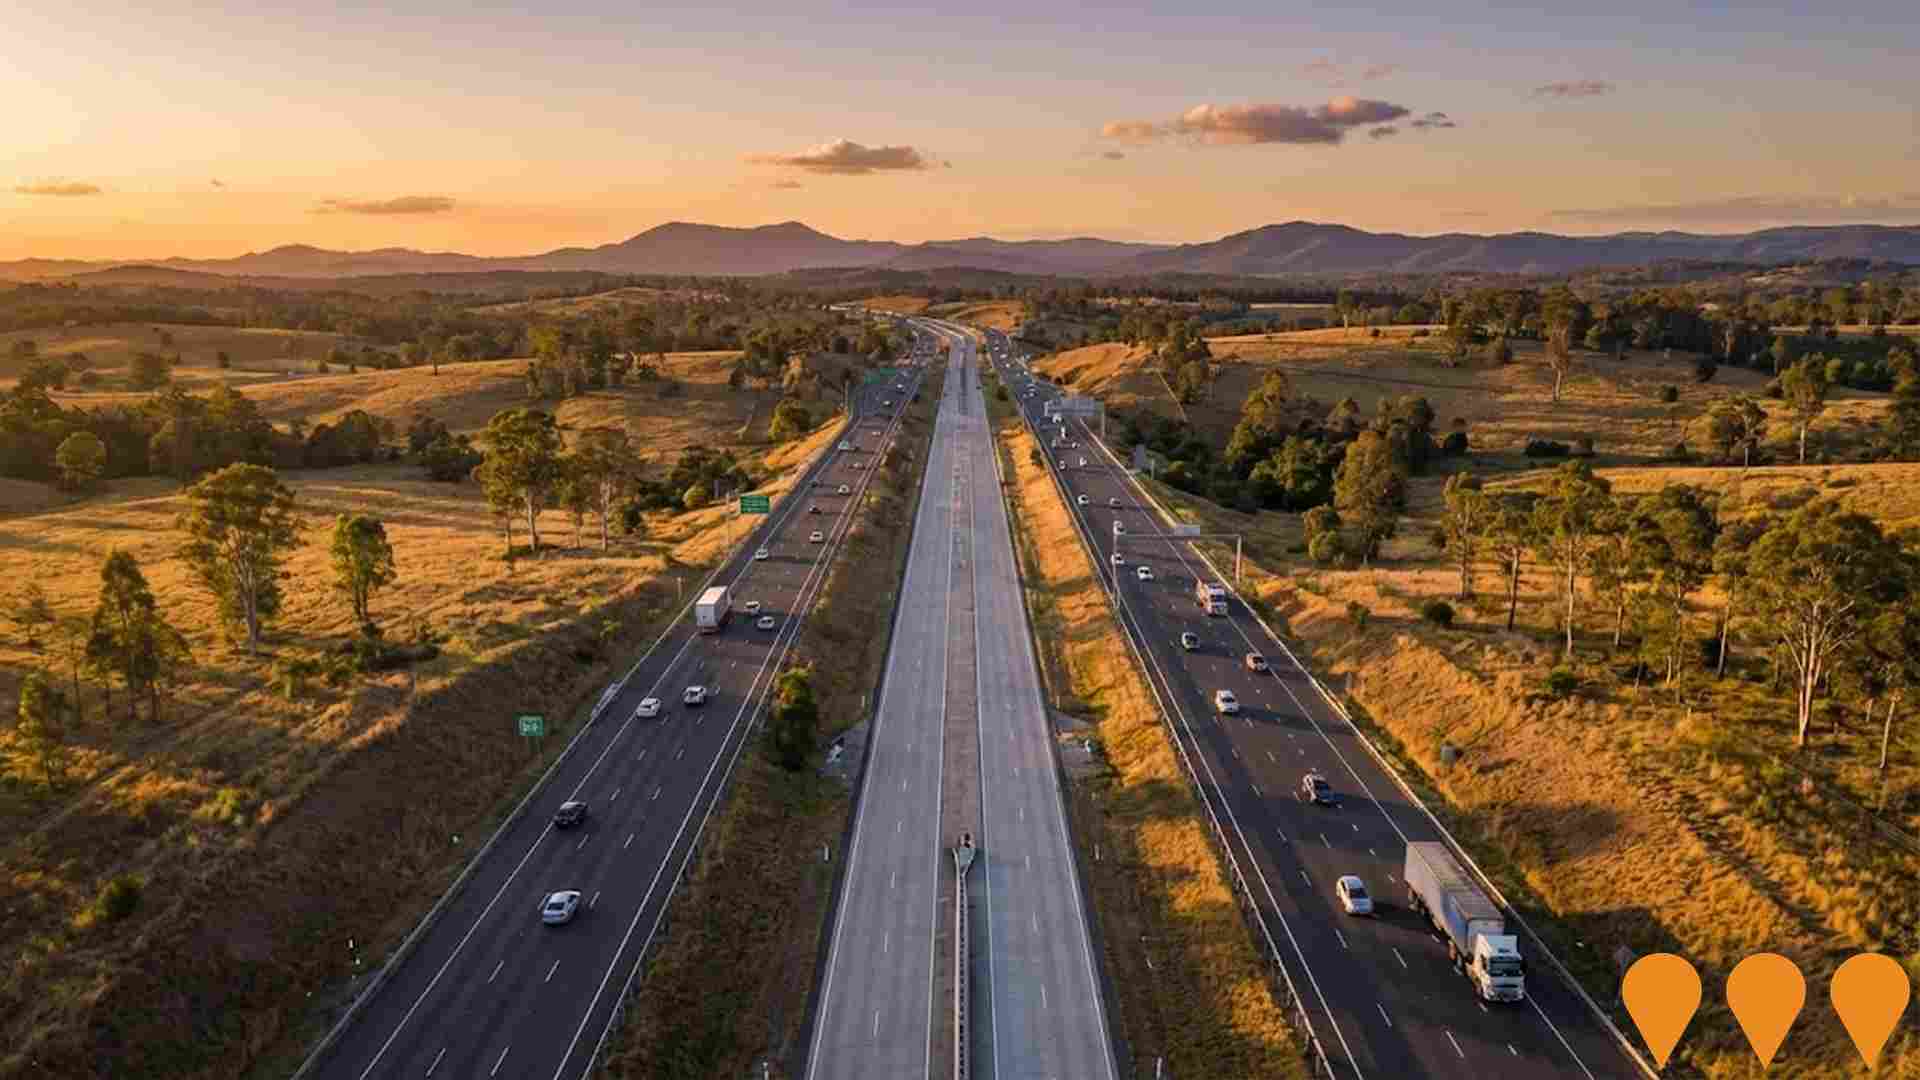
North Brisbane Bruce Highway Western Alternative (Moreton Motorway)
Queensland Department of Transport and Main Roads (TMR) is progressing planning and corridor protection for the ~50-60 km future Moreton Motorway, a new transport corridor west of the Bruce Highway between Beerburrum and Bald Hills. The project will relieve congestion and support growth in Moreton Bay and north Brisbane. Stages 1 (Moodlu to Moorina) and 2 (Moorina to Narangba) are protected as future state-controlled road. Stage 3 (Narangba to Bald Hills) is in early planning. Stage 4 (Beerburrum to Moodlu) community consultation closed 2 June 2025 ahead of corridor protection expected later in 2025. Construction is more than a decade away and subject to future funding.
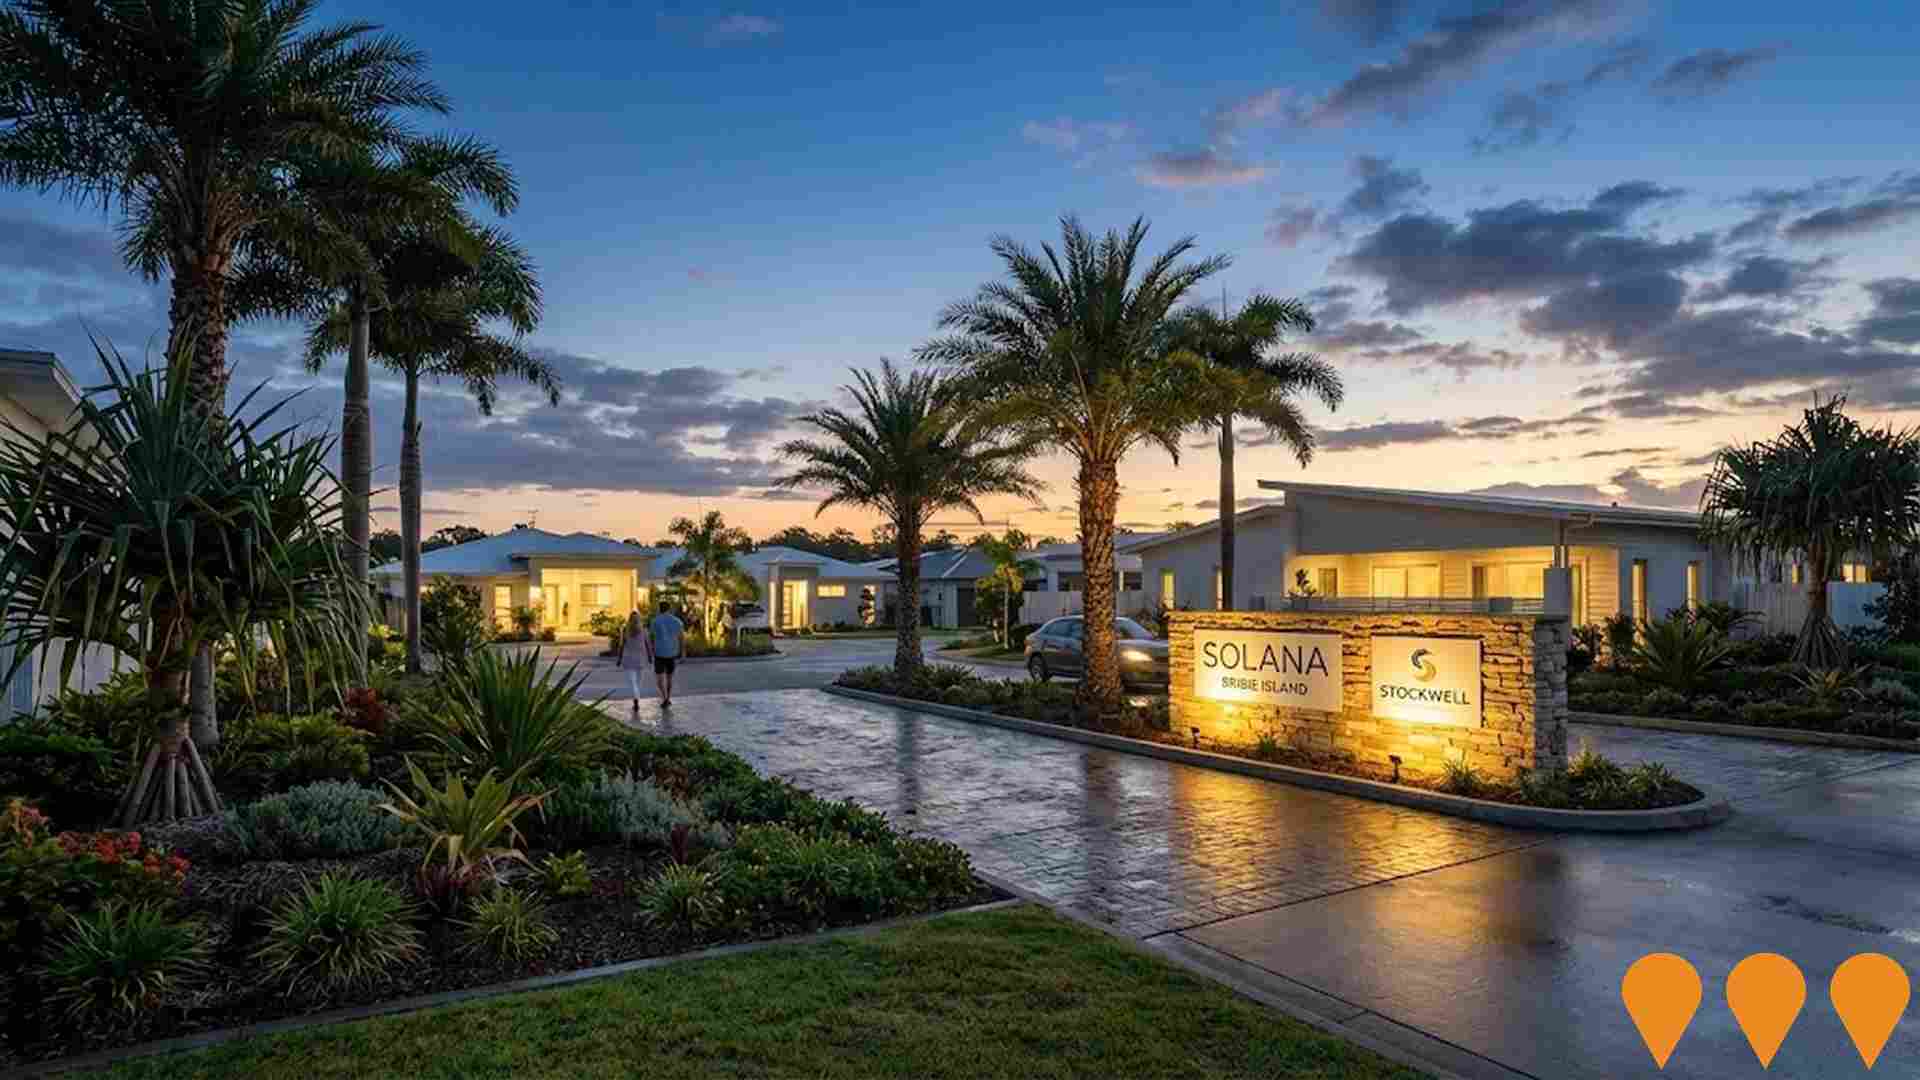
Solana Bribie Island Lifestyle Resort
Large-scale over-50s land lease community with 320 independent living units, a Livewell Centre featuring a clubhouse, indoor and outdoor pools, bowling green, and other resort facilities. The resort is fully tenanted and homes are sold out, with resales only.
Employment
AreaSearch analysis indicates Bribie Island maintains employment conditions that align with national benchmarks
Bribie Island's workforce is balanced across white and blue collar jobs with diverse sector representation. The unemployment rate was 3.6% in the past year, showing an 8.5% employment growth.
As of September 2025, 7,365 residents are employed, with an unemployment rate of 0.3% below Greater Brisbane's rate of 4.0%. Workforce participation is significantly lower at 34.5%, compared to Greater Brisbane's 64.5%. Leading industries include health care & social assistance, construction, and retail trade. Construction employment is particularly high, at 1.4 times the regional average.
Professional & technical services employ only 5.7% of local workers, below Greater Brisbane's 8.9%. Employment opportunities locally may be limited, as indicated by the Census working population vs resident population count. Over a 12-month period ending September 2025, employment increased by 8.5%, while labour force grew by 6.0%, reducing unemployment by 2.3 percentage points. In contrast, Greater Brisbane experienced employment growth of 3.8% and labour force growth of 3.3%, with a 0.5 percentage point drop in unemployment. State-level data to 25-Nov-25 shows Queensland employment contracted by 0.01%, losing 1,210 jobs, with the state unemployment rate at 4.2%. National employment forecasts from May-25 project national growth of 6.6% over five years and 13.7% over ten years. Applying these projections to Bribie Island's employment mix suggests local employment should increase by 6.5% over five years and 13.5% over ten years, assuming constant population projections for illustrative purposes.
Frequently Asked Questions - Employment
Income
Income metrics place the area in the bottom 10% of locations nationally according to AreaSearch analysis
Bribie Island SA2's income level is lower than average nationally according to latest ATO data aggregated by AreaSearch for financial year 2022. The median income among taxpayers in Bribie Island SA2 was $40,505 with an average of $55,358, compared to Greater Brisbane's $55,645 and $70,520 respectively. Based on Wage Price Index growth of 13.99% since financial year 2022, current estimates for Bribie Island SA2 are approximately $46,172 (median) and $63,103 (average) as of September 2025. According to 2021 Census figures, incomes in Bribie Island fall between the 2nd and 5th percentiles nationally for households, families, and individuals. The income band of $400 - 799 captures 33.1% of the community (7,335 individuals), differing from surrounding regions where $1,500 - 2,999 dominates at 33.3%. A significant proportion, 41.5%, earn less than $800 per week, indicating constrained household budgets. Housing affordability pressures are severe with only 83.8% of income remaining, ranking at the 4th percentile nationally.
Frequently Asked Questions - Income
Housing
Bribie Island is characterized by a predominantly suburban housing profile, with above-average rates of outright home ownership
The dwelling structure in Bribie Island, as per the latest Census, consisted of 73.2% houses and 26.8% other dwellings (semi-detached, apartments, 'other' dwellings). In comparison, Brisbane metro had 78.8% houses and 21.2% other dwellings. Home ownership in Bribie Island stood at 56.3%, with mortgaged dwellings at 20.2% and rented ones at 23.6%. The median monthly mortgage repayment was $1,647, aligning with the Brisbane metro average, while the median weekly rent was $335, compared to Brisbane metro's $1,647 and $350 respectively. Nationally, Bribie Island's mortgage repayments were lower than the Australian average of $1,863, with rents substantially below the national figure of $375.
Frequently Asked Questions - Housing
Household Composition
Bribie Island features high concentrations of lone person households, with a lower-than-average median household size
Family households account for 64.9% of all households, including 12.5% that are couples with children, 43.4% that are couples without children, and 8.3% that are single parent families. Non-family households make up the remaining 35.1%, with lone person households at 32.4% and group households comprising 2.7% of the total. The median household size is 2.0 people, which is smaller than the Greater Brisbane average of 2.1.
Frequently Asked Questions - Households
Local Schools & Education
Bribie Island faces educational challenges, with performance metrics placing it in the bottom quartile of areas assessed nationally
The area's university qualification rate is 15.6%, significantly lower than Greater Brisbane's average of 30.5%. Bachelor degrees are the most common at 10.8%, followed by postgraduate qualifications (2.9%) and graduate diplomas (1.9%). Vocational credentials are prominent, with 40.7% of residents aged 15+ holding them - advanced diplomas at 12.0% and certificates at 28.7%. School and university attendance accounts for 17.3% of the community, including 6.3% in secondary education, 6.1% in primary education, and 1.8% pursuing tertiary education.
School and university attendance encompasses 17.3% of the community. This includes 6.3% in secondary education, 6.1% in primary education, and 1.8% pursuing tertiary education.
Frequently Asked Questions - Education
Schools Detail
Nearby Services & Amenities
Transport
Transport servicing is low compared to other areas nationally based on assessment of service frequency, route connectivity and accessibility
Bribie Island has 95 active public transport stops, all of which are bus stops. These stops are served by five different routes that combined offer 858 weekly passenger trips. The island's transport accessibility is considered good, with residents on average living 245 meters from the nearest stop.
Across all routes, buses run an average of 122 trips per day, which translates to approximately nine weekly trips per individual stop.
Frequently Asked Questions - Transport
Transport Stops Detail
Health
Health performance in Bribie Island is a key challenge with a range of health conditions having marked impacts on both younger and older age cohorts
Critical health challenges are evident across Bribie Island, with various health conditions impacting both younger and older age cohorts. The rate of private health cover stands at approximately 48%, covering around 10,548 people (~48% of the total population), which is lower than the national average of 55.3%.
The most prevalent medical conditions in the area are arthritis (affecting 15.4% of residents) and mental health issues (impacting 8.5%). Conversely, 51.0% of residents declare themselves completely clear of medical ailments compared to 52.7% across Greater Brisbane. The population aged 65 and over comprises 50.7%, totaling around 11,242 people, which is higher than the 44.7% in Greater Brisbane. Health outcomes among seniors present some challenges despite performing better than the general population in health metrics.
Frequently Asked Questions - Health
Cultural Diversity
Bribie Island ranks below the Australian average when compared to other local markets across a number of language and cultural background related metrics
Bribie Island's cultural diversity was found to be below average, with 76.7% of its population born in Australia, 89.2% being citizens, and 96.0% speaking English only at home. Christianity is the predominant religion on Bribie Island, comprising 59.2% of people, compared to 56.3% across Greater Brisbane. The top three ancestry groups are English (36.0%), Australian (24.6%), and Irish (9.7%).
Notably, Scottish representation is higher at 9.6%, Welsh is at 0.8%, and German is at 4.9%.
Frequently Asked Questions - Diversity
Age
Bribie Island ranks among the oldest 10% of areas nationwide
The median age in Bribie Island is 64 years, significantly higher than Greater Brisbane's average of 36 years and also substantially exceeding Australia's median age of 38 years. Compared to Greater Brisbane, Bribie Island has a higher proportion of residents aged 65-74 (25.4%) but fewer residents aged 25-34 (3.0%). This concentration of the 65-74 age group is well above the national average of 9.4%. According to post-2021 Census data, the proportion of residents aged 75 to 84 has grown from 16.0% to 19.8%. Conversely, the proportion of residents aged 25 to 34 has declined from 4.5% to 3.0%, and the proportion of those aged 5 to 14 has dropped from 7.1% to 5.7%. Looking ahead to 2041, demographic projections indicate significant shifts in Bribie Island's age structure. The number of residents aged 75 to 84 is projected to increase by 2,164 people (49%), from 4,392 to 6,557. This growth is due entirely to demographic aging, as residents aged 65 and older represent all anticipated population growth. Meanwhile, the projections suggest declines in the populations of those aged 0-4 and 55-64.
