Chart Color Schemes
This analysis uses ABS Statistical Areas Level 2 (SA2) boundaries, which can materially differ from Suburbs and Localities (SAL) even when sharing similar names.
SA2 boundaries are defined by the Australian Bureau of Statistics and are designed to represent communities for statistical reporting (e.g., census and ERP).
Suburbs and Localities (SAL) represent commonly-used suburb/locality names (postal-style areas) and may use different geographic boundaries. For comprehensive analysis, consider reviewing both boundary types if available.
est. as @ -- *
ABS ERP | -- people | --
2021 Census | -- people
Sales Activity
Curious about local property values? Filter the chart to assess the volume and appreciation (including resales) trends and regional comparisons, or scroll to the map below view this information at an individual property level.
Find a Recent Sale
Sales Detail
Population
Population growth drivers in Elimbah are above average based on AreaSearch's ranking of recent, and medium to long-term trends
Elimbah's population was approximately 4,649 as of November 2025. This figure represents an increase of 359 people since the 2021 Census, which recorded a population of 4,290. The increase is inferred from the ABS estimated resident population of 4,606 in June 2024 and 55 validated new addresses since the Census date. This results in a population density of 45 persons per square kilometer. Elimbah's growth rate of 8.4% since the census is close to the national average of 8.9%, indicating strong fundamental growth factors. Interstate migration contributed approximately 55.6% of overall population gains during recent periods, with all drivers including overseas migration and natural growth being positive factors.
AreaSearch uses ABS/Geoscience Australia projections for each SA2 area, released in 2024 with a base year of 2022. For areas not covered by this data and years post-2032, Queensland State Government's SA2 area projections released in 2023 based on 2021 data are adopted, with proportional growth weightings applied for age cohorts. Future population dynamics anticipate a median increase, with Elimbah expected to gain approximately 509 persons by 2041, reflecting a total increase of 10.0% over the 17-year period based on the latest annual ERP population numbers.
Frequently Asked Questions - Population
Development
Recent residential development output has been above average within Elimbah when compared nationally
Elimbah has received approximately 27 dwelling approvals annually over the past five financial years, totalling 139 homes. As of FY-26, 8 approvals have been recorded. On average, 3.1 people have moved to the area each year for every dwelling built between FY-21 and FY-25, indicating significant demand exceeding supply. The average construction cost value for new dwellings is $281,000.
In FY-26, commercial approvals reached $459,000, suggesting a predominantly residential focus. Compared to Greater Brisbane, Elimbah has shown reduced construction activity, with 52.0% fewer approvals per person. This constrained new construction often reinforces demand and pricing for existing homes. The area's building activity is dominated by detached dwellings (89.0%), maintaining its traditional low-density character focused on family homes.
With around 199 people moving to the area for each dwelling approval, Elimbah exhibits characteristics of a growth area. According to AreaSearch's latest quarterly estimate, Elimbah is projected to gain 466 residents by 2041. At current development rates, new housing supply should comfortably meet demand, creating favourable conditions for buyers and potentially supporting population growth beyond current projections.
Frequently Asked Questions - Development
Infrastructure
Elimbah has moderate levels of nearby infrastructure activity, ranking in the 47thth percentile nationally
Changes in local infrastructure significantly impact an area's performance. AreaSearch has identified 25 projects likely to affect the region. Notable initiatives include M1 Industrial Estate, Northern Intermodal Terminal (Elimbah), Bruce Highway Upgrade from Caboolture-Bribie Island Road to Steve Irwin Way (Exit 163), and East Elimbah Estate. The following list details those most relevant.
Professional plan users can use the search below to filter and access additional projects.
INFRASTRUCTURE SEARCH
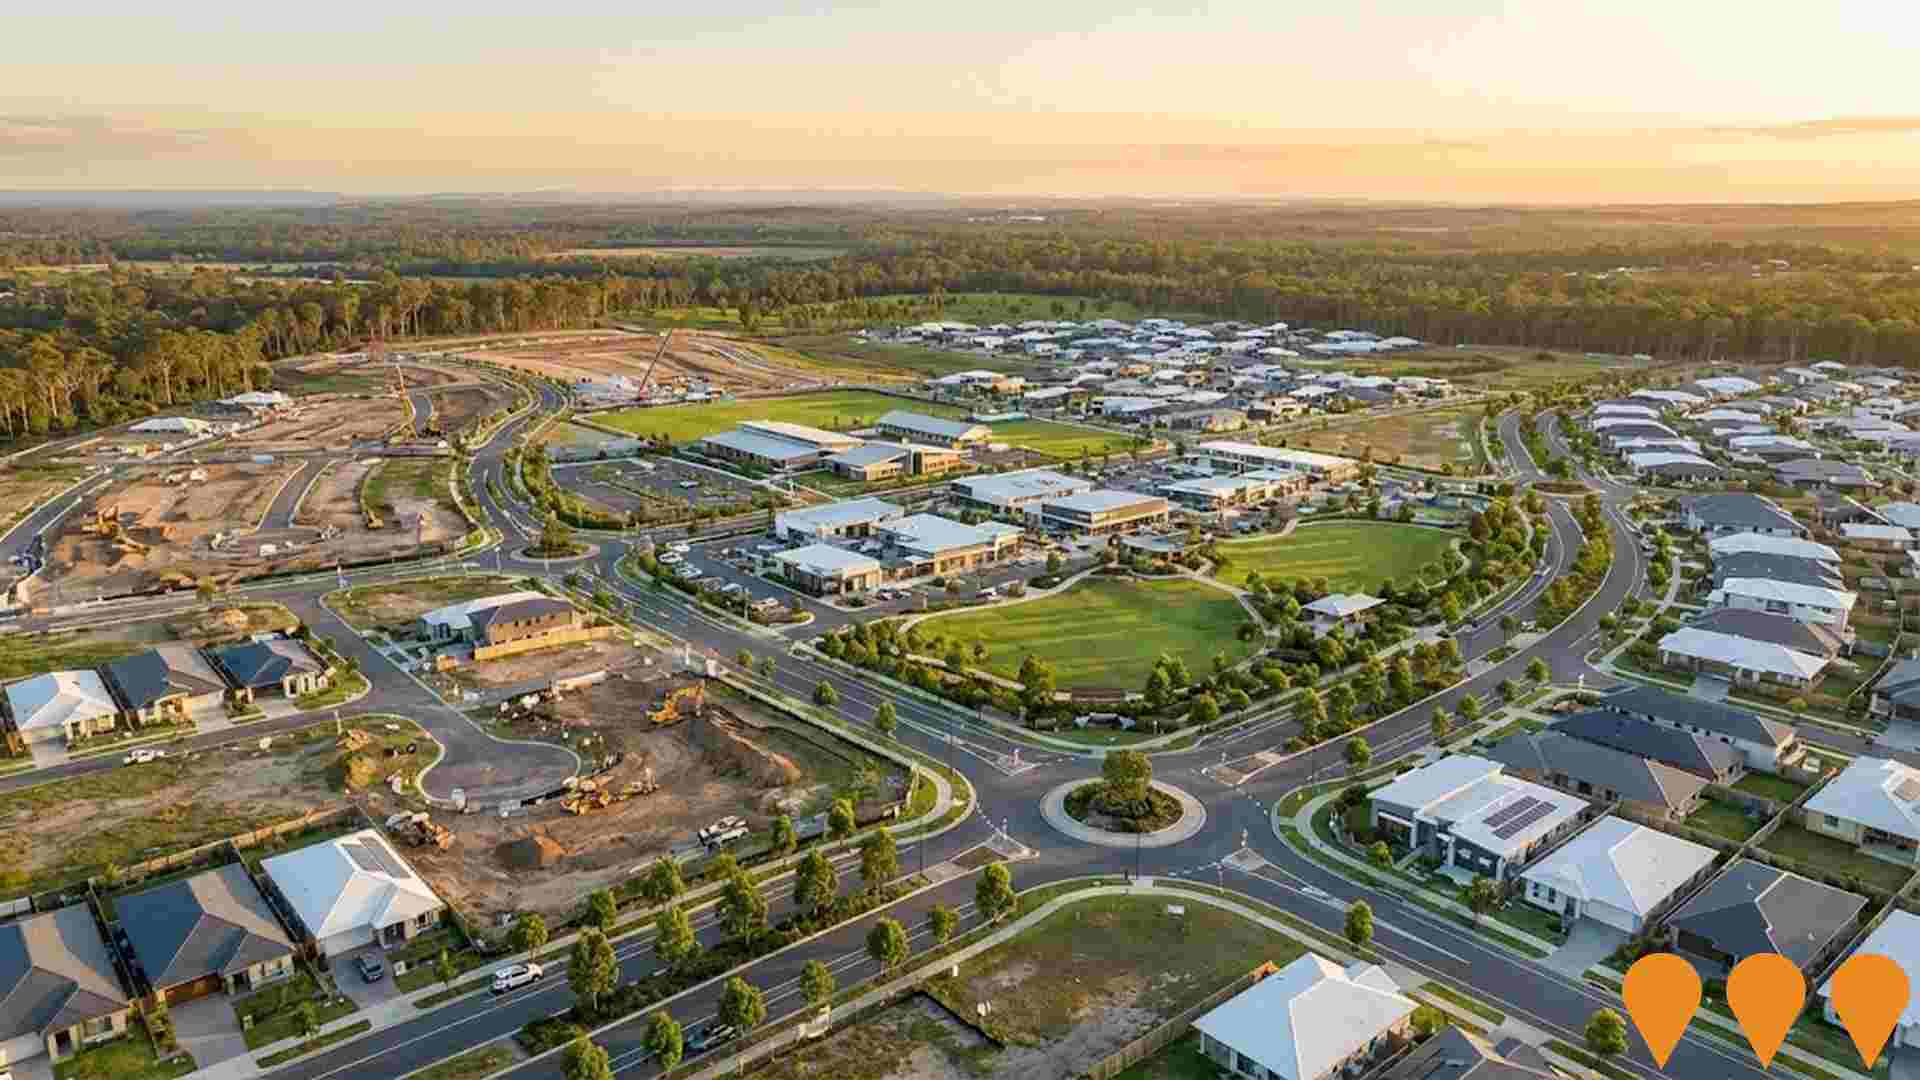
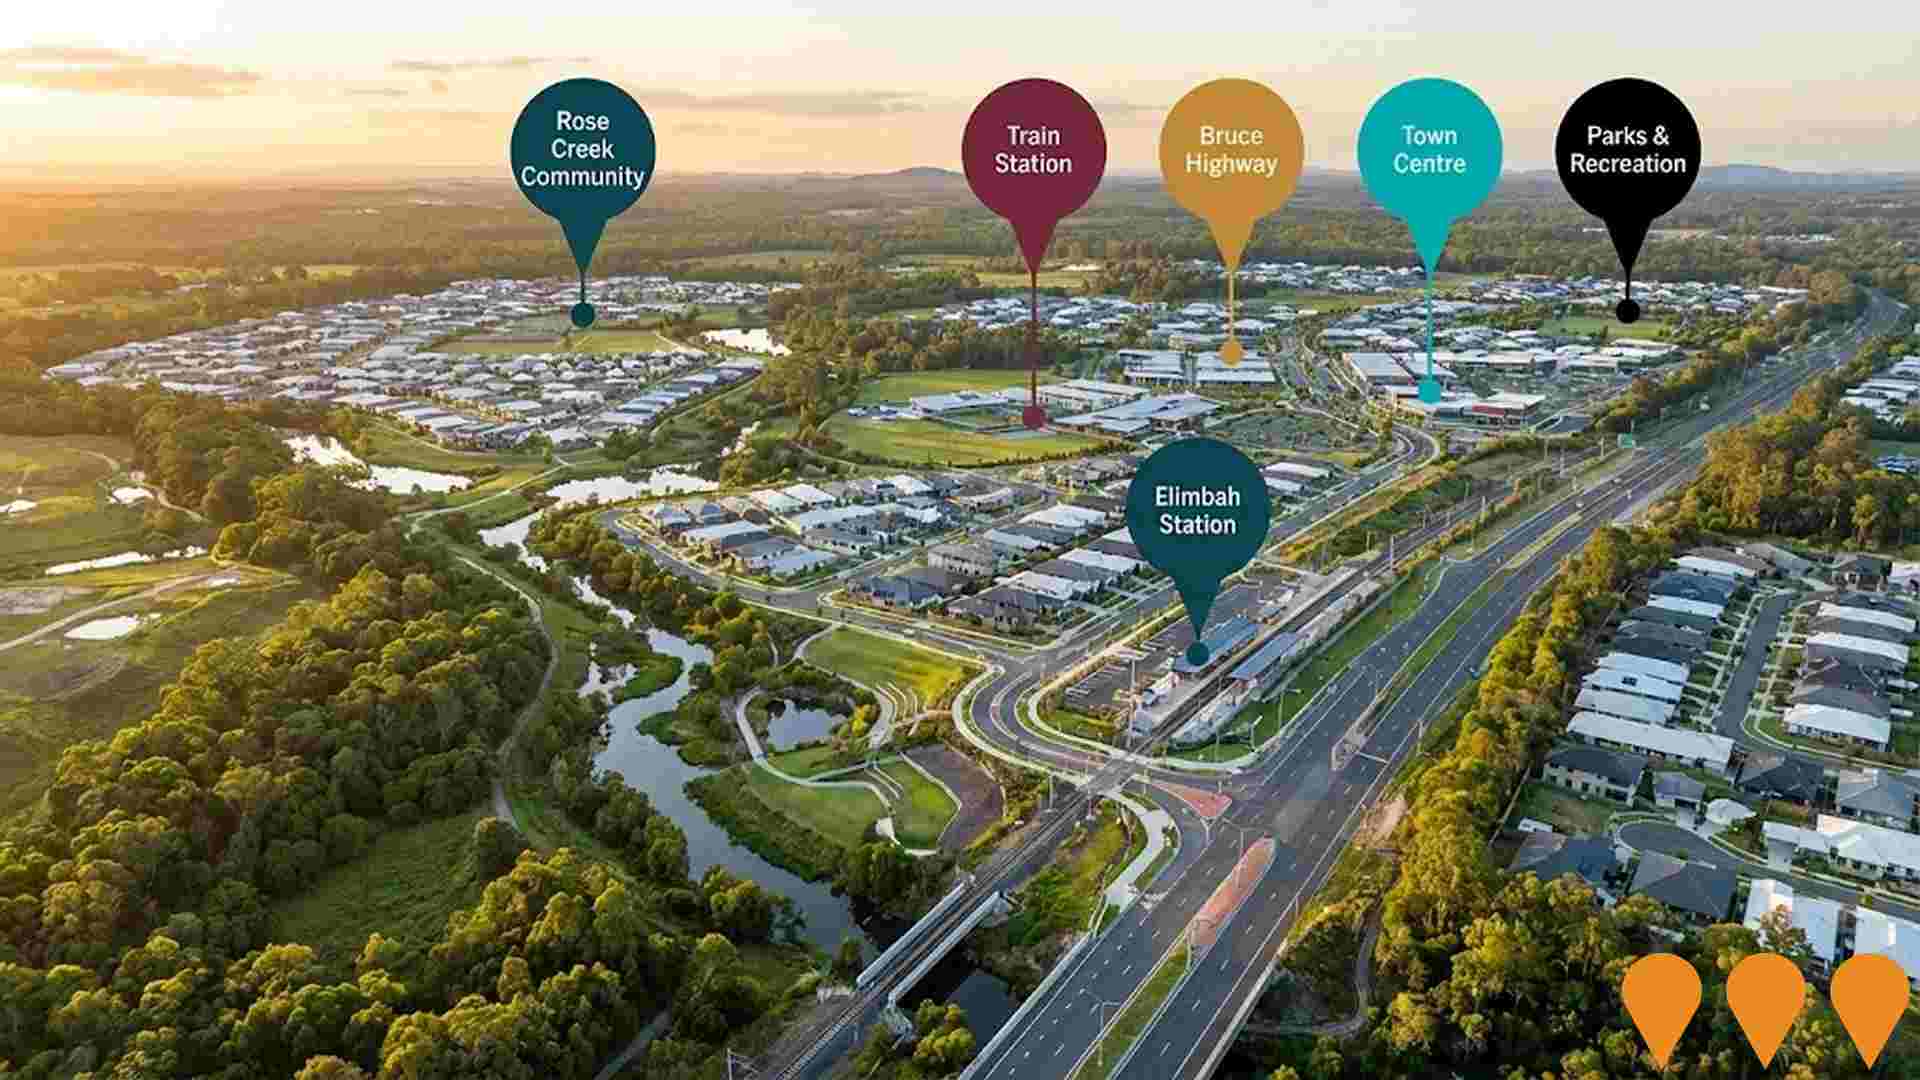
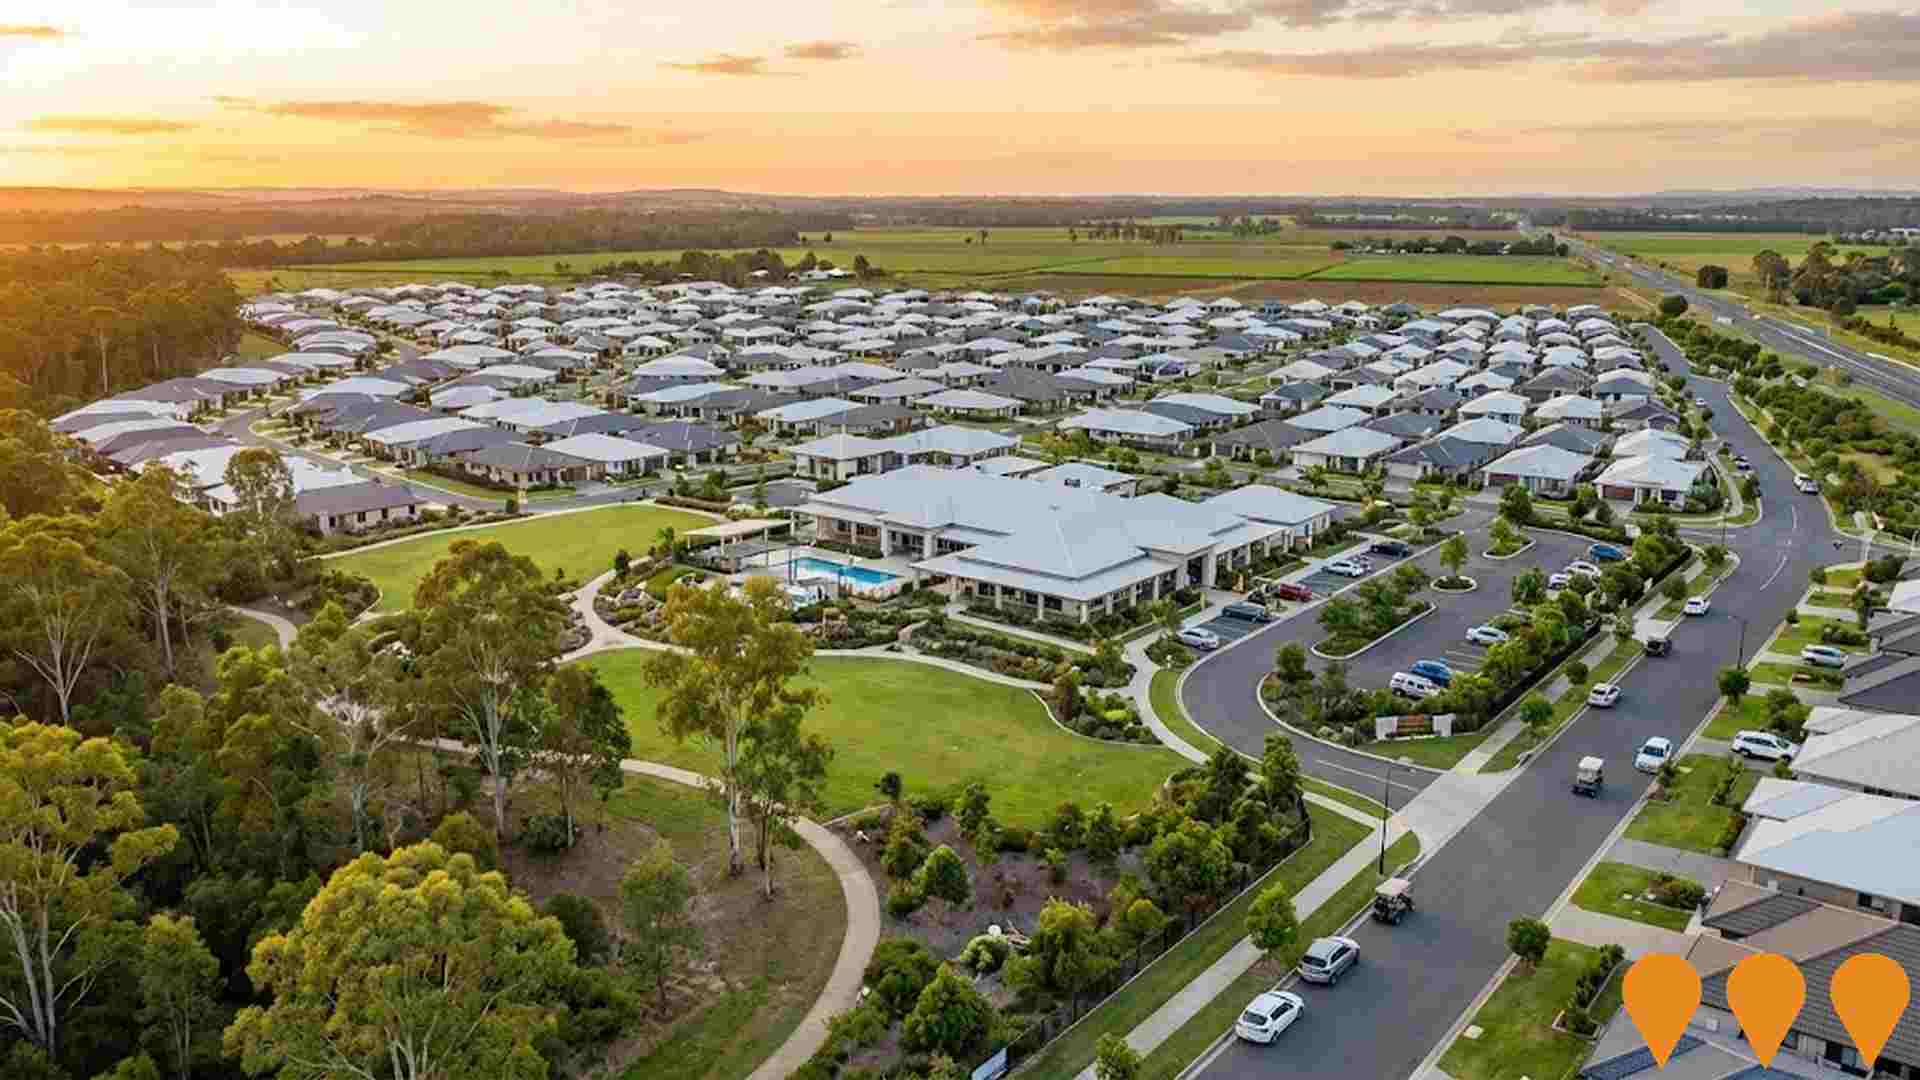
 Denotes AI-based impression for illustrative purposes only, not to be taken as definitive under any circumstances. Please follow links and conduct other investigations from the project's source for actual imagery. Developers and project owners wishing us to use original imagery please Contact Us and we will do so.
Frequently Asked Questions - Infrastructure
Queensland Energy Roadmap 2025
The Queensland Energy Roadmap 2025 is the successor to the Queensland Energy and Jobs Plan. It is a five-year plan for Queensland's energy system, focused on delivering affordable, reliable, and sustainable energy, with a greater emphasis on private sector investment. Key elements include the $1.6 billion Electricity Maintenance Guarantee to keep existing assets reliable, a $400 million investment to drive private-sector development in renewables (solar, hydro) and storage, and a new focus on gas generation (at least 2.6 GW by 2035) for system reliability. The plan formally repeals the previous renewable energy targets while maintaining a net-zero by 2050 commitment. It also continues major transmission projects like CopperString's Eastern Link. The associated Energy Roadmap Amendment Bill 2025 is currently before Parliament.

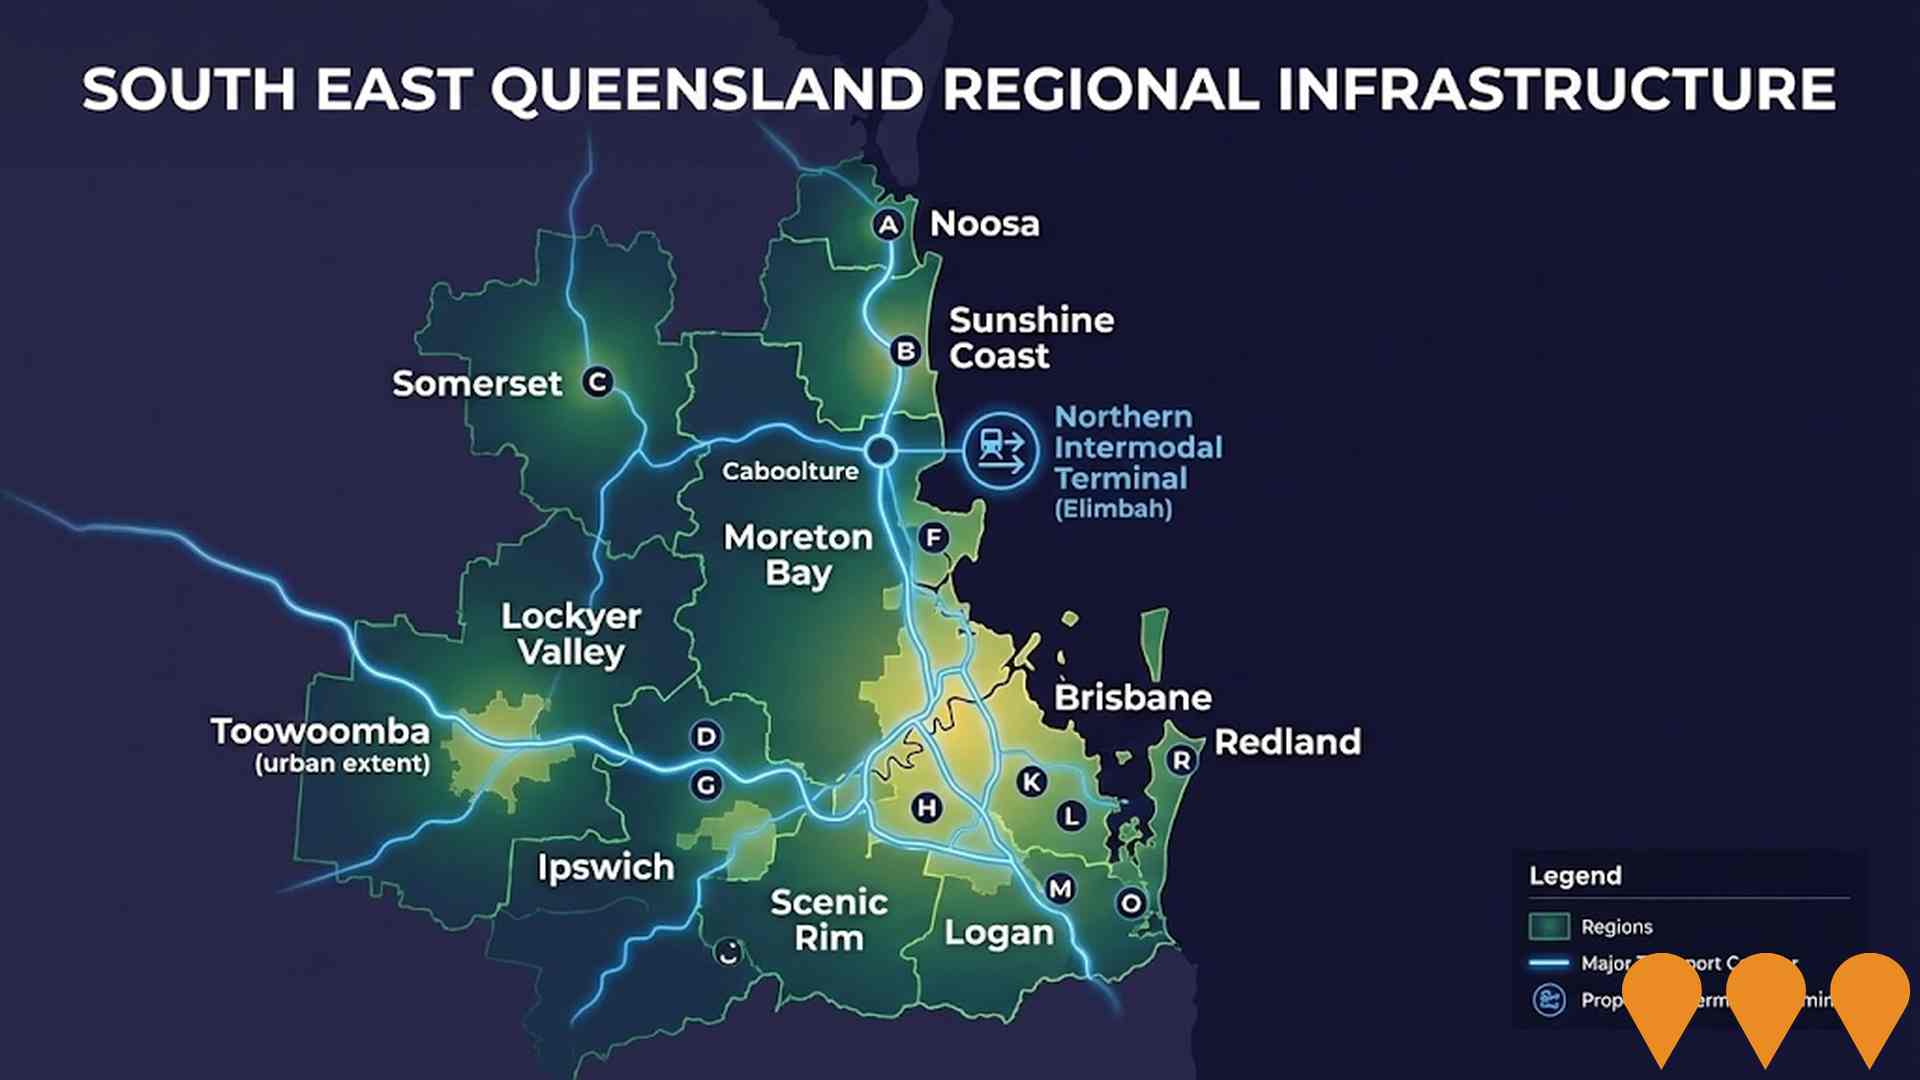
Northern Intermodal Terminal (Elimbah)
The Northern Intermodal Terminal is a proposed major freight hub north of Caboolture near Elimbah, designed to transfer freight between the North Coast Rail Line and road networks. It aims to reduce heavy vehicle movements through Brisbane, support growing freight demand in South East Queensland, and improve supply chain efficiency for regional industries.
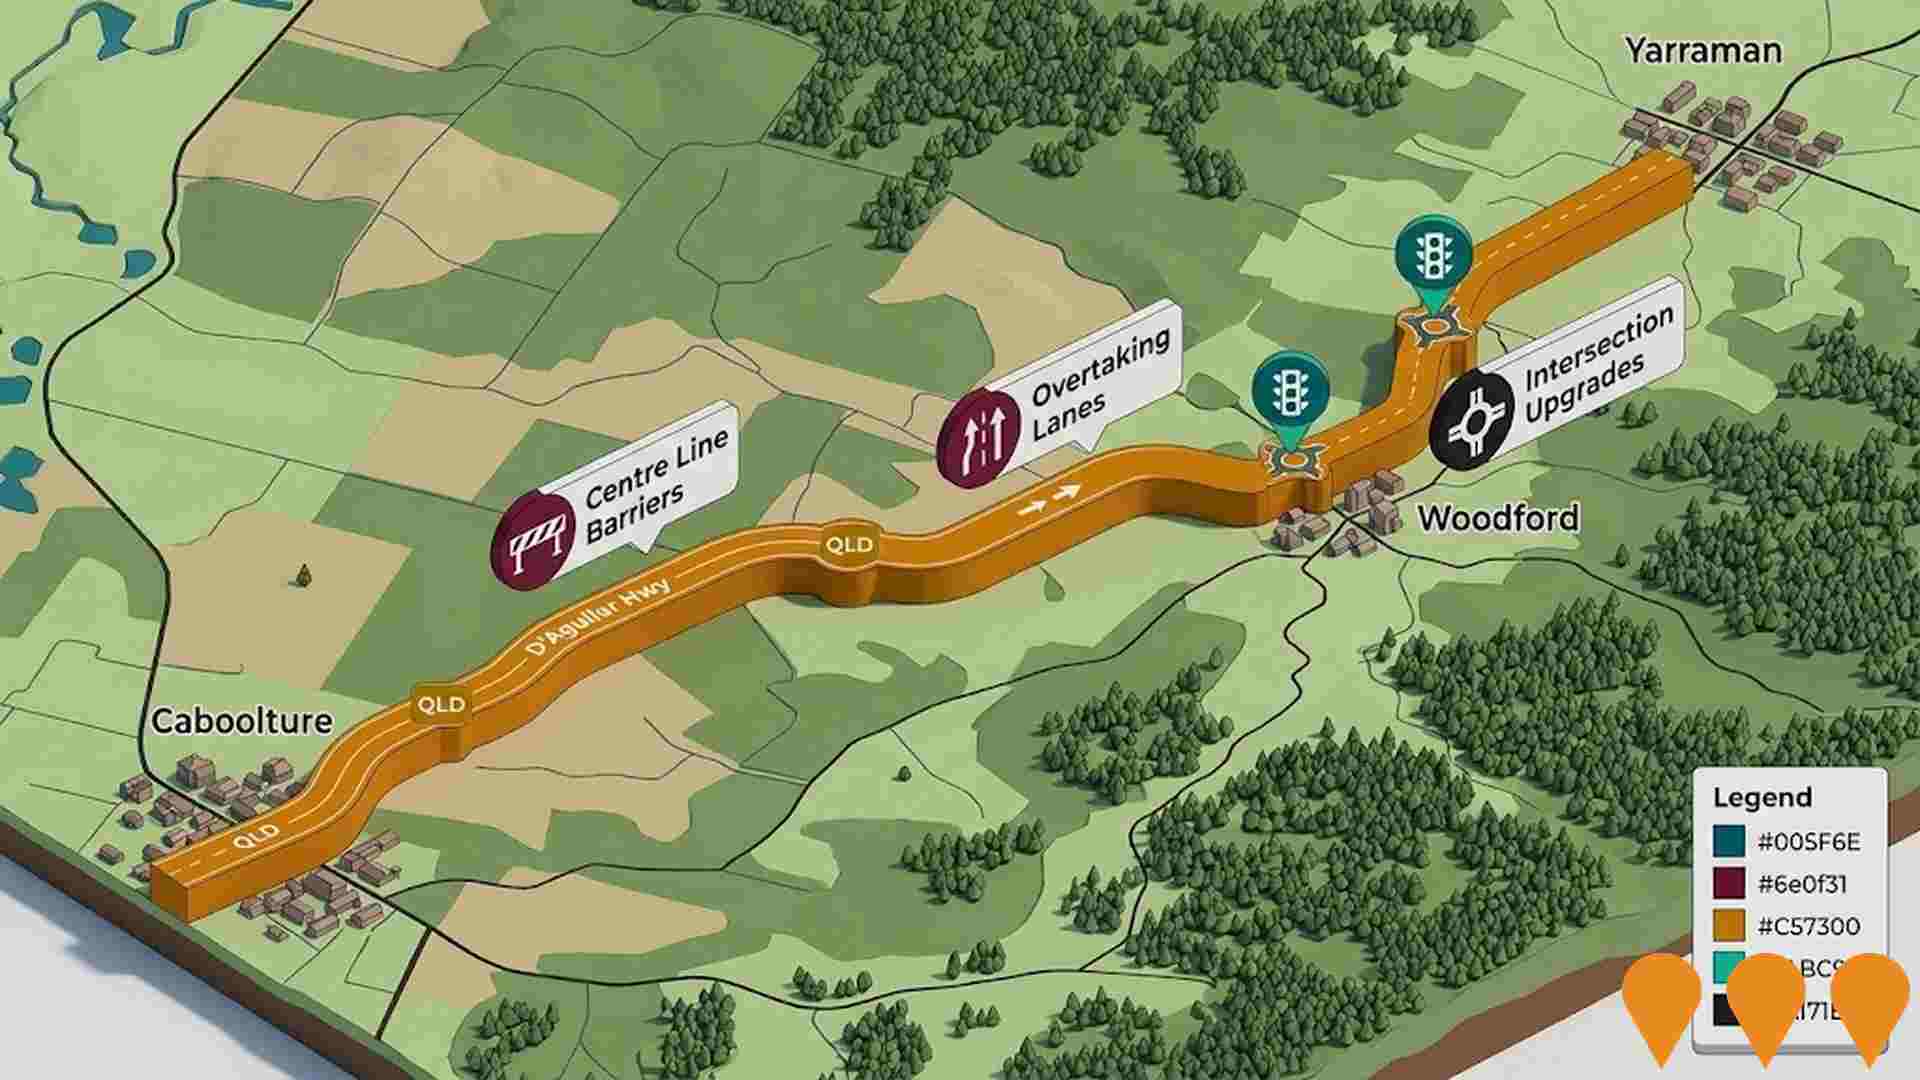
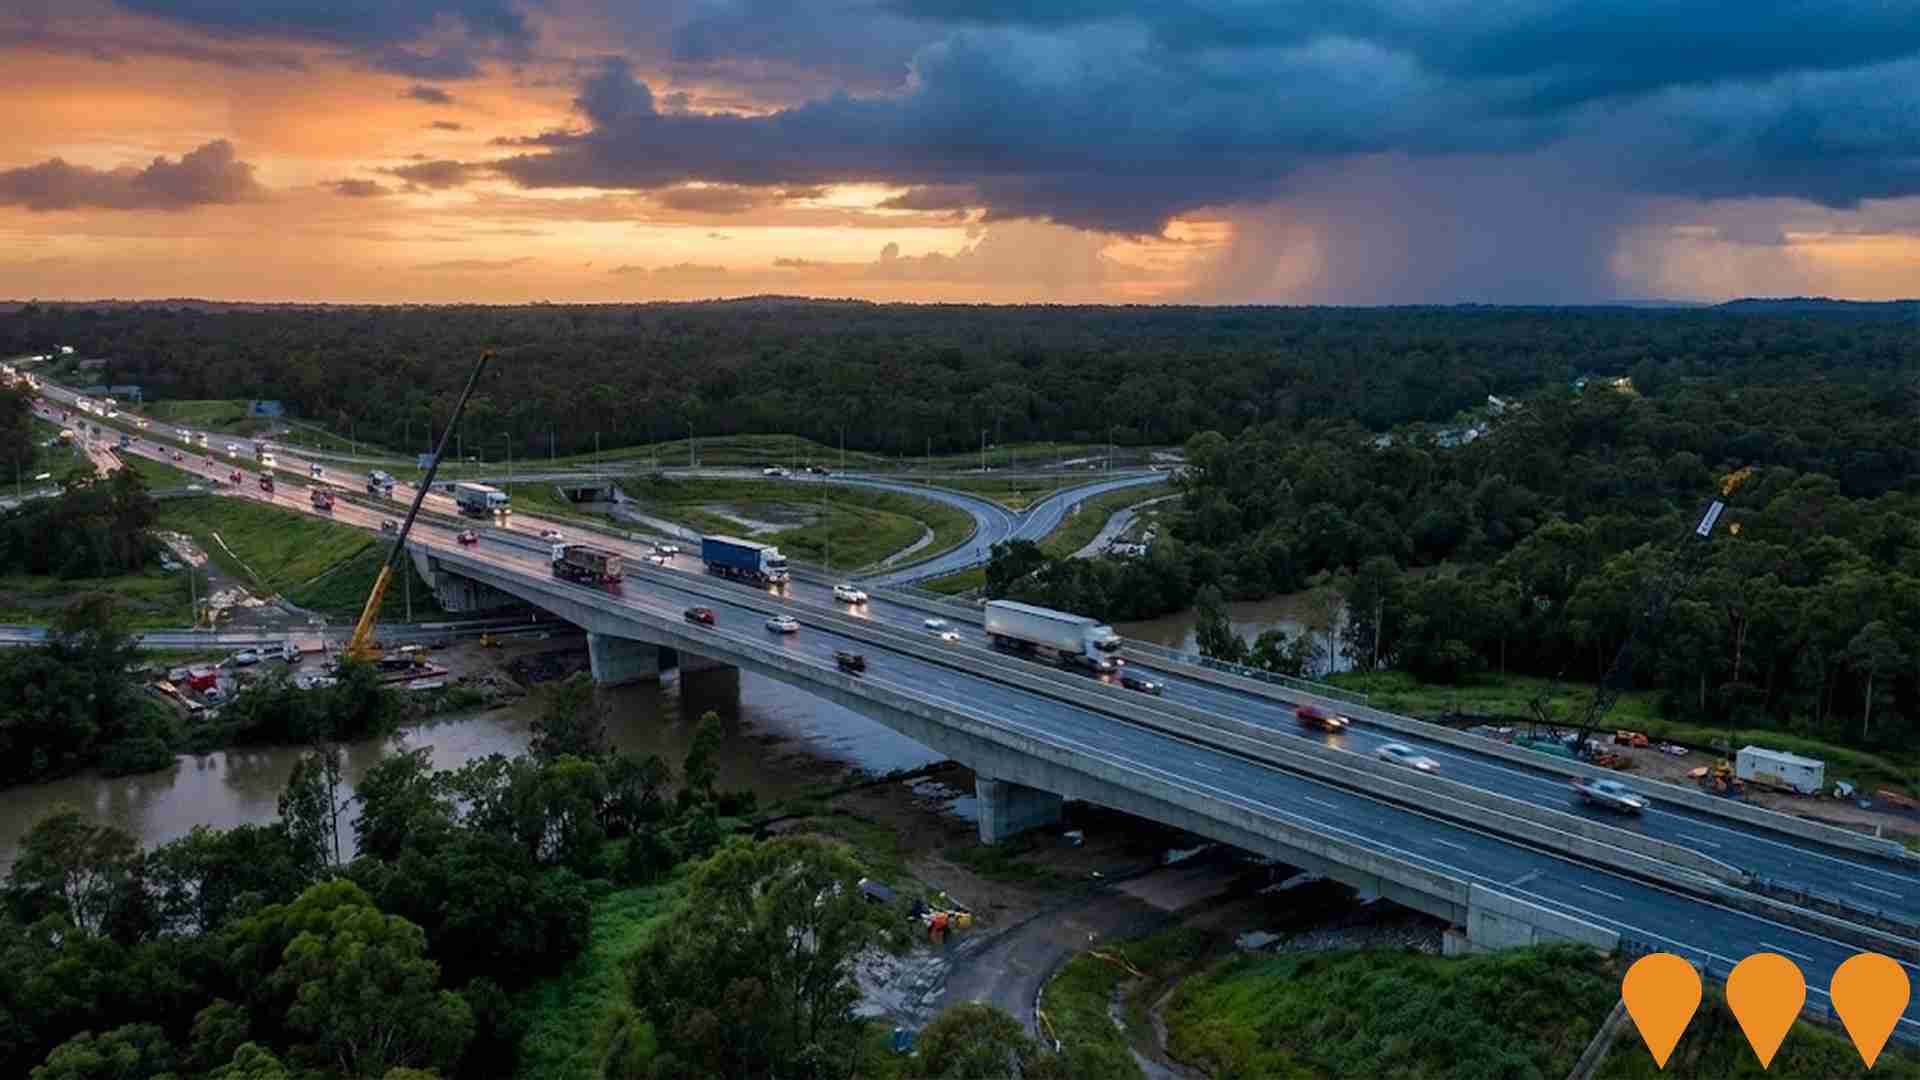
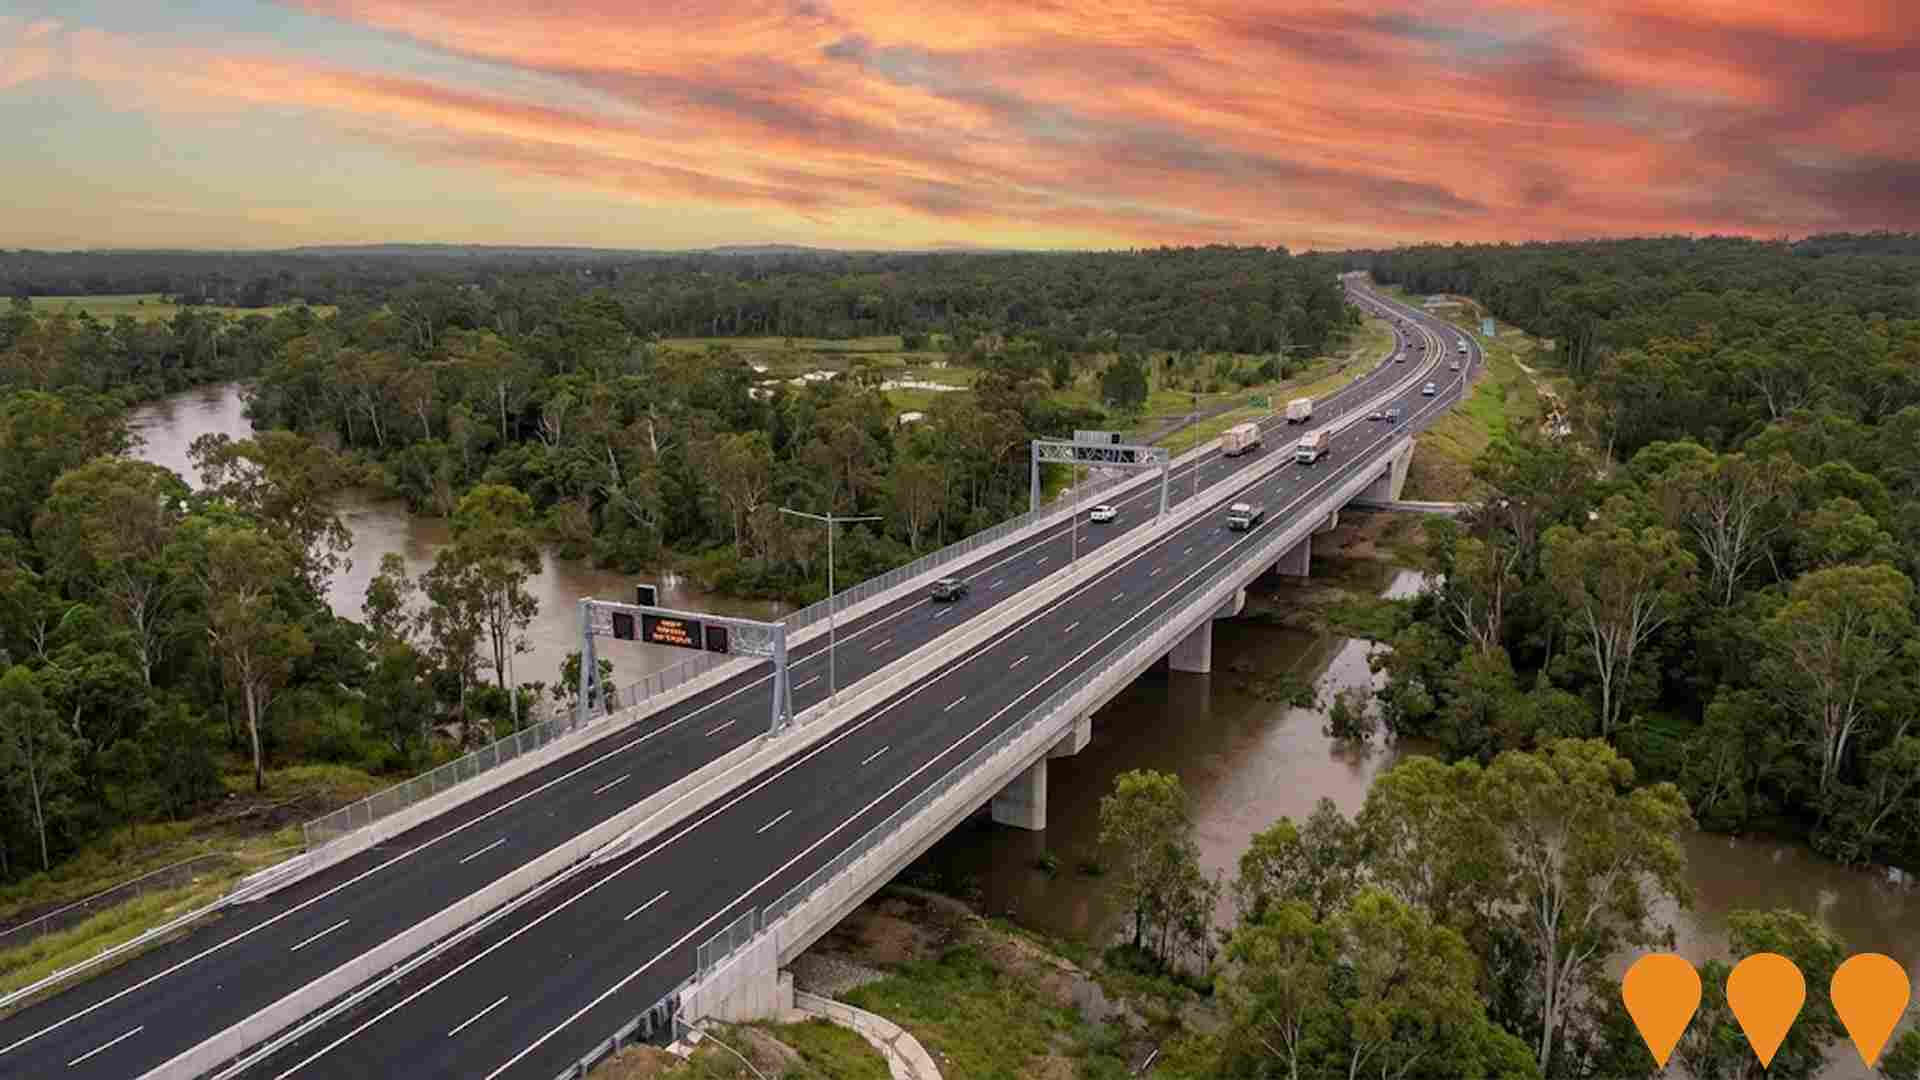
Bruce Highway Upgrade - Caboolture-Bribie Island Road to Steve Irwin Way (Exit 163)
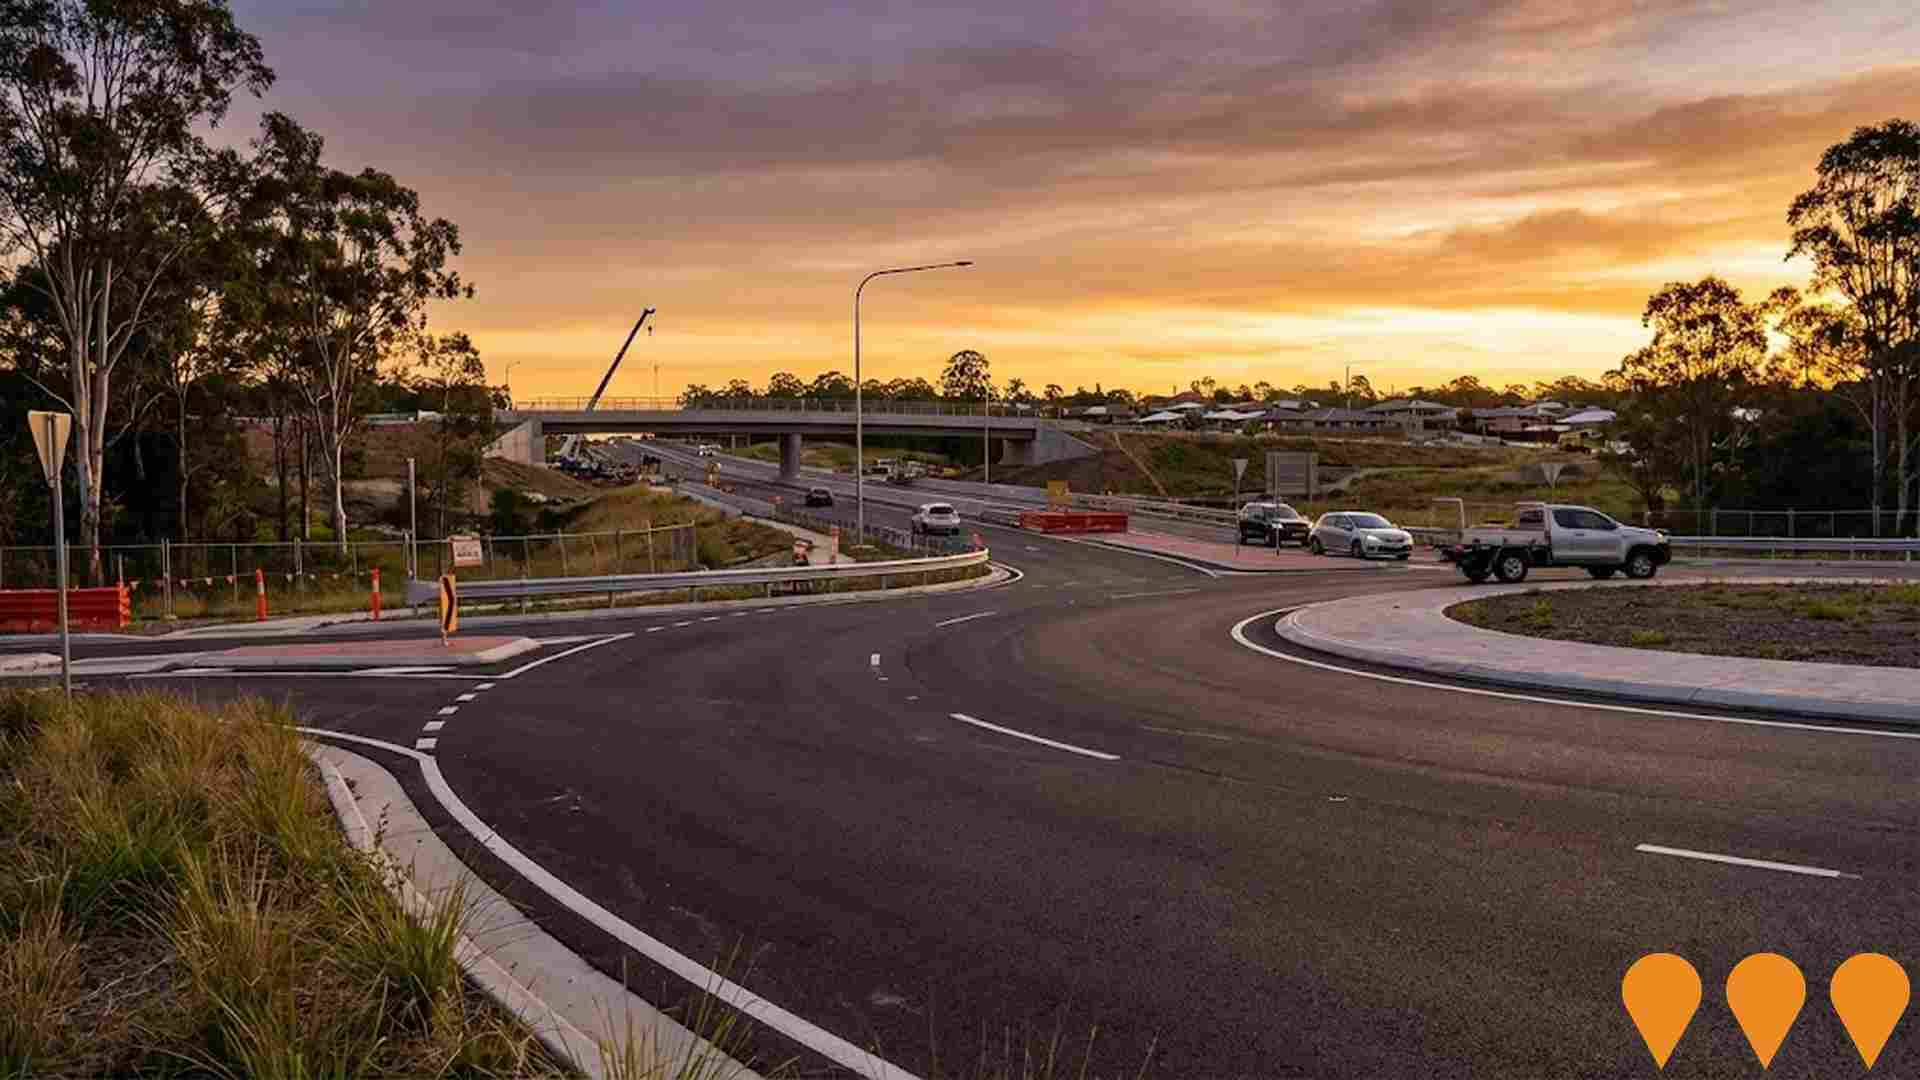
A major $662.5 million upgrade of an 11km section of the Bruce Highway from Caboolture-Bribie Island Road to Steve Irwin Way (Exit 163). The project widened the highway from four to six lanes and delivered 10 new, higher bridges to significantly improve flood immunity, including at King Johns and Lagoon Creeks. It also included upgrading interchanges and installing smart motorways technology. Major construction was completed in April 2024.
M1 Industrial Estate
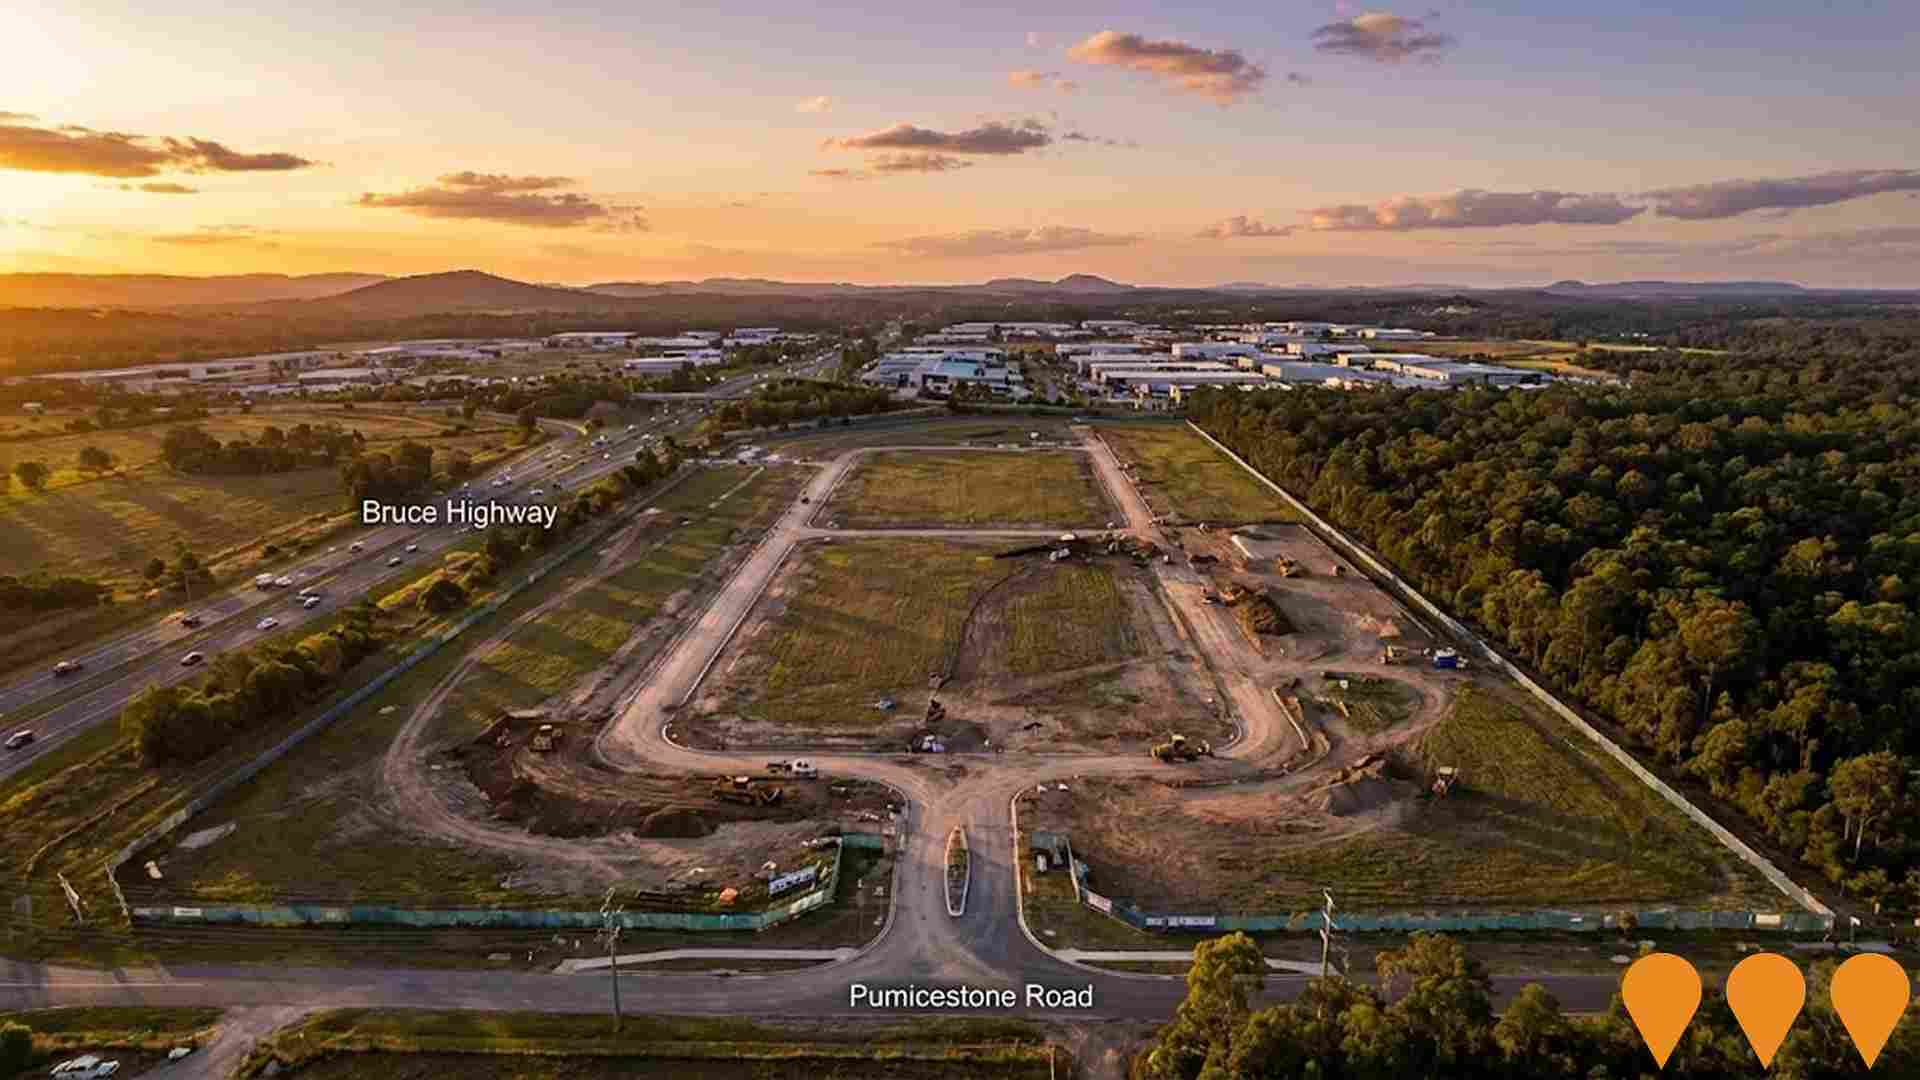
A 48 hectare DA-approved industrial estate with 39 hectares of developable land. Recently sold to Goldfields Property Development, the estate features ROL approval for 32 industrial lots ranging from 4,000sqm to 4.5 hectares. Zoned General Industry with 24/7 operations permitted and direct B-double access to the M1 motorway. Located strategically just off the Bruce Highway with over 2km of road frontage to Pumicestone Road and McGarry Road.
Big Fish Junction
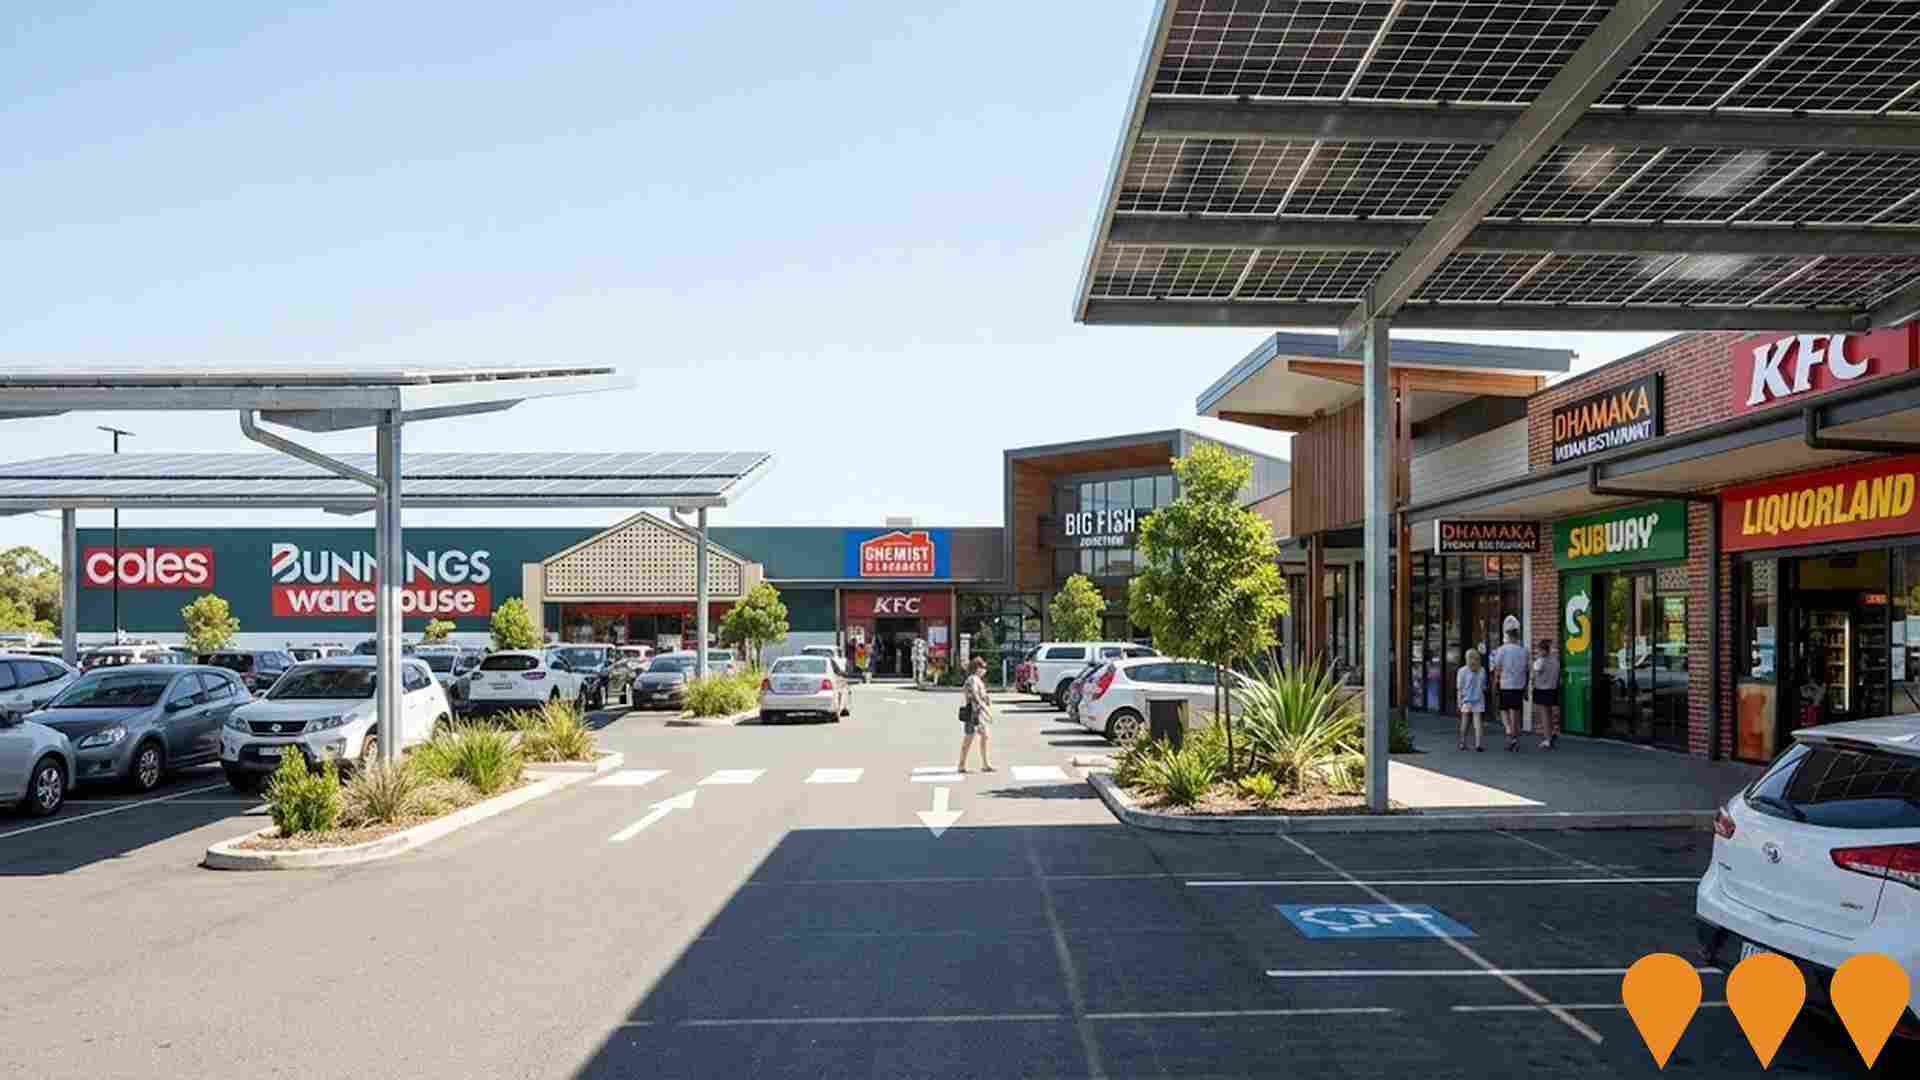
Big Fish Junction is a completed major retail and commercial precinct featuring Coles supermarket, Bunnings Warehouse, Chemist Warehouse, KFC, specialty dining options including Dhamaka Indian Restaurant, Subway, Sushi Tamashii, and CJ Pastries, plus retail stores including Liquorland, Cignall, Dollar Discount Variety, and Ozzee Nails & Spa. The shopping centre provides convenient family-friendly shopping with ample free shaded parking.
North Harbour Industrial Estate
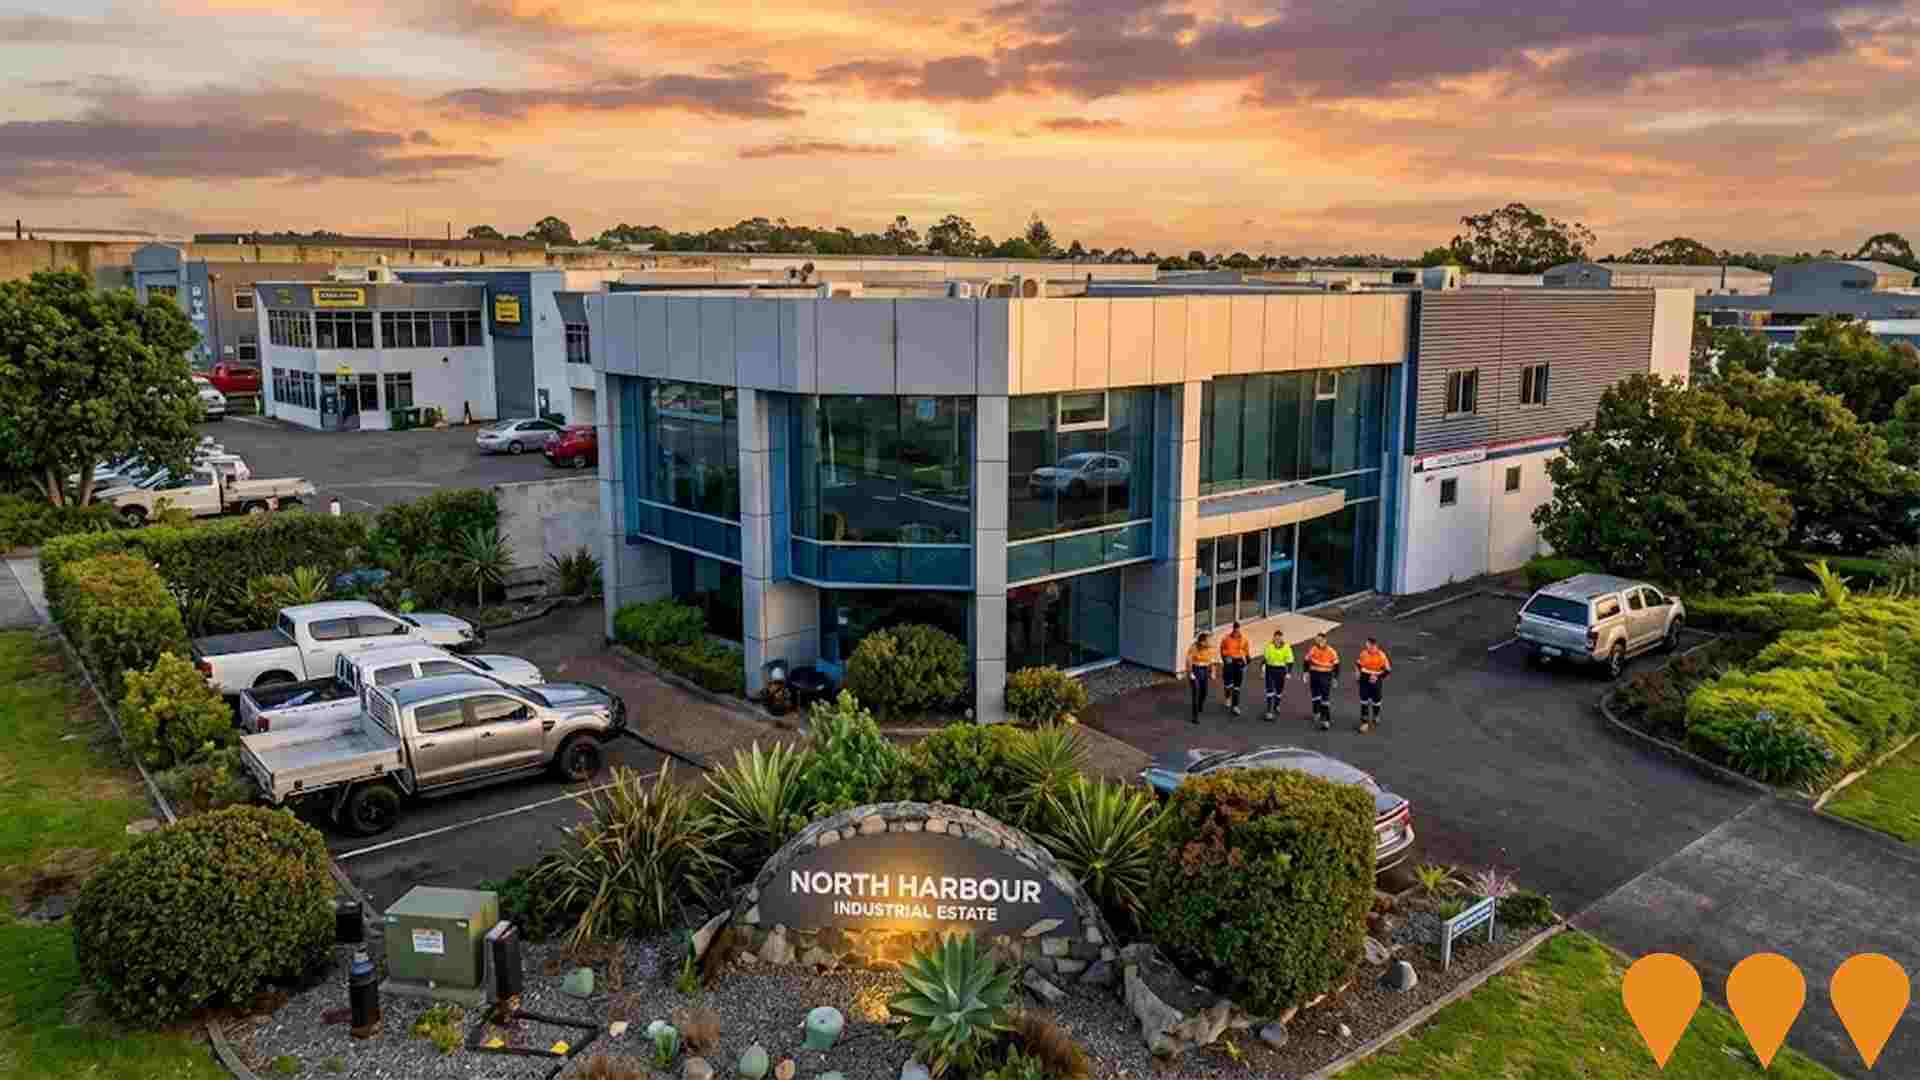
A 300-hectare master-planned industrial estate providing modern manufacturing and logistics facilities. Located strategically between Brisbane and the Sunshine Coast with excellent transport links. Accommodates diverse industrial uses from warehousing to advanced manufacturing.
Bruce Highway Upgrade - Caboolture to Steve Irwin Way
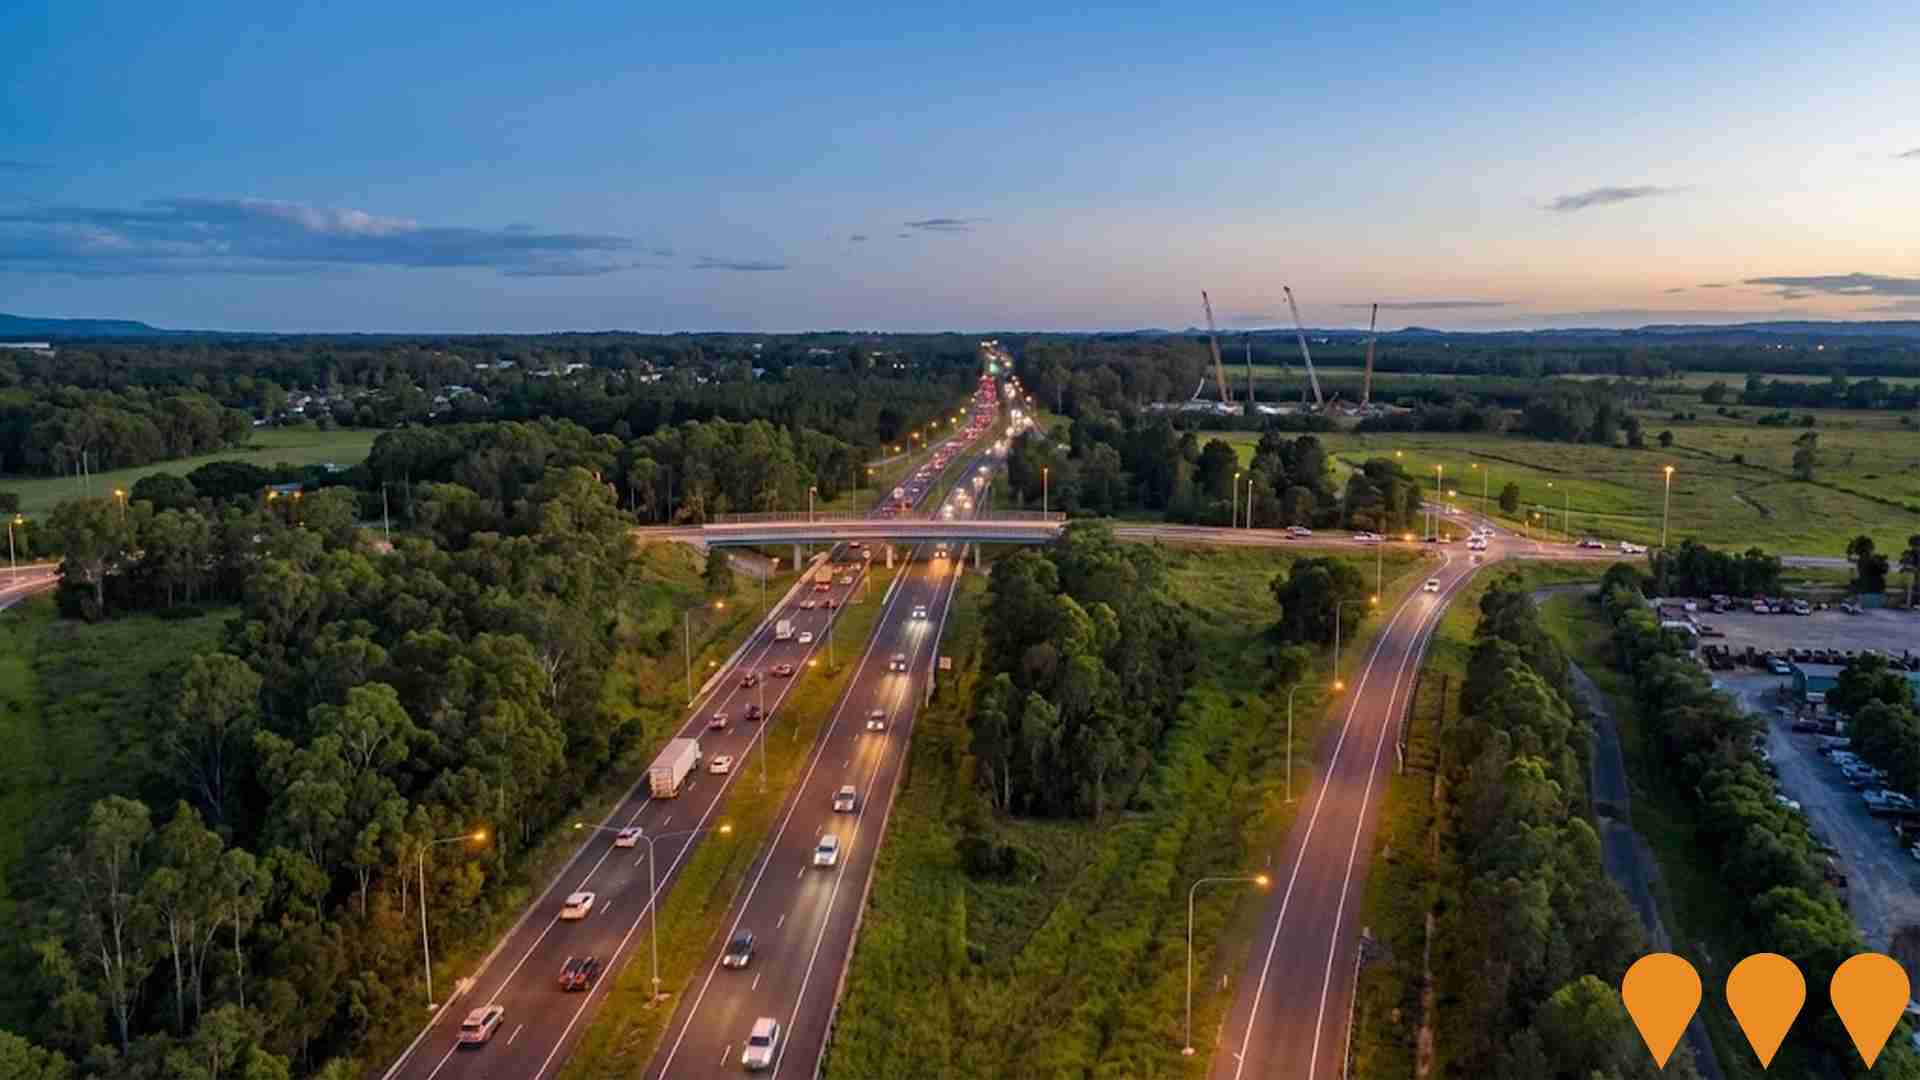
Widening of an 11km stretch of the Bruce Highway from four to six lanes between Caboolture-Bribie Island Road and Steve Irwin Way (Exit 163). The project includes 10 new higher and wider bridges to improve flood immunity, interchange upgrades, and smart motorway technology integration.
Caboolture-Bribie Island Road Upgrade Program
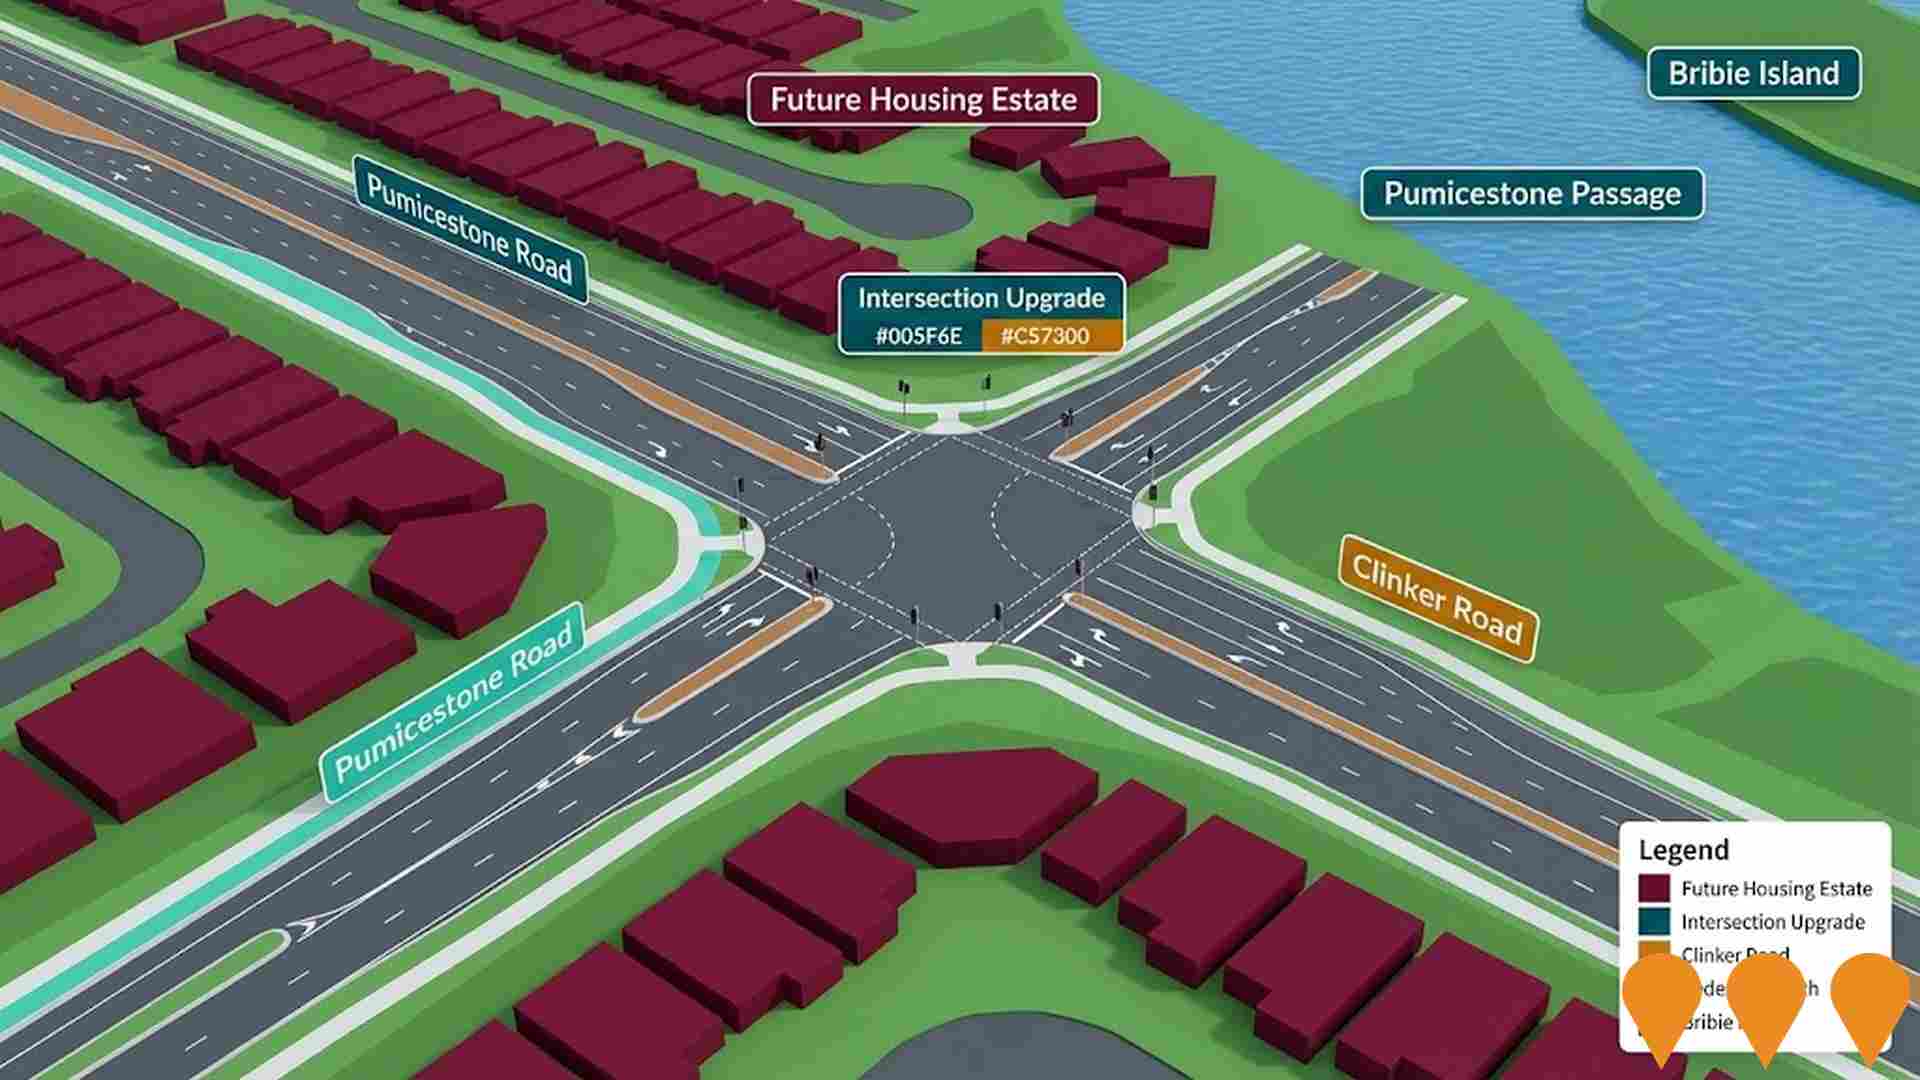
Sequential upgrades over 20 years to duplicate Caboolture-Bribie Island Road to 4-lane median-divided road. Includes signalising intersections, new bridge to Bribie Island. Design underway for Hickey Road to King Johns Creek section with Hickey Road intersection signalisation.
Employment
AreaSearch analysis of employment trends sees Elimbah performing better than 90% of local markets assessed across Australia
Elimbah has a balanced workforce spanning white and blue collar jobs. The construction sector is prominent with an unemployment rate of 2.3% and estimated employment growth of 7.3% in the past year as of September 2025.
There are 2,610 employed residents with an unemployment rate of 1.7% lower than Greater Brisbane's 4.0%. Workforce participation is similar to Greater Brisbane at 66.6%. Employment is concentrated in construction, health care & social assistance, and retail trade, particularly construction which is at 1.7 times the regional average. Professional & technical services are under-represented with only 4.3% of Elimbah's workforce compared to 8.9% in Greater Brisbane.
The area may offer limited local employment opportunities as indicated by Census data. Over the year to September 2025, employment increased by 7.3%, labour force by 6.1%, and unemployment fell by 1.1 percentage points. In comparison, Greater Brisbane's employment rose by 3.8%, labour force grew by 3.3%, and unemployment fell by 0.5 percentage points. Statewide in Queensland as of 25-Nov, employment contracted by 0.01% with an unemployment rate of 4.2%. Nationally, employment is forecast to grow by 6.6% over five years and 13.7% over ten years. Applying these projections to Elimbah's employment mix suggests local employment should increase by 6.1% over five years and 12.7% over ten years.
Frequently Asked Questions - Employment
Income
Income analysis reveals strong economic positioning, with the area outperforming 60% of locations assessed nationally by AreaSearch
The Elimbah SA2 had a median taxpayer income of $52,786 and an average income of $62,852 in the financial year 2022, according to postcode level ATO data aggregated by AreaSearch. This was slightly below the national average, contrasting with Greater Brisbane's median income of $55,645 and average income of $70,520. Based on a Wage Price Index growth of 13.99% since financial year 2022, current estimates suggest approximately $60,171 (median) and $71,645 (average) as of September 2025. The 2021 Census data showed household income ranked at the 77th percentile ($2,183 weekly), while personal income was at the 47th percentile. The largest segment of income distribution comprised 36.5% earning $1,500 - $2,999 weekly (1,696 residents). This is similar to the surrounding region where 33.3% fell into this bracket. Economic strength was evident with 30.7% of households achieving high weekly earnings exceeding $3,000, supporting elevated consumer spending. Housing accounted for 13.8% of income, while strong earnings placed residents within the 79th percentile for disposable income. The area's SEIFA income ranking placed it in the 5th decile.
Frequently Asked Questions - Income
Housing
Elimbah is characterized by a predominantly suburban housing profile, with above-average rates of outright home ownership
Elimbah's dwelling structures, as per the latest Census, were 97.6% houses and 2.4% other dwellings (semi-detached, apartments, 'other' dwellings). This is compared to Brisbane metro's 83.4% houses and 16.5% other dwellings. Home ownership in Elimbah was at 32.6%, with mortgaged dwellings at 57.6% and rented ones at 9.8%. The median monthly mortgage repayment was $2,000, higher than Brisbane metro's average of $1,625. The median weekly rent in Elimbah was $370, compared to Brisbane metro's $335. Nationally, Elimbah's mortgage repayments were higher at $2,000 than the Australian average of $1,863, while rents were lower at $370 than the national figure of $375.
Frequently Asked Questions - Housing
Household Composition
Elimbah features high concentrations of family households, with a higher-than-average median household size
Family households account for 87.5% of all households, including 46.2% couples with children, 31.5% couples without children, and 9.3% single parent families. Non-family households constitute the remaining 12.5%, with lone person households at 10.7% and group households comprising 1.8%. The median household size is 3.1 people, which is larger than the Greater Brisbane average of 2.7.
Frequently Asked Questions - Households
Local Schools & Education
Educational outcomes in Elimbah fall within the lower quartile nationally, indicating opportunities for improvement in qualification attainment
The area's university qualification rate is 14.3%, significantly lower than Greater Brisbane's average of 30.5%. Bachelor degrees are the most common at 10.4%, followed by graduate diplomas (2.0%) and postgraduate qualifications (1.9%). Vocational credentials are prevalent, with 45.9% of residents aged 15+ holding them, including advanced diplomas (11.2%) and certificates (34.7%). Educational participation is high at 28.1%, with 10.9% in primary education, 8.9% in secondary education, and 3.3% pursuing tertiary education.
Educational participation is notably high, with 28.1% of residents currently enrolled in formal education. This includes 10.9% in primary education, 8.9% in secondary education, and 3.3% pursuing tertiary education.
Frequently Asked Questions - Education
Schools Detail
Nearby Services & Amenities
Transport
Transport servicing is moderate compared to other areas nationally based on assessment of service frequency, route connectivity and accessibility
Transport analysis indicates three active stops in Elimbah offering a mix of train and bus services. These stops are served by 32 routes, facilitating 601 weekly passenger trips collectively. Transport accessibility is limited with residents typically located 2181 meters from the nearest stop.
Service frequency averages 85 trips per day across all routes, equating to approximately 200 weekly trips per individual stop.
Frequently Asked Questions - Transport
Transport Stops Detail
Health
Health outcomes in Elimbah are marginally below the national average with common health conditions slightly more prevalent than average across both younger and older age cohorts
Elimbah's health indicators show below-average results with common health conditions slightly more prevalent than average across both younger and older age groups. The area has approximately 51% of its total population (~2,375 people) with private health cover, compared to Greater Brisbane's 47.6%.
The most common medical conditions are arthritis (affecting 8.7% of residents) and asthma (8.2%), while 67.4% of residents report no medical ailments, compared to 61.9% in Greater Brisbane. The area has 16.8% of residents aged 65 and over (781 people). Health outcomes among seniors are above average, outperforming the general population in health metrics.
Frequently Asked Questions - Health
Cultural Diversity
Elimbah is considerably less culturally diverse than average when assessed alongside AreaSearch's national rankings for language and cultural background related metrics
Elimbah had a cultural diversity level below average, with 85.5% of its population born in Australia, 91.0% being citizens, and 95.1% speaking English only at home. Christianity was the main religion in Elimbah, comprising 49.0% of people, compared to 44.7% across Greater Brisbane. The top three ancestry groups were Australian (31.9%), English (31.8%), and Irish (7.7%).
Notably, Dutch representation was higher at 2.0%, German at 4.8%, and New Zealand at 0.8%.
Frequently Asked Questions - Diversity
Age
Elimbah's population is slightly older than the national pattern
The median age in Elimbah is 40 years, which is higher than Greater Brisbane's average of 36 years and modestly exceeds the national average of 38 years. Compared to Greater Brisbane, Elimbah has a notably over-represented cohort of 55-64 year-olds (15.4% locally) and an under-represented group of 25-34 year-olds (10.9%). Post-2021 Census data shows that the 55 to 64 age group has grown from 13.3% to 15.4%, while the 75 to 84 cohort increased from 4.2% to 5.3%. Conversely, the 15 to 24 cohort has declined from 12.4% to 11.0% and the 45 to 54 group dropped from 16.3% to 15.0%. Population forecasts for 2041 indicate substantial demographic changes in Elimbah, with the 75 to 84 group expected to grow by 91%, reaching 466 people from 244. Residents aged 65 and older will represent 69% of anticipated growth, while the 45 to 54 and 35 to 44 cohorts are expected to experience population declines.
