Chart Color Schemes
This analysis uses ABS Statistical Areas Level 2 (SA2) boundaries, which can materially differ from Suburbs and Localities (SAL) even when sharing similar names.
SA2 boundaries are defined by the Australian Bureau of Statistics and are designed to represent communities for statistical reporting (e.g., census and ERP).
Suburbs and Localities (SAL) represent commonly-used suburb/locality names (postal-style areas) and may use different geographic boundaries. For comprehensive analysis, consider reviewing both boundary types if available.
est. as @ -- *
ABS ERP | -- people | --
2021 Census | -- people
Sales Activity
Curious about local property values? Filter the chart to assess the volume and appreciation (including resales) trends and regional comparisons, or scroll to the map below view this information at an individual property level.
Find a Recent Sale
Sales Detail
Population
Malvern East has seen population growth performance typically on par with national averages when looking at short and medium term trends
Malvern East's population is 23,763 as of November 2025. This shows an increase of 1,840 people since the 2021 Census, which reported a population of 21,923. The change is inferred from ABS data: estimated resident population was 23,738 in June 2024 and there were 112 new addresses validated since the Census date. This results in a density ratio of 3,139 persons per square kilometer, placing Malvern East in the upper quartile nationally according to AreaSearch's assessment. The area's population growth of 8.4% from 2021 exceeded the SA4 region's 7.1%, making it a growth leader. Overseas migration was the primary driver of this growth.
AreaSearch uses ABS/Geoscience Australia projections for each SA2 area, released in 2024 with a base year of 2022. For areas not covered by this data, AreaSearch utilises VIC State Government's Regional/LGA projections from 2023, adjusted using weighted aggregation methods to SA2 levels. Growth rates by age group are applied across all areas for years 2032 to 2041. Based on the latest annual ERP population numbers, Malvern East is projected to grow by 5,346 persons to 2041, reflecting a total increase of 22.4% over the 17-year period.
Frequently Asked Questions - Population
Development
Residential development activity is slightly higher than average within Malvern East when compared nationally
Malvern East has recorded approximately 83 residential properties granted approval per year over the past five financial years, totalling 418 homes. As of FY26, 29 approvals have been recorded. On average, 1.5 people moved to the area annually for each dwelling built between FY21 and FY25, indicating balanced supply and demand. However, this figure has increased to 9.9 people per dwelling over the past two financial years, suggesting growing popularity and potential undersupply. New properties are constructed at an average expected cost of $546,000, targeting the premium market segment with higher-end properties.
This year, $95.6 million in commercial approvals have been registered, indicating high levels of local commercial activity. Compared to Greater Melbourne, Malvern East records about 65% of building activity per person and ranks among the 46th percentile nationally, resulting in relatively constrained buyer choice and supporting interest in existing dwellings. New building activity comprises approximately 43.0% standalone homes and 57.0% townhouses or apartments, favouring higher-density living to create more affordable entry points for downsizers, investors, and first-home buyers. Malvern East indicates a mature market with around 387 people per approval.
By 2041, the area is expected to grow by approximately 5,321 residents. If current development rates continue, housing supply may not keep pace with population growth, potentially increasing competition among buyers and supporting stronger price growth.
Frequently Asked Questions - Development
Infrastructure
Malvern East has strong levels of nearby infrastructure activity, ranking in the top 40% nationally
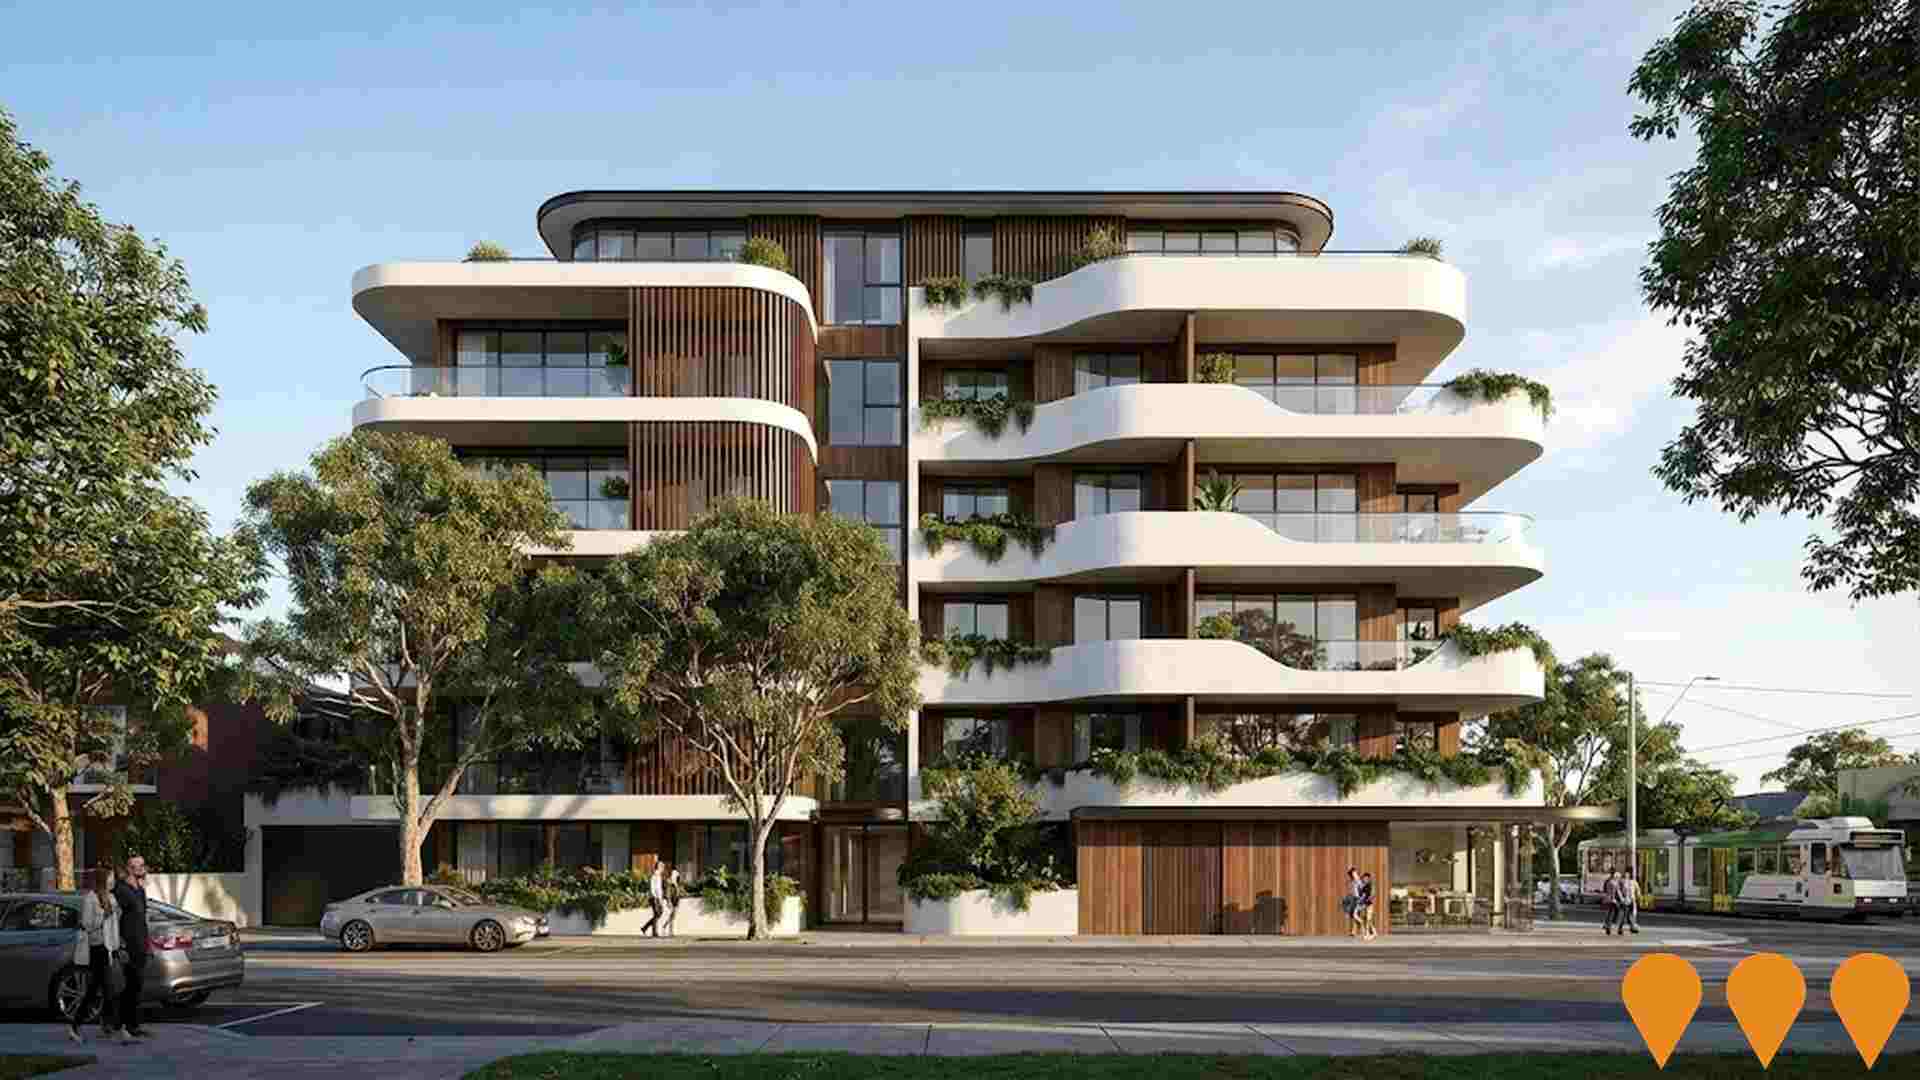
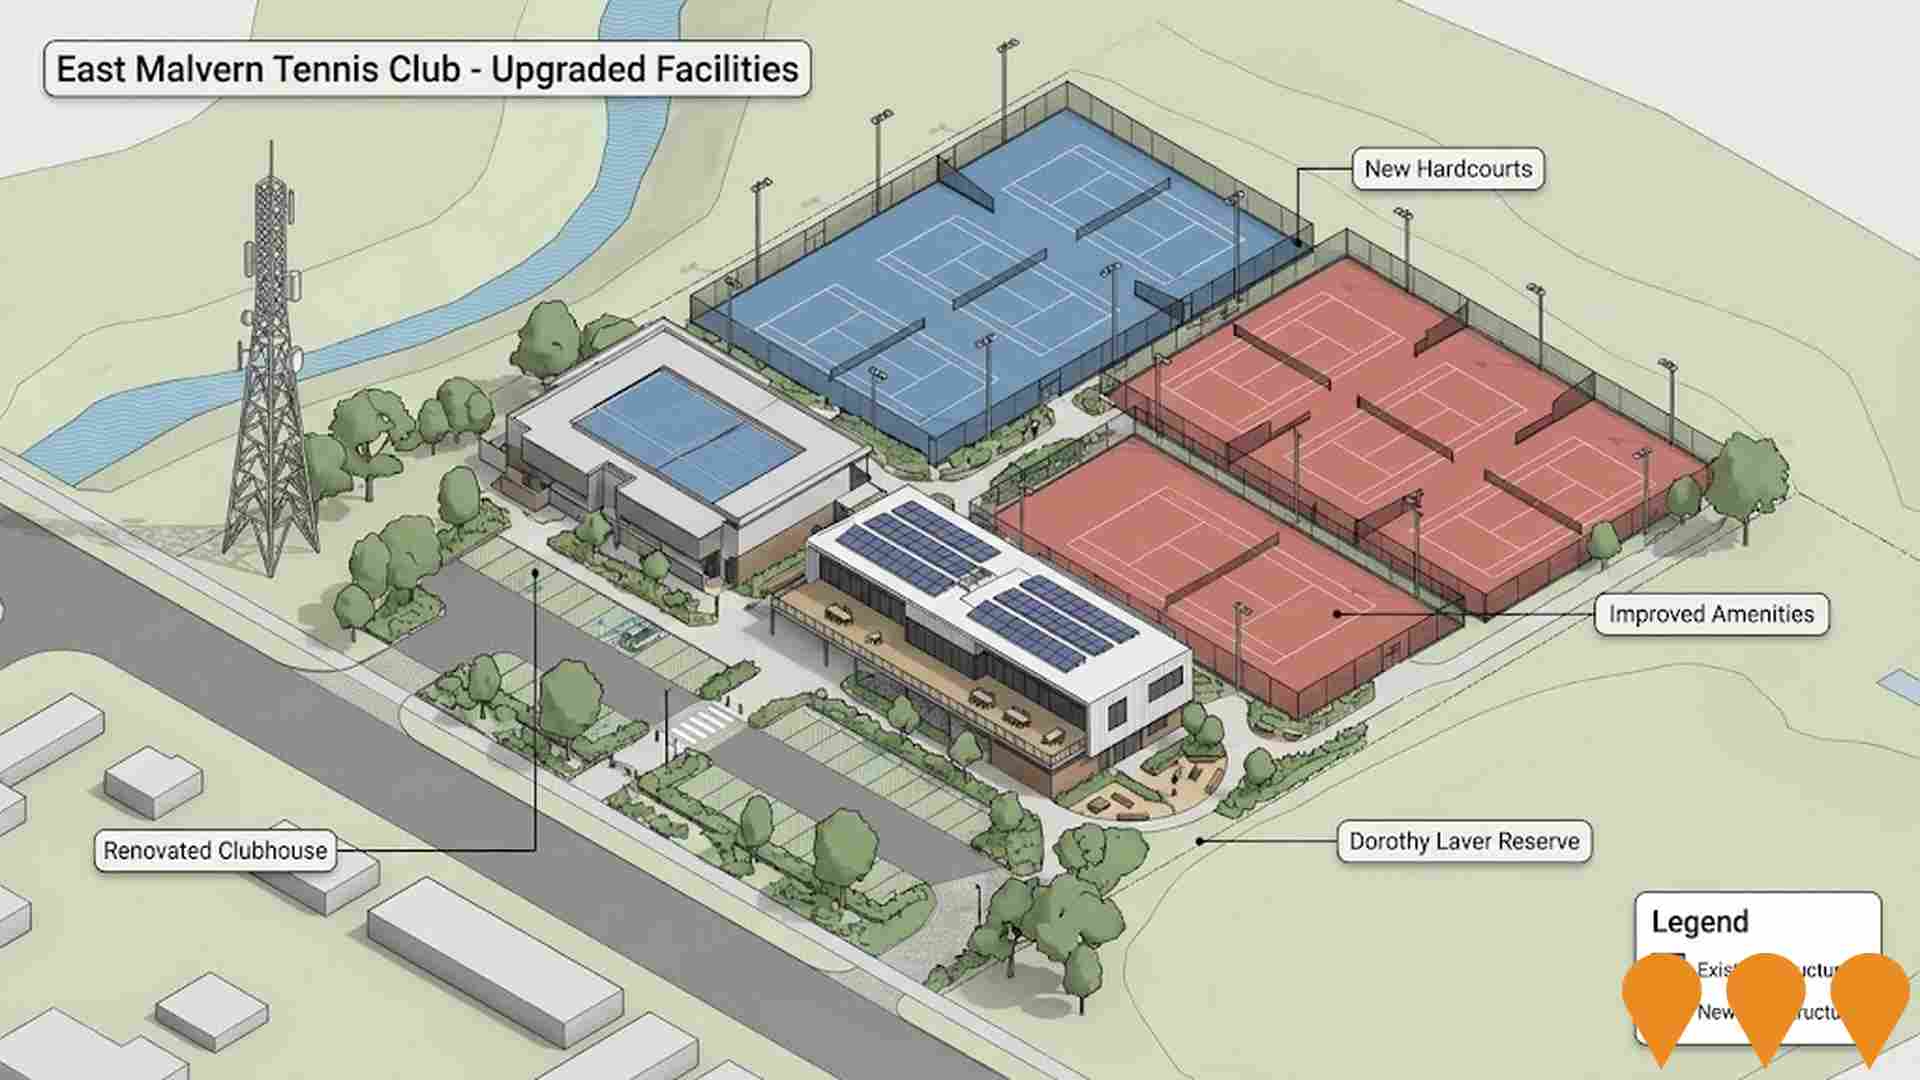
Changes to local infrastructure significantly influence an area's performance. AreaSearch has identified a total of 81 projects likely to impact the area. Notable projects include Central Park Residences, Monash University Caulfield Campus Expansion, Olive Green, and LUMA - 226 Hawthorn Road. The following list details those most relevant.
Professional plan users can use the search below to filter and access additional projects.
INFRASTRUCTURE SEARCH
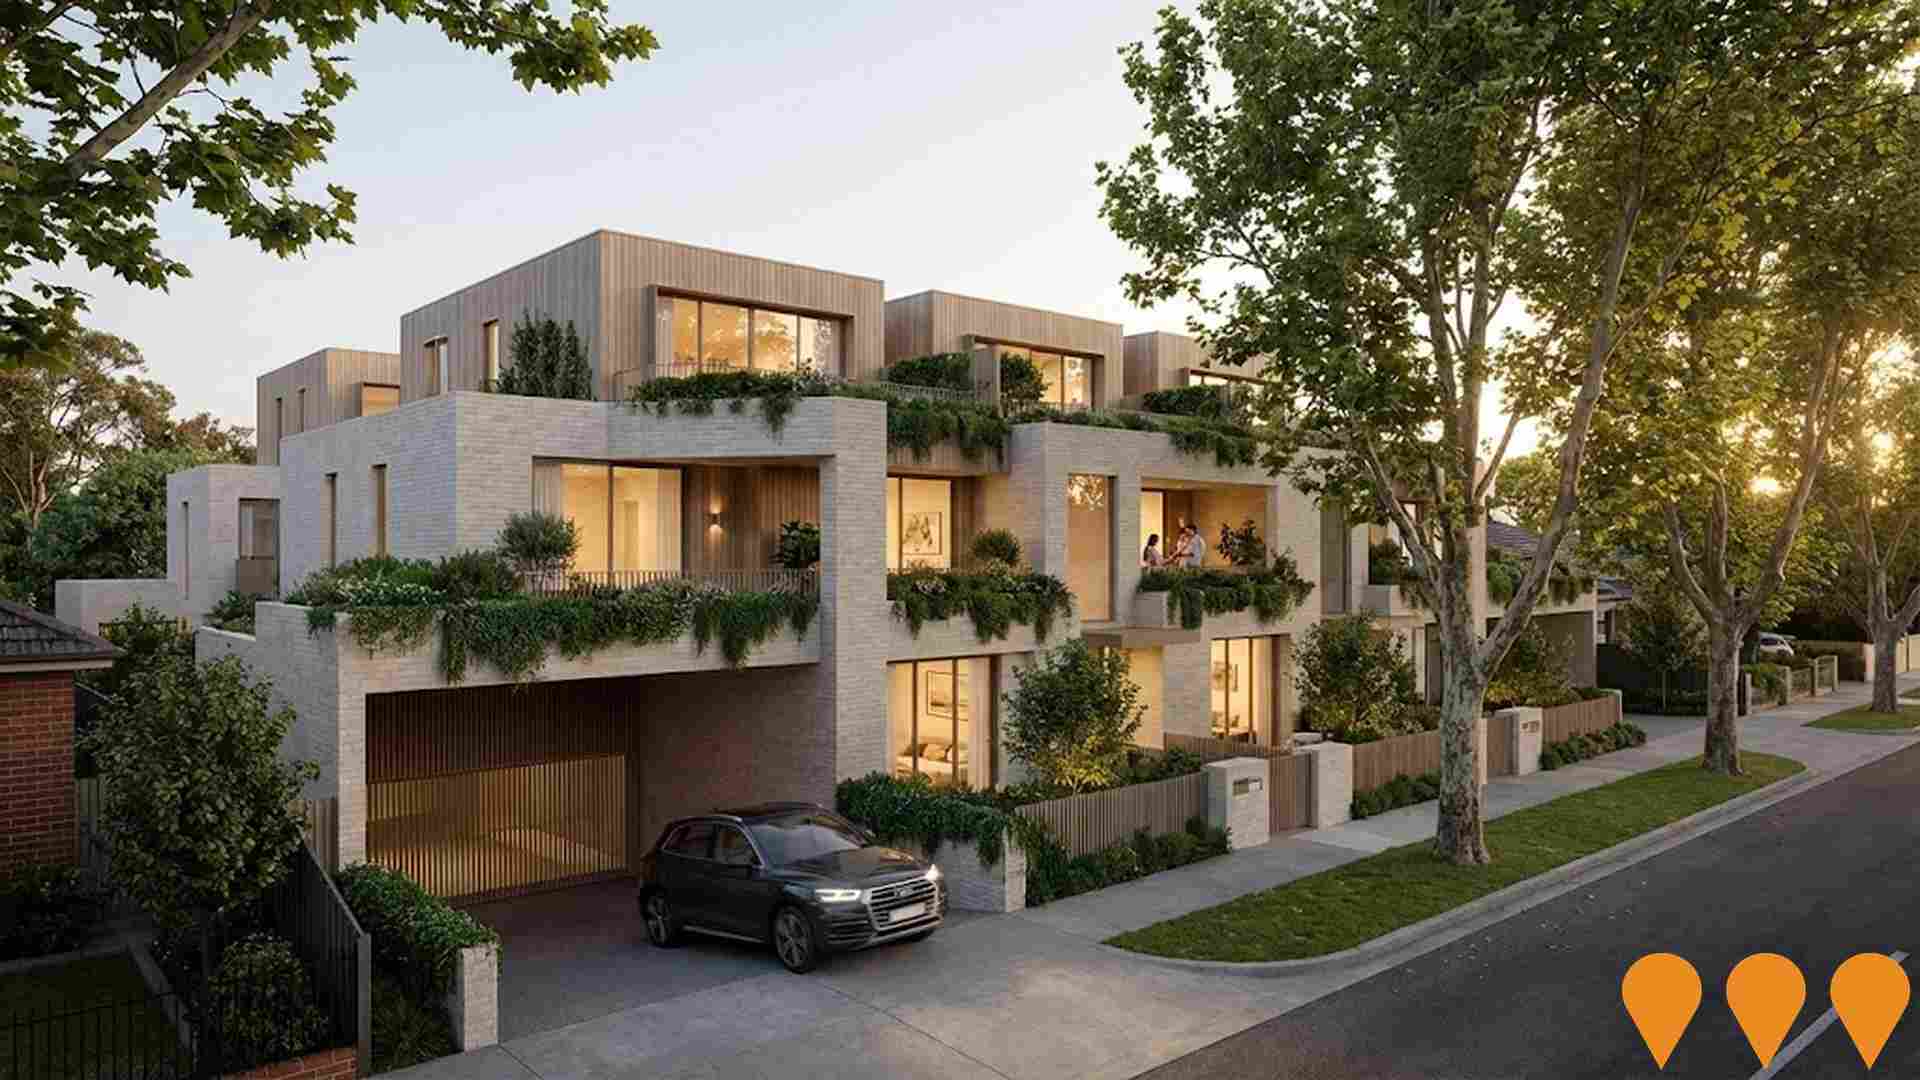
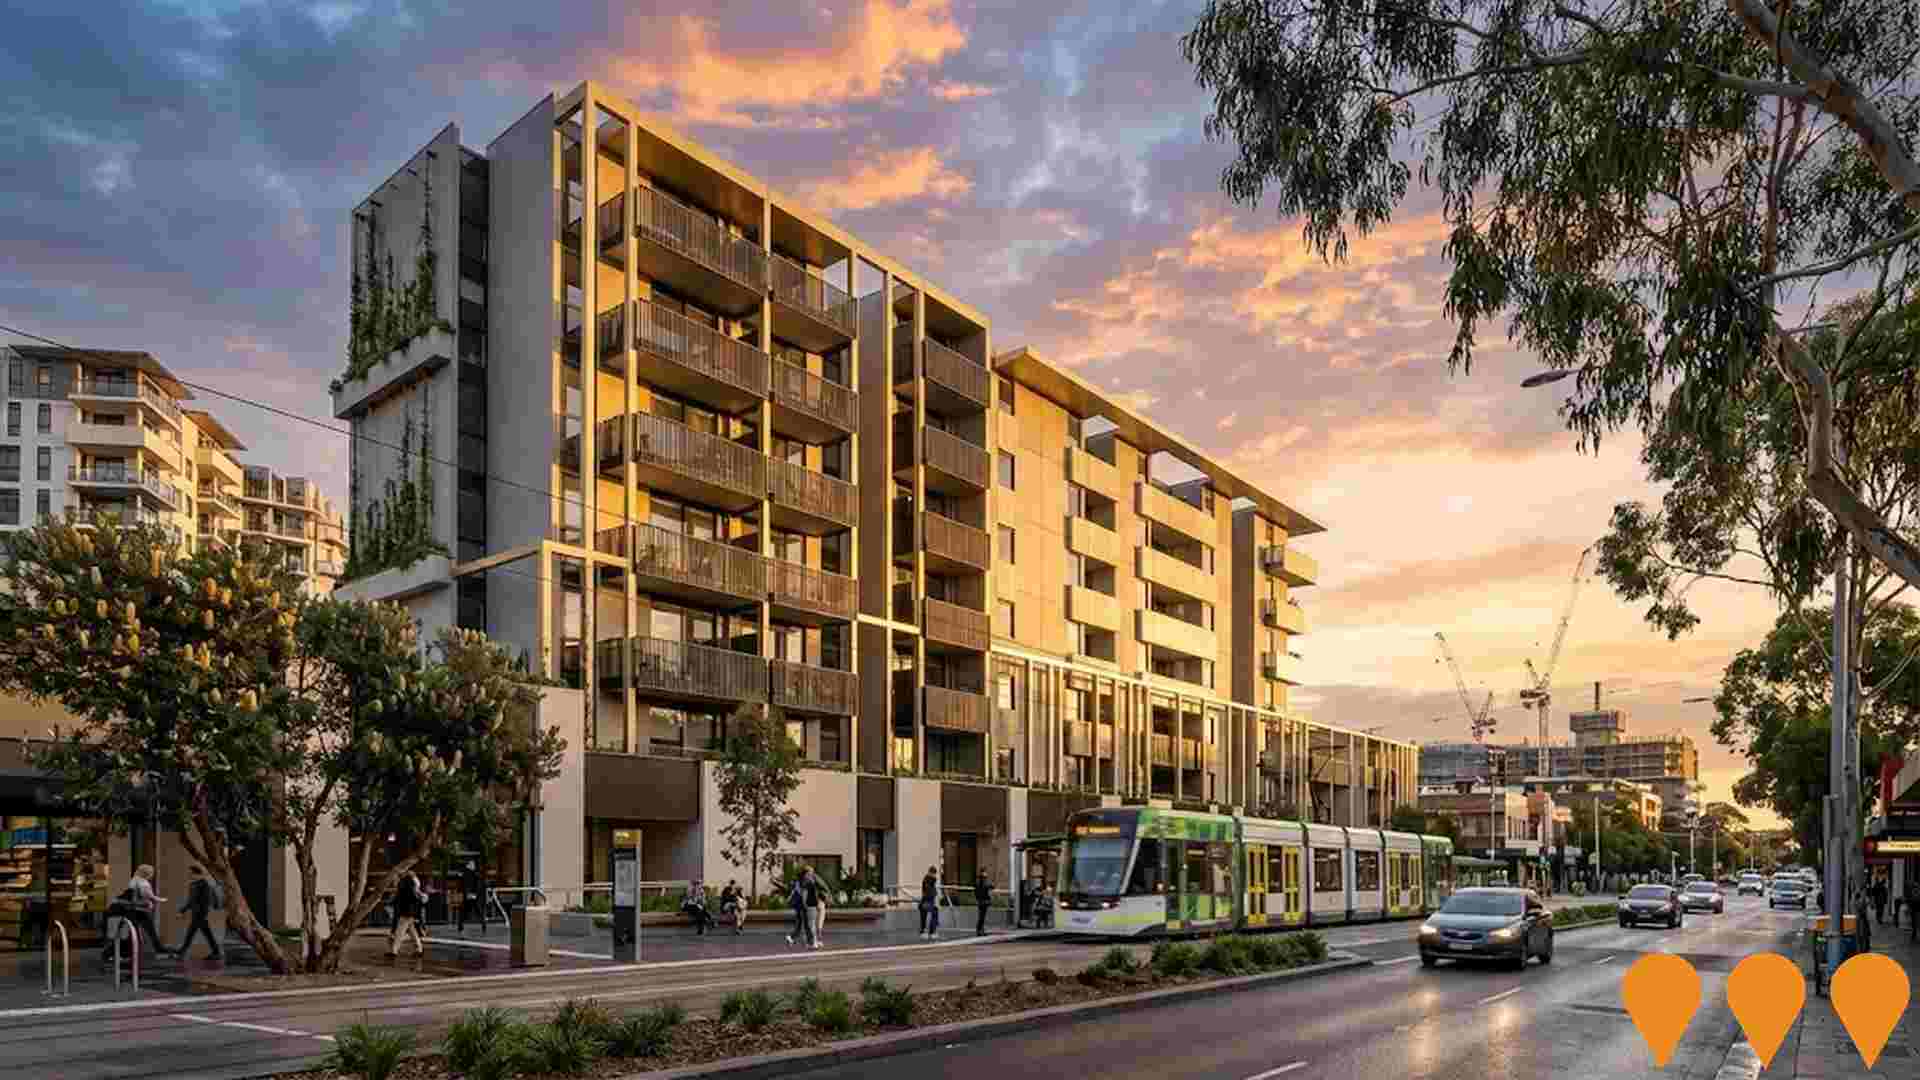
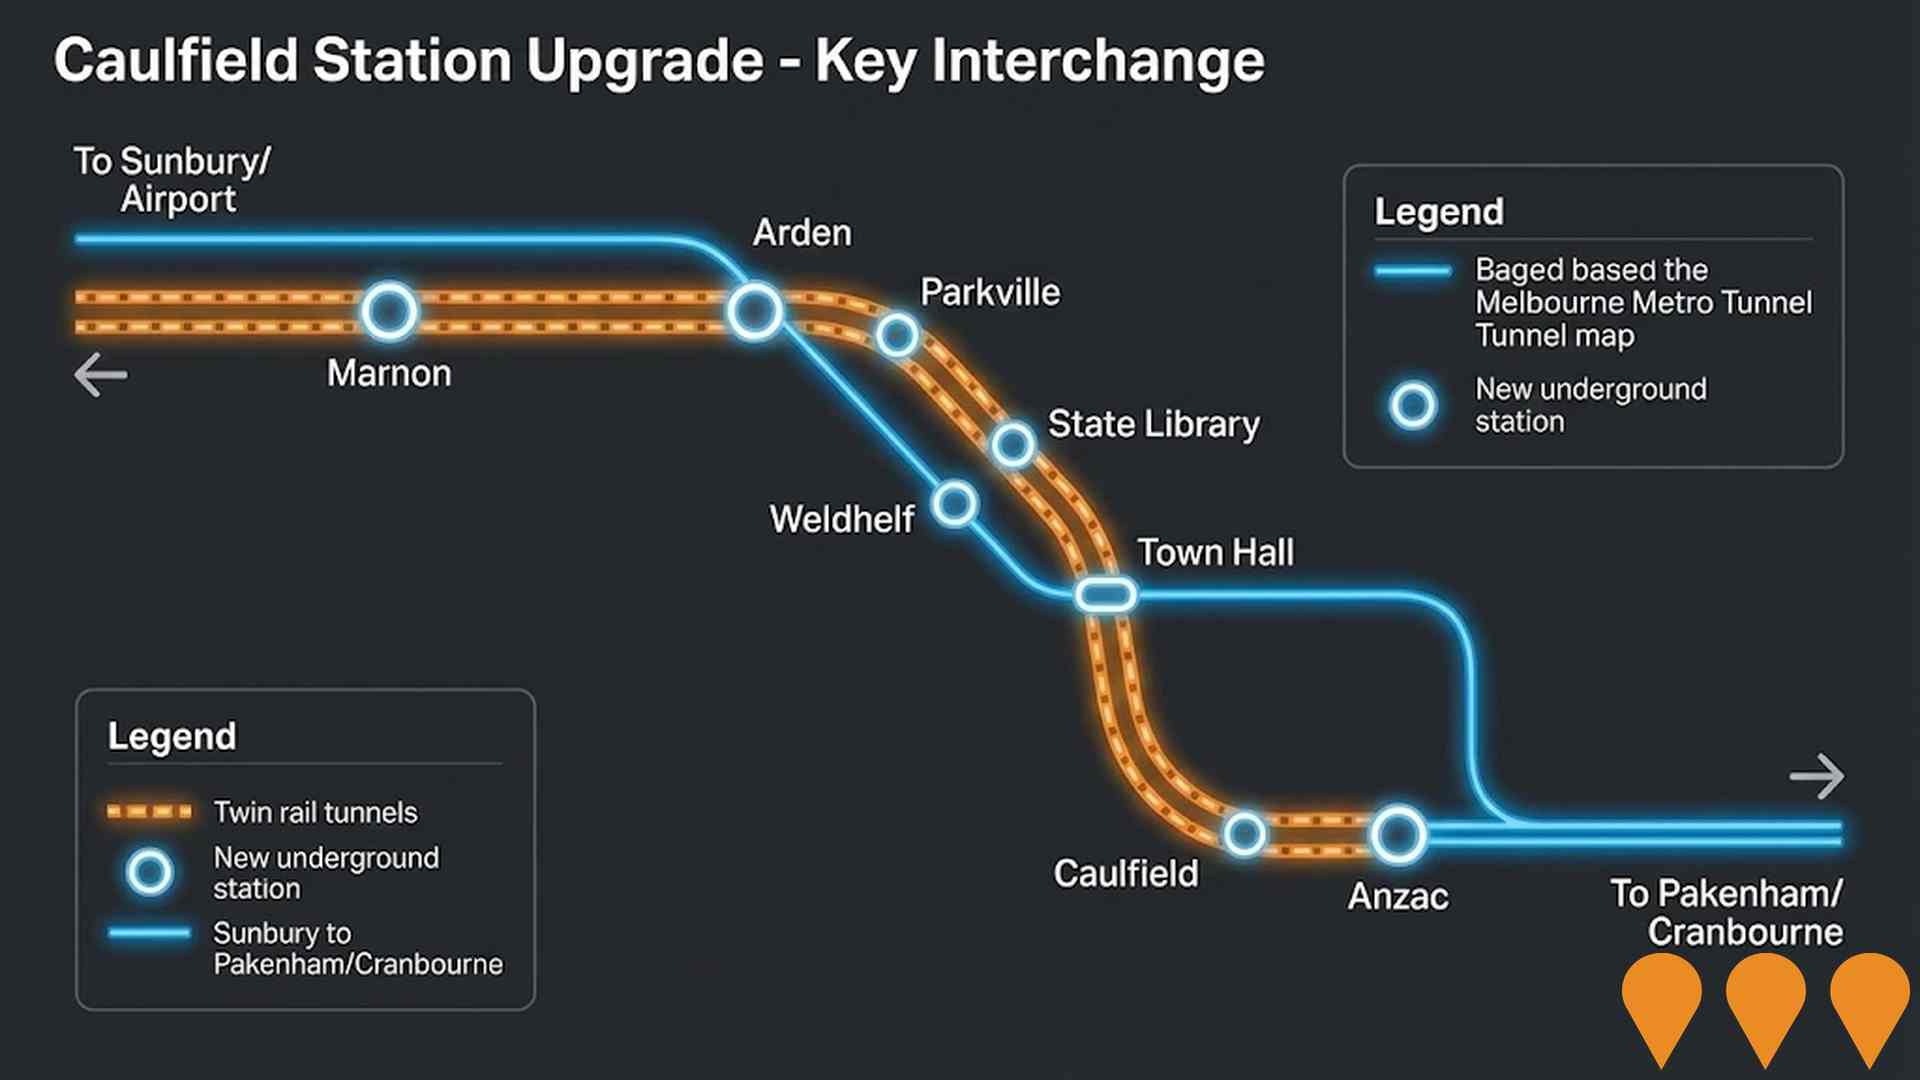
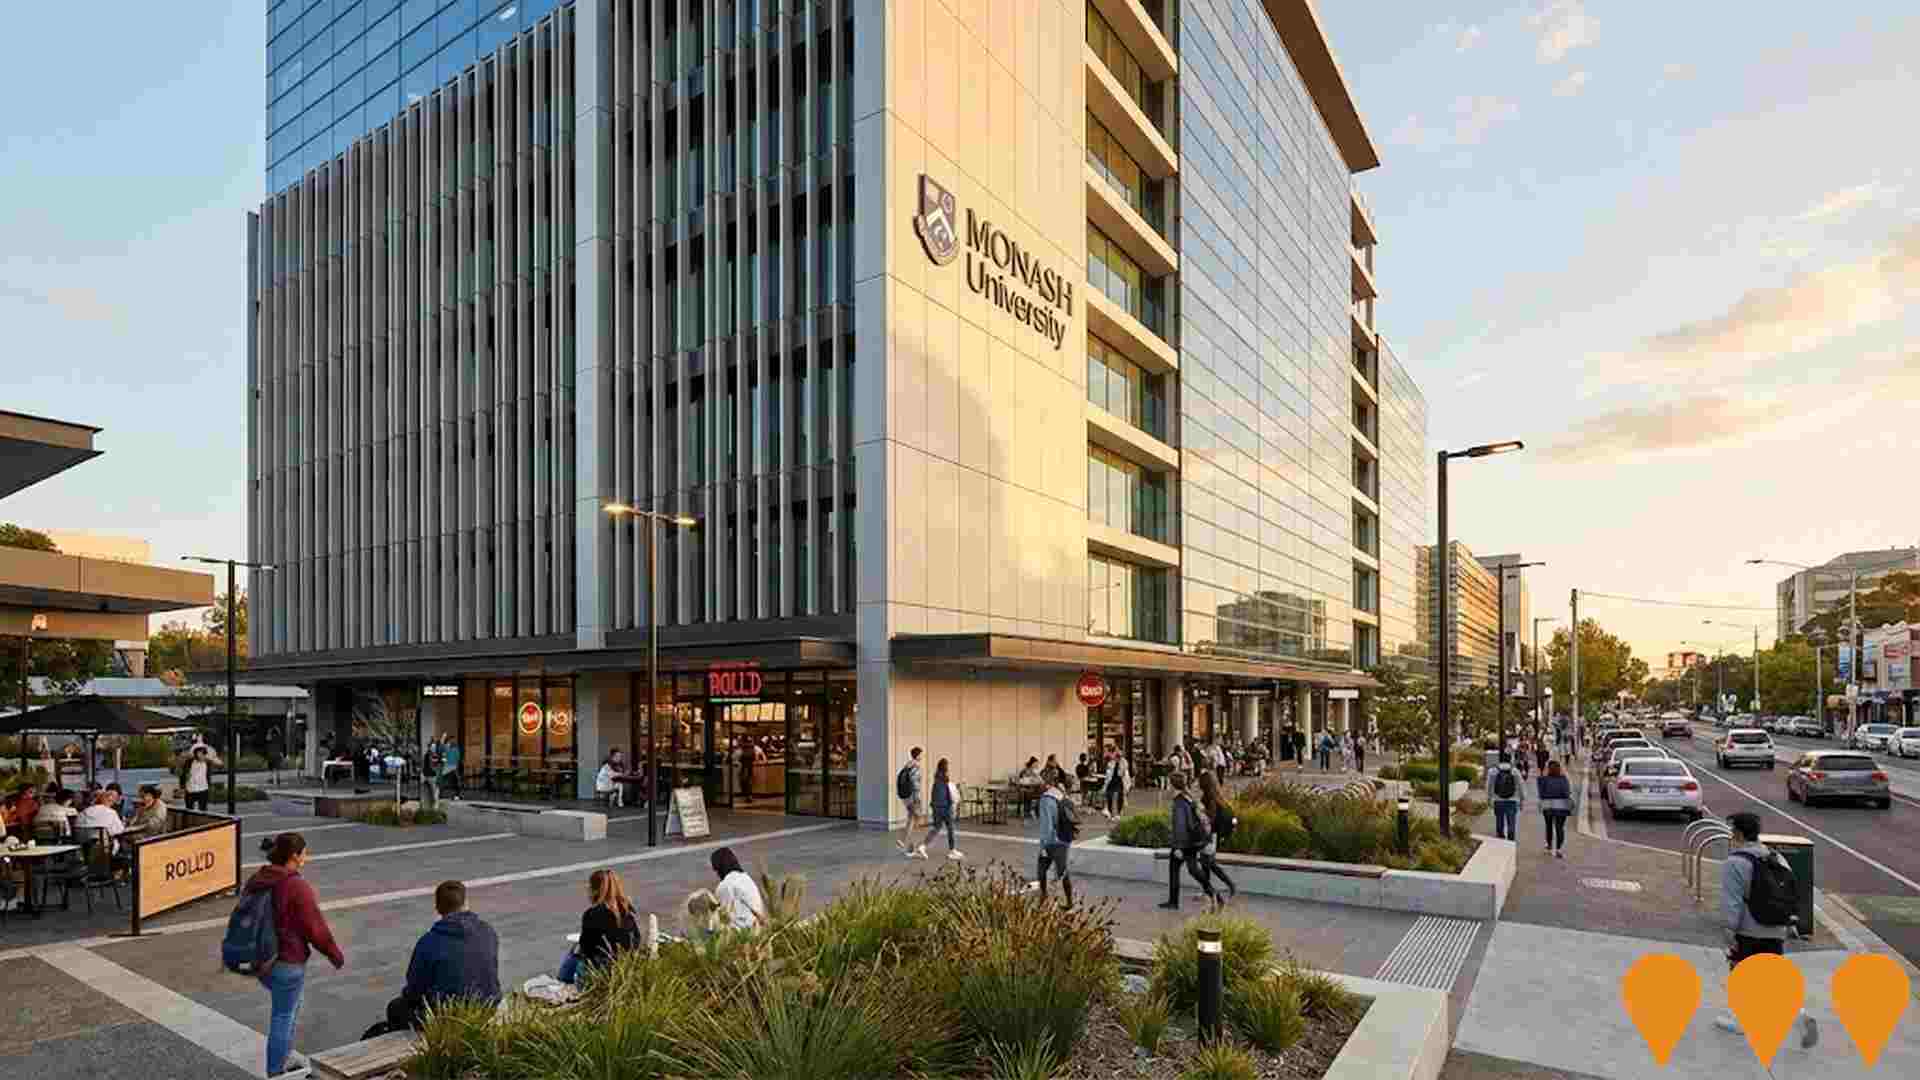
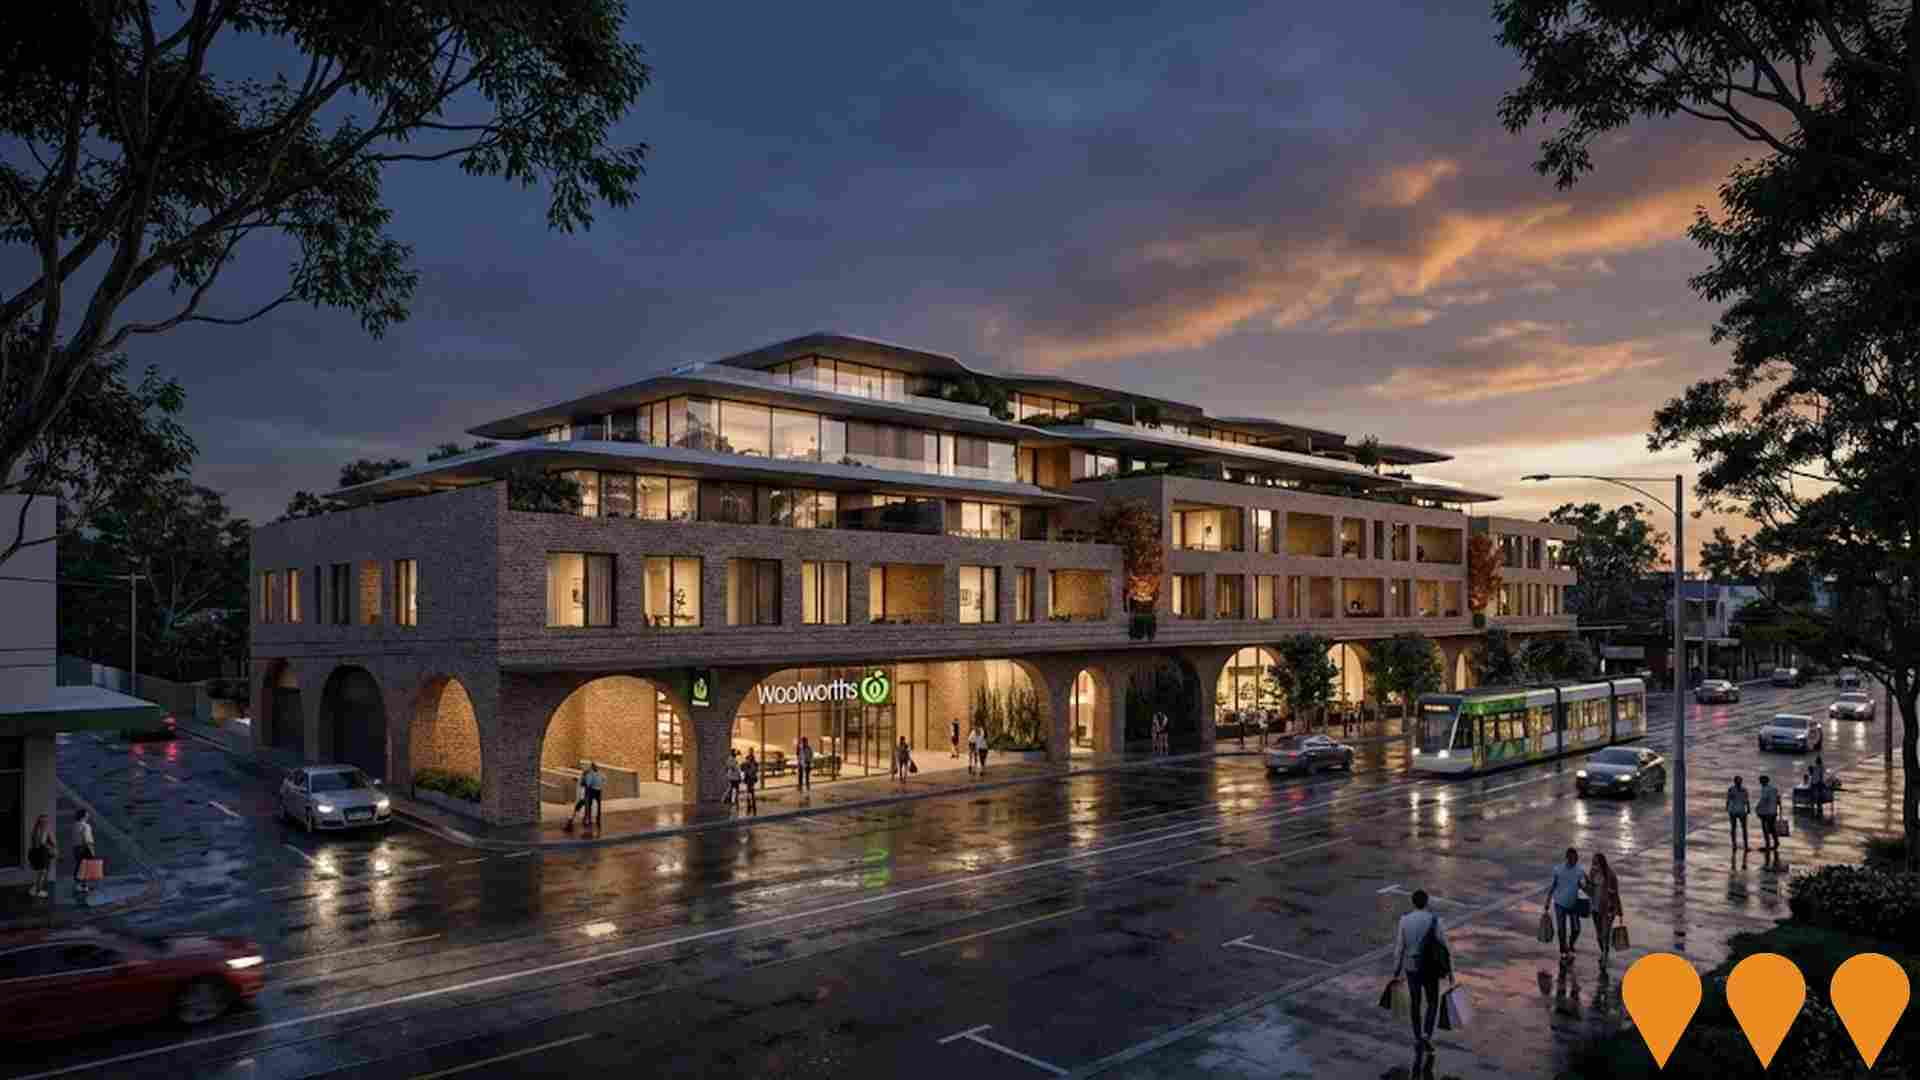
 Denotes AI-based impression for illustrative purposes only, not to be taken as definitive under any circumstances. Please follow links and conduct other investigations from the project's source for actual imagery. Developers and project owners wishing us to use original imagery please Contact Us and we will do so.
Frequently Asked Questions - Infrastructure
Suburban Rail Loop East
First stage of Melbourne's transformational 90km orbital rail network, SRL East delivers 26km of twin underground tunnels between Cheltenham and Box Hill. The project includes six new underground stations (Cheltenham, Clayton, Monash, Glen Waverley, Burwood, Box Hill) and a transport superhub at Clayton. Early and main works are underway across all station sites, with TBMs arriving in late 2025 and tunnelling expected to start in 2026, launching from Clarinda and Burwood. The project connects key activity centres, employment hubs, Monash University, Deakin University, and major health facilities. It will feature fully automated trains, create up to 8,000 direct construction jobs, and enable 70,000 new homes by the 2050s. Passenger services are targeted for 2035.
Chadstone Activity Centre Plan
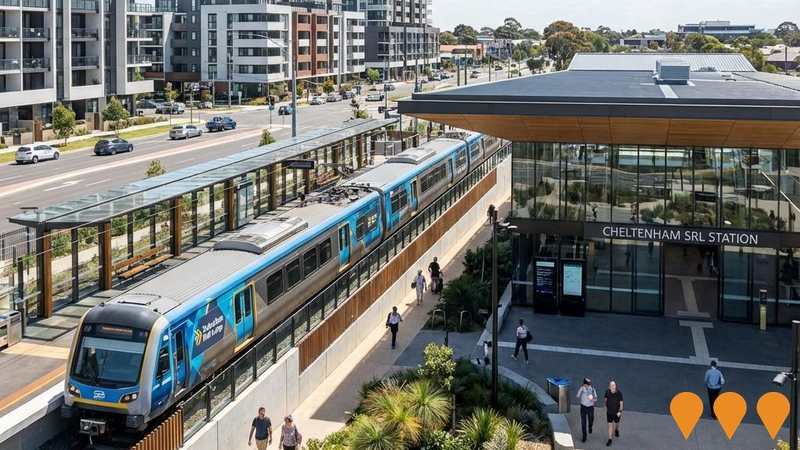
Comprehensive 30-year Activity Centre Plan by the Victorian Planning Authority (VPA) and the Department of Transport and Planning (DTP) to guide the area's growth for the next few decades, facilitating approximately **6,500 to 8,000 new homes** by 2051. The plan provides a framework for more homes in the Activity Centre Core (closest to the shopping centre) and surrounding **walkable catchment** with lower-rise apartments and townhouses. This plan has been **finalised** following two rounds of community consultation and has been prepared, adopted and approved through **Amendment GC252** to local Planning Schemes, making it law as of September 2024. A new, streamlined planning process is introduced in the core, along with an **infrastructure funding mechanism**. The estimated completion year of the plan's objectives remains 2054.
Caulfield Village
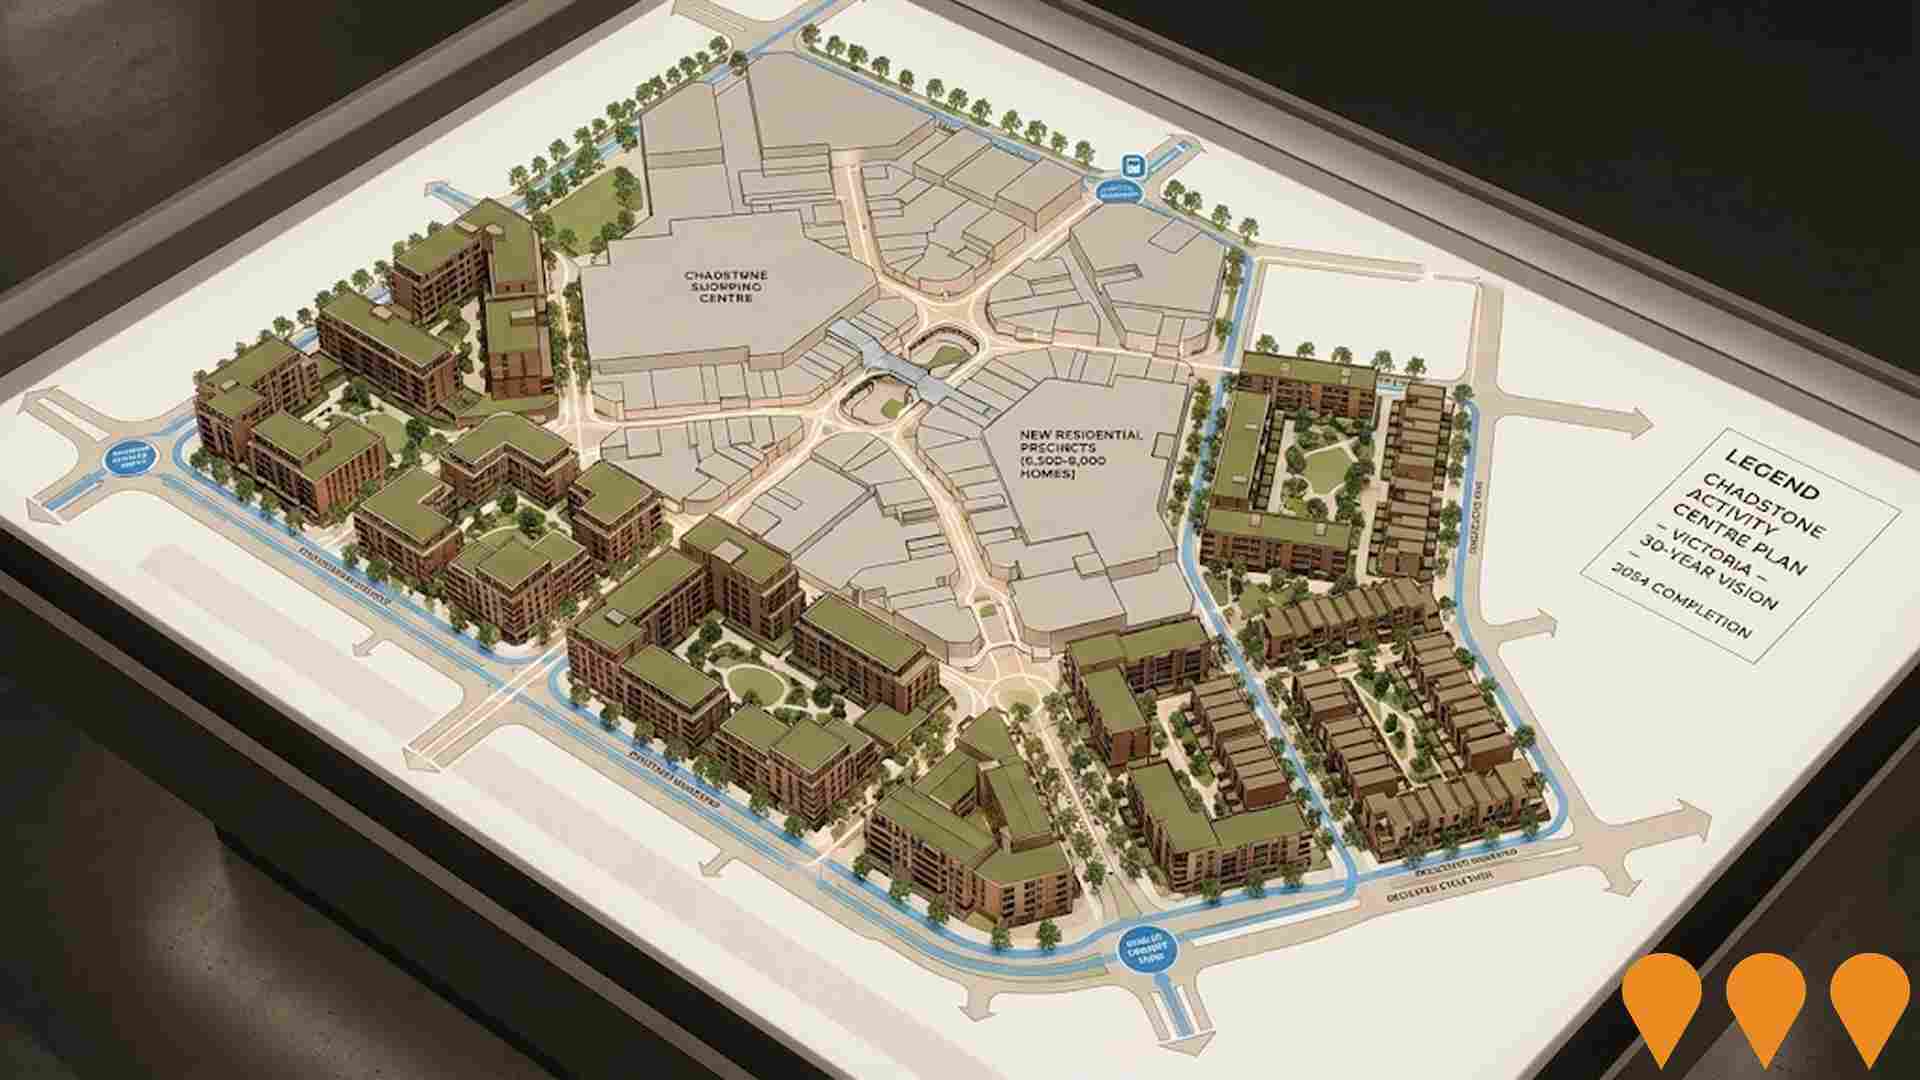
A $1.2 billion masterplanned mixed-use precinct on the former Caulfield Racecourse reserve site. Delivering approximately 2,000 apartments (including build-to-rent and retirement living), 20,000 sqm of retail (supermarket, fresh food market, specialty shops), cinema, medical centre, childcare, hotel and commercial office space across three precincts. Precinct 1 (retail core) completed 2018-2019. Precinct 2 North (REALM Caulfield - 437 BTR apartments) completed 2022. Precinct 2 South (390 apartments) completed 2019. Precinct 3 (final residential stages) is under construction with multiple stages progressing in 2025, expected completion by 2030.
Caulfield Station Upgrade
Major upgrade of Caulfield Station to support the Metro Tunnel Project opening in 2025. The station will become a key interchange for Sunbury, Cranbourne and Pakenham lines, requiring new overhead concourse, lifts to all platforms, wider platforms, and barrier-free transfers to handle significantly increased passenger volumes. The upgrade is currently in detailed planning and design phase with Rail Projects Victoria, with community advocacy continuing for full funding commitment.
Caulfield Plaza Redevelopment
Major revitalisation of Caulfield Plaza to modernise retail facilities serving Monash University and surrounding communities. Project includes revitalised retail areas, improved pedestrian connections via Princes Avenue redevelopment, reconfigured parking, and enhanced outdoor spaces. Strip-out demolition completed July-September 2024. Seeking high-quality retailers has extended timeline with reopening scheduled for first half of 2026.
173 Burke Road Mixed-Use Development
Five-storey mixed-use development featuring 60 residential apartments, including 10% affordable housing, above a full-line Woolworths supermarket. The project includes an additional 3-storey building at 28 Hope Street. Designed by Cera Stribley, the development targets a 5-star Green Star rating and features artisanal brickwork with inverted arches honoring Glen Iris heritage while reflecting modern architectural design.
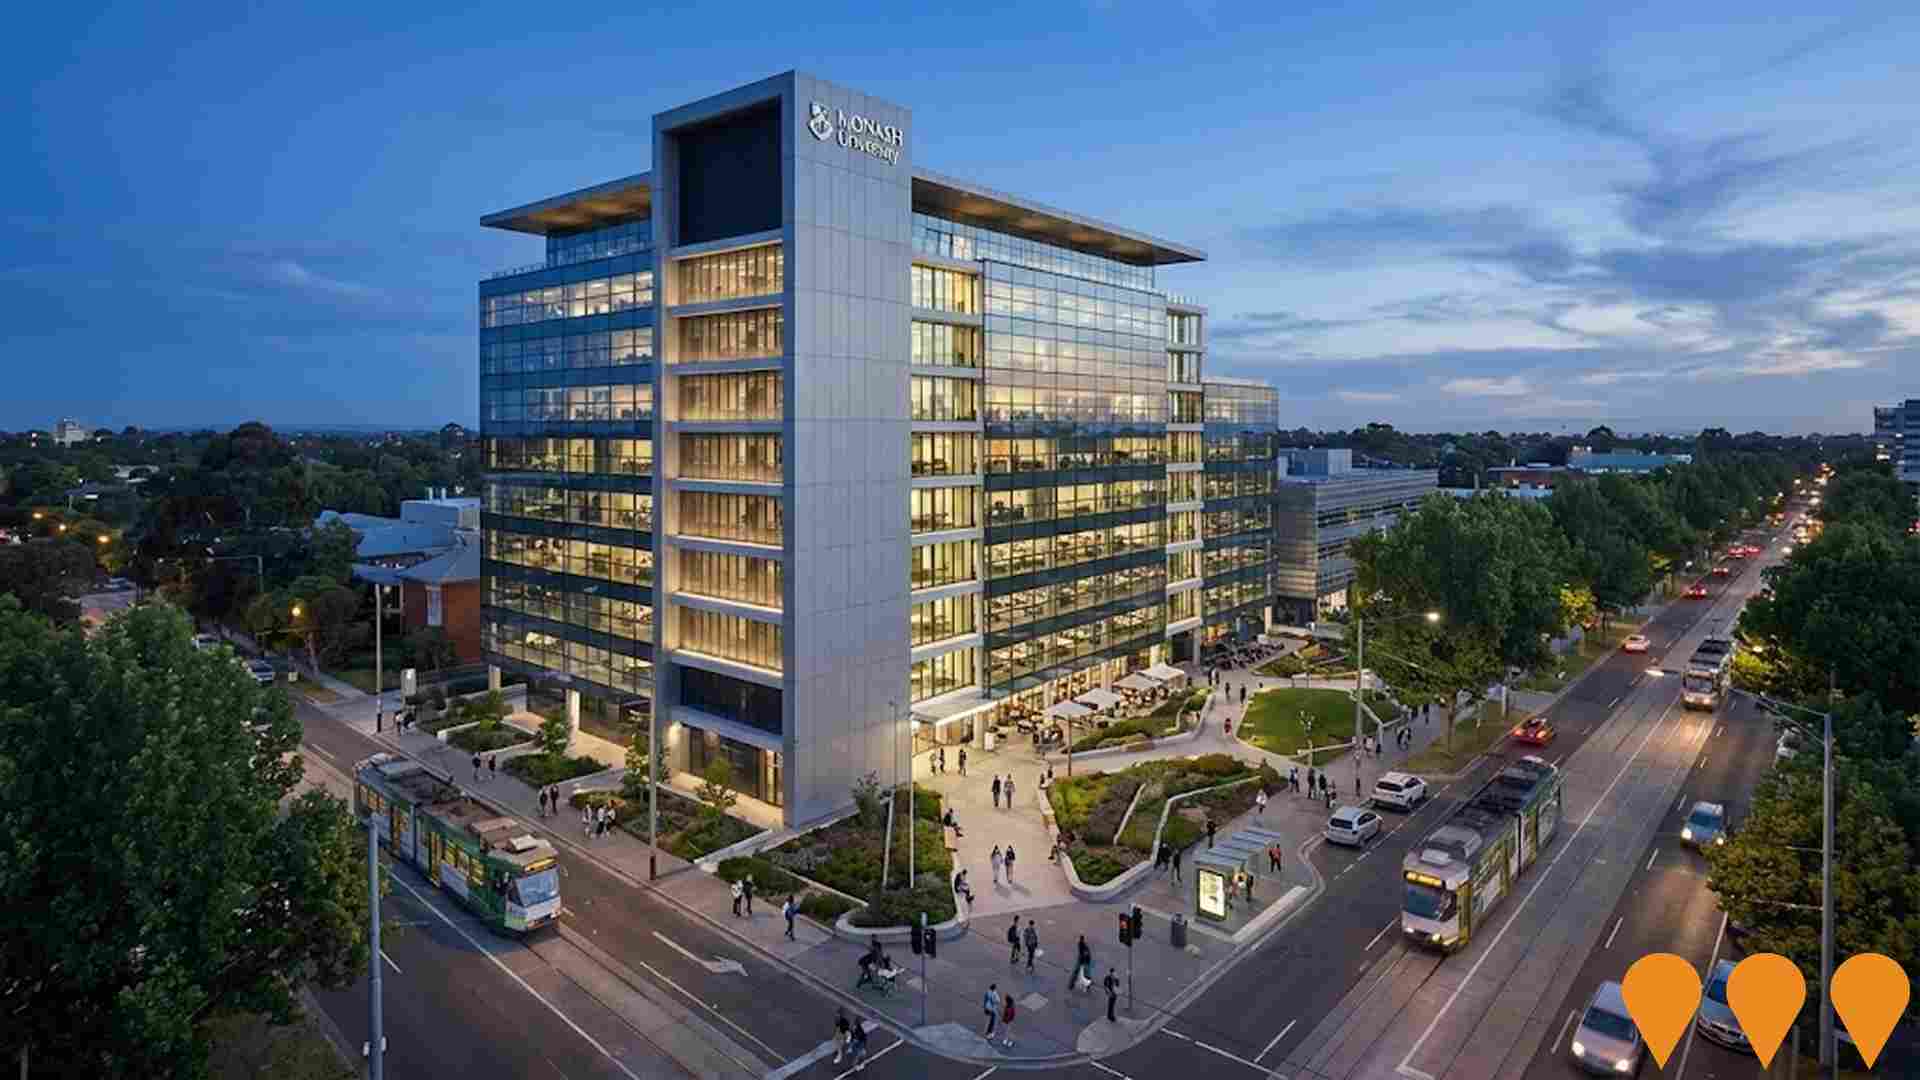
Monash University Caulfield Campus Expansion
The expansion involves developing the Derby Road precinct, creating a new University Square as the campus heart linked to Caulfield Station, improving street interfaces and connectivity, and enhancing integration with surrounding community activities.
Housing Choices Carnegie - Egan Street
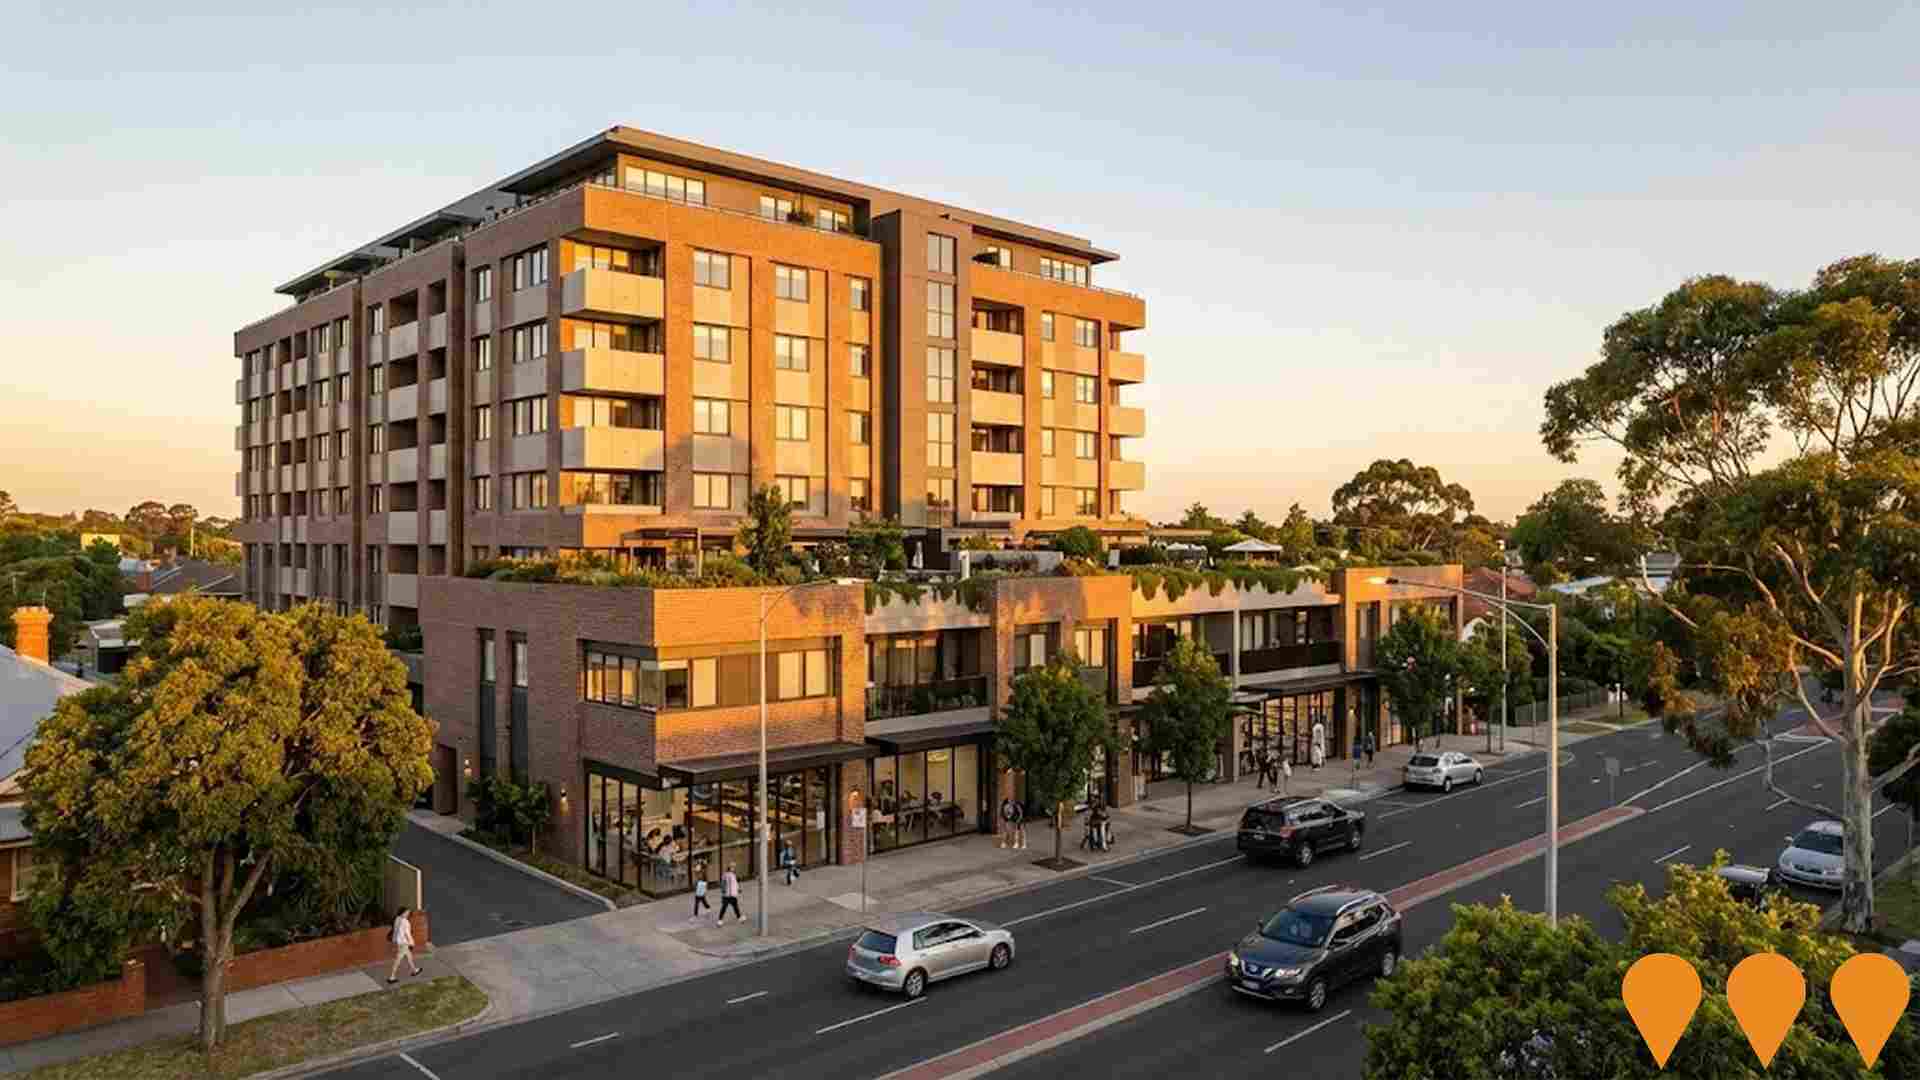
106 one and two-bedroom affordable housing apartments across 10 levels, part of the Victorian Government's Big Housing Build program. Designed by Bruce Henderson Architects and constructed by Buxton Construction, the project includes office space, a 3-level basement, and a landscaped rooftop terrace, aiming to provide quality affordable housing for low to moderate income earners.
Employment
Employment performance in Malvern East exceeds national averages across key labour market indicators
Malvern East has a highly educated workforce with strong representation in professional services. As of September 2025, its unemployment rate is 3.3%.
Over the past year, employment has remained relatively stable. In September 2025, 14,024 residents are employed, with an unemployment rate 1.4% lower than Greater Melbourne's rate of 4.7%. Workforce participation is at 67.2%, slightly higher than Greater Melbourne's 64.1%. Key industries include health care & social assistance, professional & technical services, and education & training.
The area has a notable concentration in professional & technical jobs, with employment levels at 1.5 times the regional average. Conversely, construction shows lower representation at 6.1% compared to the regional average of 9.7%. The worker-to-resident ratio is 0.6, indicating above-average local employment opportunities. In the year to September 2025, labour force levels increased by 0.7%, while employment declined by 0.2%, leading to a rise in unemployment rate by 0.9 percentage points. In comparison, Greater Melbourne recorded employment growth of 3.0% and labour force growth of 3.3%, with an unemployment increase of 0.3 percentage points. State-level data from 25-Nov shows Victoria's employment grew by 1.13% year-on-year, adding 41,950 jobs, with the state unemployment rate at 4.7%. Nationally, employment growth was 0.14%, and the unemployment rate was 4.3%. Jobs and Skills Australia's national employment forecasts from May-25 project overall employment growth of 6.6% over five years and 13.7% over ten years. Applying these projections to Malvern East's employment mix suggests local employment should increase by 7.3% over five years and 14.6% over ten years, based on a simple weighting extrapolation for illustrative purposes.
Frequently Asked Questions - Employment
Income
Income metrics indicate excellent economic conditions, with the area achieving higher performance than 75% of national locations assessed by AreaSearch
The median income among taxpayers in Malvern East SA2 was $62,754 in financial year 2022. The average income stood at $111,222 during the same period. These figures are higher than those for Greater Melbourne, which had a median income of $54,892 and an average income of $73,761. Based on Wage Price Index growth of 12.16% since financial year 2022, current estimates suggest the median income would be approximately $70,385 and the average income around $124,747 by September 2025. According to 2021 Census figures, household incomes in Malvern East rank between the 83rd and 87th percentiles nationally. Income distribution shows that 30.5% of residents earn over $4,000 per week, compared to regional levels where the highest bracket is $1,500 - 2,999. This affluence is reflected in premium retail and service offerings available in the area. Housing accounts for 14.7% of income, with residents ranking within the 87th percentile for disposable income. The area's SEIFA income ranking places it in the 9th decile.
Frequently Asked Questions - Income
Housing
Malvern East displays a diverse mix of dwelling types, with ownership patterns similar to the broader region
Malvern East's dwelling structures, as per the latest Census, consisted of 53.5% houses and 46.5% other dwellings (semi-detached, apartments, 'other' dwellings). This compares to Melbourne metro's 46.2% houses and 53.8% other dwellings. Home ownership in Malvern East was 36.2%, similar to Melbourne metro, with mortgaged dwellings at 32.0% and rented ones at 31.8%. The median monthly mortgage repayment in the area was $2,944, higher than Melbourne metro's average of $2,817. Median weekly rent in Malvern East was $421, compared to Melbourne metro's $416. Nationally, Malvern East's mortgage repayments were significantly higher at $2,944 versus the Australian average of $1,863, and rents were substantially above the national figure of $375.
Frequently Asked Questions - Housing
Household Composition
Malvern East features high concentrations of group households, with a higher-than-average median household size
Family households account for 67.8% of all households, including 34.2% couples with children, 24.6% couples without children, and 7.7% single parent families. Non-family households constitute the remaining 32.2%, with lone person households at 26.3% and group households comprising 5.9%. The median household size is 2.5 people, which is larger than the Greater Melbourne average of 2.4.
Frequently Asked Questions - Households
Local Schools & Education
Educational achievement in Malvern East places it within the top 10% nationally, reflecting strong academic performance and high qualification levels across the community
In Malvern East, the educational attainment significantly exceeds national averages. Among residents aged 15 and above, 53.4% possess university qualifications, compared to 30.4% nationally and 33.4% in Victoria. The area's high proportion of residents with bachelor degrees (33.7%), postgraduate qualifications (14.9%), and graduate diplomas (4.8%) contributes to this advantage. Vocational pathways are also pursued, with advanced diplomas accounting for 10.0% and certificates for 8.8%.
Educational participation is notably high, with 32.2% of residents currently enrolled in formal education. This includes 10.4% in tertiary education, 8.3% in primary education, and 8.0% pursuing secondary education.
Frequently Asked Questions - Education
Schools Detail
Nearby Services & Amenities
Transport
Transport servicing is high compared to other areas nationally based on assessment of service frequency, route connectivity and accessibility
The analysis of public transport in Malvern East indicates that there are 102 active transport stops operating within the area. These stops offer a mix of train, light rail, and bus services. They are serviced by 37 individual routes which collectively provide 14,093 weekly passenger trips.
The accessibility of these transport services is rated as excellent, with residents typically located 195 meters from their nearest transport stop. On average, there are 2,013 trips per day across all routes, equating to approximately 138 weekly trips per individual stop.
Frequently Asked Questions - Transport
Transport Stops Detail
Health
Malvern East's residents are extremely healthy with younger cohorts in particular seeing very low prevalence of common health conditions
Analysis of health metrics shows strong performance throughout Malvern East. Younger cohorts particularly had very low prevalence of common health conditions. The rate of private health cover was exceptionally high at approximately 76% of the total population (18,107 people), compared to 80.7% across Greater Melbourne and a national average of 55.3%.
The most common medical conditions were asthma and mental health issues, impacting 6.8 and 6.7% of residents respectively. A total of 74.2% declared themselves completely clear of medical ailments, compared to 73.4% across Greater Melbourne. The area has 17.3% of residents aged 65 and over (4,103 people), which is lower than the 18.8% in Greater Melbourne. Health outcomes among seniors are above average and require more attention than the broader population.
Frequently Asked Questions - Health
Cultural Diversity
The level of cultural diversity witnessed in Malvern East was found to be above average when compared nationally for a number of language and cultural background related metrics
Malvern East had a higher cultural diversity compared to most local areas, with 30.6% of its residents born overseas and 26.3% speaking a language other than English at home. Christianity was the predominant religion in Malvern East, accounting for 47.6% of the population. However, Judaism was notably overrepresented, comprising 3.0% of Malvern East's population compared to 4.1% across Greater Melbourne.
The top three ancestry groups were English (22.4%), Australian (19.2%), and Other (9.1%). Some ethnic groups showed significant variations: Greek at 5.6% in Malvern East versus 4.6% regionally, Polish at 1.2% versus 1.4%, and Sri Lankan at 0.8% versus 0.6%.
Frequently Asked Questions - Diversity
Age
Malvern East's population is slightly younger than the national pattern
Malvern East has a median age of 37 years, matching Greater Melbourne's figure and closely aligning with Australia's median age of 38 years. The 15-24 age group makes up 17.2% of Malvern East's population, higher than Greater Melbourne's percentage, while the 35-44 cohort constitutes 12.2%, lower than Greater Melbourne's figure. Between 2021 and the present, the 15-24 age group has increased from 14.5% to 17.2% of the population, and the 25-34 cohort has risen from 14.7% to 15.8%. Conversely, the 45-54 cohort has decreased from 13.8% to 12.3%, and the 5-14 age group has fallen from 11.3% to 10.1%. Looking ahead to 2041, demographic projections indicate significant changes in Malvern East's age structure. The 35-44 cohort is projected to grow by 29%, adding 849 people and reaching a total of 3,741 from the current figure of 2,891. Meanwhile, the 15-24 group is expected to decrease by 79 residents.
