Chart Color Schemes
This analysis uses ABS Statistical Areas Level 2 (SA2) boundaries, which can materially differ from Suburbs and Localities (SAL) even when sharing similar names.
SA2 boundaries are defined by the Australian Bureau of Statistics and are designed to represent communities for statistical reporting (e.g., census and ERP).
Suburbs and Localities (SAL) represent commonly-used suburb/locality names (postal-style areas) and may use different geographic boundaries. For comprehensive analysis, consider reviewing both boundary types if available.
est. as @ -- *
ABS ERP | -- people | --
2021 Census | -- people
Sales Activity
Curious about local property values? Filter the chart to assess the volume and appreciation (including resales) trends and regional comparisons, or scroll to the map below view this information at an individual property level.
Find a Recent Sale
Sales Detail
Population
Caulfield - South has seen population growth performance typically on par with national averages when looking at short and medium term trends
Caulfield - South's population was approximately 19,417 as of November 2025. This figure represents a growth of 1,342 people, or 7.4%, since the 2021 Census, which recorded a population of 18,075. The increase is inferred from the estimated resident population of 18,975 in June 2024 and an additional 324 validated new addresses since the Census date. This results in a population density ratio of 4,096 persons per square kilometer, placing Caulfield - South in the top 10% of national locations assessed by AreaSearch. The area's growth rate exceeded that of its SA4 region (7.1%), indicating it as a growth leader. Overseas migration was the primary driver of population growth during recent periods.
AreaSearch uses ABS/Geoscience Australia projections for each SA2 area, released in 2024 with a base year of 2022. For areas not covered by this data, AreaSearch employs VIC State Government's Regional/LGA projections from 2023, adjusted using a weighted aggregation method from LGA to SA2 levels. Growth rates by age group are applied across all areas for years 2032 to 2041. According to population projections, Caulfield - South is expected to grow by 3,101 persons by 2041, reflecting a total increase of 13.7% over the 17-year period.
Frequently Asked Questions - Population
Development
Recent residential development output has been above average within Caulfield - South when compared nationally
Caulfield - South has seen approximately 133 new homes approved annually over the past five financial years, totalling 666 homes. By June 2026, 22 approvals have been recorded so far this financial year. On average, 0.3 new residents arrive per new home each year between FY-21 and FY-25, indicating that supply is meeting or exceeding demand. The average construction value of new properties is $514,000, suggesting developers are targeting the premium market segment with higher-end properties.
This financial year has seen $109.5 million in commercial development approvals, demonstrating strong commercial development momentum. Compared to Greater Melbourne, Caulfield - South has recorded 11.0% more construction per person over the past five years, providing reasonable buyer options while sustaining existing property demand. However, building activity has slowed in recent years. New building activity comprises 17.0% standalone homes and 83.0% townhouses or apartments, reflecting a shift towards denser development to cater to downsizers, investors, and entry-level buyers. This trend indicates decreasing availability of developable sites and changing lifestyles.
With around 178 people per dwelling approval, Caulfield - South exhibits characteristics of a growth area. According to the latest AreaSearch quarterly estimate, the area is expected to grow by approximately 2,659 residents through to 2041. With current construction levels, housing supply should adequately meet demand, creating favourable conditions for buyers while potentially enabling growth that exceeds current forecasts.
Frequently Asked Questions - Development
Infrastructure
Caulfield - South has strong levels of nearby infrastructure activity, ranking in the top 40% nationally
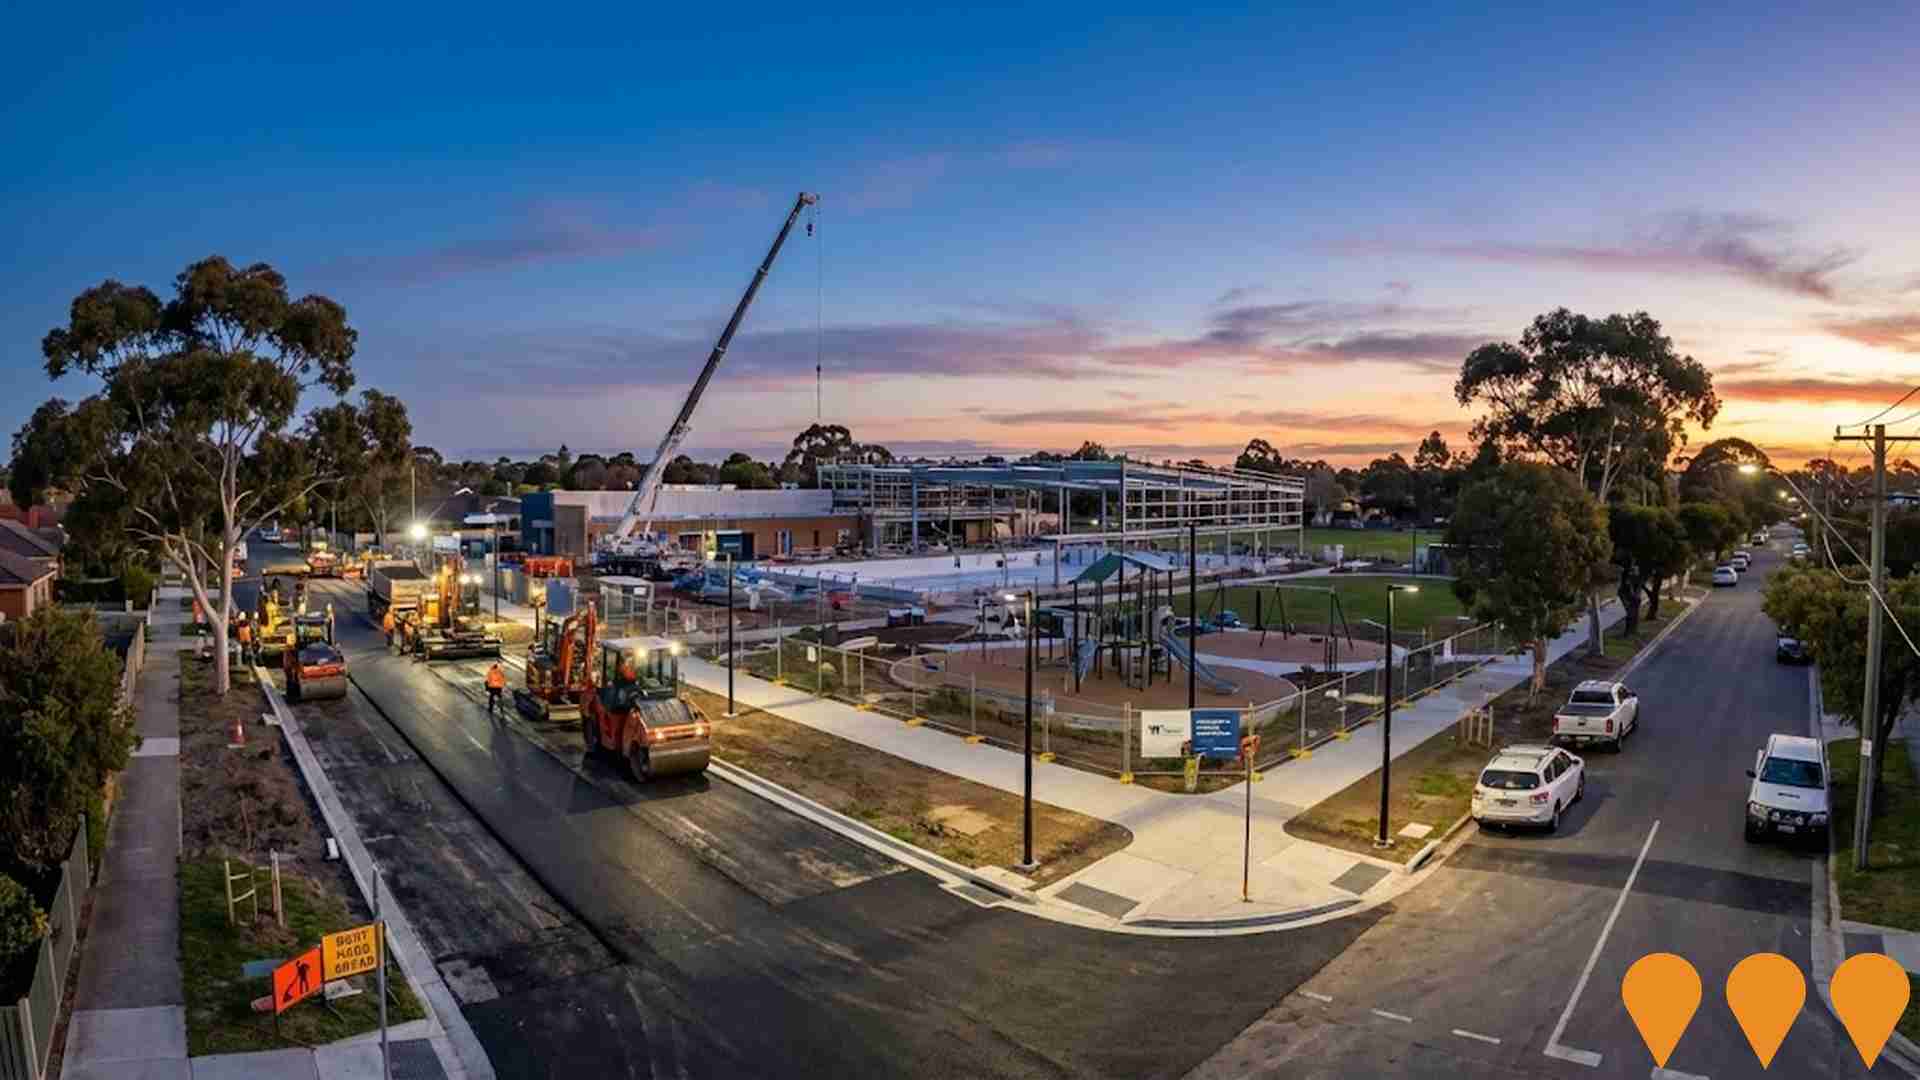
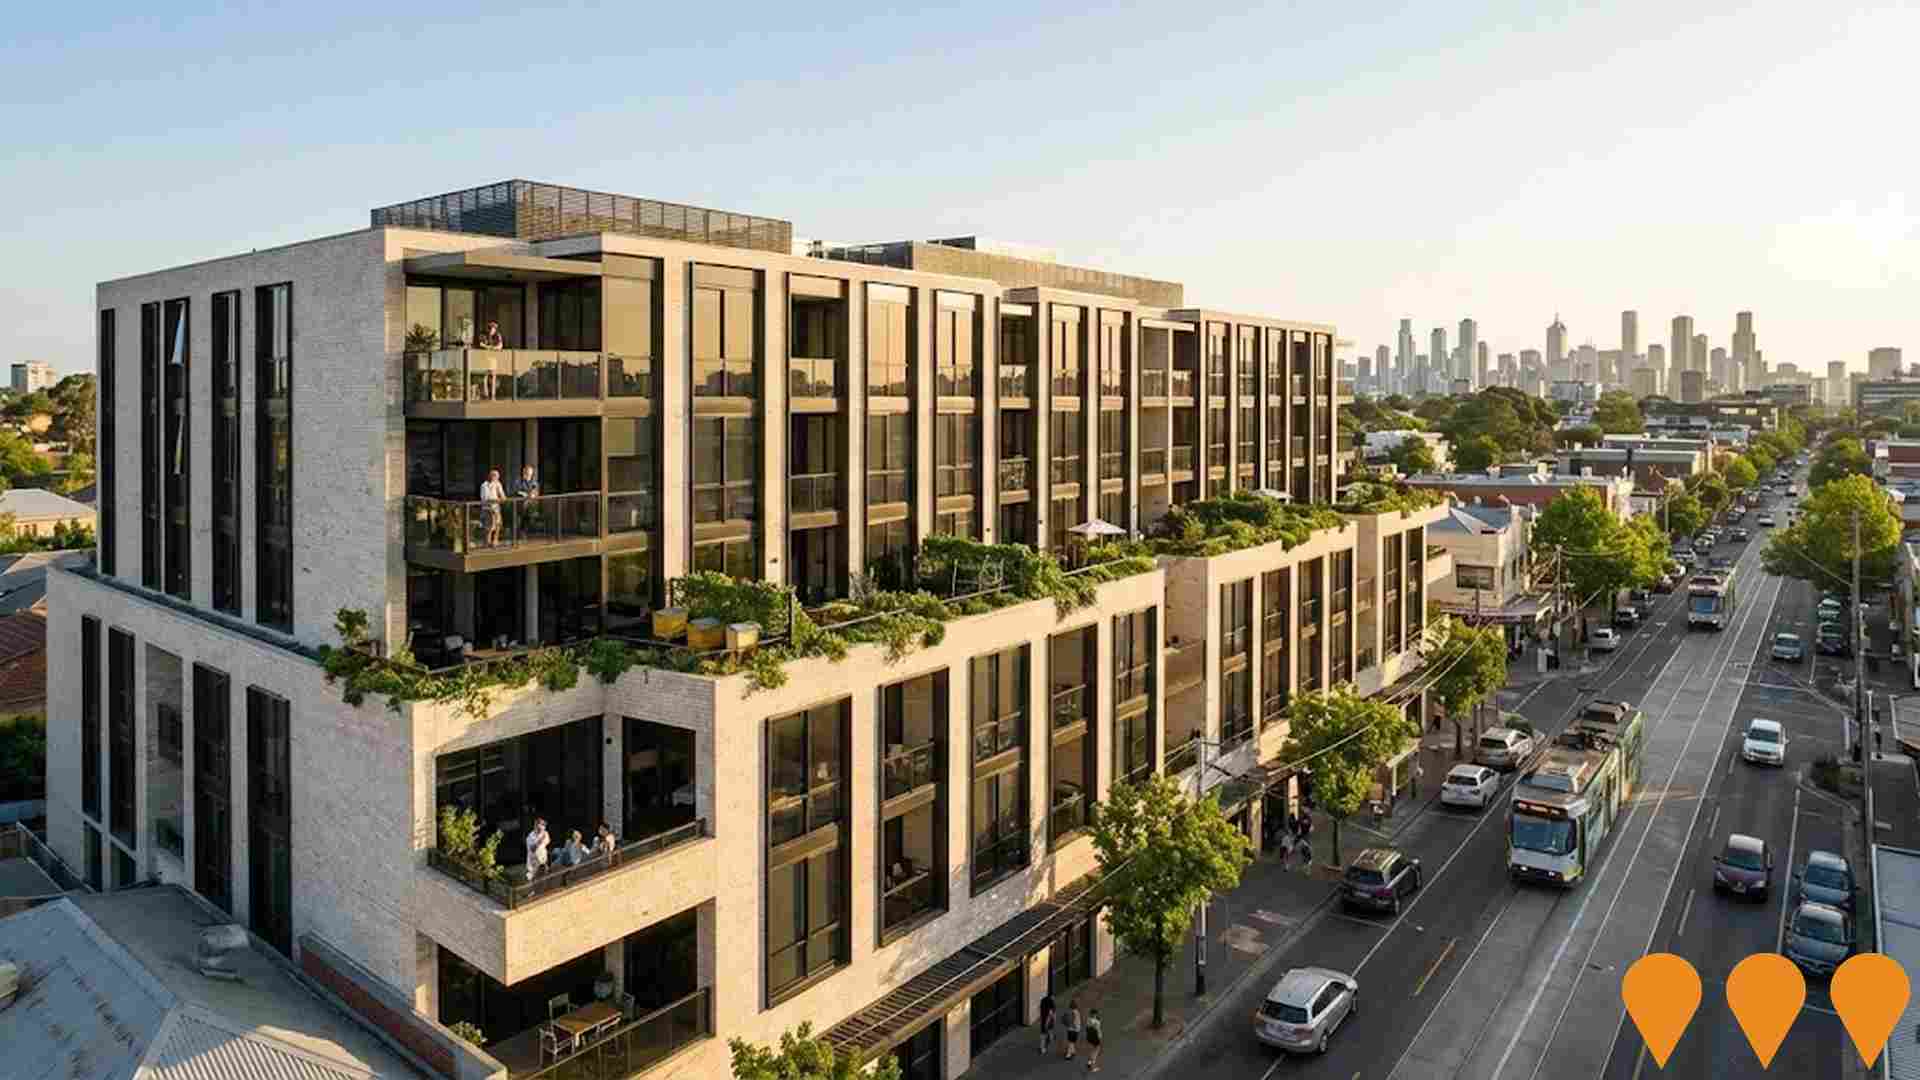
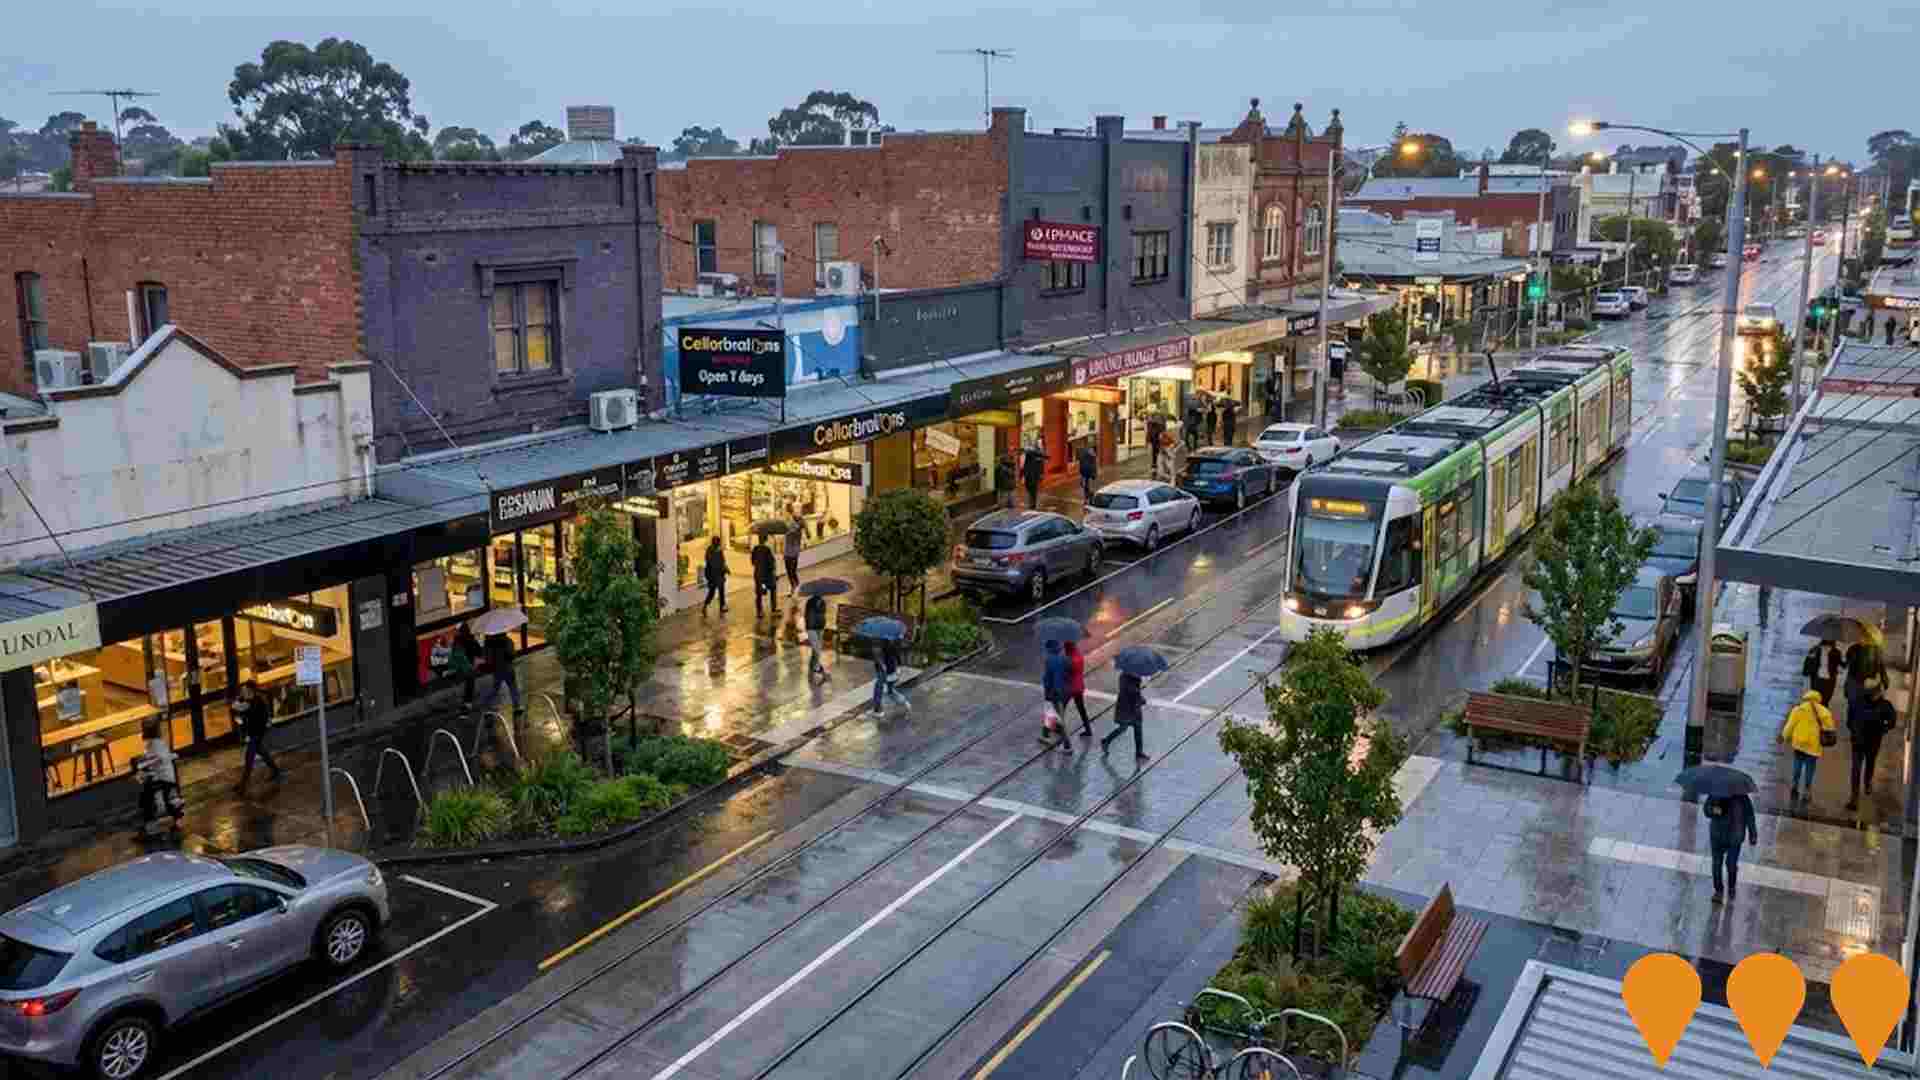
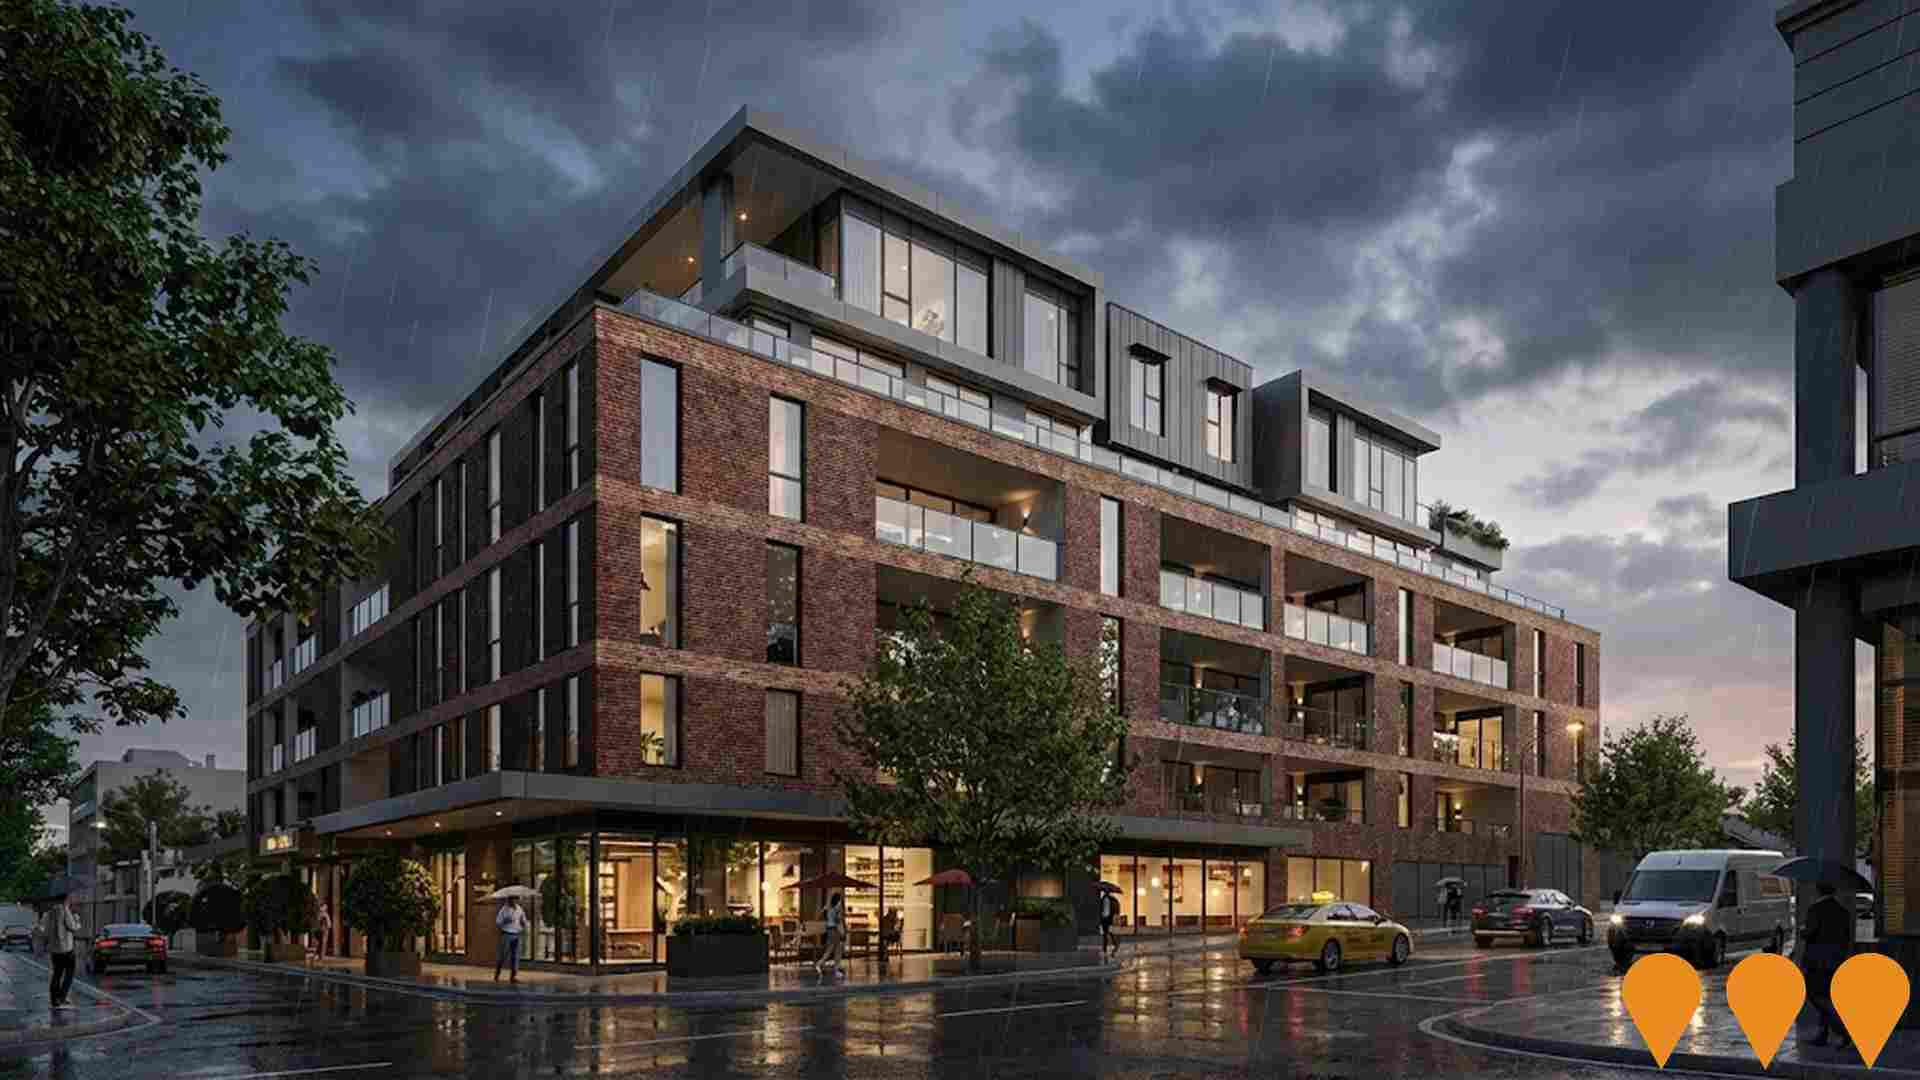
Changes to local infrastructure significantly influence an area's performance. AreaSearch has identified 15 projects likely impacting the area. Key projects include Former ABC Elsternwick Studio Site (8 Gordon Street), Olive Green, Elsternwick Cultural Precinct, and Fabric Residential Development. The following list details those most relevant.
Professional plan users can use the search below to filter and access additional projects.
INFRASTRUCTURE SEARCH
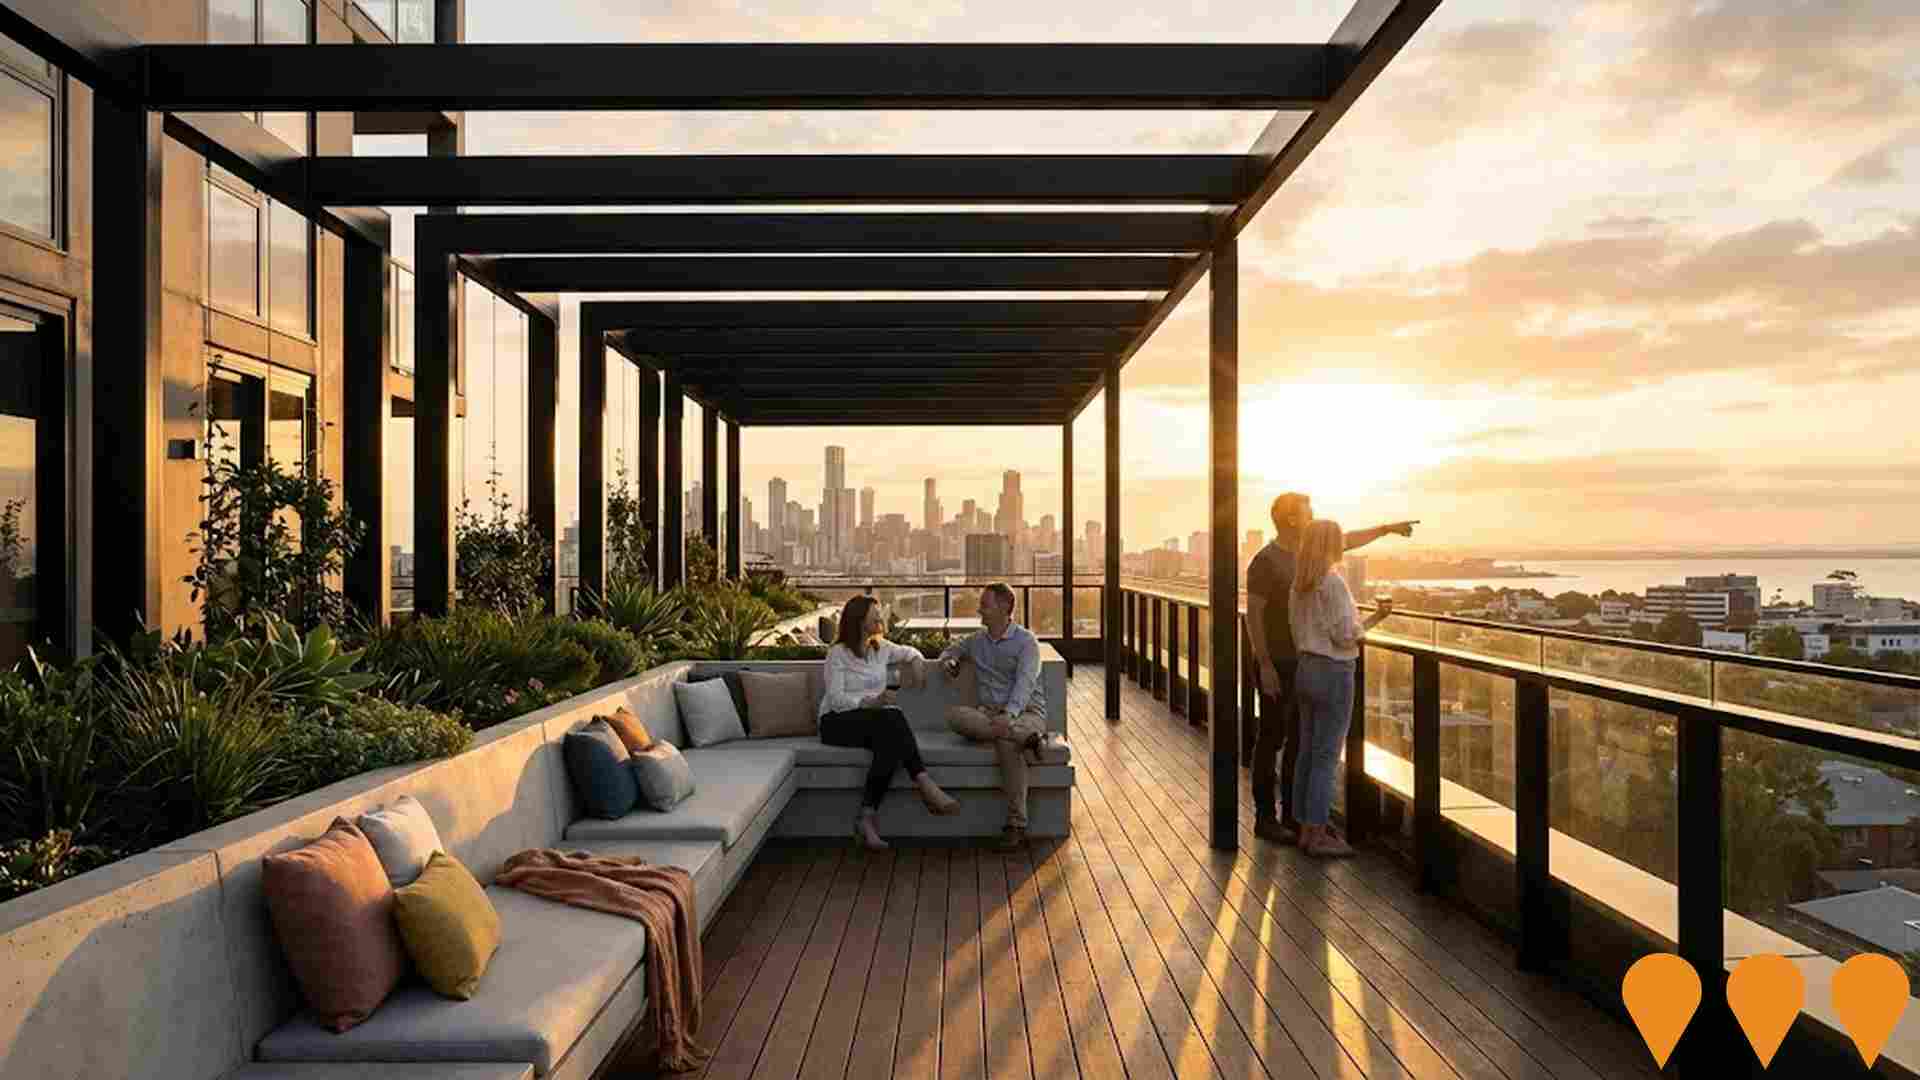
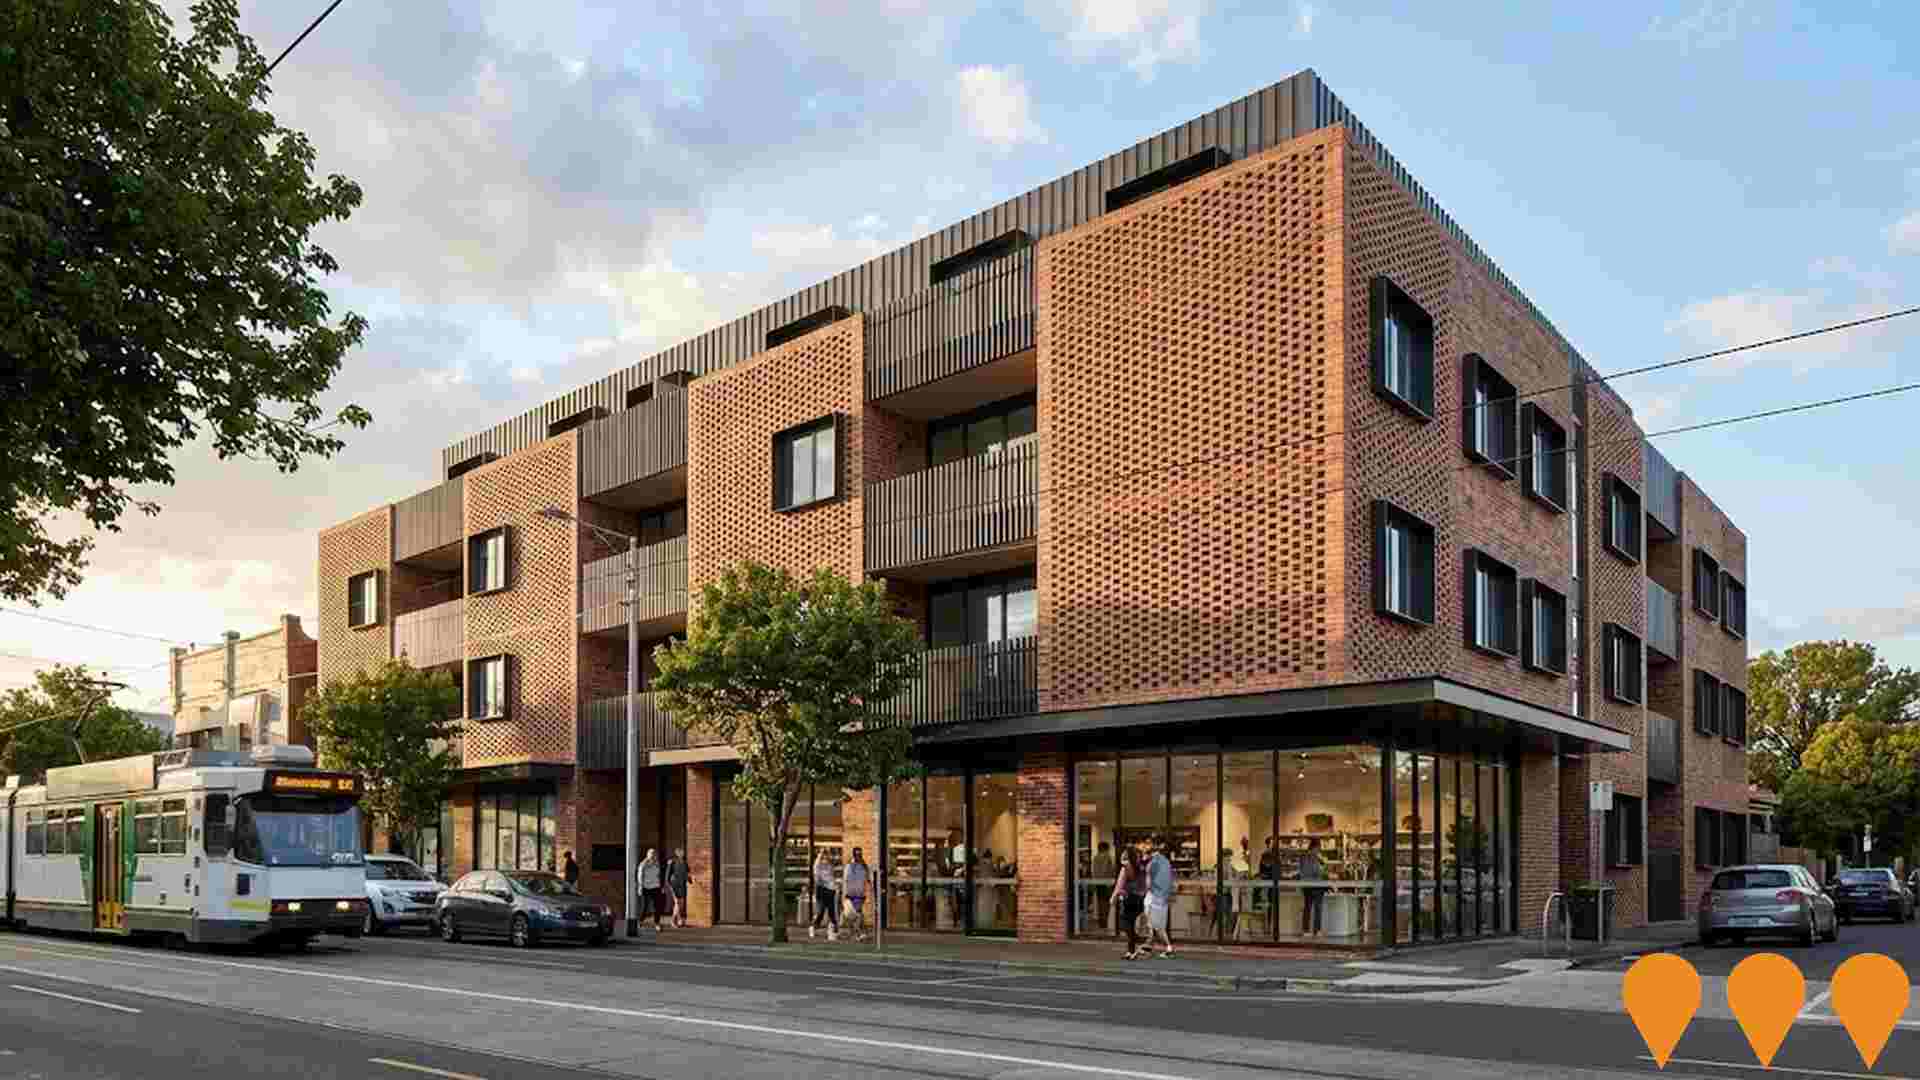
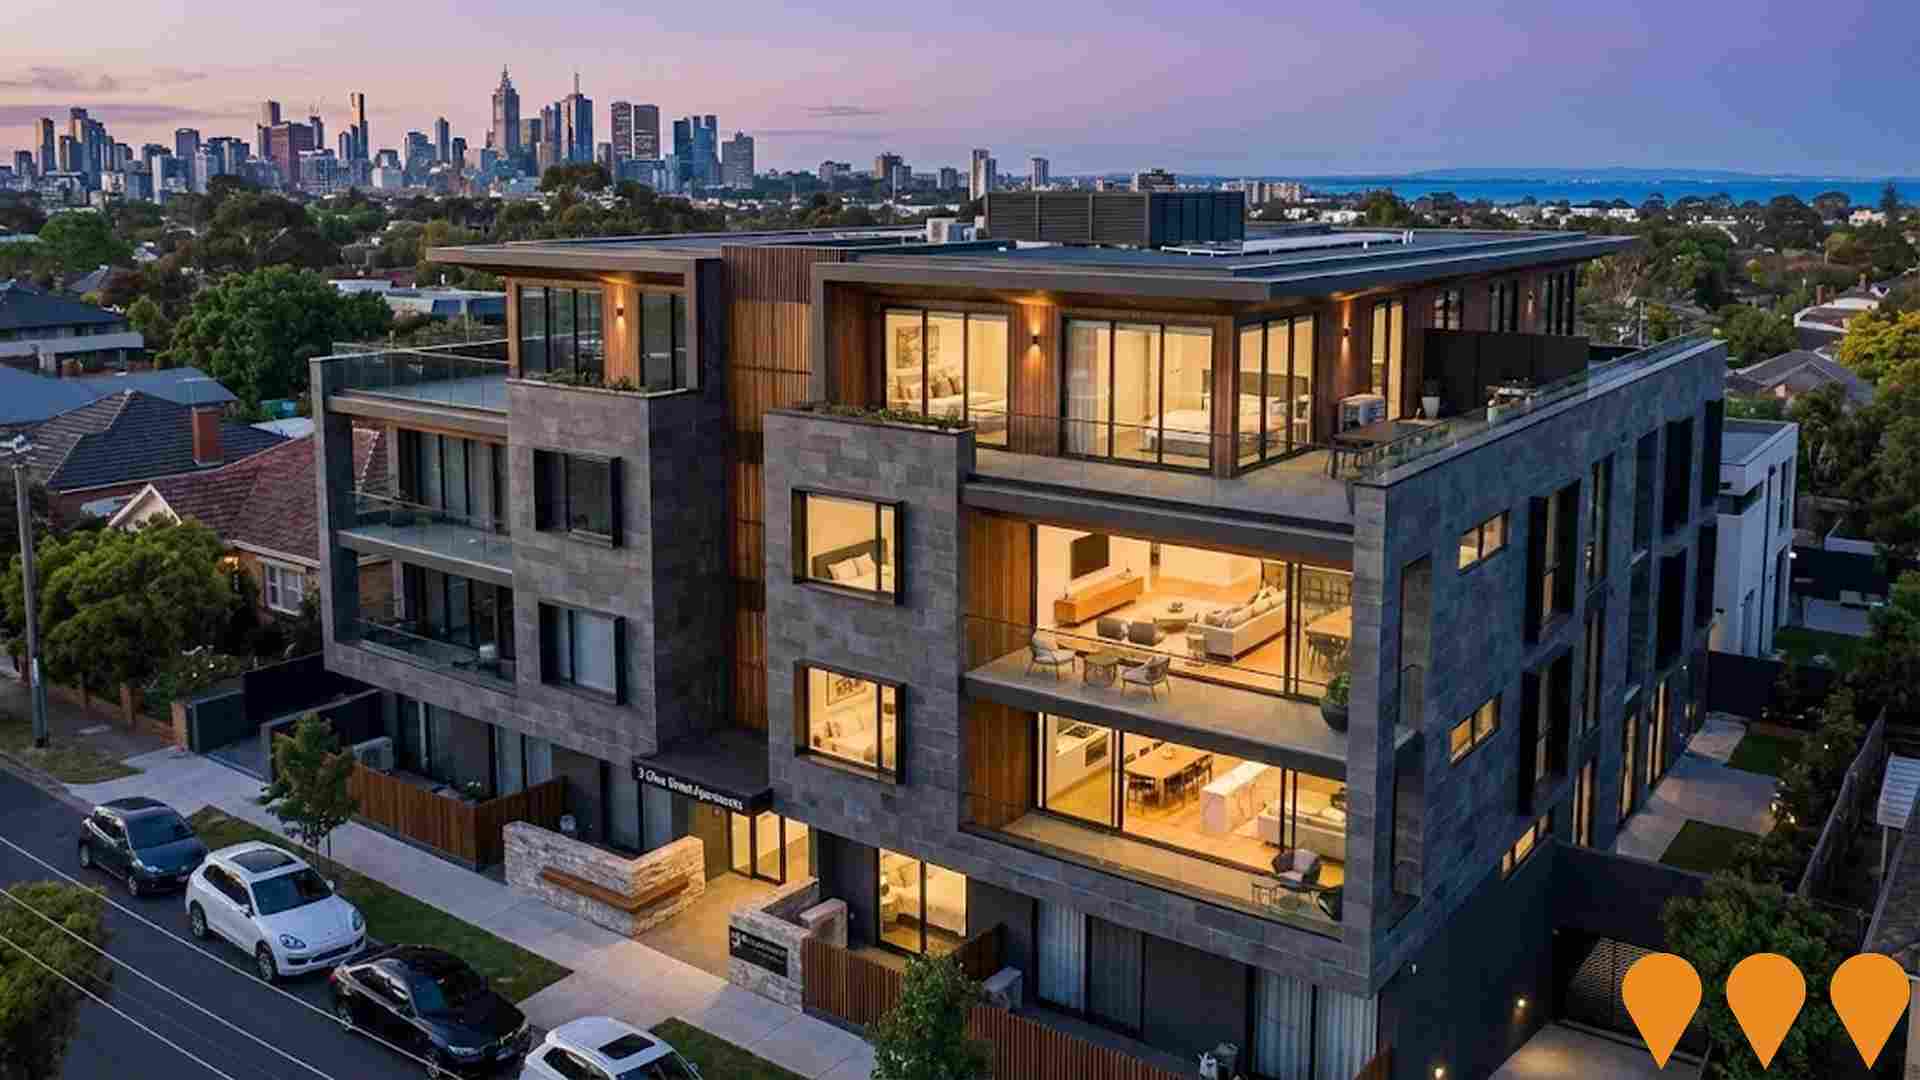
 Denotes AI-based impression for illustrative purposes only, not to be taken as definitive under any circumstances. Please follow links and conduct other investigations from the project's source for actual imagery. Developers and project owners wishing us to use original imagery please Contact Us and we will do so.
Frequently Asked Questions - Infrastructure
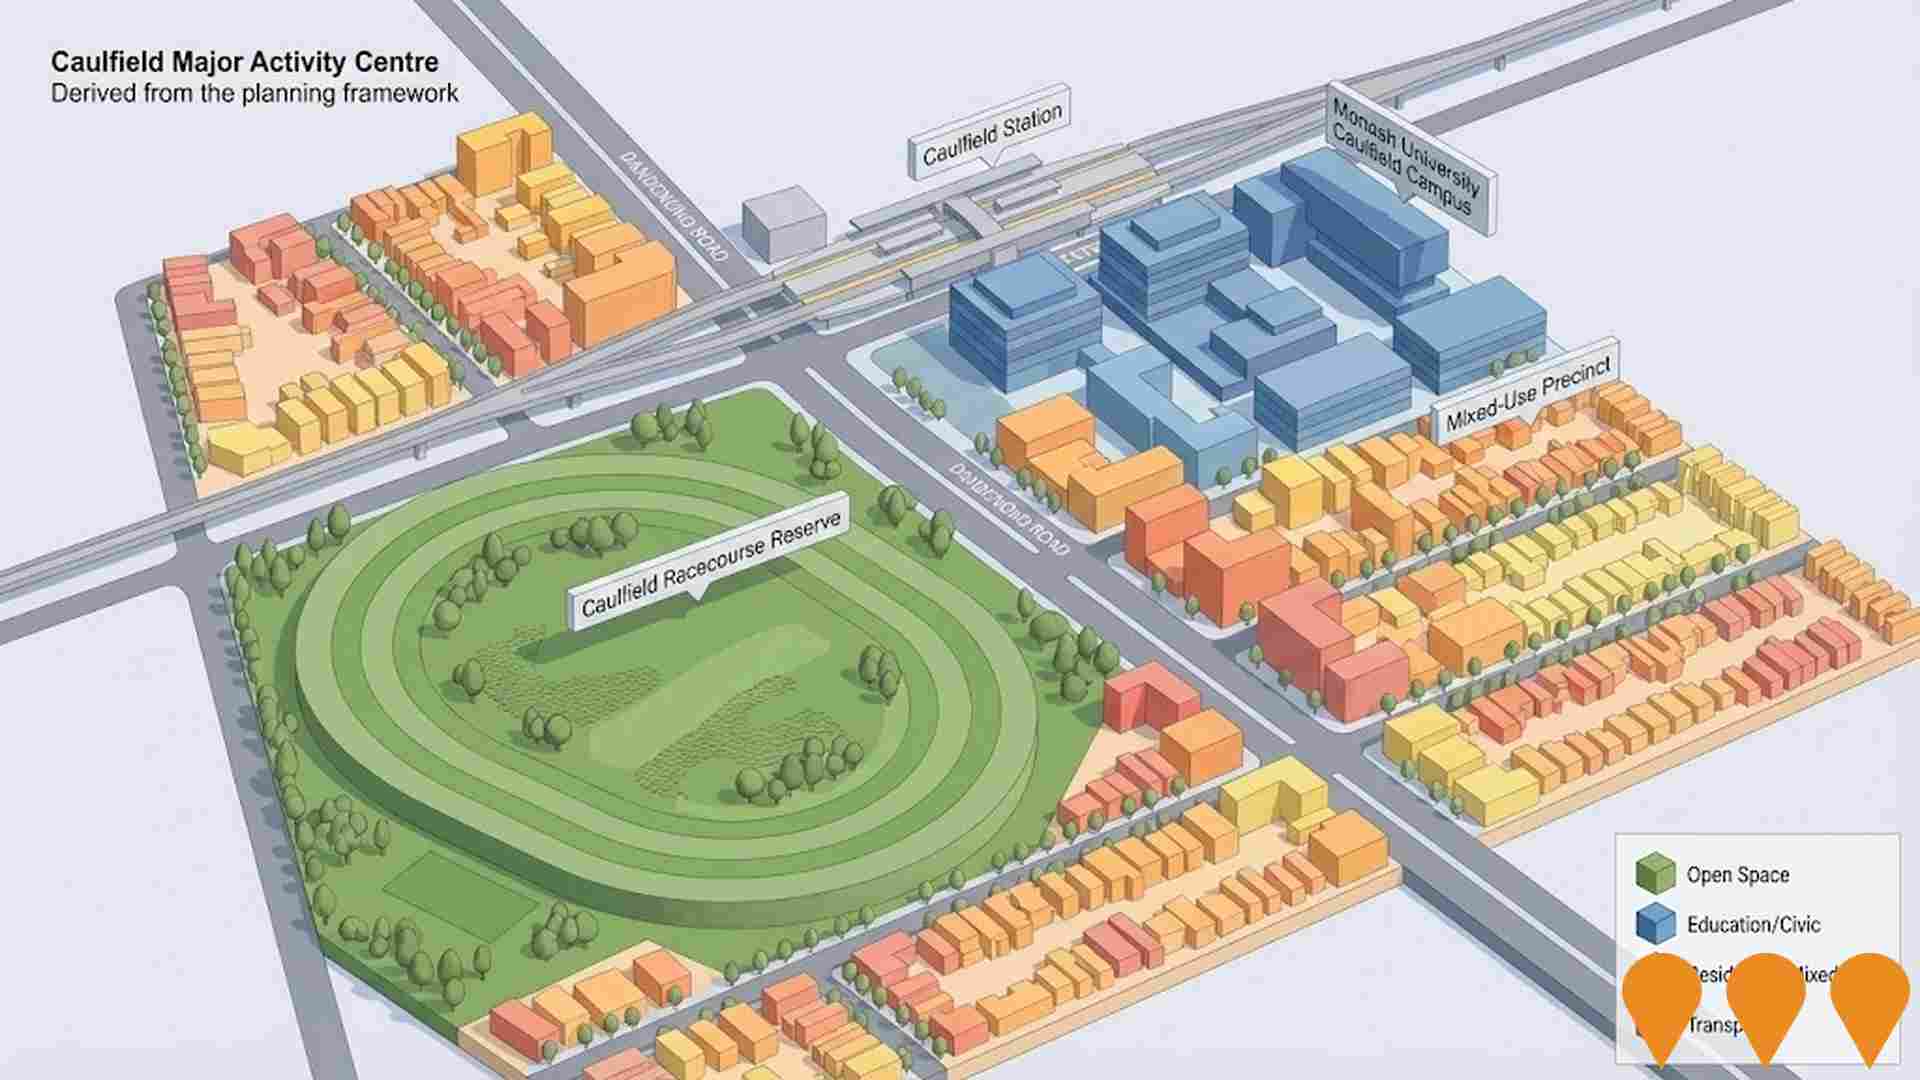
Caulfield Structure Plan
The Caulfield Structure Plan is a long-term planning framework for the 122-hectare Caulfield Major Activity Centre, adopted by Glen Eira City Council on 20 September 2022. It covers Caulfield Station, Caulfield Racecourse Reserve, Monash University Caulfield campus, Derby Road shopping strip, and surrounding residential/industrial areas. The plan facilitates coordinated urban renewal, enhanced connectivity, diverse housing, education/employment growth, recreation, and sustainable development. Planning Scheme Amendment C245glen was endorsed on 21 May 2024 and submitted to the Minister for Planning; as of November 2025, it remains awaiting authorisation for public exhibition. The VPA's primary role concluded in 2022 with handover to Council.
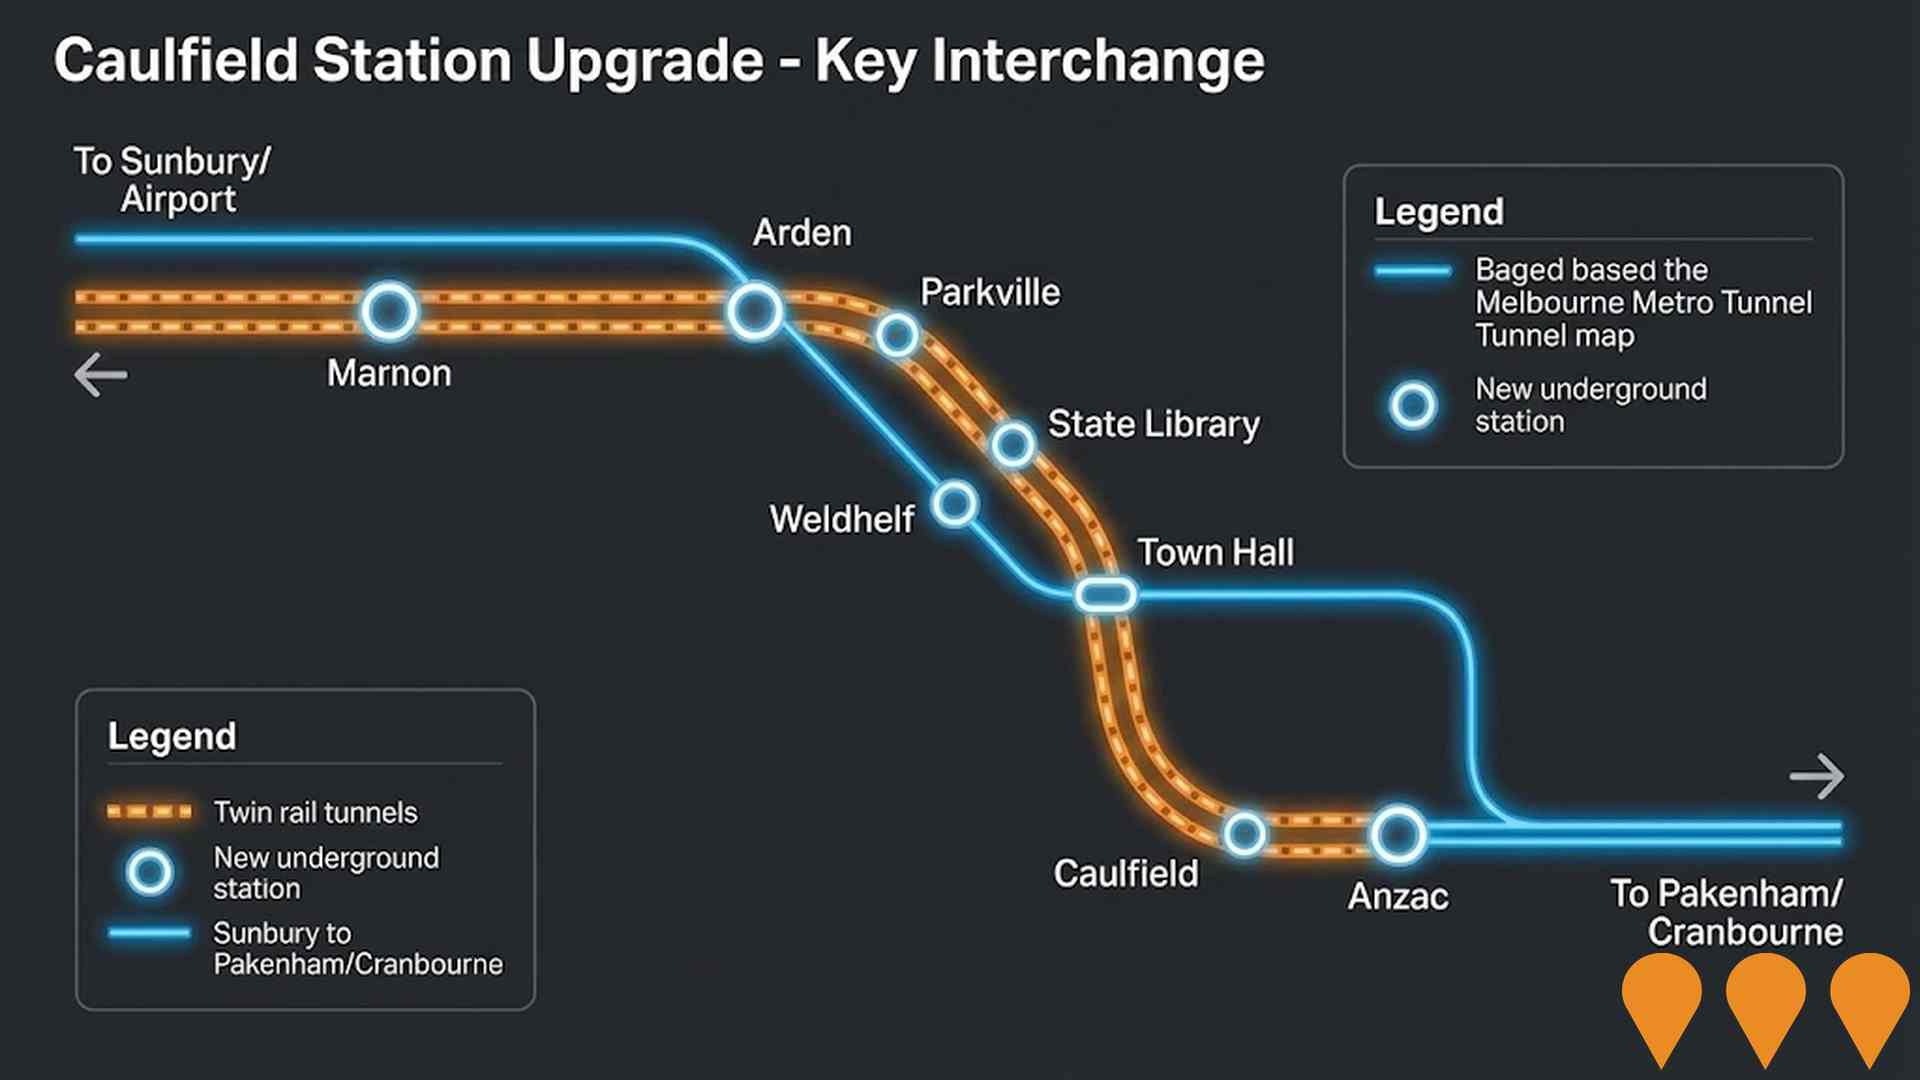
Caulfield Station Upgrade
Major upgrade of Caulfield Station to support the Metro Tunnel Project opening in 2025. The station will become a key interchange for Sunbury, Cranbourne and Pakenham lines, requiring new overhead concourse, lifts to all platforms, wider platforms, and barrier-free transfers to handle significantly increased passenger volumes. The upgrade is currently in detailed planning and design phase with Rail Projects Victoria, with community advocacy continuing for full funding commitment.
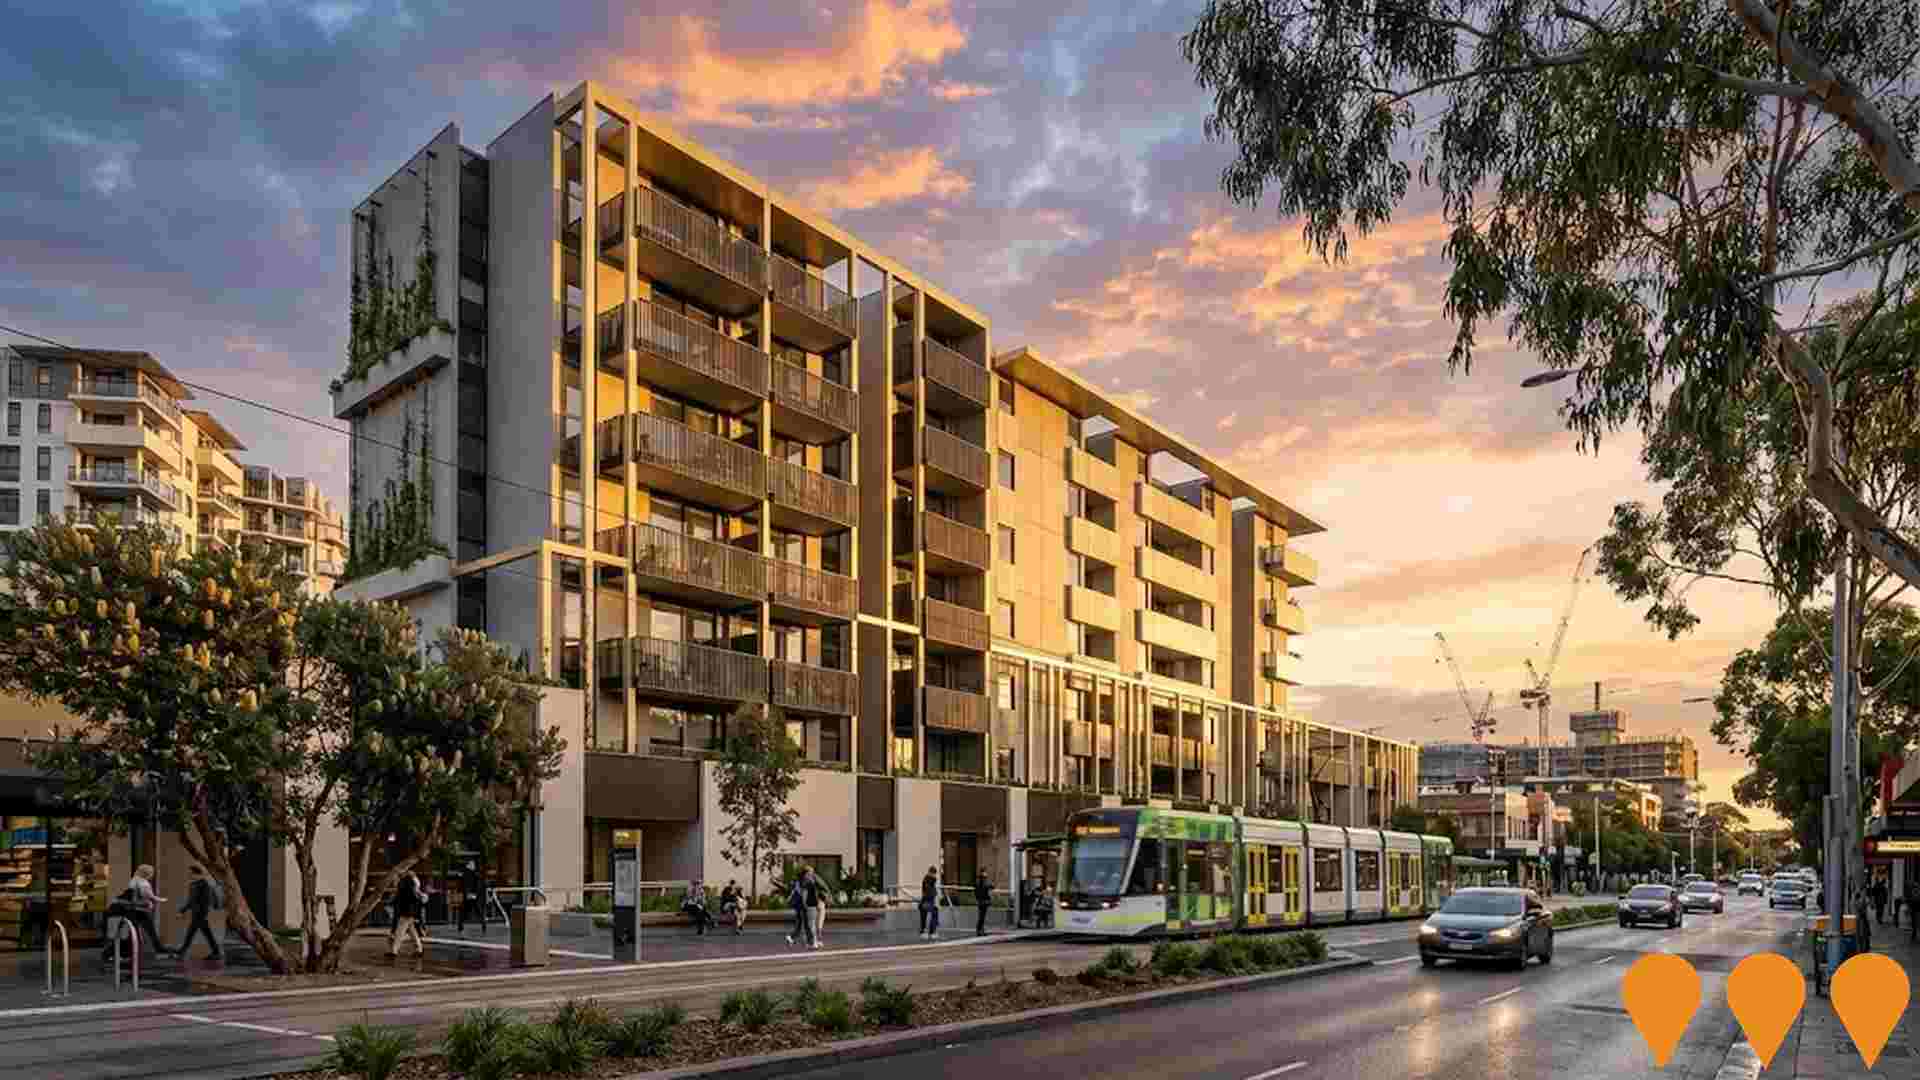
Caulfield Village
A $1.2 billion masterplanned mixed-use precinct on the former Caulfield Racecourse reserve site. Delivering approximately 2,000 apartments (including build-to-rent and retirement living), 20,000 sqm of retail (supermarket, fresh food market, specialty shops), cinema, medical centre, childcare, hotel and commercial office space across three precincts. Precinct 1 (retail core) completed 2018-2019. Precinct 2 North (REALM Caulfield - 437 BTR apartments) completed 2022. Precinct 2 South (390 apartments) completed 2019. Precinct 3 (final residential stages) is under construction with multiple stages progressing in 2025, expected completion by 2030.
Elsternwick Cultural Precinct
Council led upgrade of Selwyn Street into a pedestrian focused cultural precinct that connects the Jewish Holocaust Museum, the future Jewish Arts Quarter and nearby venues. Works include slow speed street treatments, wider footpaths, lighting, planting, public art and a central civic space for events. To avoid clashes with major builds at 7 and 10-16 Selwyn Street, Council has deferred detailed design to 2028/29 and construction to 2029/30, subject to annual budget decisions.

DealCorp Ormond Station Development (Sky Tower)
Mixed-use build-to-rent development above Ormond Station featuring 288 apartments, office spaces, ground floor supermarket and retail stores. Building rises to 10 storeys on North Road and 6 storeys in residential areas.
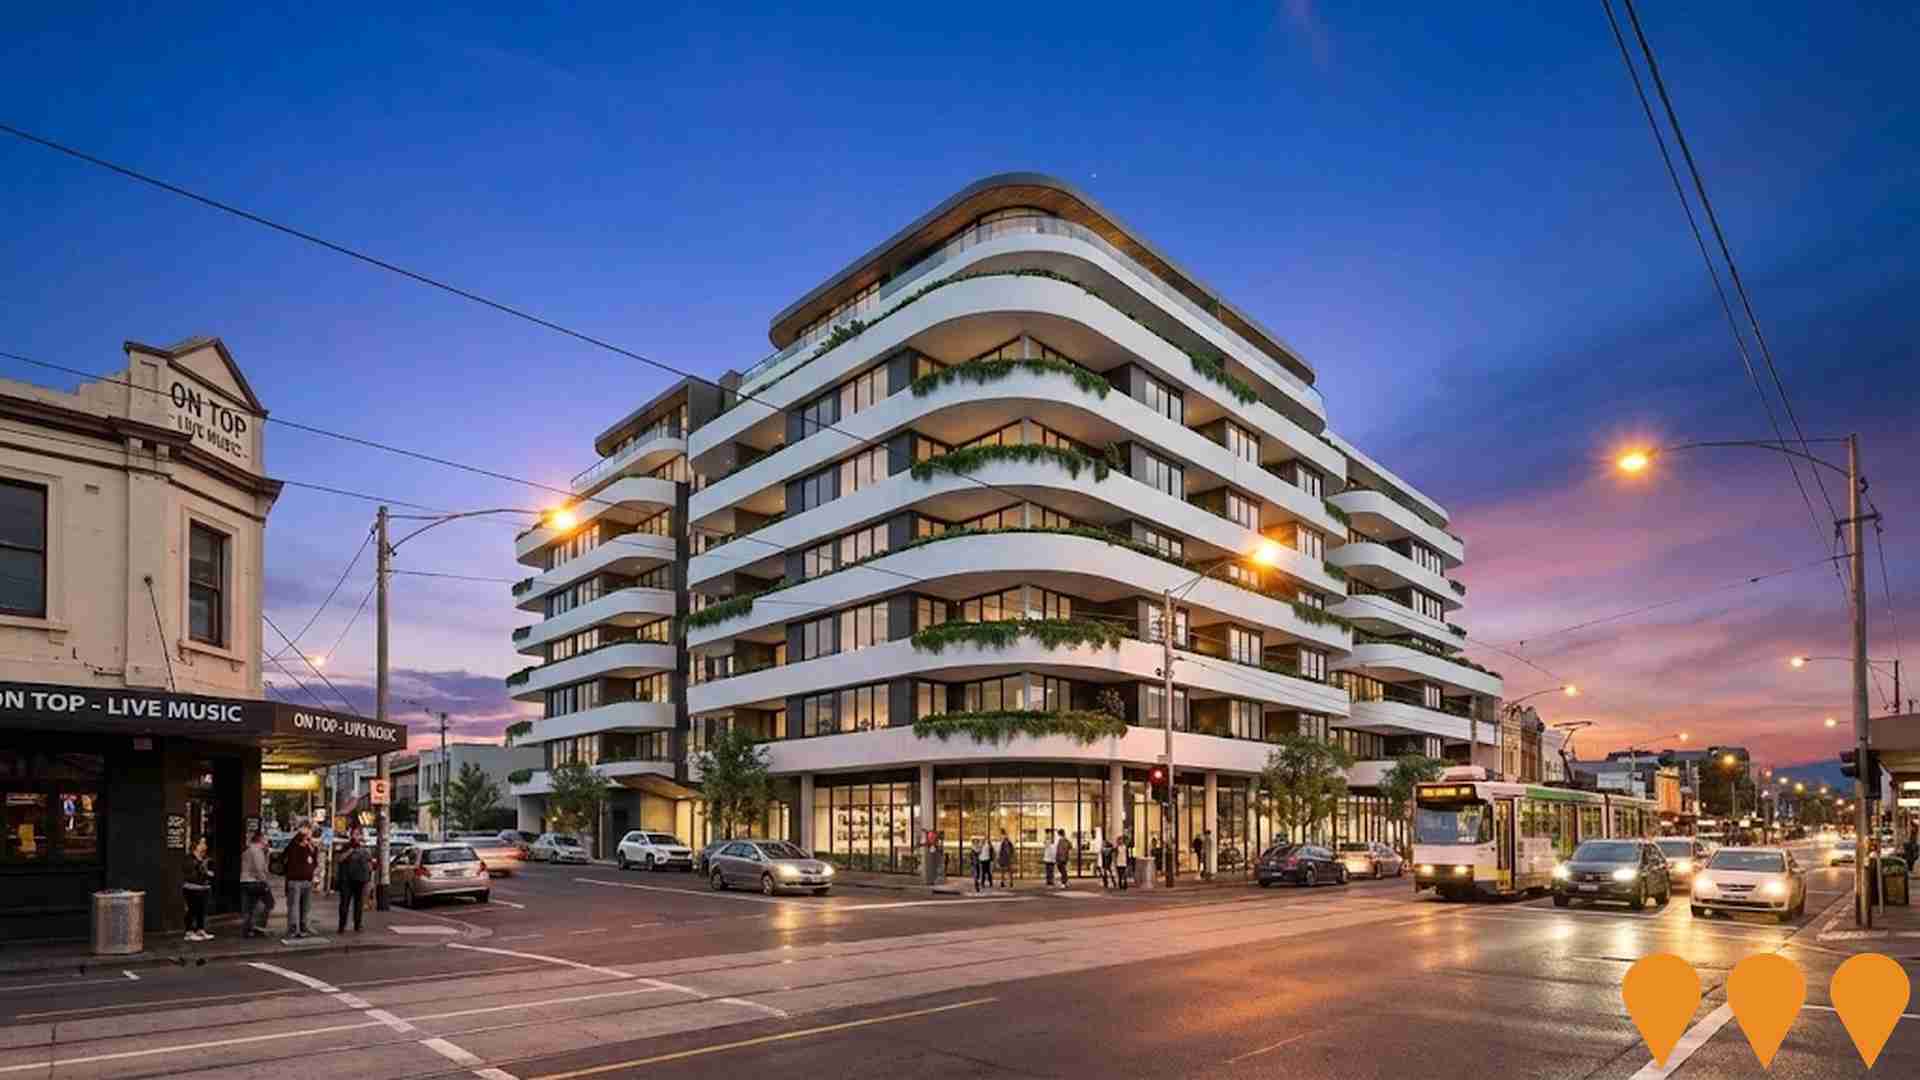
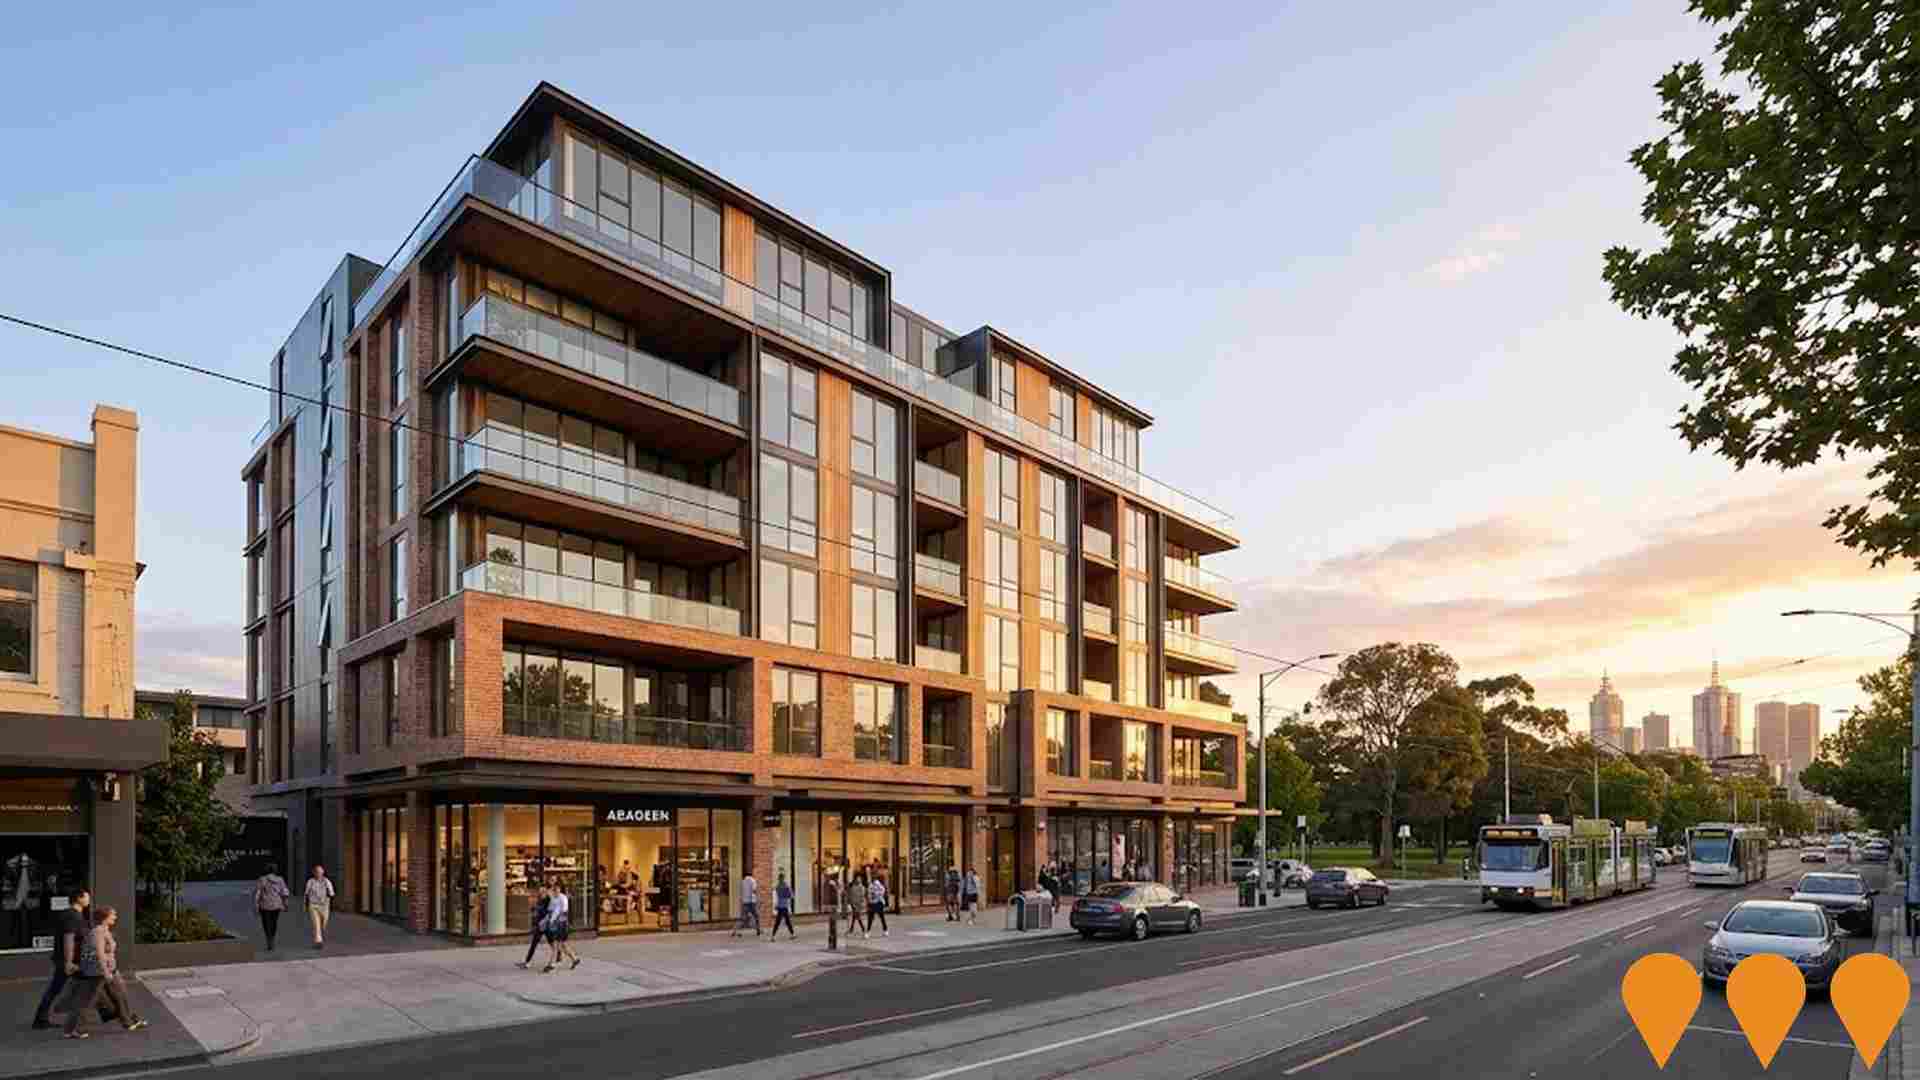
219-229 Balaclava Road Mixed-Use Development
Seven-level mixed-use development with luxury apartments and ground-floor retail. Originally approved for 30 apartments comprising two and three-bedroom units plus a four-bedroom penthouse, with two retail spaces and home office. Developer Abadeen Group will redesign within approved building envelope to create larger, higher-quality apartments. North-facing site with views over Caulfield Park and Melbourne CBD.
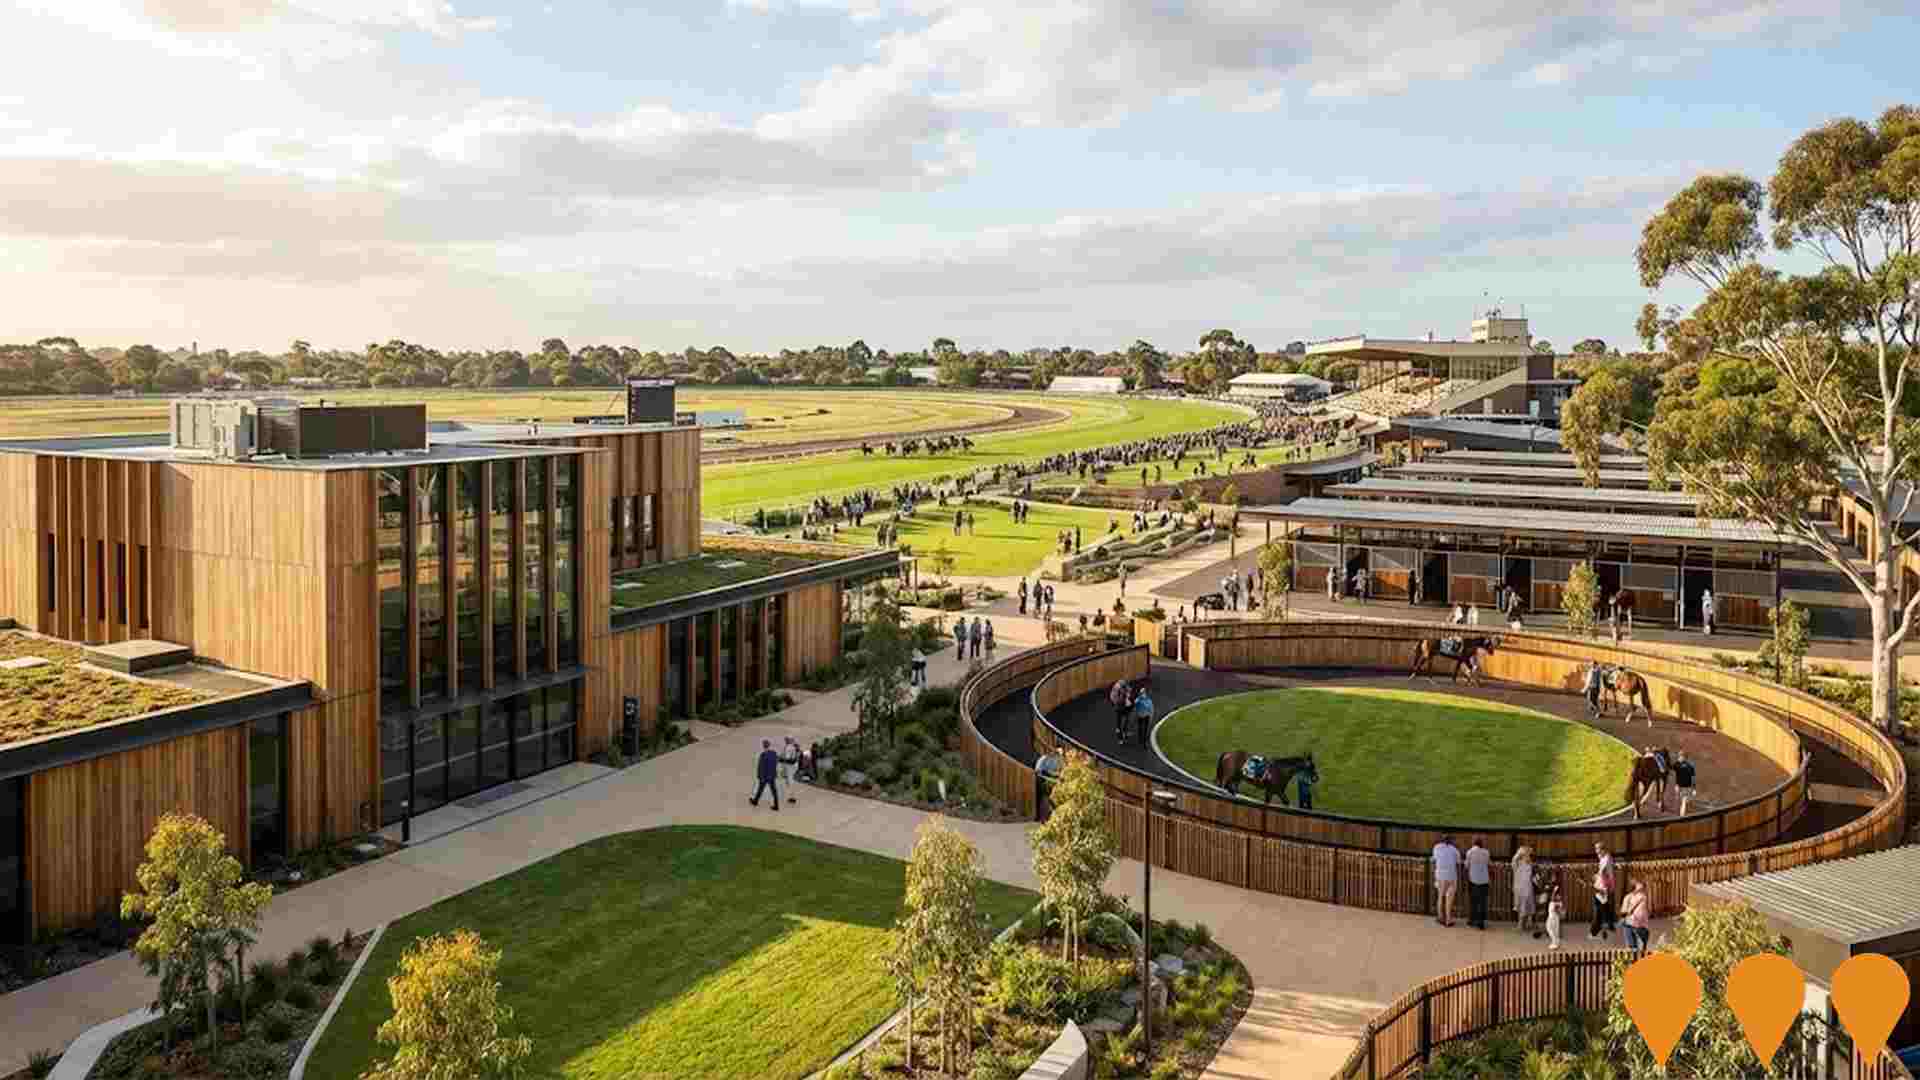
Melbourne Racing Club Masterplan - Caulfield Racecourse
Ongoing multi-year upgrade program at Caulfield Racecourse led by the Melbourne Racing Club. Recent works delivered new public realm, a 5,500m2 timber administration building, centralised horse stalls and mounting yard, plus enhanced entries and lawns. Current masterplan actions include further venue enhancements and pavilion planning following the 2024 grandstand fire, with operations continuing during staged works.
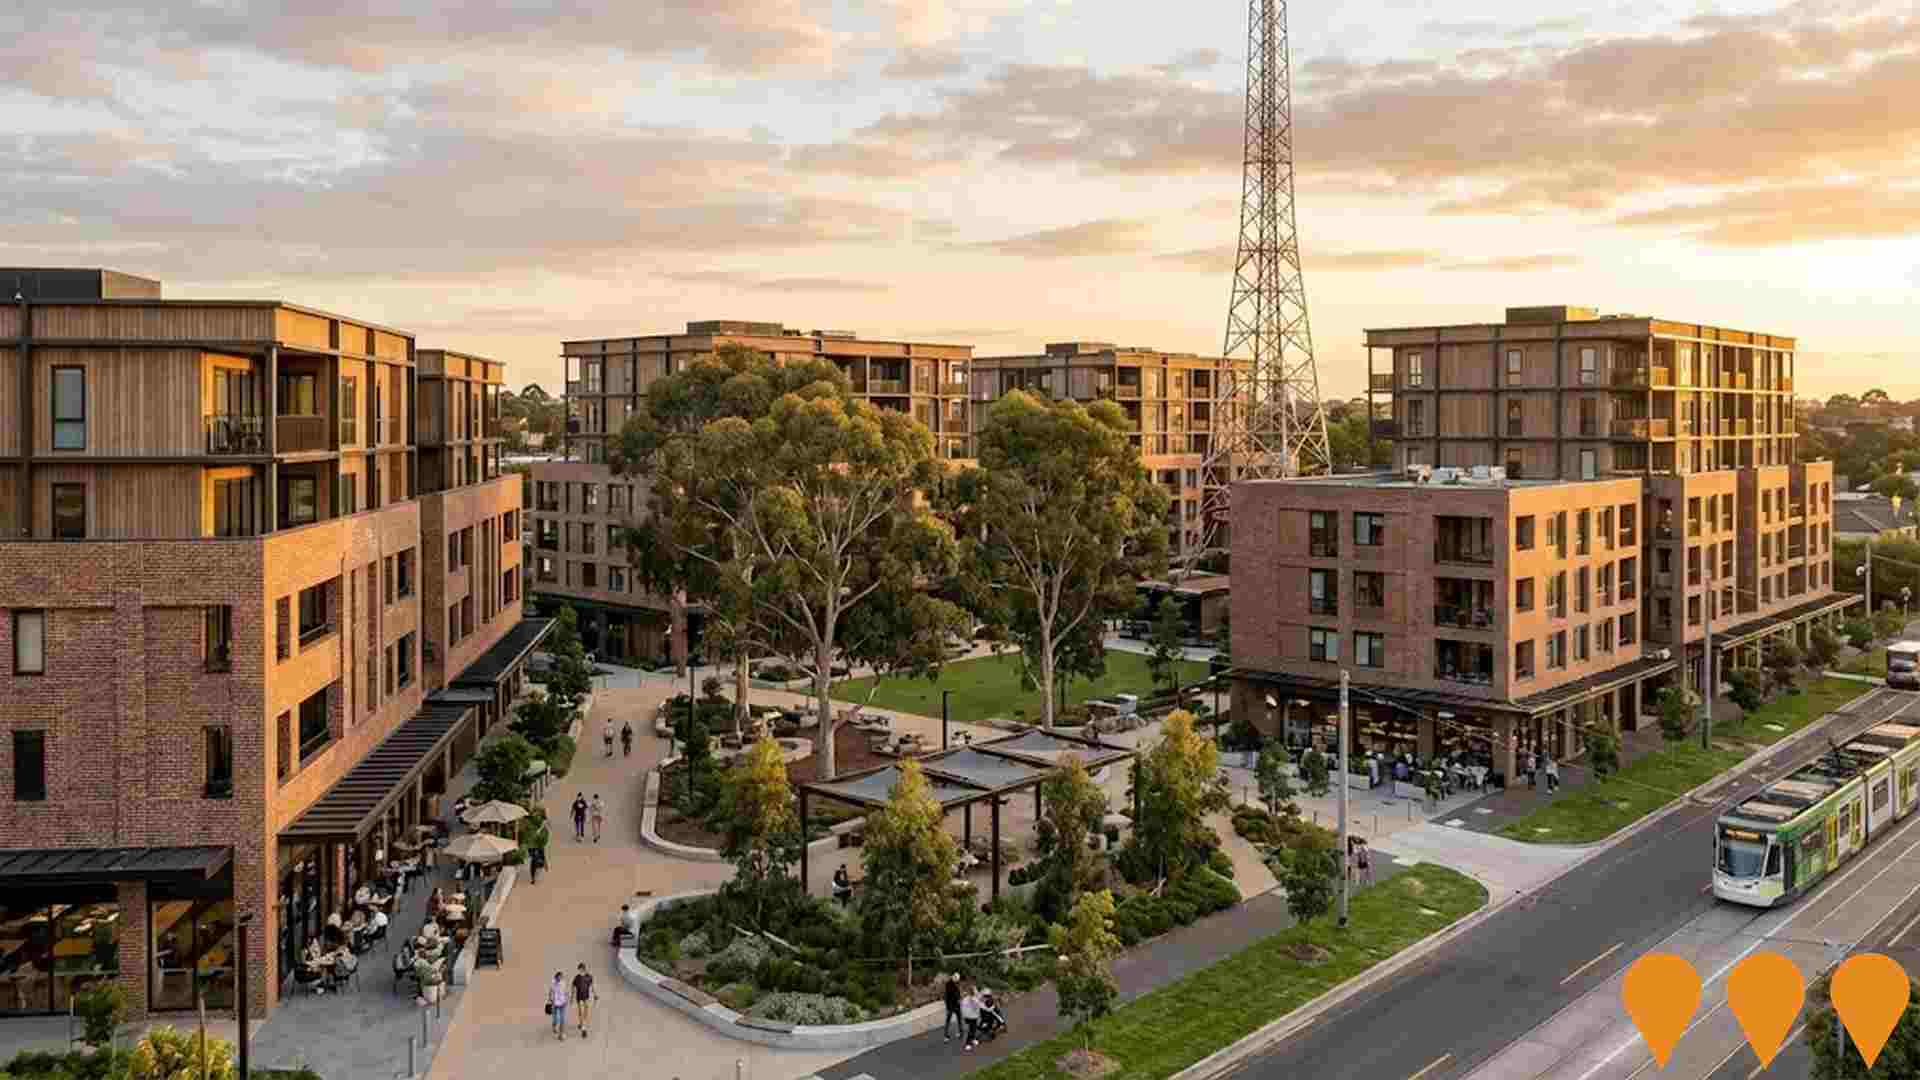
Former ABC Elsternwick Studio Site (8 Gordon Street)
Mixed-use development by Milieu Property featuring 175 apartments, food and drink premises, and 800sqm of public open space. Six buildings rising 3-6 storeys with Woods Bagot design channeling site's heritage.
Employment
Employment conditions in Caulfield - South remain below the national average according to AreaSearch analysis
Caulfield - South has an educated workforce with professional services well-represented. Its unemployment rate is 4.0%, lower than Greater Melbourne's 4.7%.
As of September 2025, 10,496 residents are employed, with a participation rate matching Greater Melbourne's 64.1%. Key employment sectors include professional & technical (1.6 times the regional level), health care & social assistance, and education & training. Construction has limited presence at 5.9%, compared to the regional average of 9.7%. Over 12 months to September 2025, employment remained stable while labour force grew by 0.6%, leading to a slight unemployment increase of 0.5 percentage points.
In comparison, Greater Melbourne saw employment growth of 3.0% and unemployment rise by 0.3 percentage points. Statewide in Victoria as of 25-Nov-25, employment grew by 1.13% year-on-year, with an unemployment rate of 4.7%. Nationally, employment is forecast to expand by 6.6% over five years and 14.6% over ten years for Caulfield - South, based on industry-specific projections applied to its current employment mix.
Frequently Asked Questions - Employment
Income
Income metrics indicate excellent economic conditions, with the area achieving higher performance than 75% of national locations assessed by AreaSearch
AreaSearch's data for financial year 2022 shows Caulfield - South SA2 had a median income of $63,596 and an average income of $101,539, placing it in the top percentile nationally. This contrasts with Greater Melbourne's median income of $54,892 and average income of $73,761. By September 2025, estimated median income is approximately $71,329 and average income is $113,886, based on a 12.16% Wage Price Index growth since financial year 2022. Census data ranks Caulfield - South's household, family, and personal incomes between the 82nd and 83rd percentiles nationally. Income distribution shows 27.0% of residents (5,242 individuals) earn between $1,500 and $2,999 weekly, similar to surrounding regions at 32.8%. Notably, 38.9% of residents earn above $3,000 per week, indicating strong economic capacity. High housing costs consume 15.5% of income, but strong earnings place disposable income at the 82nd percentile nationally. The area's SEIFA income ranking places it in the 9th decile.
Frequently Asked Questions - Income
Housing
Caulfield - South displays a diverse mix of dwelling types, with above-average rates of outright home ownership
Caulfield - South's dwelling structure, as per the latest Census, had 50.0% houses and 50.1% other dwellings (semi-detached, apartments, 'other' dwellings). This compares to Melbourne metro's 47.8% houses and 52.1% other dwellings. Home ownership in Caulfield - South stood at 38.0%, with mortgaged dwellings at 33.6% and rented ones at 28.4%. The median monthly mortgage repayment was $2,798, higher than Melbourne metro's average of $2,396. Median weekly rent in Caulfield - South was $483, compared to Melbourne metro's $435. Nationally, Caulfield - South's mortgage repayments were significantly higher at $1,863 and rents substantially above the national figure of $375.
Frequently Asked Questions - Housing
Household Composition
Caulfield - South features high concentrations of group households, with a fairly typical median household size
Family households constitute 71.2% of all households, including 34.8% couples with children, 27.2% couples without children, and 8.2% single parent families. Non-family households account for the remaining 28.8%, with lone person households at 24.8% and group households comprising 4.0% of the total. The median household size is 2.5 people, which aligns with the Greater Melbourne average.
Frequently Asked Questions - Households
Local Schools & Education
Caulfield - South demonstrates exceptional educational outcomes, ranking among the top 5% of areas nationally based on AreaSearch's comprehensive analysis of qualification and performance metrics
Caulfield - South's educational attainment notably exceeds national and state averages. Among residents aged 15+, 52.3% possess university qualifications, compared to Australia's 30.4% and Victoria's 33.4%. This area's highest qualification is the bachelor degree at 35.0%, followed by postgraduate qualifications (12.6%) and graduate diplomas (4.7%). Vocational pathways comprise 21.2% of qualifications, with advanced diplomas at 10.9% and certificates at 10.3%.
Educational participation is significantly high, with 29.5% currently enrolled in formal education. This includes 9.0% in primary, 8.0% in secondary, and 7.2% pursuing tertiary education.
Frequently Asked Questions - Education
Schools Detail
Nearby Services & Amenities
Transport
Transport servicing is good compared to other areas nationally based on assessment of service frequency, route connectivity and accessibility
The analysis of public transport in the Caulfield - South area shows that there are currently 84 active transport stops operating. These stops offer a mix of light rail and bus services. The routes serving these stops total eight, with a combined weekly passenger trip count of 4,229.
Residents enjoy excellent transport accessibility, with an average distance to the nearest stop being 183 meters. On average, there are 604 trips per day across all routes, translating to approximately 50 weekly trips per individual stop.
Frequently Asked Questions - Transport
Transport Stops Detail
Health
Caulfield - South's residents are healthier than average in comparison to broader Australia with prevalence of common health conditions quite low across both younger and older age cohorts
Caulfield - South residents showed low prevalence of common health conditions across both younger and older age groups. Private health cover was high at approximately 72% (13,921 people), compared to Greater Melbourne's 65.2%. Nationally, this figure stands at 55.3%.
Mental health issues affected 8.0%, while arthritis impacted 6.4%. 71.1% reported being free of medical ailments, slightly lower than Greater Melbourne's 74.0%. The area had a higher proportion of seniors aged 65 and over, at 21.2% (4,112 people), compared to Greater Melbourne's 16.8%. Health outcomes among seniors were above average, mirroring the general population's health profile.
Frequently Asked Questions - Health
Cultural Diversity
Caulfield - South was found to be more culturally diverse than the vast majority of local markets in Australia, upon assessment of a range of language and cultural background related metrics
Caulfield-South has a high level of cultural diversity, with 27.8% of its population speaking a language other than English at home and 39.3% born overseas. The predominant religion in Caulfield-South is Judaism, comprising 40.8% of the population, compared to 17.5% across Greater Melbourne. In terms of ancestry, the top three groups are Other (20.7%), Australian (18.6%), and English (16.0%).
Notably, Polish (6.1%) is overrepresented in Caulfield-South compared to the regional average of 3.1%. Similarly, Russian (4.0%) and South African (3.7%) groups are also more prevalent than their respective regional averages of 2.2% and 1.4%.
Frequently Asked Questions - Diversity
Age
Caulfield - South's population is slightly older than the national pattern
Caulfield - South's median age is 41 years, which is significantly higher than the Greater Melbourne average of 37 years and somewhat older than the Australian median of 38 years. Compared to the Greater Melbourne average, the 75-84 age cohort is notably over-represented at 7.8% locally, while the 25-34 age group is under-represented at 12.6%. Following the Census in 2021, the 15 to 24 age group grew from 11.1% to 13.0%, and the 75 to 84 cohort increased from 6.0% to 7.8%. Conversely, the 65 to 74 cohort declined from 11.5% to 10.4%, and the 45 to 54 age group dropped from 13.5% to 12.4%. Demographic modeling suggests that Caulfield - South's age profile will evolve significantly by 2041. The 75 to 84 cohort shows the strongest projected growth at 48%, adding 729 residents to reach 2,244. This demographic aging continues as residents aged 65 and older represent 56% of anticipated growth. The 0 to 4 age group displays more modest growth at 2%, adding only 17 residents.
