Chart Color Schemes
This analysis uses ABS Statistical Areas Level 2 (SA2) boundaries, which can materially differ from Suburbs and Localities (SAL) even when sharing similar names.
SA2 boundaries are defined by the Australian Bureau of Statistics and are designed to represent communities for statistical reporting (e.g., census and ERP).
Suburbs and Localities (SAL) represent commonly-used suburb/locality names (postal-style areas) and may use different geographic boundaries. For comprehensive analysis, consider reviewing both boundary types if available.
est. as @ -- *
ABS ERP | -- people | --
2021 Census | -- people
Sales Activity
Curious about local property values? Filter the chart to assess the volume and appreciation (including resales) trends and regional comparisons, or scroll to the map below view this information at an individual property level.
Find a Recent Sale
Sales Detail
Population
Population growth drivers in Elsternwick are slightly above average based on AreaSearch's ranking of recent, and medium term trends
Elsternwick's population was approximately 12,797 as of November 2025. This figure reflects an increase of 893 people since the 2021 Census, which reported a population of 11,904. The change is inferred from the estimated resident population of 12,765 in June 2024 and an additional 170 validated new addresses since the Census date. This results in a population density ratio of 4,474 persons per square kilometer, placing Elsternwick in the top 10% of national locations assessed by AreaSearch. The area's 7.5% growth since the 2021 census exceeded the SA4 region's 7.1%, indicating it as a growth leader. Overseas migration contributed approximately 77.4% of overall population gains during recent periods.
AreaSearch is adopting ABS/Geoscience Australia projections for each SA2 area, released in 2024 with 2022 as the base year. For areas not covered by this data, AreaSearch utilises VIC State Government's Regional/LGA projections released in 2023, adjusted using a method of weighted aggregation of population growth from LGA to SA2 levels. Growth rates by age group are applied across all areas for years 2032 to 2041. By 2041, Elsternwick is projected to expand by 2,168 persons based on the latest annual ERP population numbers, reflecting an increase of 16.7% in total over the 17 years.
Frequently Asked Questions - Population
Development
Residential development activity is lower than average in Elsternwick according to AreaSearch's national comparison of local real estate markets
Elsternwick has granted approximately 49 residential property approvals annually. Over the past five financial years, from FY21 to FY25, a total of 248 homes were approved, with an additional 179 approved so far in FY26. The average number of people moving into the area per dwelling built over these years is approximately one person.
This indicates that new supply is meeting or exceeding demand, providing ample buyer choice and capacity for population growth beyond current forecasts. The average construction cost value of new homes being built is $620,000, suggesting developers are targeting the premium market segment with higher-end properties. In FY26, Elsternwick has recorded $36.8 million in commercial development approvals, demonstrating strong commercial development momentum. Compared to Greater Melbourne, Elsternwick has roughly two-thirds the rate of new dwelling approvals per person and ranks among the 31st percentile nationally, resulting in relatively constrained buyer choice and supporting interest in existing dwellings. The new building activity shows a composition of 14.0% detached houses and 86.0% medium to high-density housing.
This shift towards compact living offers affordable entry pathways and attracts downsizers, investors, and first-time purchasers. This represents a notable change from the area's existing housing stock, which is currently 38.0% houses, indicating decreasing availability of developable sites and reflecting changing lifestyles and demand for more diverse, affordable housing options. Elsternwick has an average of around 669 people per dwelling approval, indicating a highly mature market. According to the latest AreaSearch quarterly estimate, Elsternwick is forecasted to gain approximately 2,136 residents by 2041. At current development rates, housing supply may struggle to match population growth, potentially increasing buyer competition and supporting price increases.
Frequently Asked Questions - Development
Infrastructure
Elsternwick has strong levels of nearby infrastructure activity, ranking in the top 40% nationally
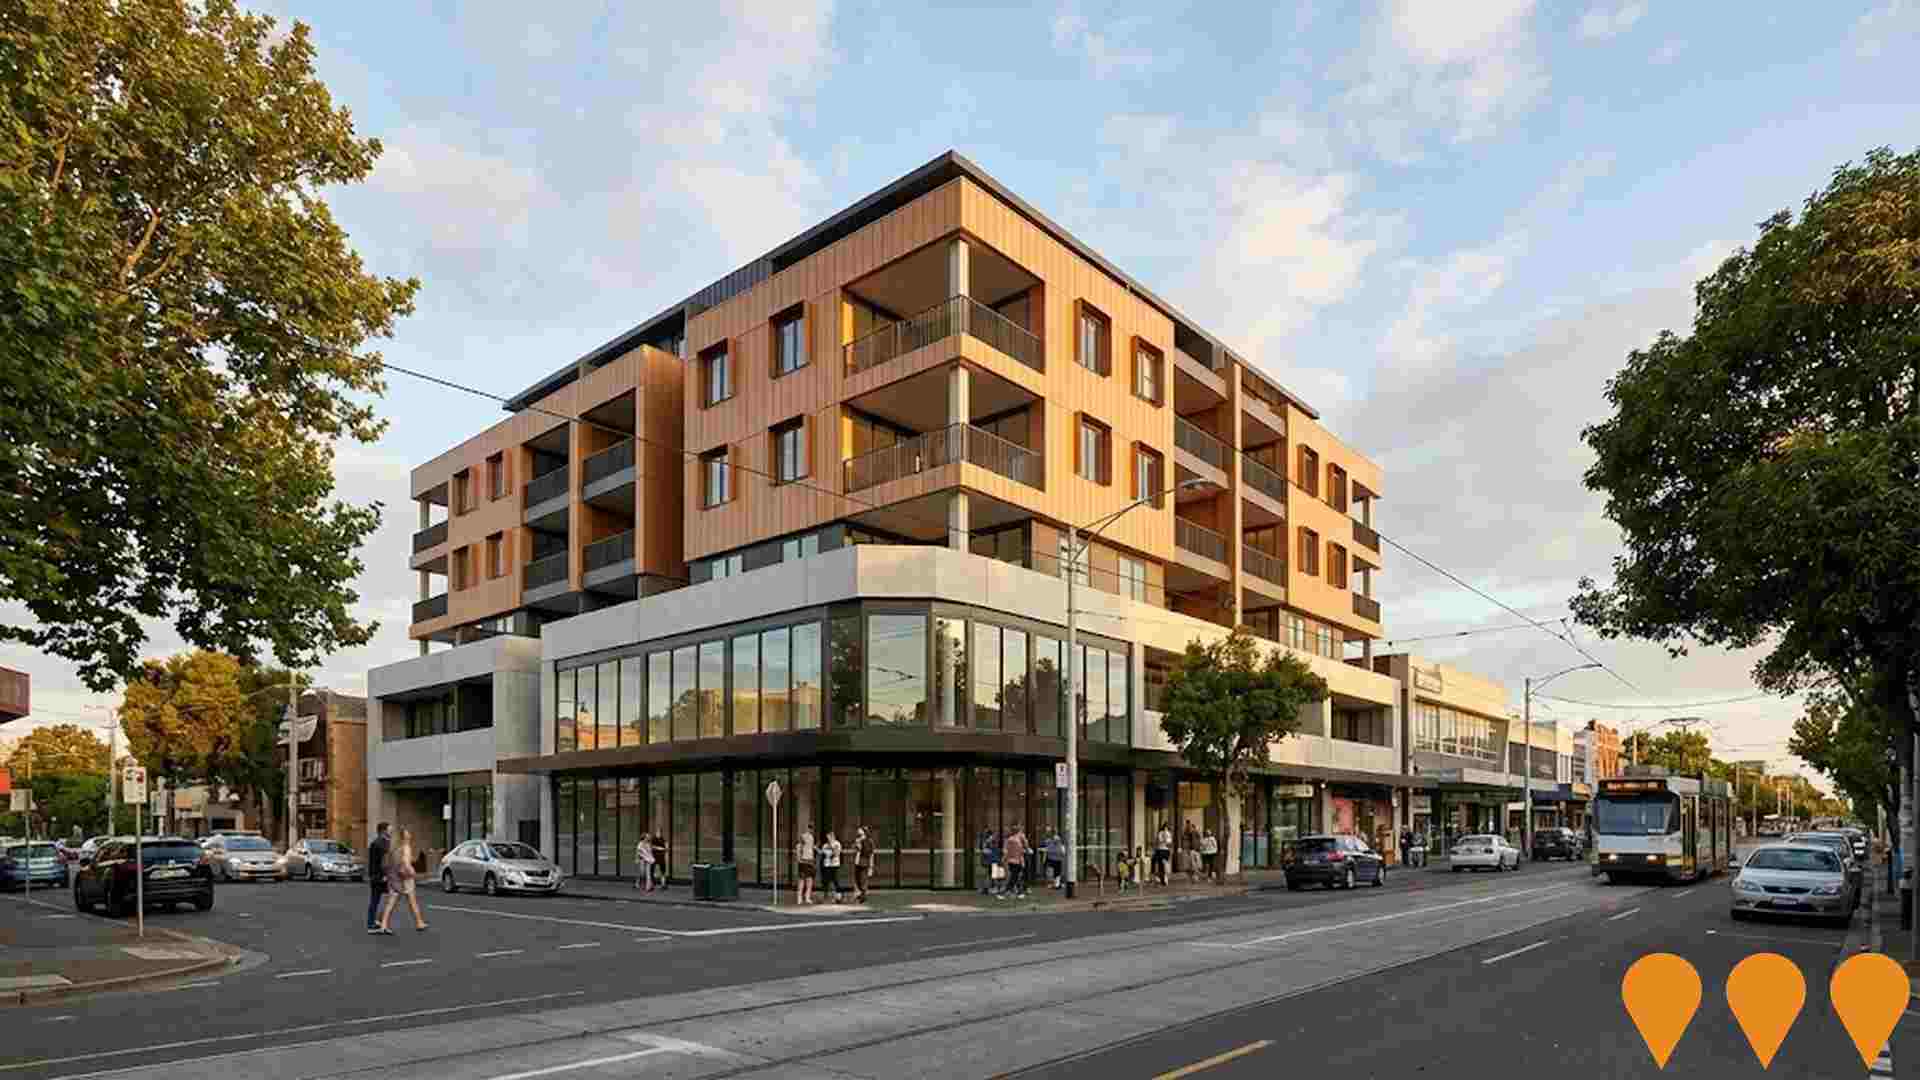
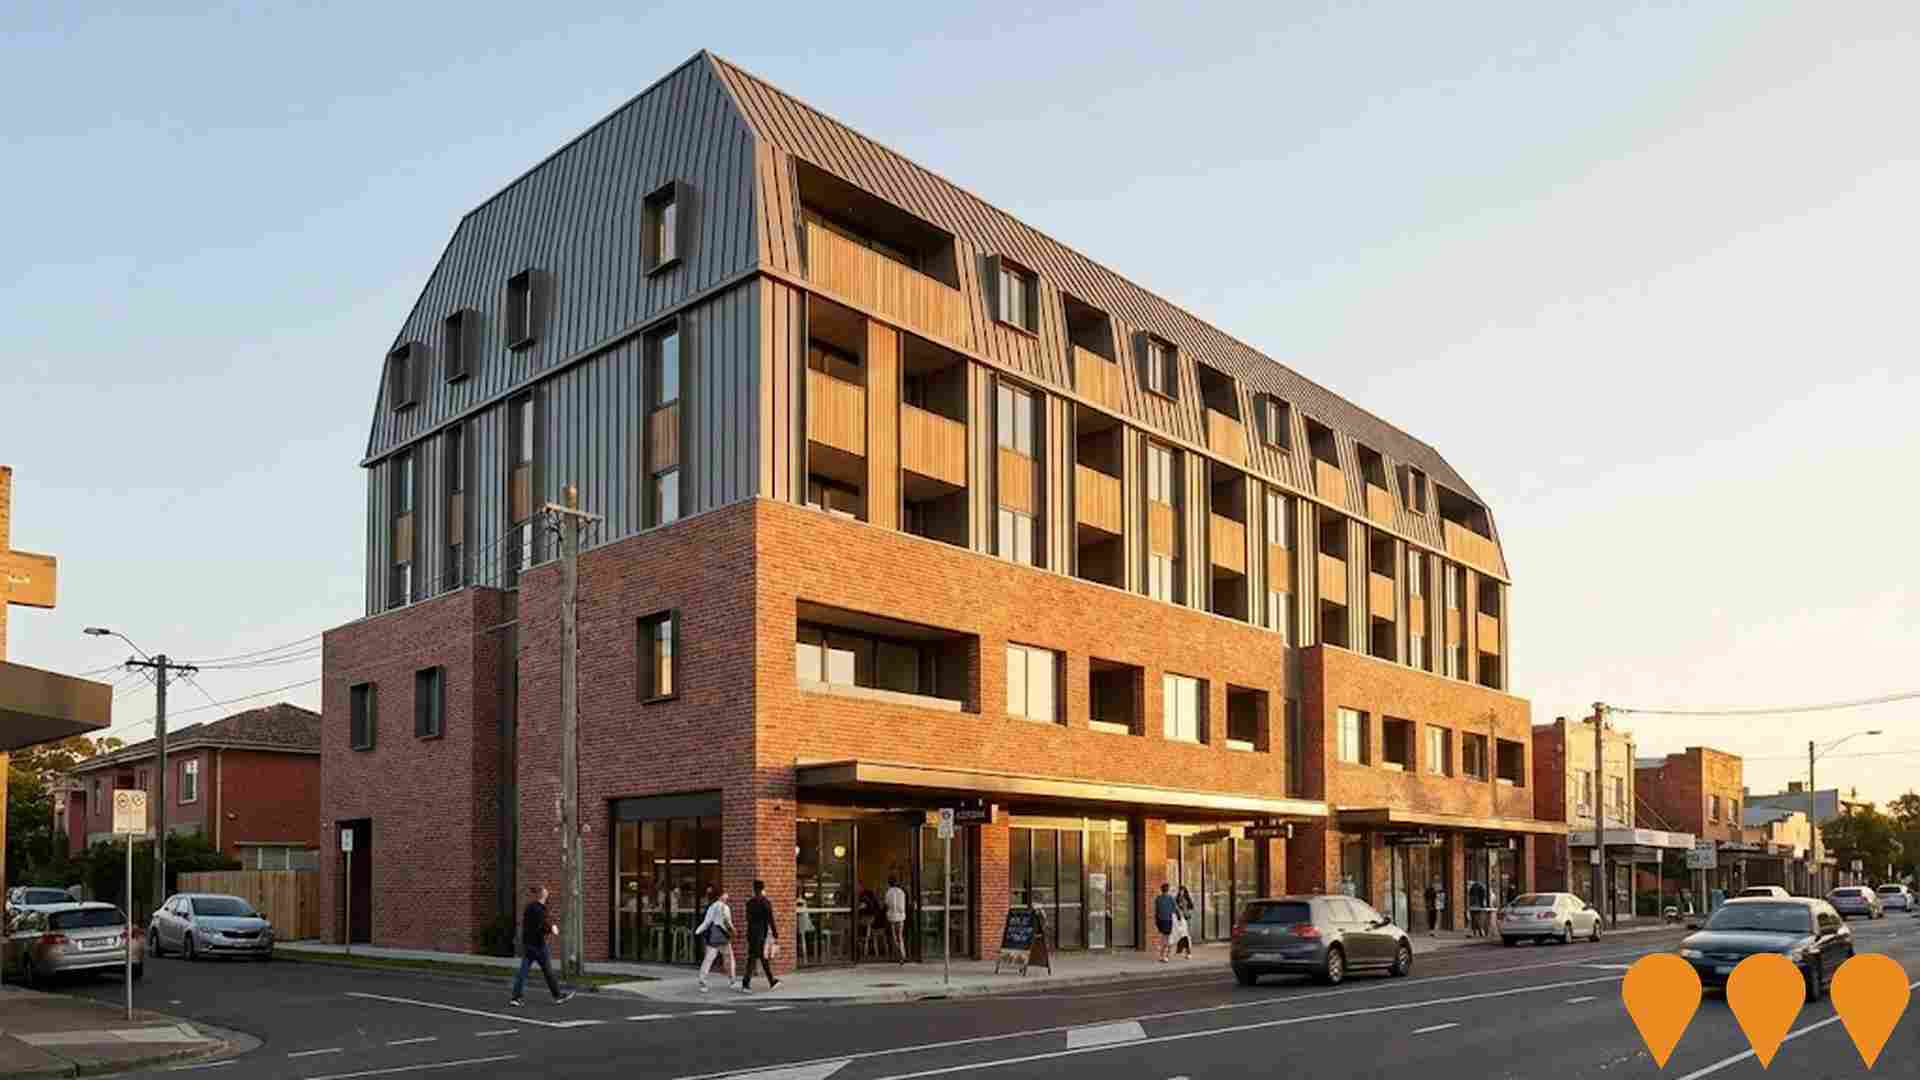
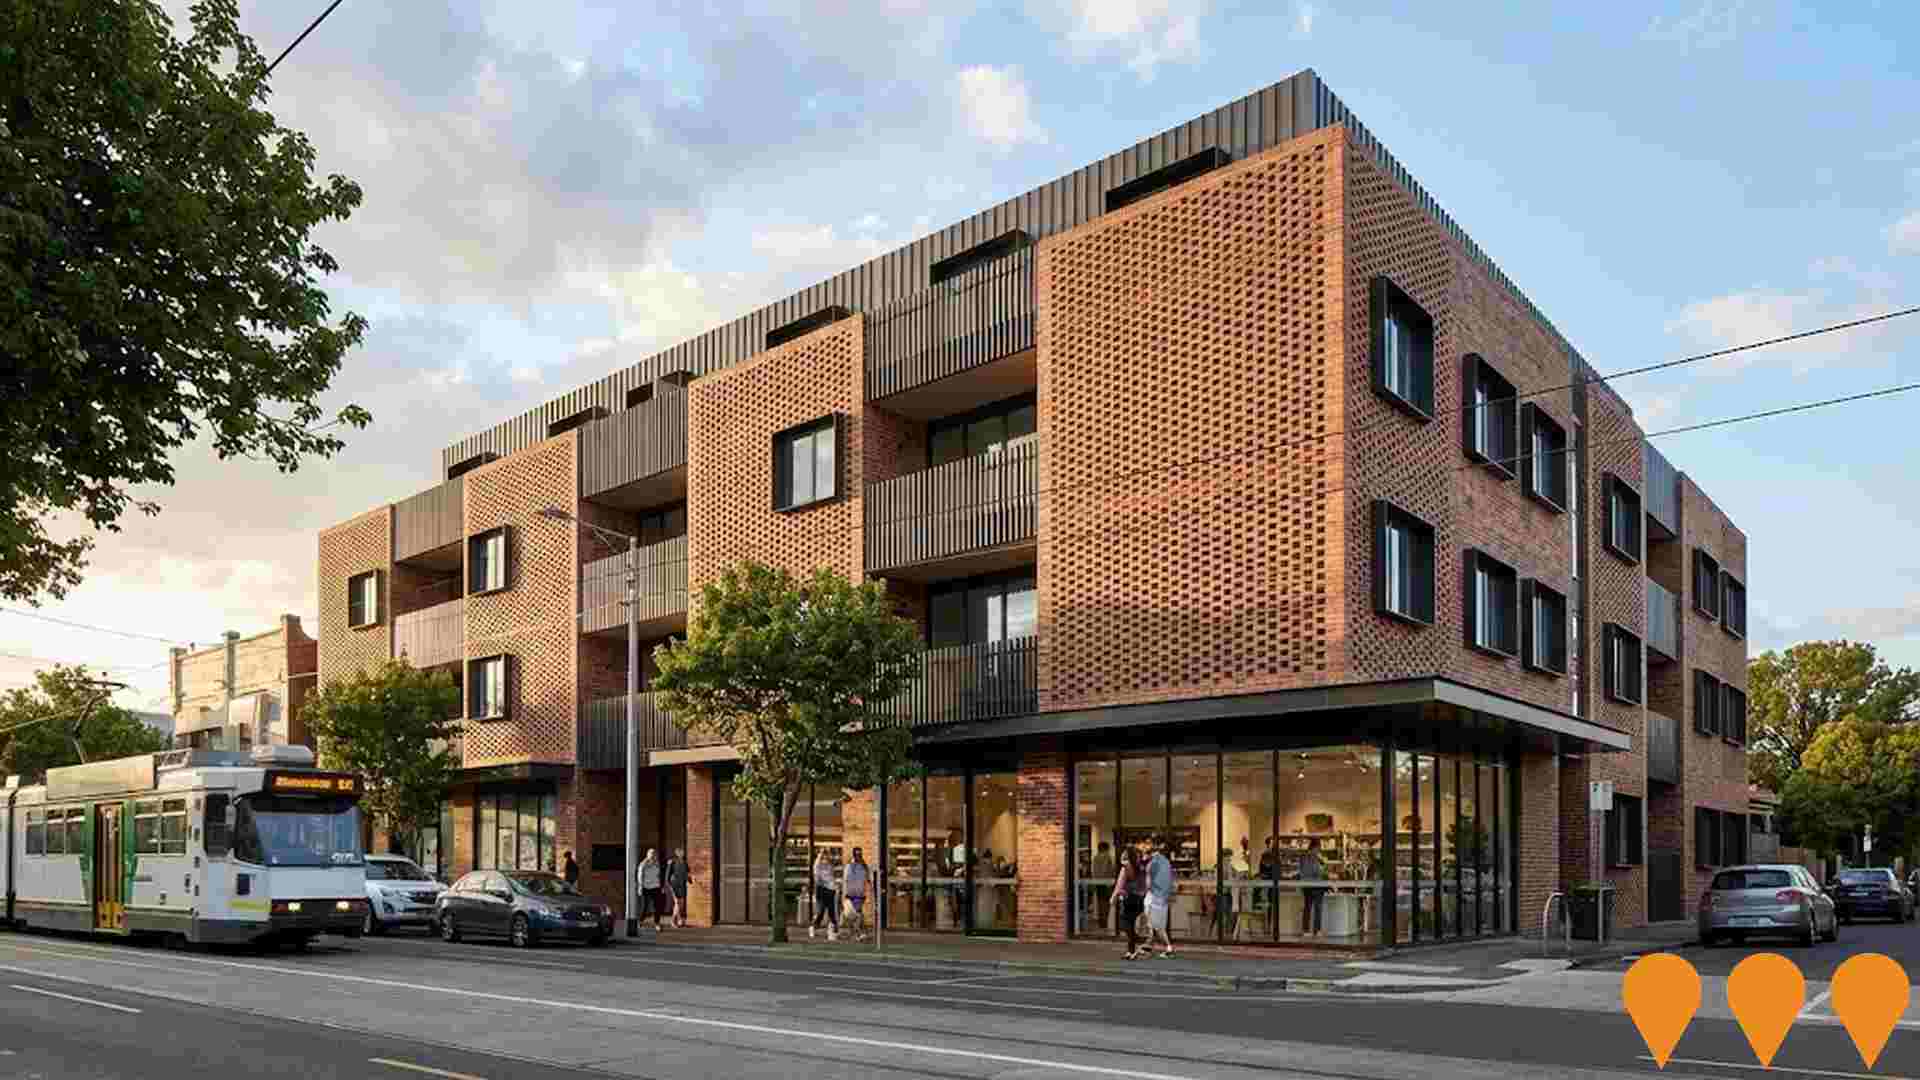
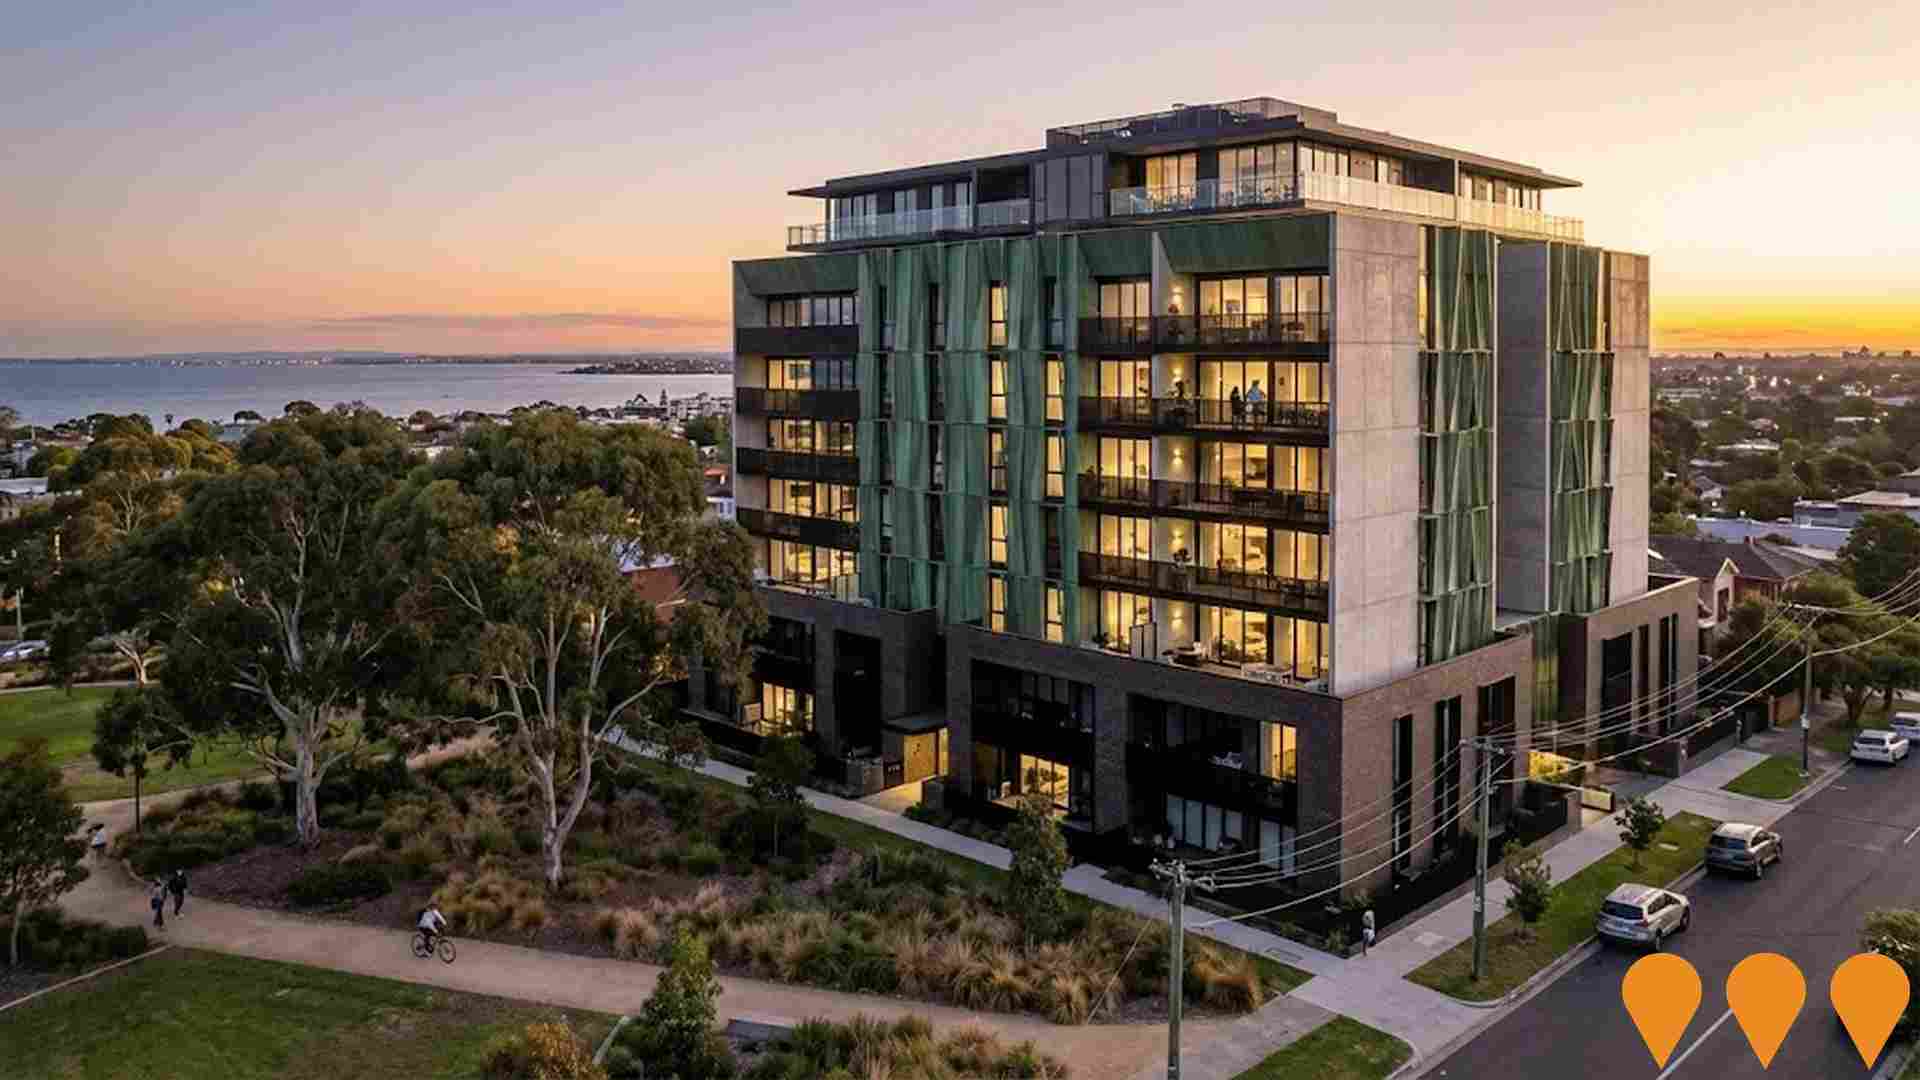
Changes to local infrastructure significantly impact an area's performance. AreaSearch has identified 15 projects likely to affect the area. Notable ones include 25 Sandham Street Townhouses, 10-16 Selwyn Street Mixed-Use Development, 552 Glen Huntly Road Mixed-Use Development, and Seymour & Blanche Townhouses. The following list details those most relevant.
Professional plan users can use the search below to filter and access additional projects.
INFRASTRUCTURE SEARCH
 Denotes AI-based impression for illustrative purposes only, not to be taken as definitive under any circumstances. Please follow links and conduct other investigations from the project's source for actual imagery. Developers and project owners wishing us to use original imagery please Contact Us and we will do so.
Frequently Asked Questions - Infrastructure
Elsternwick Cultural Precinct
Council led upgrade of Selwyn Street into a pedestrian focused cultural precinct that connects the Jewish Holocaust Museum, the future Jewish Arts Quarter and nearby venues. Works include slow speed street treatments, wider footpaths, lighting, planting, public art and a central civic space for events. To avoid clashes with major builds at 7 and 10-16 Selwyn Street, Council has deferred detailed design to 2028/29 and construction to 2029/30, subject to annual budget decisions.

Former ABC Elsternwick Studio Site (8 Gordon Street)
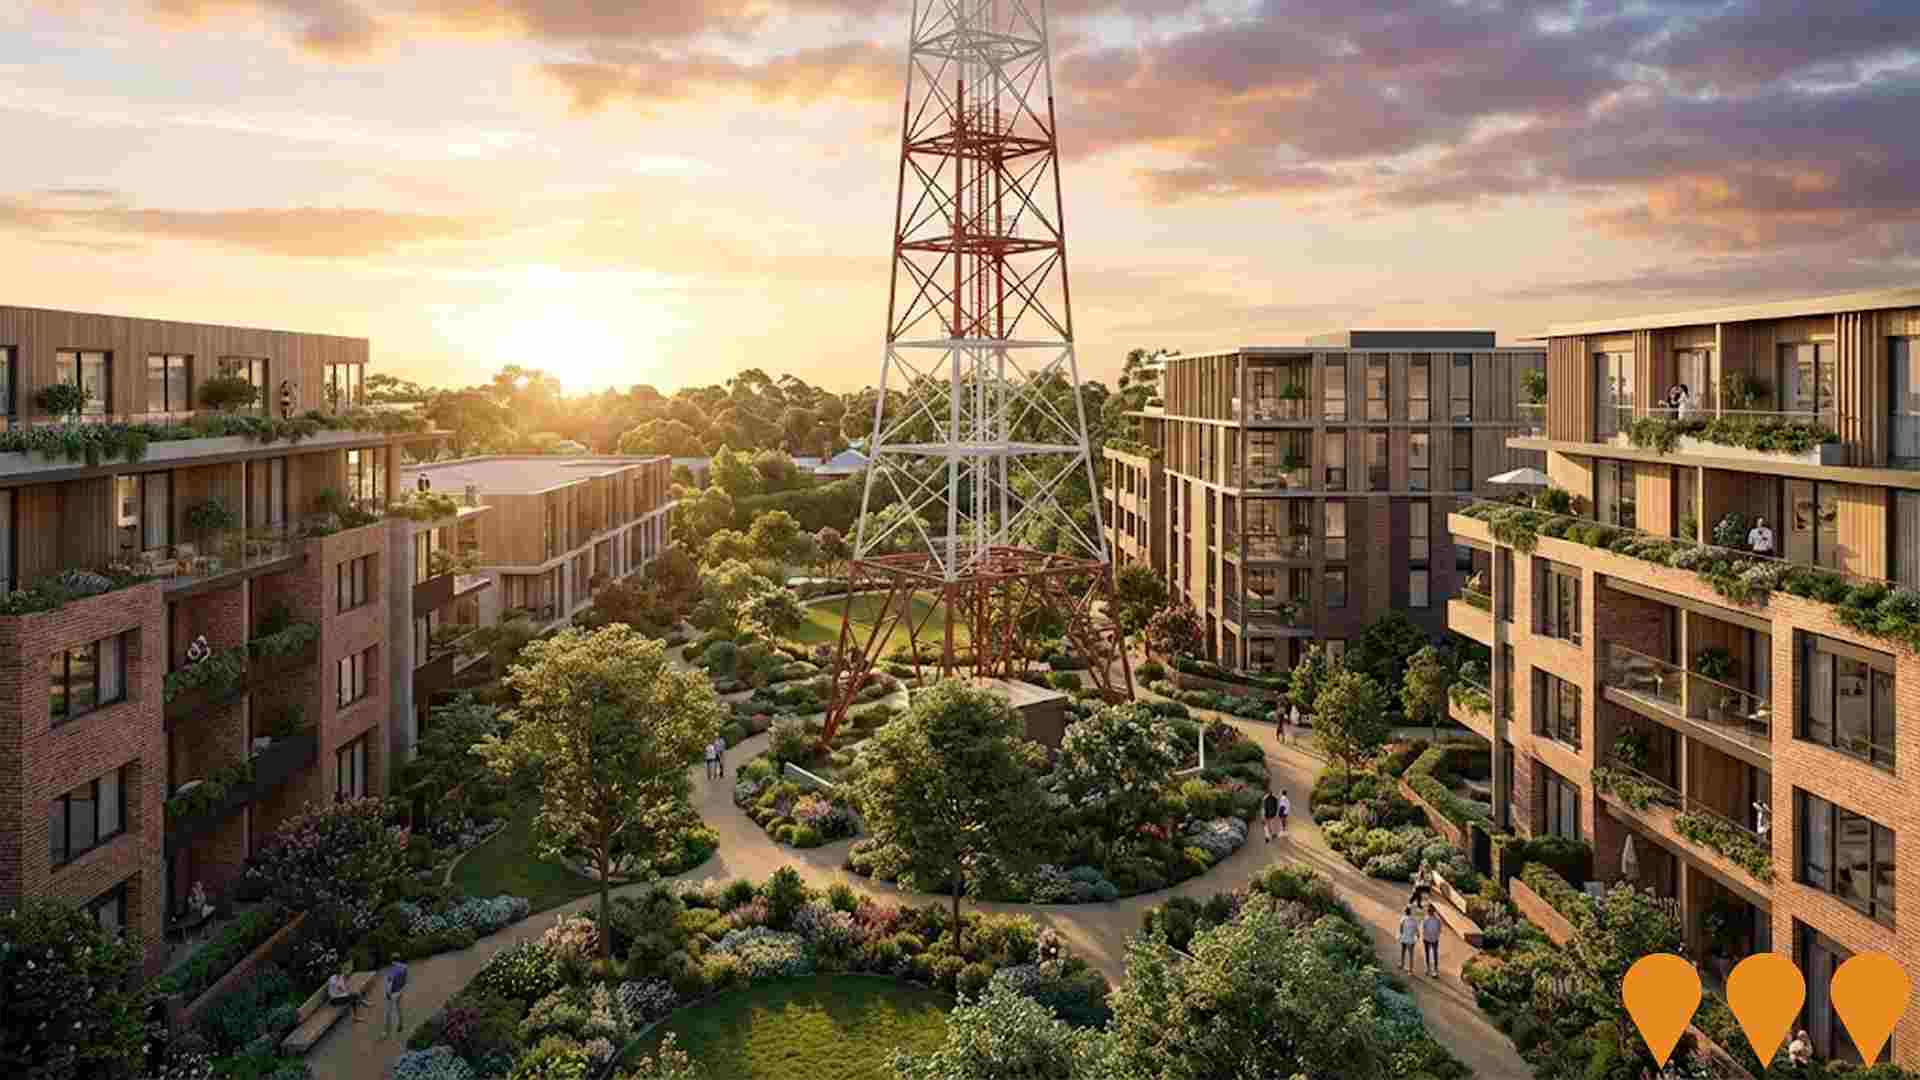
Mixed-use development by Milieu Property featuring 175 apartments, food and drink premises, and 800sqm of public open space. Six buildings rising 3-6 storeys with Woods Bagot design channeling site's heritage.
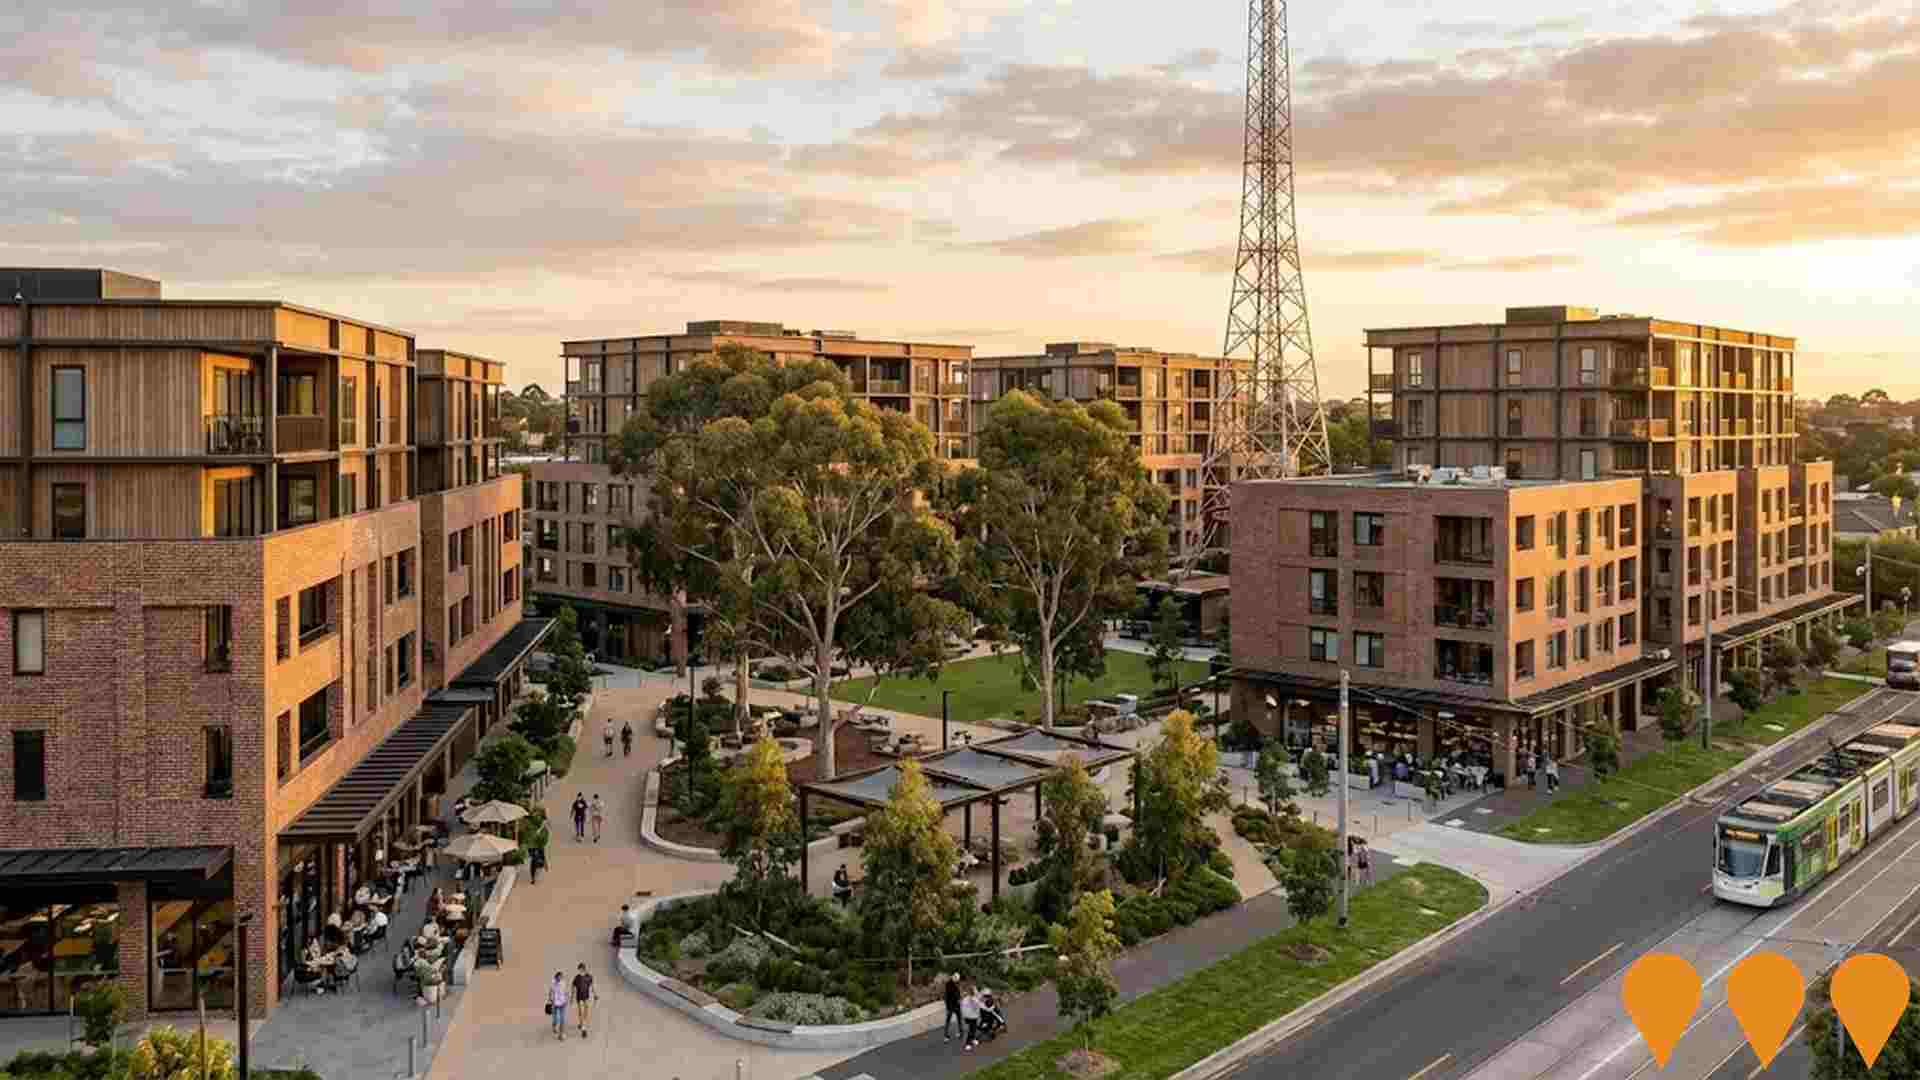
EVA Elsternwick Village Apartments
Modern apartment complex with 1, 2 and 3-bedroom homes featuring high-end finishes, rooftop terrace, and proximity to Elsternwick Station.
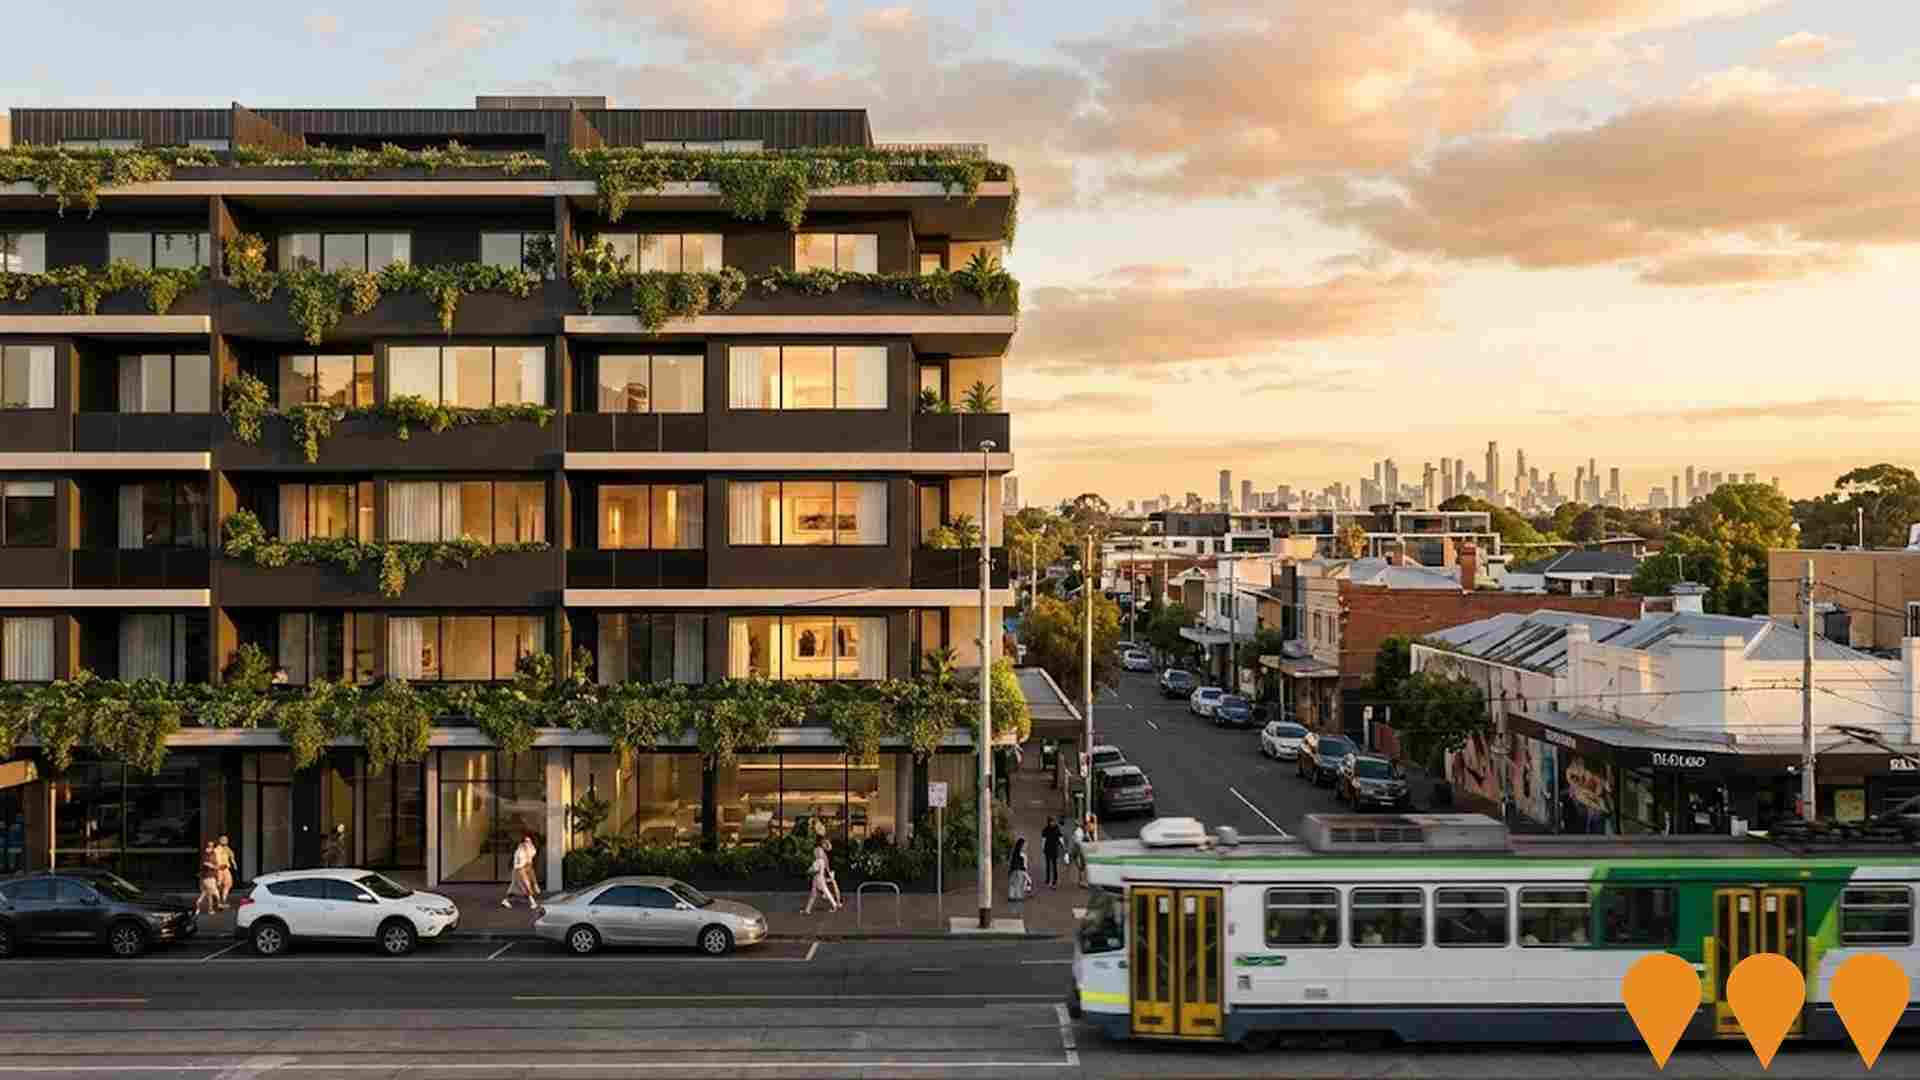
The Mark
Completed mixed-use development featuring 173 residential apartments across two seven-story buildings above an active ground floor with Coles Supermarket, Liquorland, and retail tenancies. The project includes multi-level basement parking and was designed by Rothelowman and i2C Architects, constructed by Hacer Group. Completed in March 2020, The Mark rises above Elsternwick's village offering light-filled interiors, spacious apartment configurations, and close proximity to local transport, community hubs, and schools.

10-16 Selwyn Street Mixed-Use Development
Mixed-use development featuring a supermarket and residential apartments, revised to 6 storeys with additional setbacks and height reductions after VCAT approval. Includes ground floor commercial spaces.
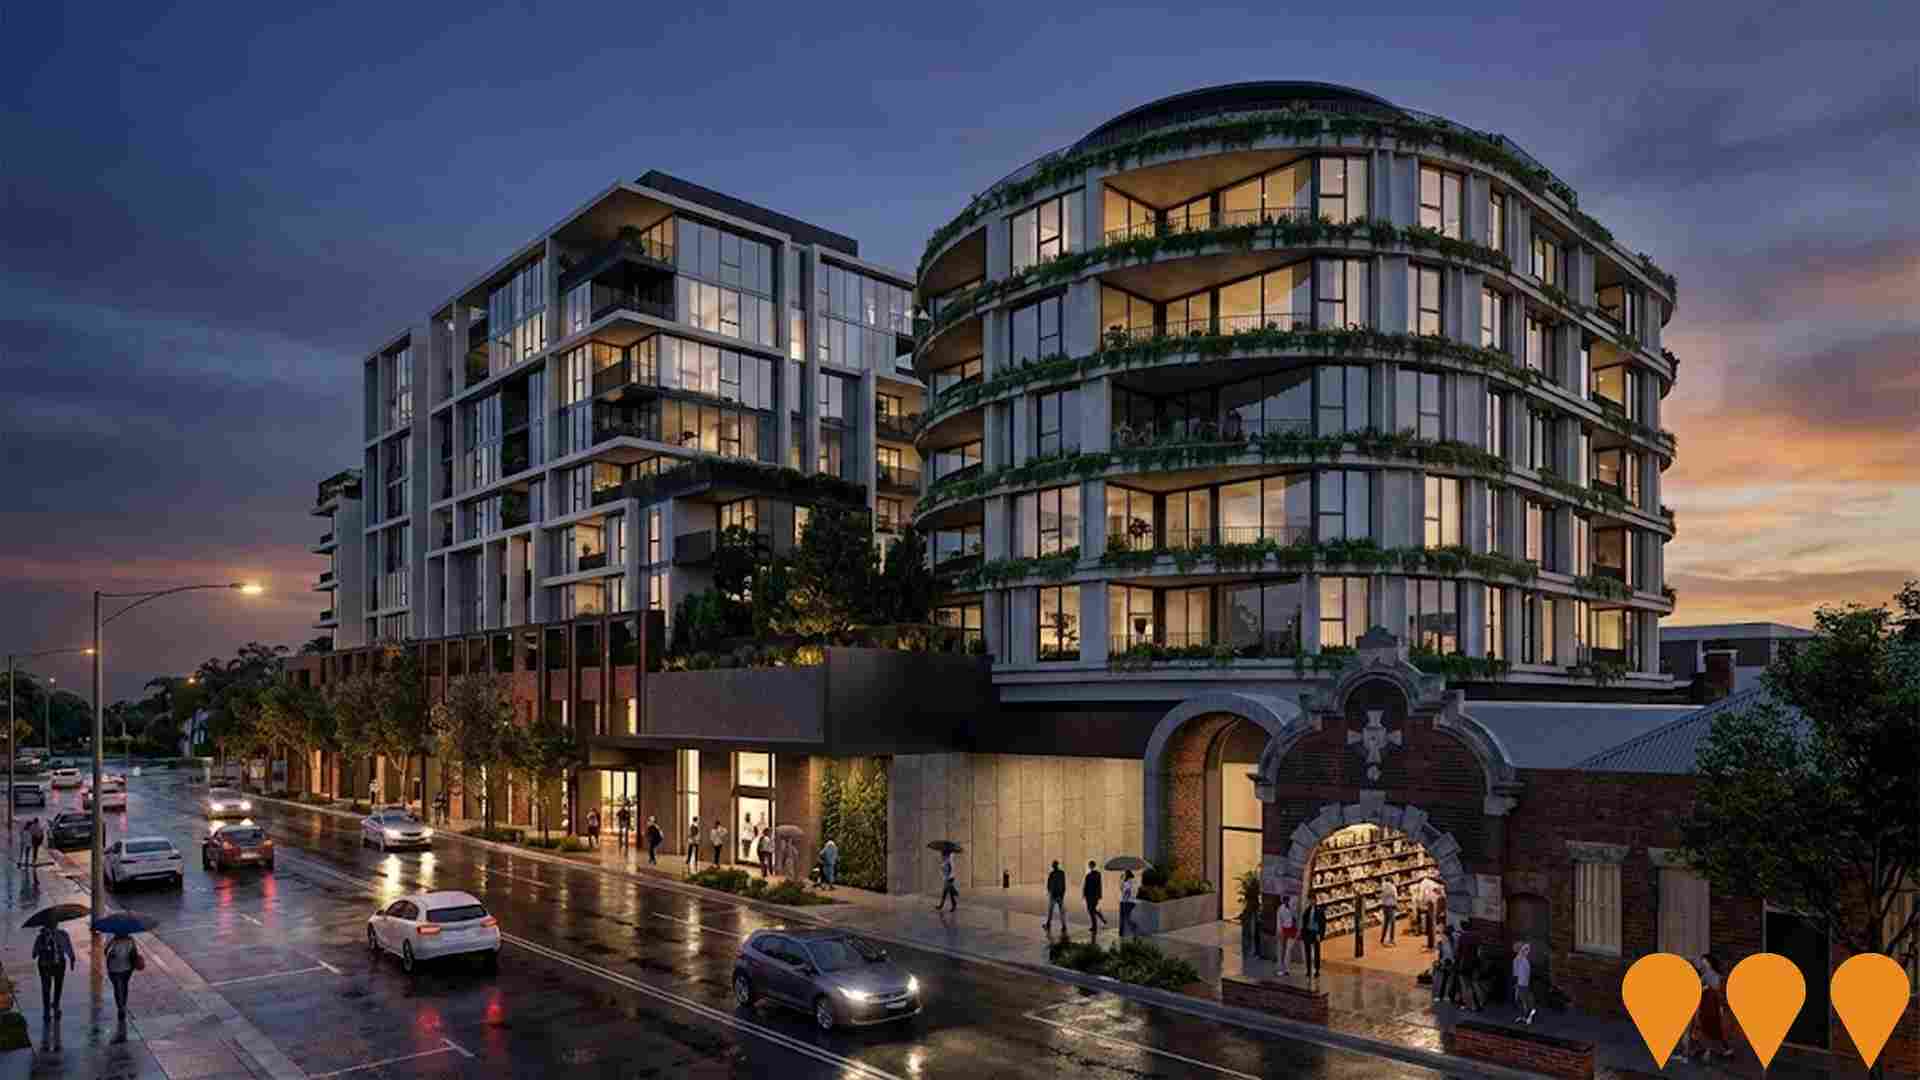
Elsternwick Structure Plan Implementation
Implementation of the Elsternwick Structure Plan focusing on sustainable urban development, improved public spaces, enhanced transport connectivity, and balanced residential and commercial growth in the Elsternwick activity centre.
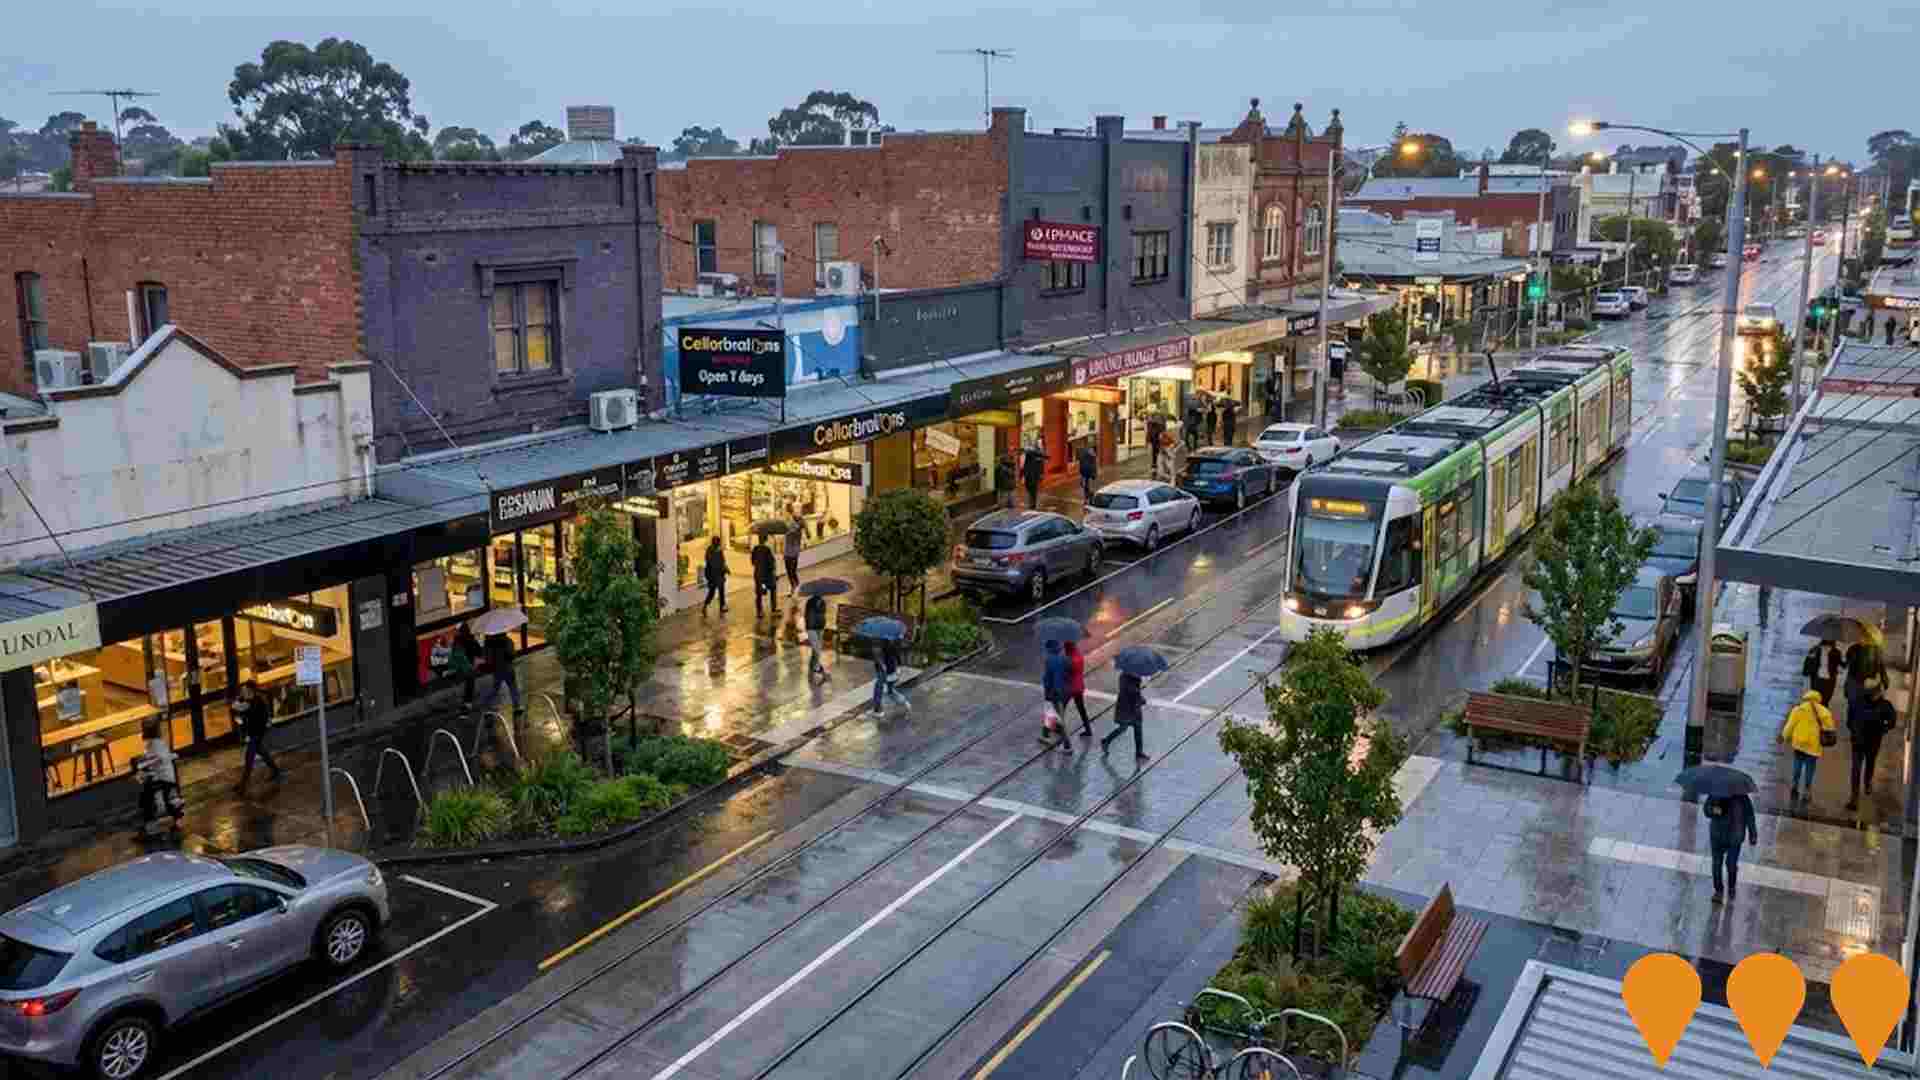
25 Sandham Street Townhouses
Boutique townhouse development by Coff Property on an 1800 square metre site in the sought-after suburb of Elsternwick. The luxury residential project is in early planning stages and will feature contemporary townhouse design in a highly desirable location close to Elsternwick Village, train station, tram lines, shops, dining, and amenities. The project represents Coff Property's commitment to medium-density residential development in Melbourne's inner south.
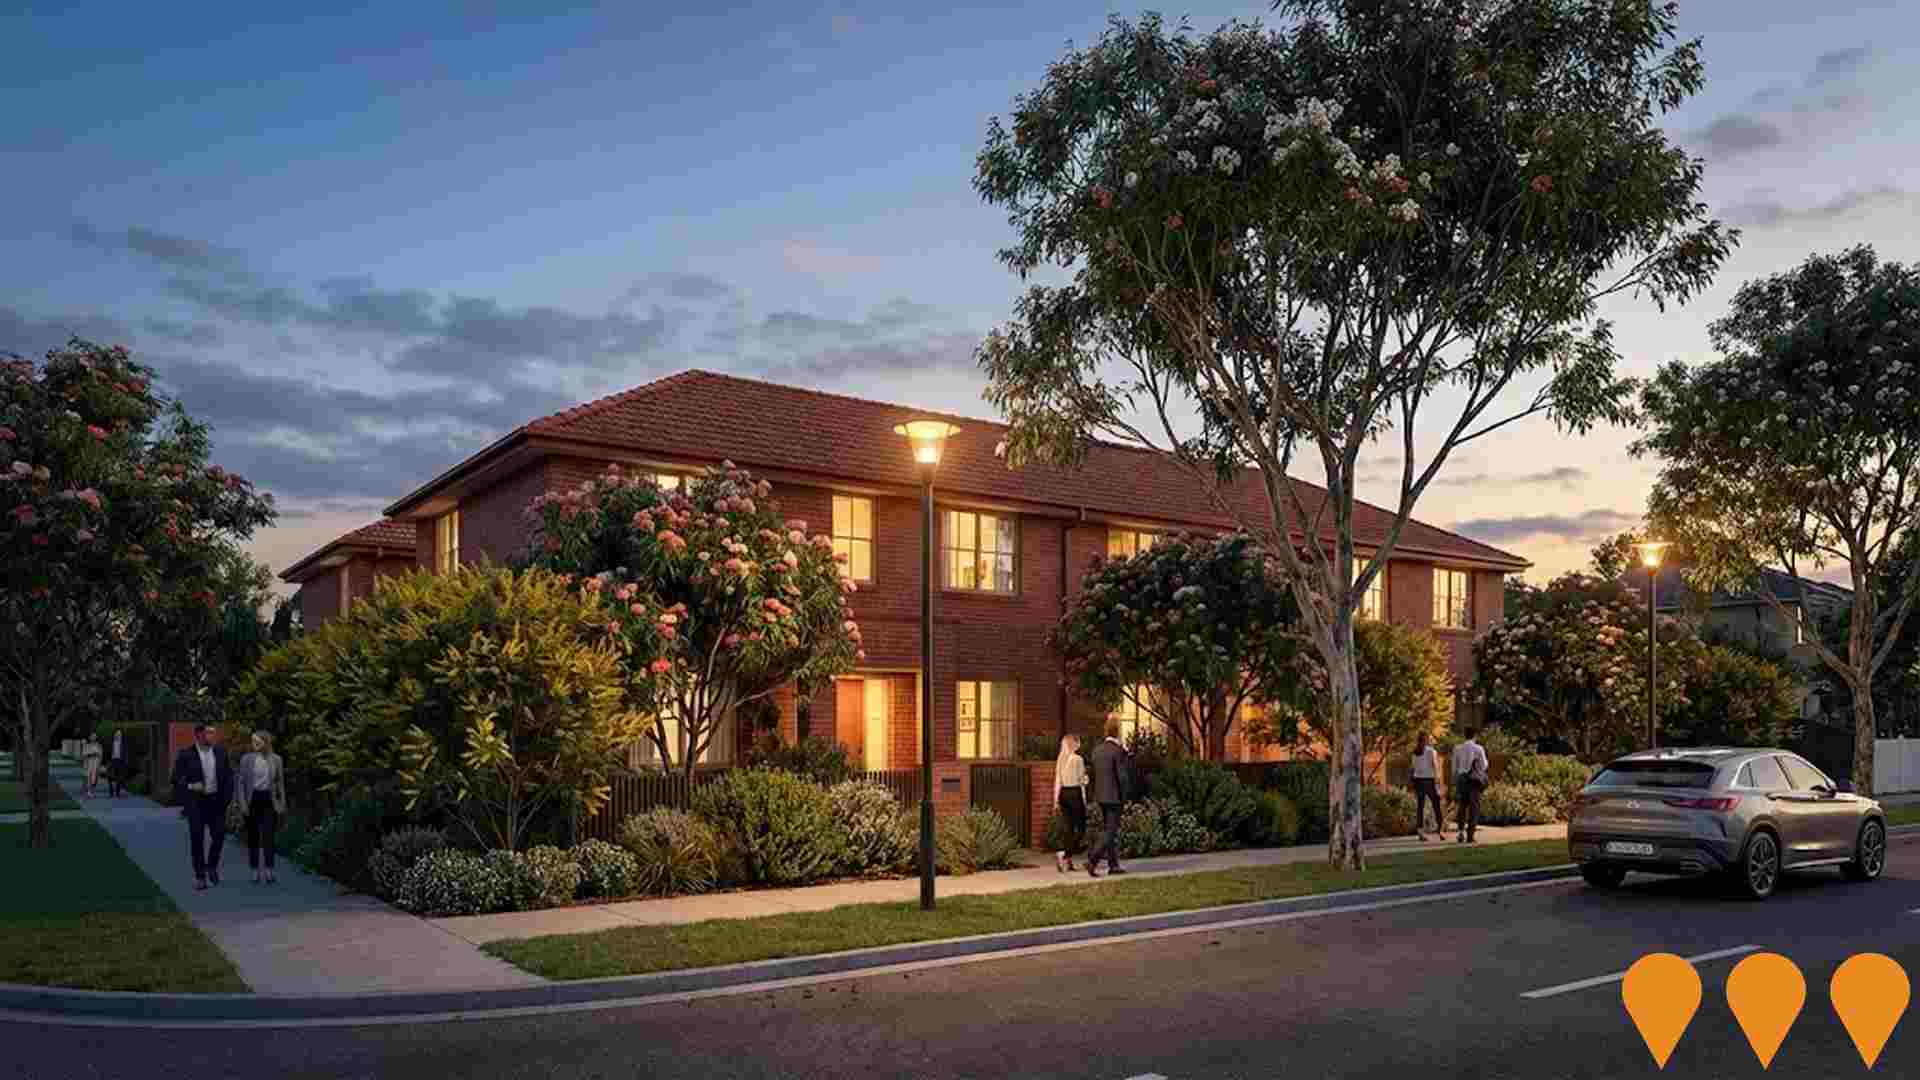
Seymour & Blanche Townhouses
Collection of 19 luxury townhouses in Elsternwick designed by Megowan Architectural. The project is being delivered by Freeman Group with Sinjen as builder. Construction is well underway with completion targeted for December 2025.

Employment
AreaSearch assessment positions Elsternwick ahead of most Australian regions for employment performance
Elsternwick has a highly educated workforce with professional services well represented. Its unemployment rate is 3.5%, lower than the Greater Melbourne average of 4.7%.
Employment stability was maintained over the past year. As of September 2025, 7,636 residents are employed, with an unemployment rate of 1.1% below Greater Melbourne's rate and a workforce participation rate of 69.6%, higher than Greater Melbourne's 64.1%. Key employment sectors include professional & technical, health care & social assistance, and education & training. The area specializes in professional & technical jobs, with an employment share 1.7 times the regional average.
Conversely, manufacturing has lower representation at 3.8% compared to the regional average of 7.2%. Many residents commute elsewhere for work based on Census data. Over the year to September 2025, labour force levels increased by 0.6%, while employment declined by 0.2%, resulting in an unemployment rate rise of 0.8 percentage points. In contrast, Greater Melbourne saw employment growth of 3.0% and labour force growth of 3.3%. State-level data to 25-Nov-25 shows VIC employment grew by 1.13% year-on-year, with the state unemployment rate at 4.7%, compared to the national rate of 4.3%. National employment forecasts from May-25 suggest a 6.6% increase over five years and 13.7% over ten years. Applying these projections to Elsternwick's employment mix indicates local employment should increase by 7.3% over five years and 14.6% over ten years, assuming constant population projections for illustrative purposes.
Frequently Asked Questions - Employment
Income
Income metrics indicate excellent economic conditions, with the area achieving higher performance than 75% of national locations assessed by AreaSearch
AreaSearch's latest postcode level ATO data released for financial year 2022 shows Elsternwick SA2 had a median income among taxpayers of $66,890 and an average of $106,903. These figures are exceptionally high nationally compared to Greater Melbourne's median of $54,892 and average of $73,761. As of September 2025, current estimates based on Wage Price Index growth of 12.16% would be approximately $75,024 (median) and $119,902 (average). Census 2021 income data shows household, family and personal incomes all rank highly in Elsternwick, between the 76th and 90th percentiles nationally. Income analysis reveals the largest segment comprises 28.7% earning $1,500 - 2,999 weekly (3,672 residents), similar to the metropolitan region where 32.8% occupy this bracket. A substantial proportion of high earners, at 36.6%, indicates strong economic capacity throughout the suburb. High housing costs consume 15.3% of income, but strong earnings place disposable income at the 76th percentile and the area's SEIFA income ranking places it in the 9th decile.
Frequently Asked Questions - Income
Housing
Elsternwick features a more urban dwelling mix with significant apartment living, with a higher proportion of rental properties than the broader region
Elsternwick's dwelling structure, as per the latest Census, consisted of 38.1% houses and 61.9% other dwellings (semi-detached, apartments, 'other' dwellings). This compares to Melbourne metro's 47.8% houses and 52.1% other dwellings. Home ownership in Elsternwick was at 31.2%, similar to Melbourne metro, with mortgaged dwellings at 28.6% and rented ones at 40.2%. The median monthly mortgage repayment in the area was $2,447, higher than Melbourne metro's average of $2,396. Median weekly rent in Elsternwick was $426, compared to Melbourne metro's $435. Nationally, Elsternwick's mortgage repayments were significantly higher at $2,447 versus the Australian average of $1,863, while rents were substantially above the national figure of $375.
Frequently Asked Questions - Housing
Household Composition
Elsternwick features high concentrations of lone person households and group households, with a lower-than-average median household size
Family households account for 60.5% of all households, including 27.0% couples with children, 25.3% couples without children, and 7.2% single parent families. Non-family households make up the remaining 39.5%, with lone person households at 34.5% and group households comprising 5.0%. The median household size is 2.3 people, which is smaller than the Greater Melbourne average of 2.5.
Frequently Asked Questions - Households
Local Schools & Education
Elsternwick shows strong educational performance, ranking in the upper quartile nationally when assessed across multiple qualification and achievement indicators
Educational attainment in Elsternwick is notably high, with 54.9% of residents aged 15 years and over holding university qualifications. This figure exceeds the national average of 30.4% and the Victorian state average of 33.4%. Bachelor degrees are the most common, held by 35.1% of residents, followed by postgraduate qualifications (14.0%) and graduate diplomas (5.8%). Vocational pathways account for 20.1% of qualifications among those aged 15 years and over, with advanced diplomas held by 10.1% and certificates by 10.0%.
Educational participation is high, with 28.8% of residents currently enrolled in formal education. This includes 8.6% in primary education, 7.8% in secondary education, and 6.9% pursuing tertiary education.
Frequently Asked Questions - Education
Schools Detail
Nearby Services & Amenities
Transport
Transport servicing is high compared to other areas nationally based on assessment of service frequency, route connectivity and accessibility
Elsternwick has 70 active public transport stops. These include train, light rail, and bus services. There are 12 routes in total, serving 11,053 weekly passenger trips.
Residents enjoy excellent transport accessibility, with an average distance of 147 meters to the nearest stop. Daily service frequency averages 1,579 trips across all routes, equating to approximately 157 weekly trips per individual stop.
Frequently Asked Questions - Transport
Transport Stops Detail
Health
Elsternwick's residents are extremely healthy with very low prevalence of common health conditions across all age groups
Analysis of health metrics indicates robust performance across Elsternwick, with a very low prevalence of common health conditions across all age groups. Approximately 75% of the total population (9,559 people) has private health cover, compared to Greater Melbourne's 65.2%, and the national average of 55.3%. Mental health issues and asthma were found to be the most prevalent medical conditions in the area, impacting 7.9 and 6.8% of residents respectively.
A total of 73.8% of residents declared themselves completely clear of medical ailments, compared to Greater Melbourne's 74.0%. Elsternwick has 18.5% of its population aged 65 and over (2,362 people), which is higher than Greater Melbourne's 16.8%. Health outcomes among seniors are notably strong, broadly aligning with the general population's health profile.
Frequently Asked Questions - Health
Cultural Diversity
The level of cultural diversity witnessed in Elsternwick was found to be above average when compared nationally for a number of language and cultural background related metrics
Elsternwick, surveyed in June 2021, had a higher proportion of residents speaking languages other than English at home, with 20.4%, compared to most local markets. Born overseas, 30.5% of Elsternwick's population was recorded in the same survey. Christianity was found to be the predominant religion, comprising 32.7%.
However, Judaism stood out as significantly overrepresented, making up 18.1% of Elsternwick's population compared to 17.5% across Greater Melbourne. Regarding ancestry, English (22.1%), Australian (19.9%), and Other (13.9%) were the top three groups in Elsternwick. Notably, Polish residents were overrepresented at 3.6%, compared to 3.1% regionally, while Russian residents were underrepresented at 1.5%, versus 2.2%. Hungarian residents also stood out with a slightly higher representation of 1.0%, compared to the regional average of 0.8%.
Frequently Asked Questions - Diversity
Age
Elsternwick's population is slightly younger than the national pattern
The median age in Elsternwick as of 2021 was 38 years, similar to Greater Melbourne's average of 37 and Australia's median of 38. Compared to Greater Melbourne, Elsternwick had a higher percentage of residents aged 75-84 (6.8% vs 5.9%) but fewer residents aged 35-44 (12.8% vs 14.2%). Between the 2016 and 2021 censuses, Elsternwick's 75-84 age group increased from 4.7% to 6.8%, while the 15-24 cohort rose from 10.8% to 12.5%. Conversely, the 35-44 cohort decreased from 14.4% to 12.8%, and the 5-14 group fell from 11.8% to 10.4%. By 2041, Elsternwick's age composition is projected to change significantly. The 75-84 cohort is expected to grow by 63%, reaching 1,414 people from 865. Those aged 65 and above are projected to comprise 60% of the population growth. Meanwhile, the number of residents aged 0-4 is expected to decrease.
