Chart Color Schemes
This analysis uses ABS Statistical Areas Level 2 (SA2) boundaries, which can materially differ from Suburbs and Localities (SAL) even when sharing similar names.
SA2 boundaries are defined by the Australian Bureau of Statistics and are designed to represent communities for statistical reporting (e.g., census and ERP).
Suburbs and Localities (SAL) represent commonly-used suburb/locality names (postal-style areas) and may use different geographic boundaries. For comprehensive analysis, consider reviewing both boundary types if available.
est. as @ -- *
ABS ERP | -- people | --
2021 Census | -- people
Sales Activity
Curious about local property values? Filter the chart to assess the volume and appreciation (including resales) trends and regional comparisons, or scroll to the map below view this information at an individual property level.
Find a Recent Sale
Sales Detail
Population
Laverton lies within the top 10% of areas nationally in terms of population growth performance according to AreaSearch analysis of short and medium-term trends
Based on AreaSearch's analysis, Laverton's population is around 13,232 as of Nov 2025. This reflects an increase of 1,773 people from the figure reported in the 2021 Census, which was 11,459 people. The change is inferred from the estimated resident population of 12,754 as of June 2024 and an additional 530 validated new addresses since the Census date. This level of population equates to a density ratio of 594 persons per square kilometer. Laverton's growth rate of 15.5% since the 2021 census exceeded both the national average (8.9%) and the state average, marking it as a growth leader in the region. Overseas migration contributed approximately 68.6% of overall population gains during recent periods.
AreaSearch is adopting ABS/Geoscience Australia projections for each SA2 area, released in 2024 with 2022 as the base year. For areas not covered by this data, AreaSearch utilises VIC State Government's Regional/LGA projections released in 2023, adjusted employing a method of weighted aggregation of population growth from LGA to SA2 levels. Growth rates by age group are applied across all areas for years 2032 to 2041. Future trends predict exceptional growth, placing Laverton in the top 10 percent of statistical areas analysed by AreaSearch. By 2041, the area is expected to grow by 6,793 persons based on the latest annual ERP population numbers, reflecting a gain of 47.7% in total over the 17 years.
Frequently Asked Questions - Population
Development
AreaSearch assessment of residential development activity positions Laverton among the top 25% of areas assessed nationwide
Laverton has averaged approximately 117 new dwelling approvals annually over the past five financial years, totalling 588 homes. As of FY26, 36 approvals have been recorded. On average, 2.1 people move to Laverton per year for each new home constructed between FY21 and FY25. New homes are constructed at an average cost of $188,000, which is below the regional average, suggesting more affordable housing options.
In FY26, there have been $172.3 million in commercial approvals, indicating high local commercial activity. When compared to Greater Melbourne, Laverton has around two-thirds the rate of new dwelling approvals per person and ranks among the 60th percentile nationally. New development consists of 44.0% detached houses and 56.0% medium and high-density housing, marking a shift from existing housing patterns (currently 82.0% houses). This transition reflects diminishing developable land availability and evolving lifestyle preferences. Laverton has around 245 people per approval, reflecting a transitioning market.
Population forecasts indicate Laverton will gain approximately 6,315 residents by 2041. Construction is maintaining pace with projected growth, but buyers may face increasing competition as population increases.
Frequently Asked Questions - Development
Infrastructure
Laverton has strong levels of nearby infrastructure activity, ranking in the top 30% nationally
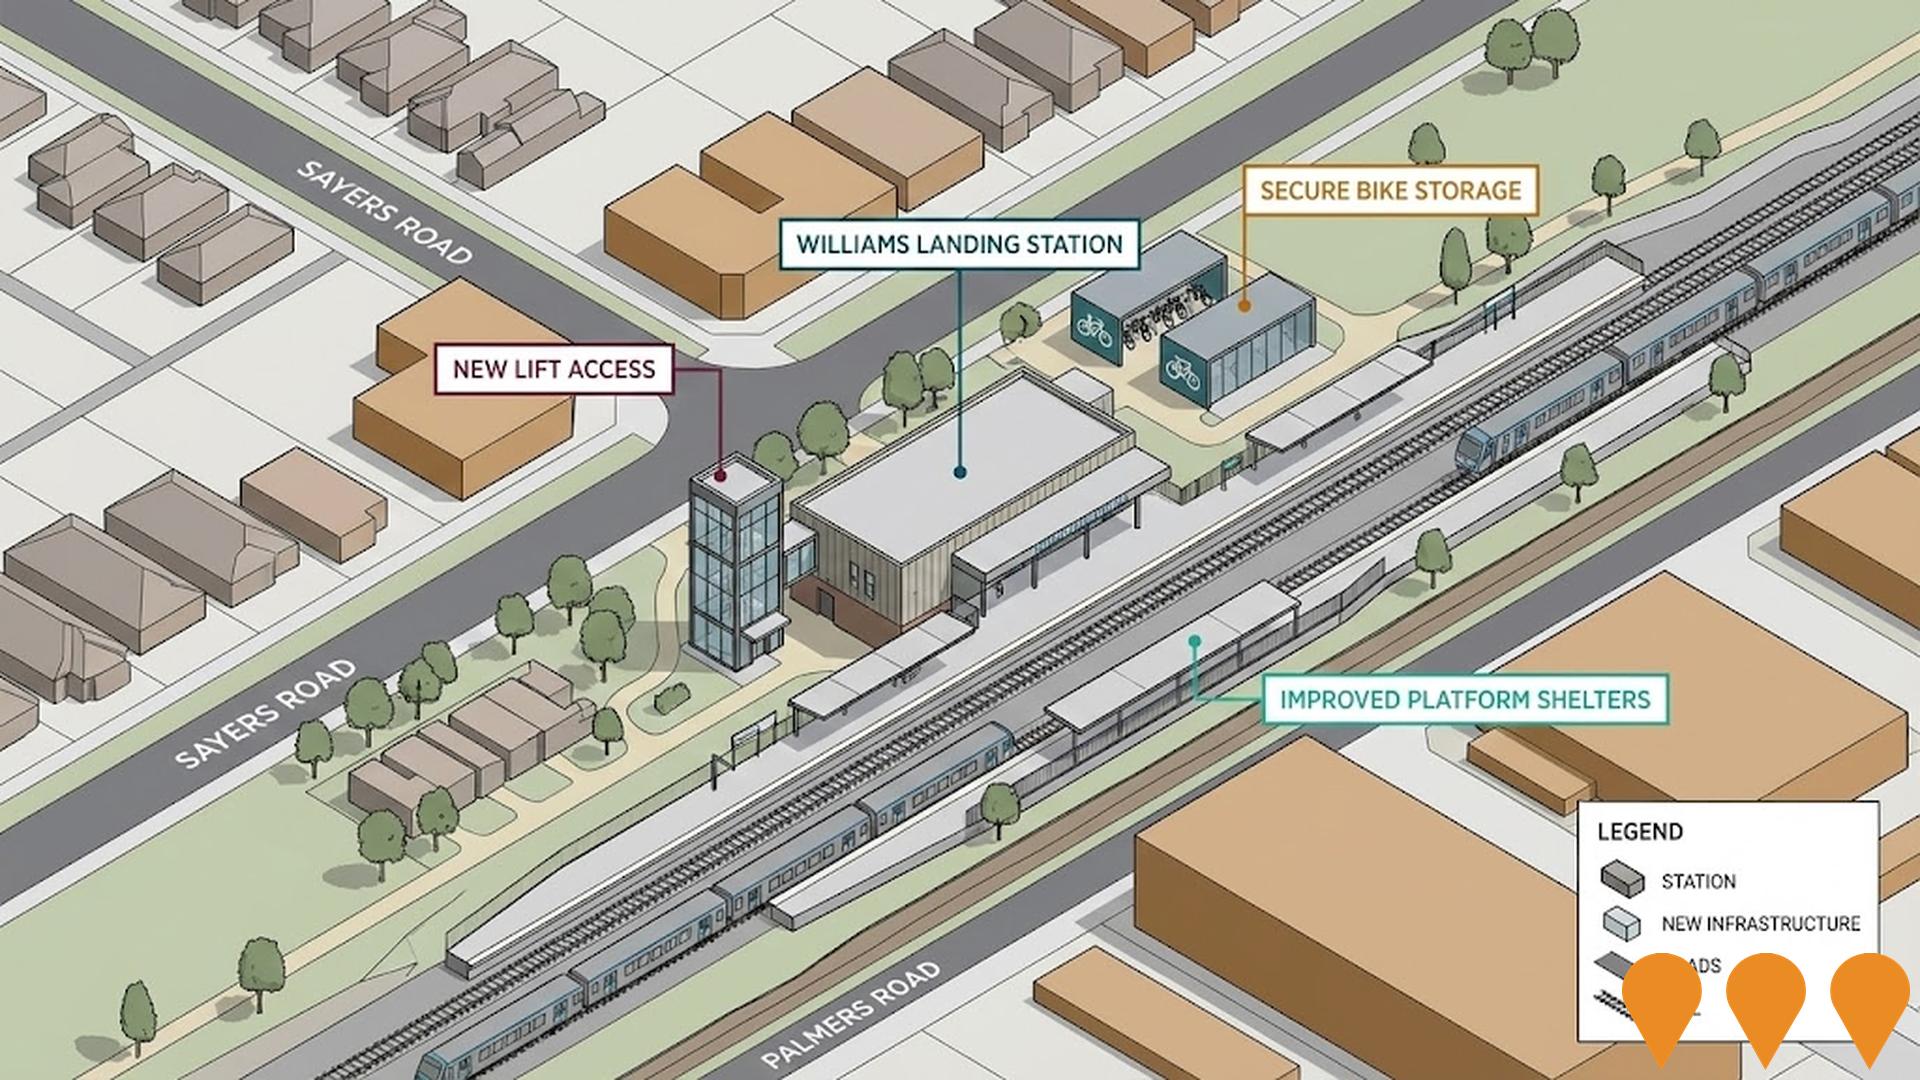
Infrastructure changes significantly influence an area's performance. AreaSearch identified 28 projects likely impacting the area. Notable ones are Greening the Pipeline, Williams Landing Office Buildings Development - Boston Commons & Hudson Hub, Williams Landing Town Centre Development, and Williams Landing Station Improvements. The following list details those most relevant.
Professional plan users can use the search below to filter and access additional projects.
INFRASTRUCTURE SEARCH
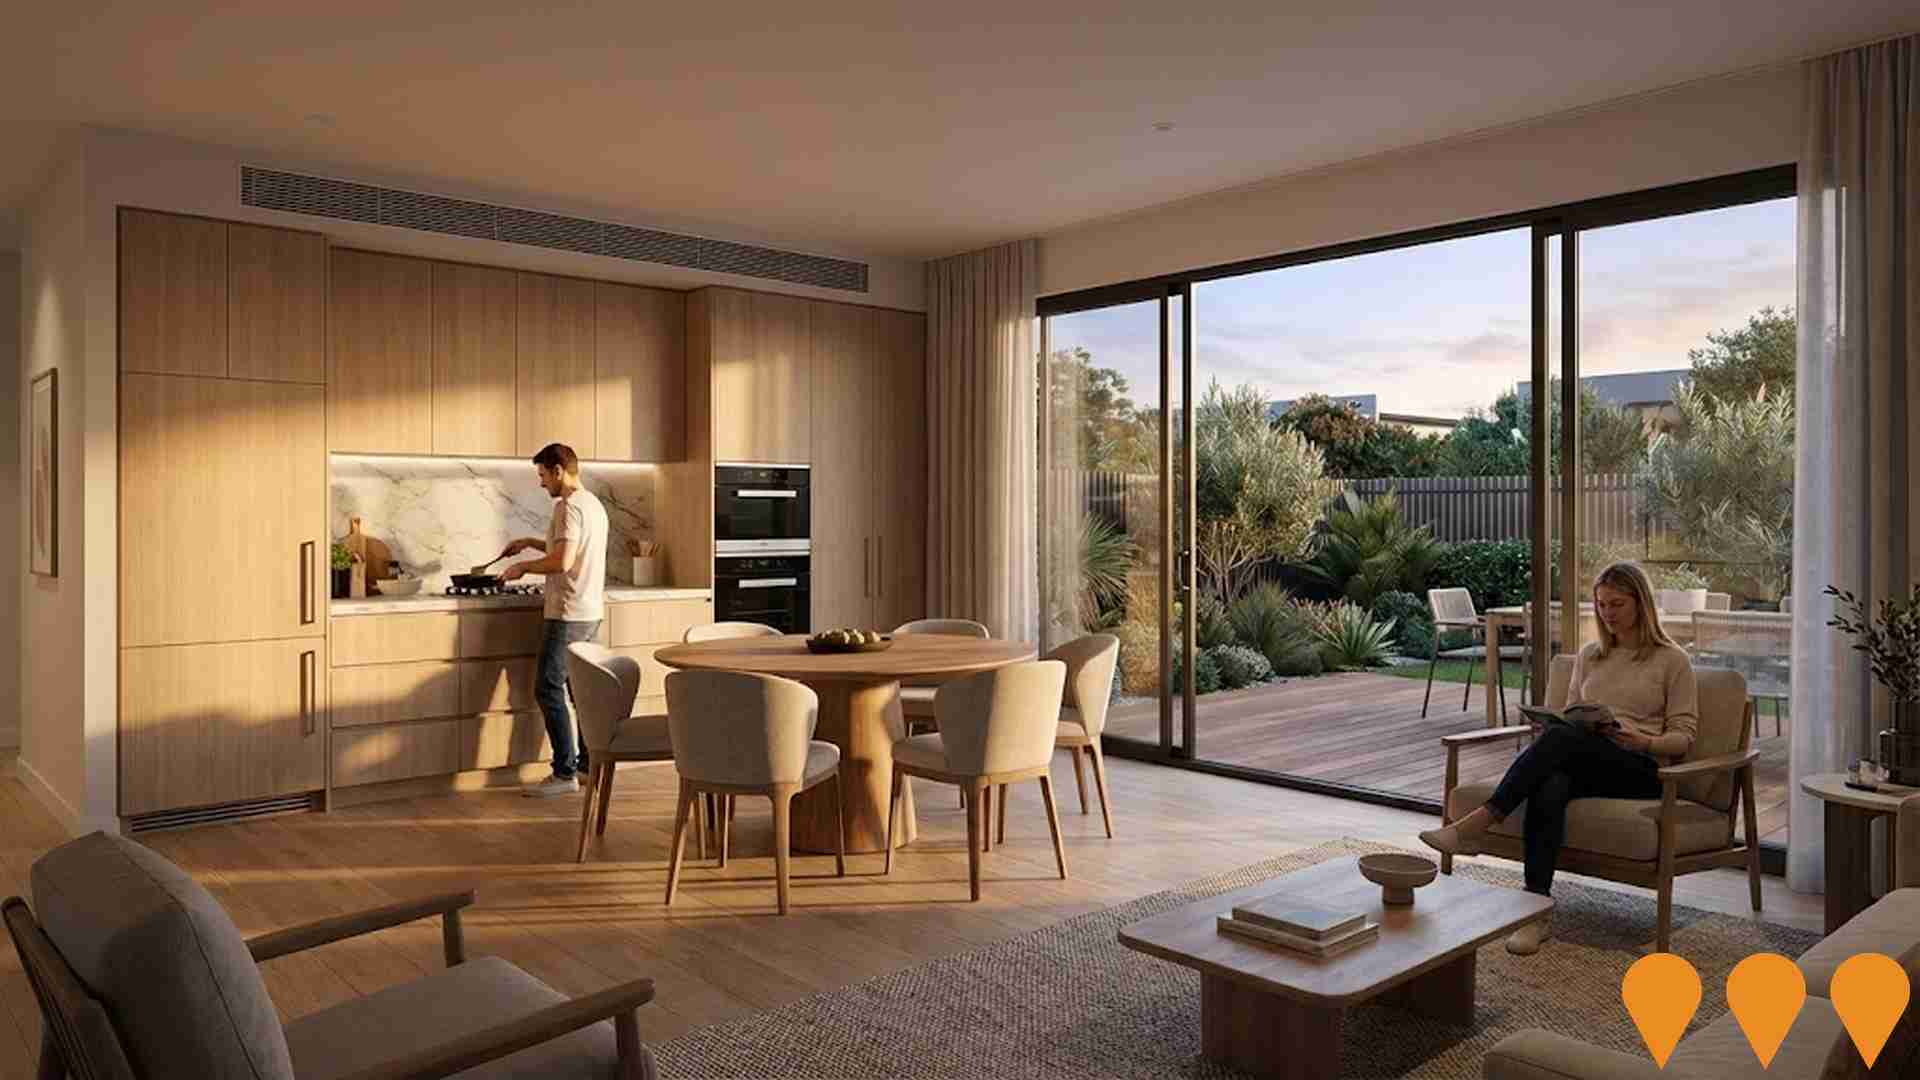
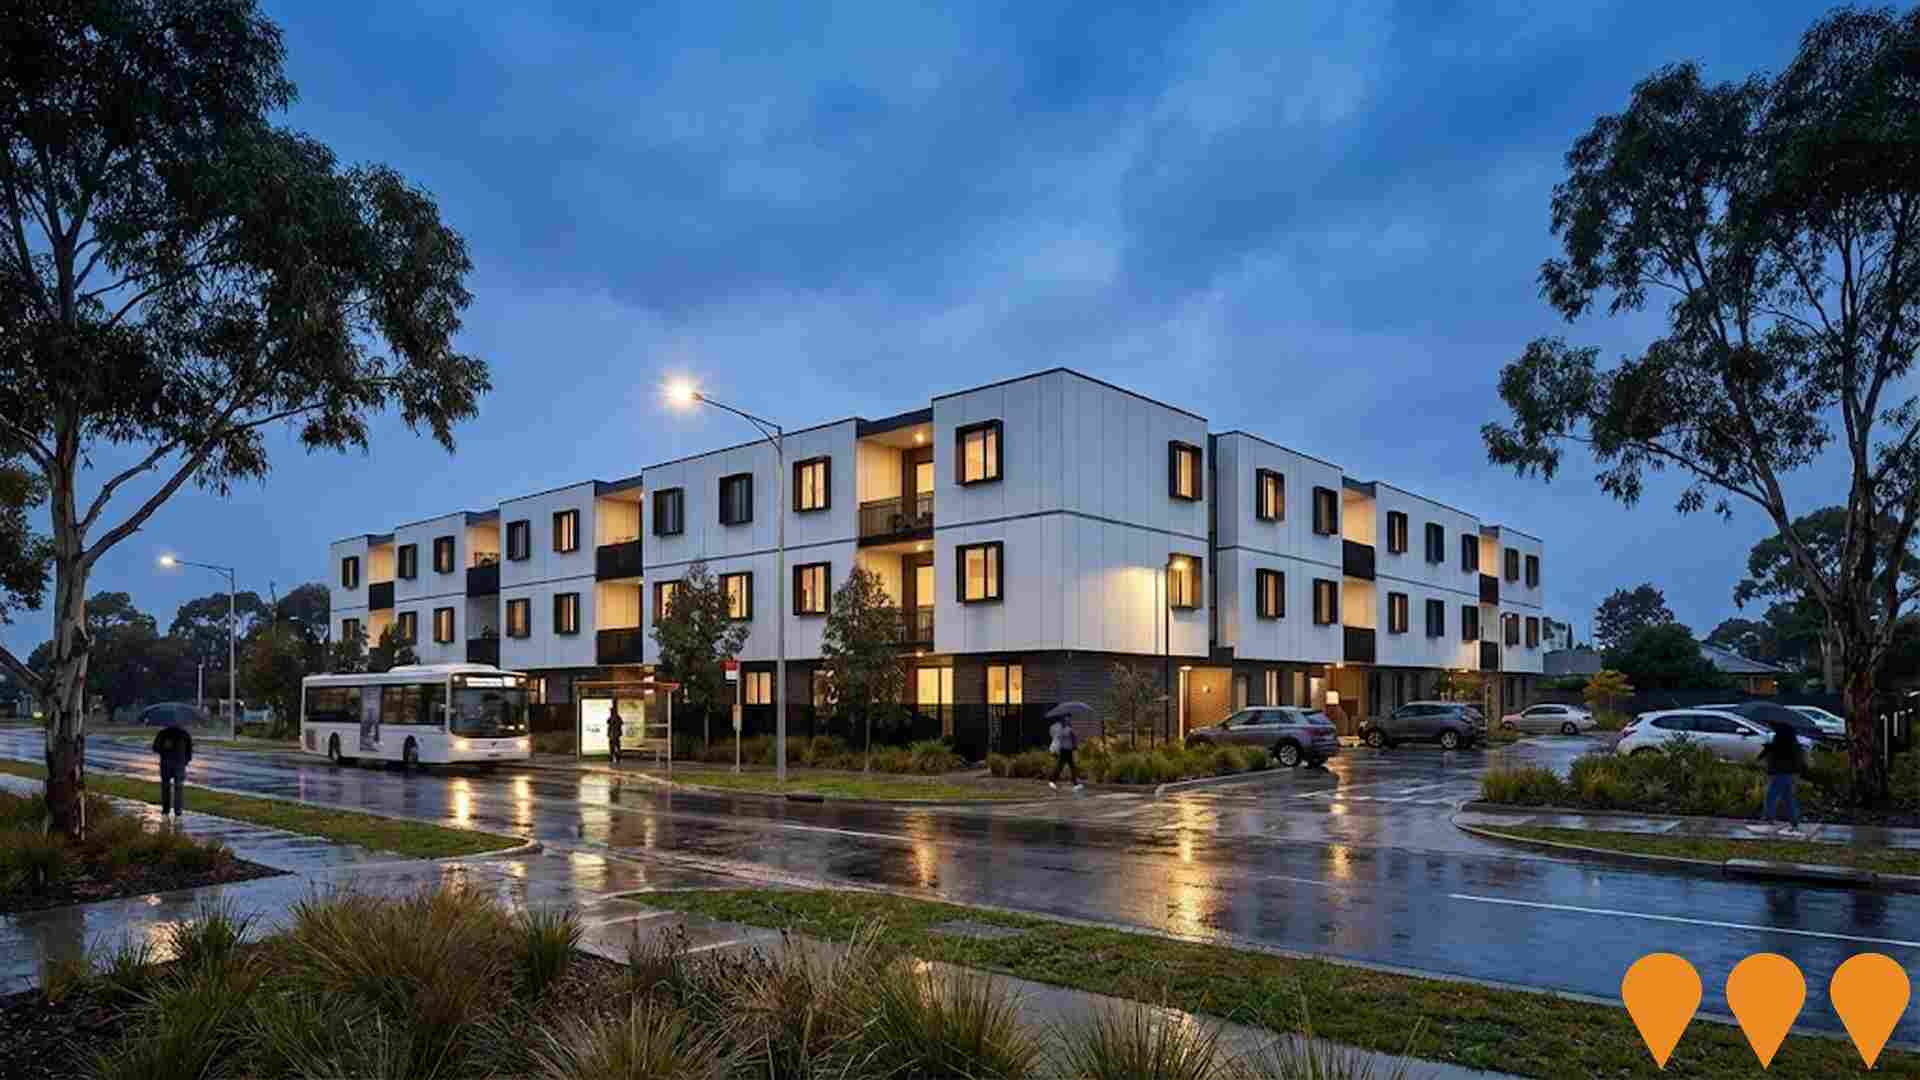
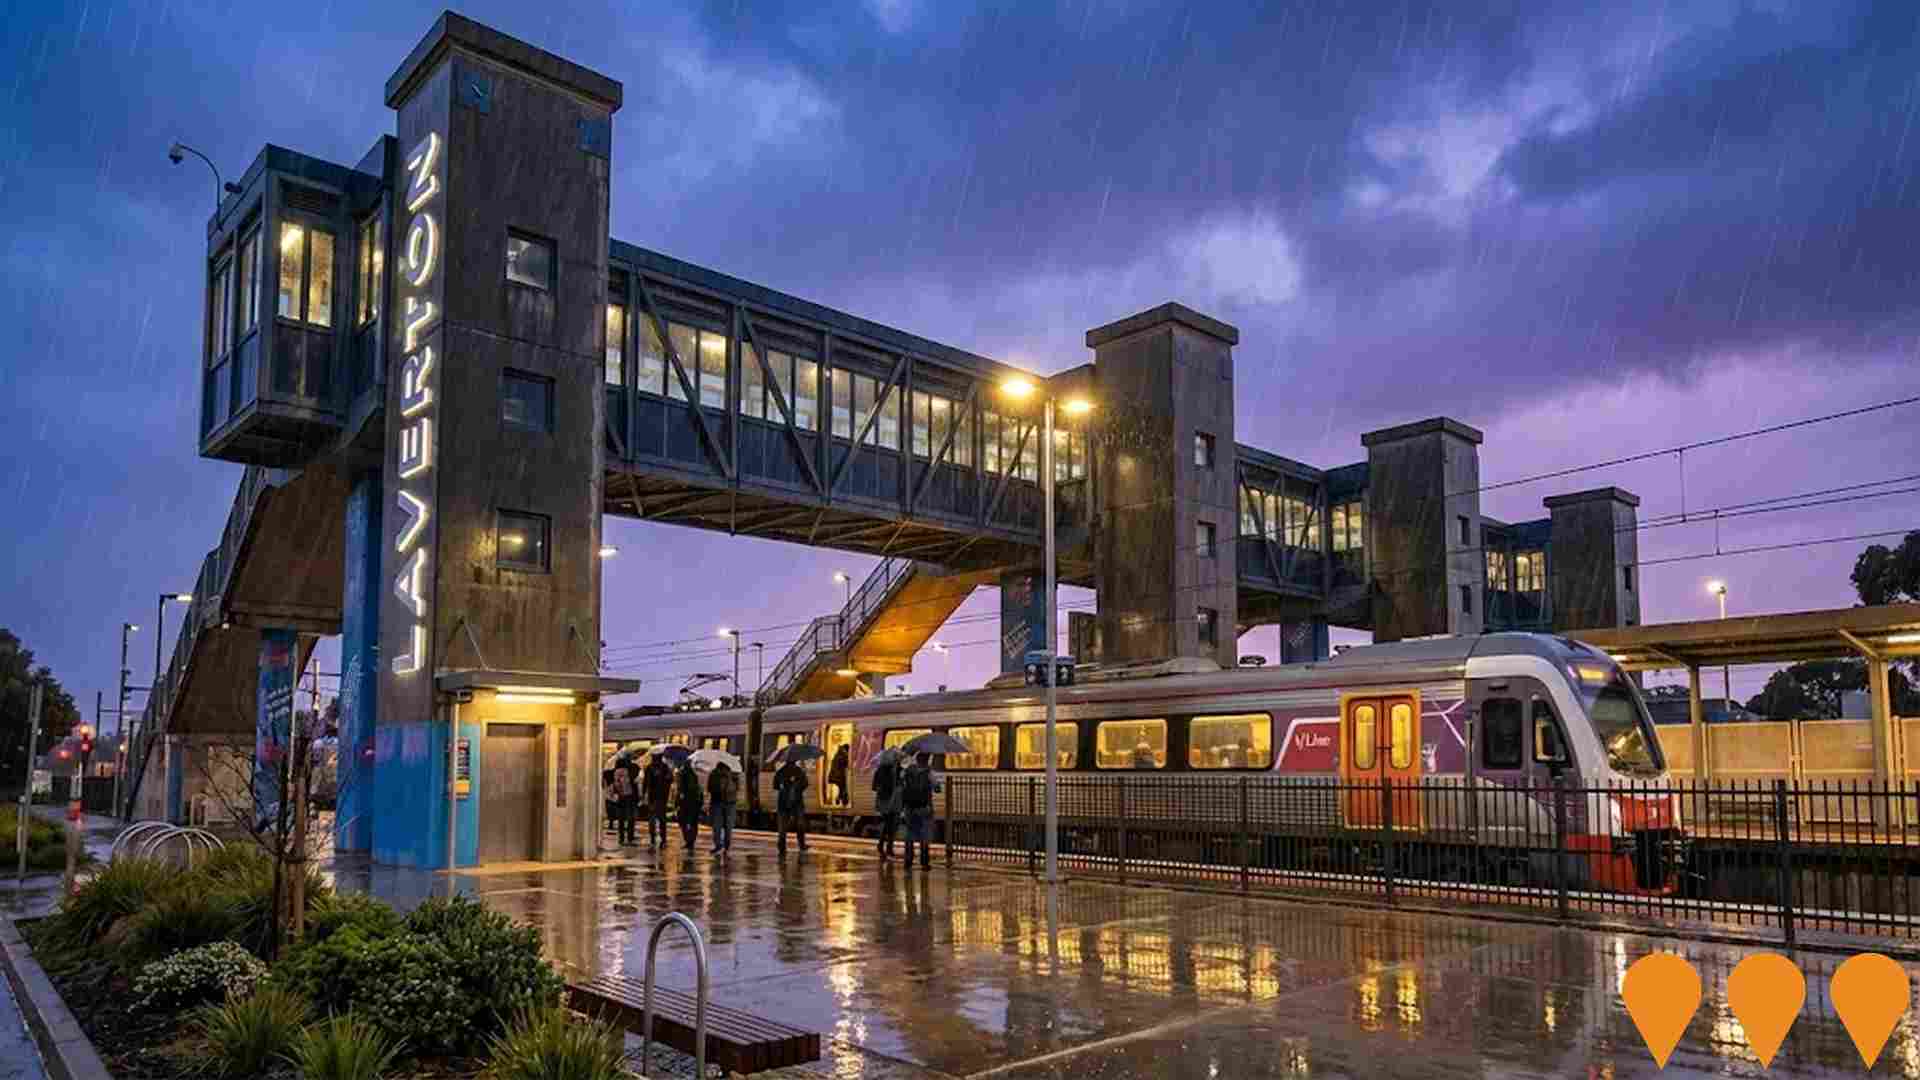
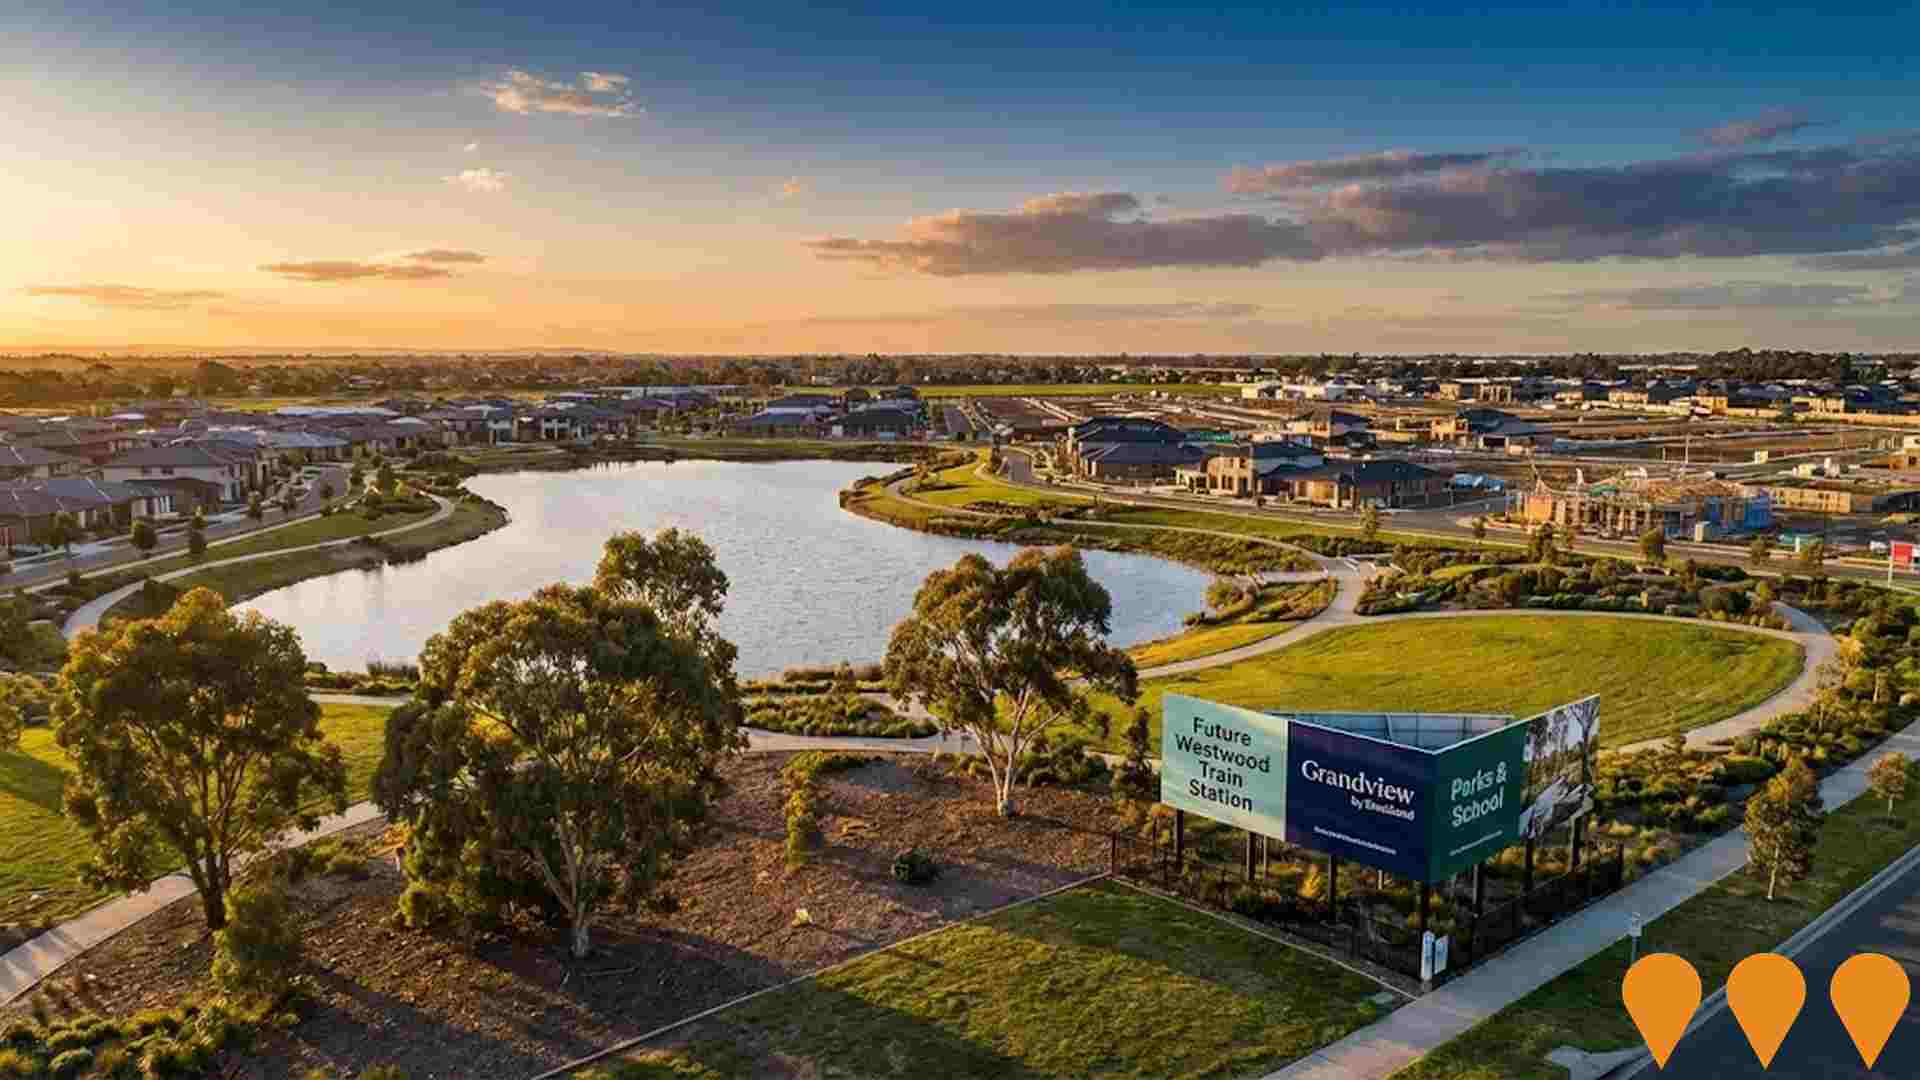
 Denotes AI-based impression for illustrative purposes only, not to be taken as definitive under any circumstances. Please follow links and conduct other investigations from the project's source for actual imagery. Developers and project owners wishing us to use original imagery please Contact Us and we will do so.
Frequently Asked Questions - Infrastructure
Point Cook Community Hospital
New public community hospital delivering chemotherapy, dialysis, public dental services, outpatient care and diagnostic imaging. Part of the Victorian Government's $1.4 billion community hospital program to relieve pressure on Werribee Mercy, Footscray and Sunshine hospitals. Construction commenced in late 2024 after significant delays.

Grandview
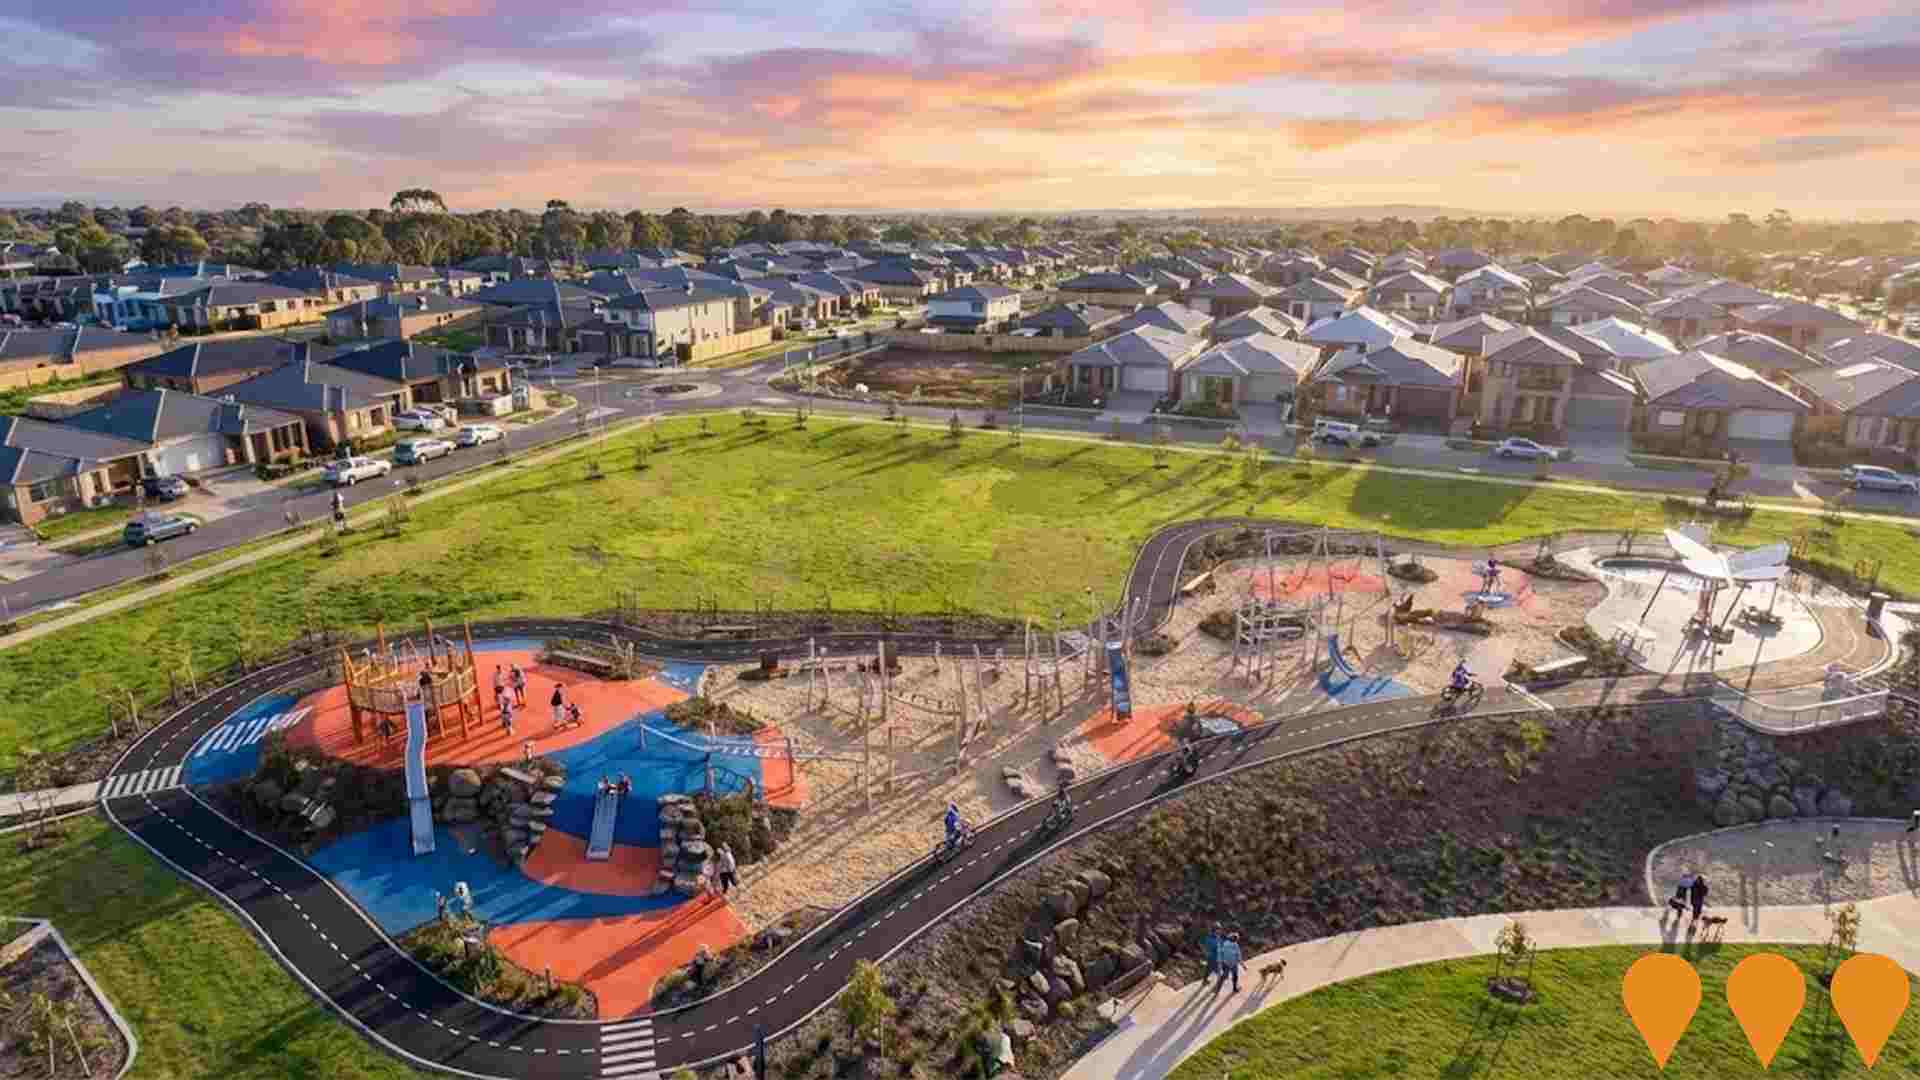
Grandview is Stockland's 138-hectare masterplanned residential community in Truganina, west of Melbourne. Construction is well underway with multiple stages released and civil works progressing. The estate will deliver approximately 1,700 lots for over 1,600 homes, a future government primary school site, community activity centre, multiple parks including the large Dinosaur Park, conservation areas and direct connection to the future Westwood train station precinct.
Williams Landing Town Centre Development
43-hectare master-planned town centre development, designated as a Priority Development Zone. It is set to become a major mixed-use superhub with office buildings (like the recently completed Boston Commons and the under-construction Hudson Hub), residential apartments (such as Addison Walk townhomes), and a transport hub. Key features include the Target Australia headquarters and the Emergency Services Telecommunications Authority. The initial Williams Landing Shopping Centre component was developed by Cedar Woods in 2014 and sold in early 2024 to HomeCo, but Cedar Woods retains and continues to develop land for commercial, retail, and mixed-use opportunities within the Town Centre. The overall development is projected to include over 1,300 dwellings and more than 200,000sqm of office and retail space on completion.

Greening the Pipeline
The Greening the Pipeline initiative is transforming the 27km heritage-listed Main Outfall Sewer reserve along the Federation Trail in Melbournes west into a greener, cooler linear parkland and community space, enhancing active transport links, community connectivity, urban greening, and integrated water management.

Manor Lakes North Reserve Master Plan Implementation
Two-stage development of Manor Lakes North Reserve featuring active open space facilities. Stage 1 ($9.5M) includes an oval with cricket pitch overlay, cricket nets, six tennis courts, car park, playground, multi-use court, footpath network, shelter, BBQ and picnic facilities, landscaping, and exercise equipment. Stage 2 will feature a modular sports pavilion with social room, change rooms, storerooms, and kiosk. Construction on Stage 1 began in late 2024 with completion scheduled for late 2025.

Williams Landing Office Buildings Development - Boston Commons & Hudson Hub
Major office development comprising multiple buildings in Williams Landing Town Centre. Boston Commons (completed 2024) features 76 strata offices across 7 storeys. Hudson Hub (under construction, completion Q1 2026) will offer 73 strata office suites with rooftop terrace and premium amenities. Both designed by Hames Sharley with industrial-modern aesthetics, featuring end-of-trip facilities, EV charging, and sustainability initiatives including solar panels.

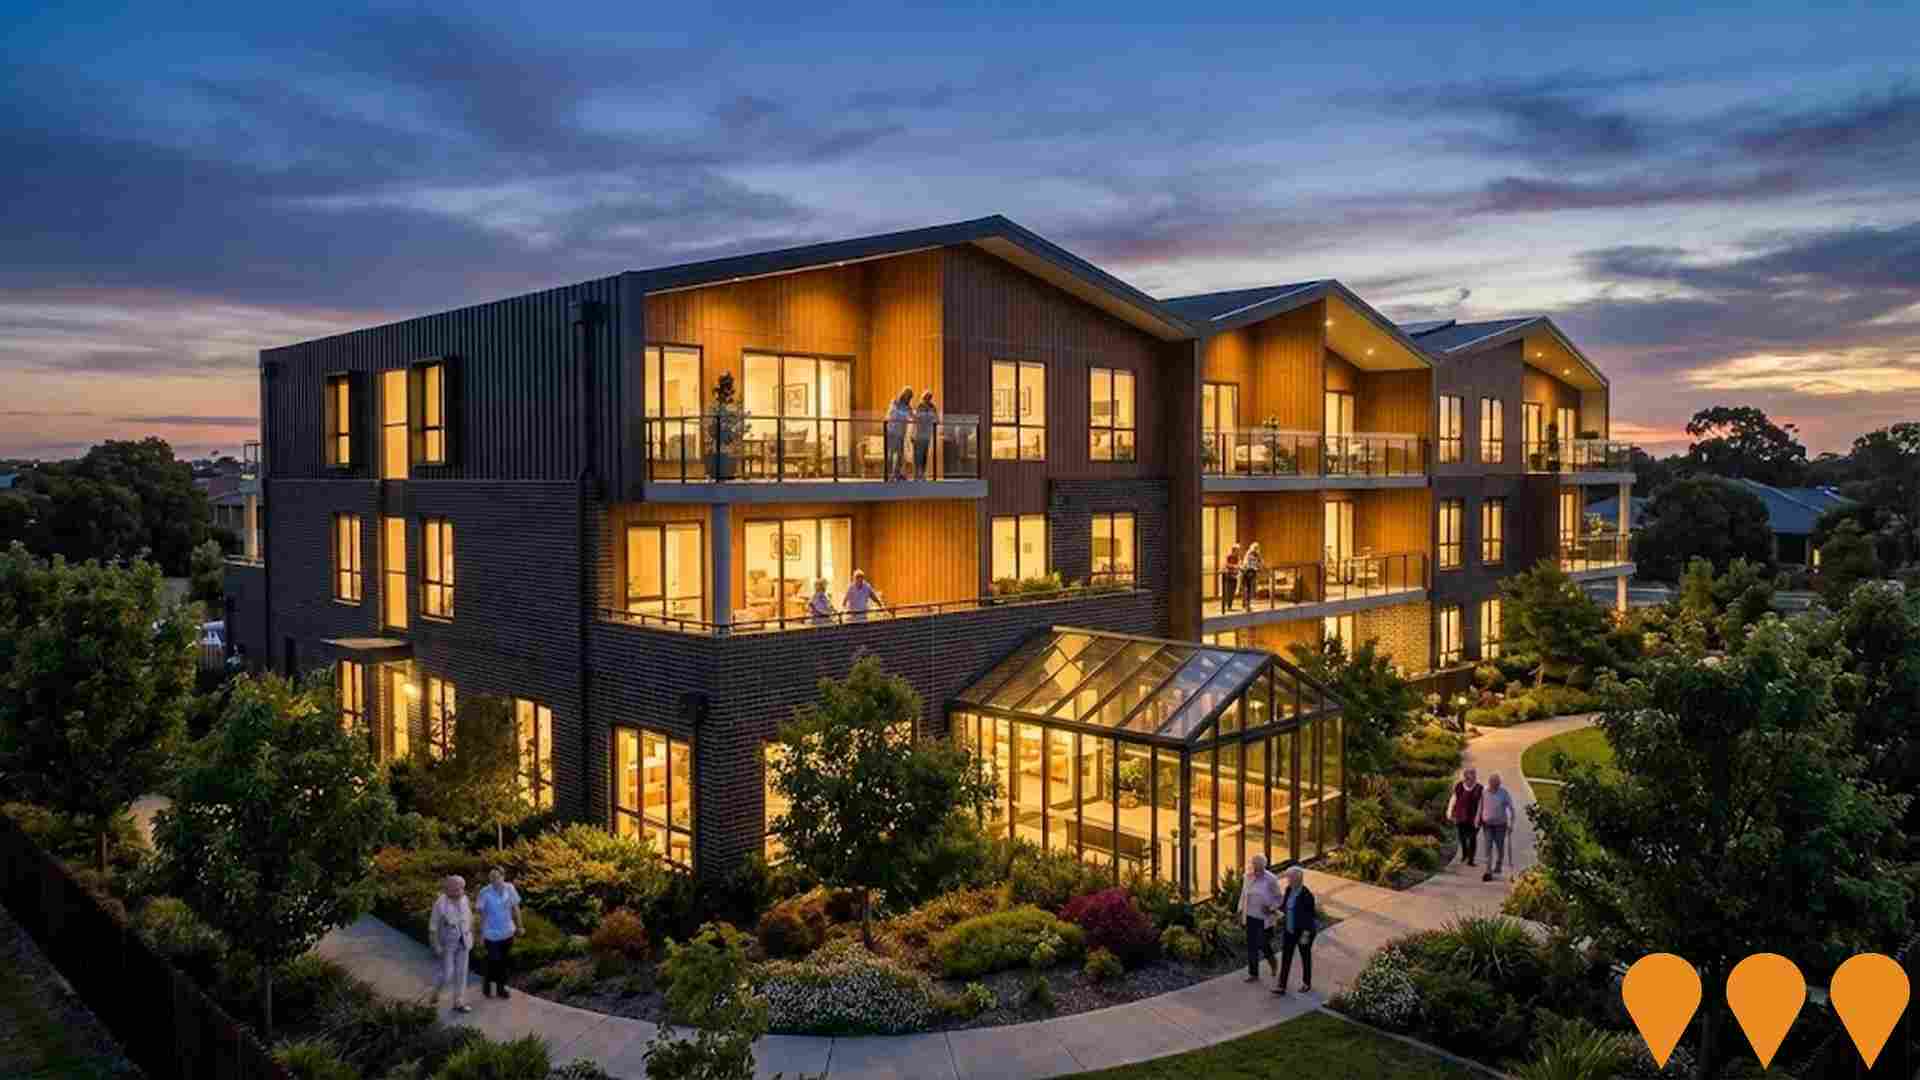
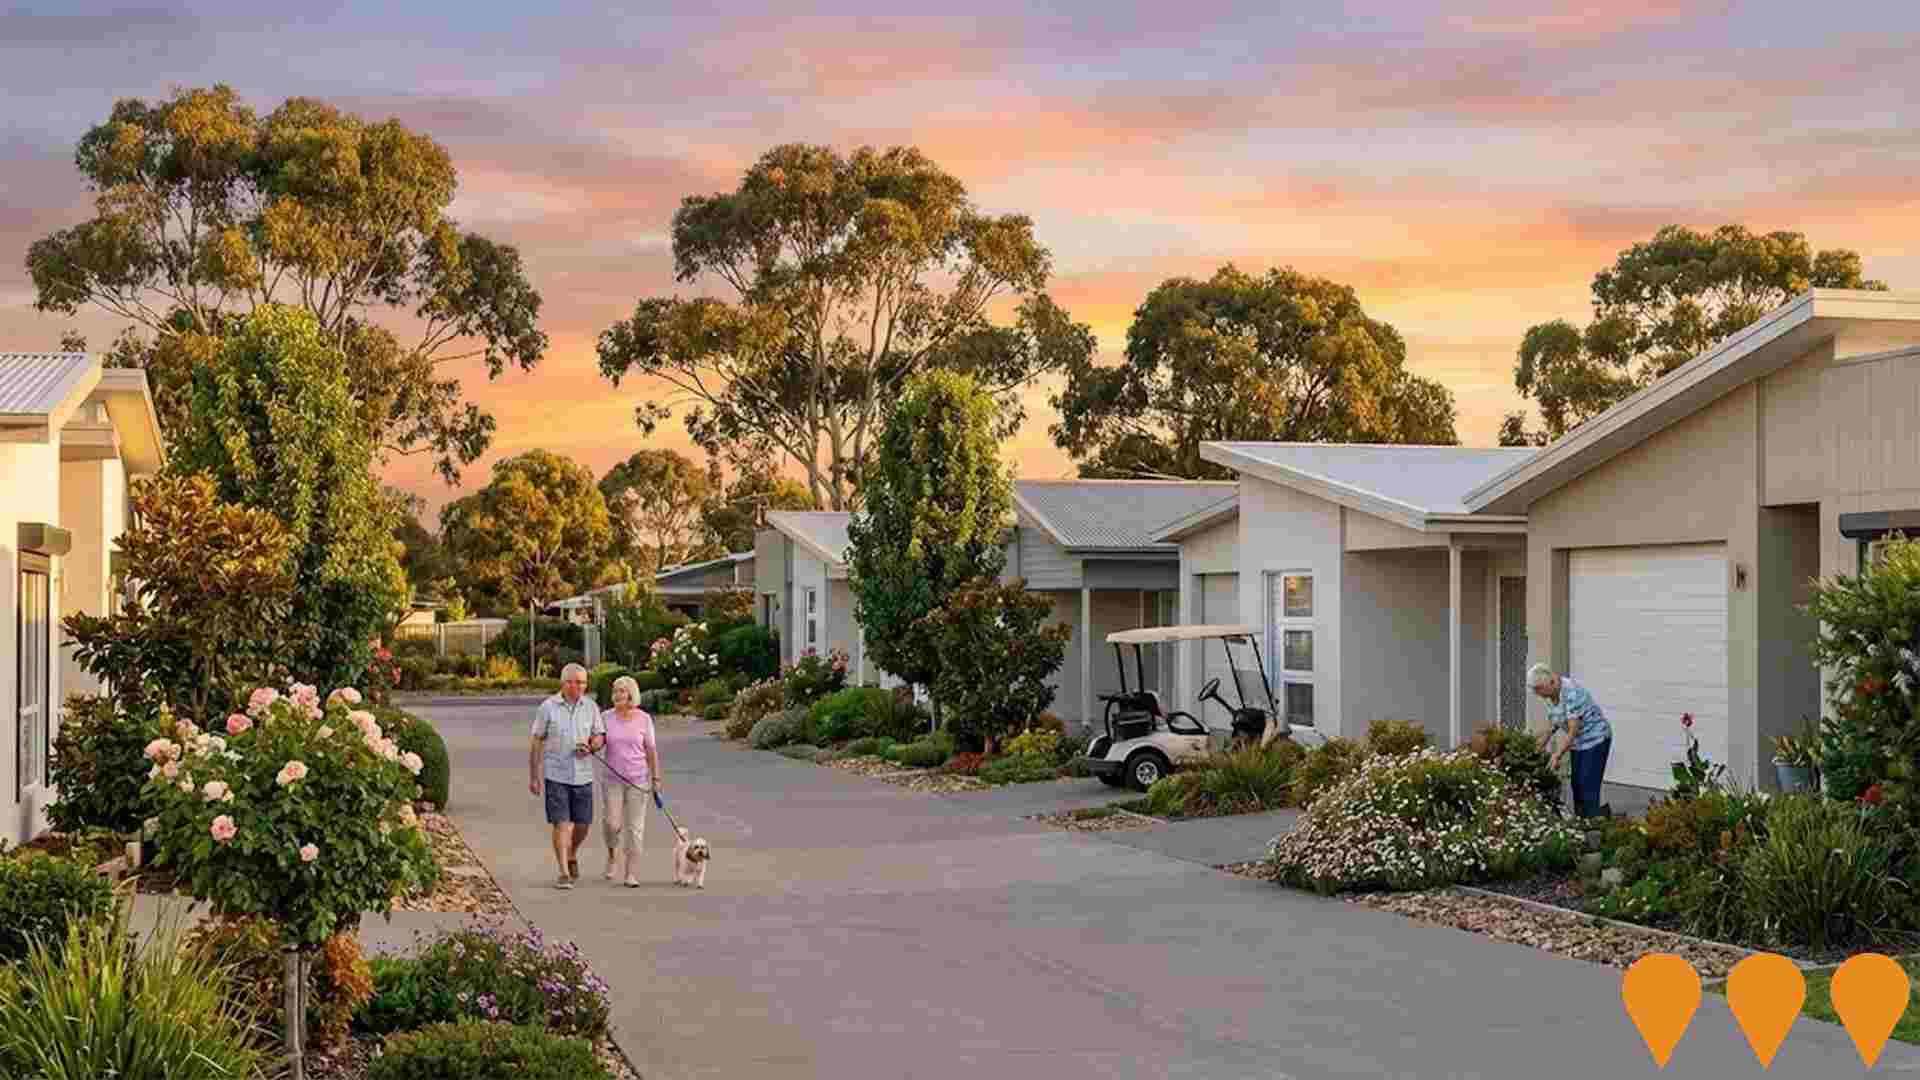
Palm Lake Resort Truganina
Premium over-50s lifestyle resort community featuring manufactured homes, Club Paradise facilities including indoor pool, undercover bowling green, and resort amenities. Australian family-owned business with 46 years expertise creating luxury retirement communities with world-class facilities.
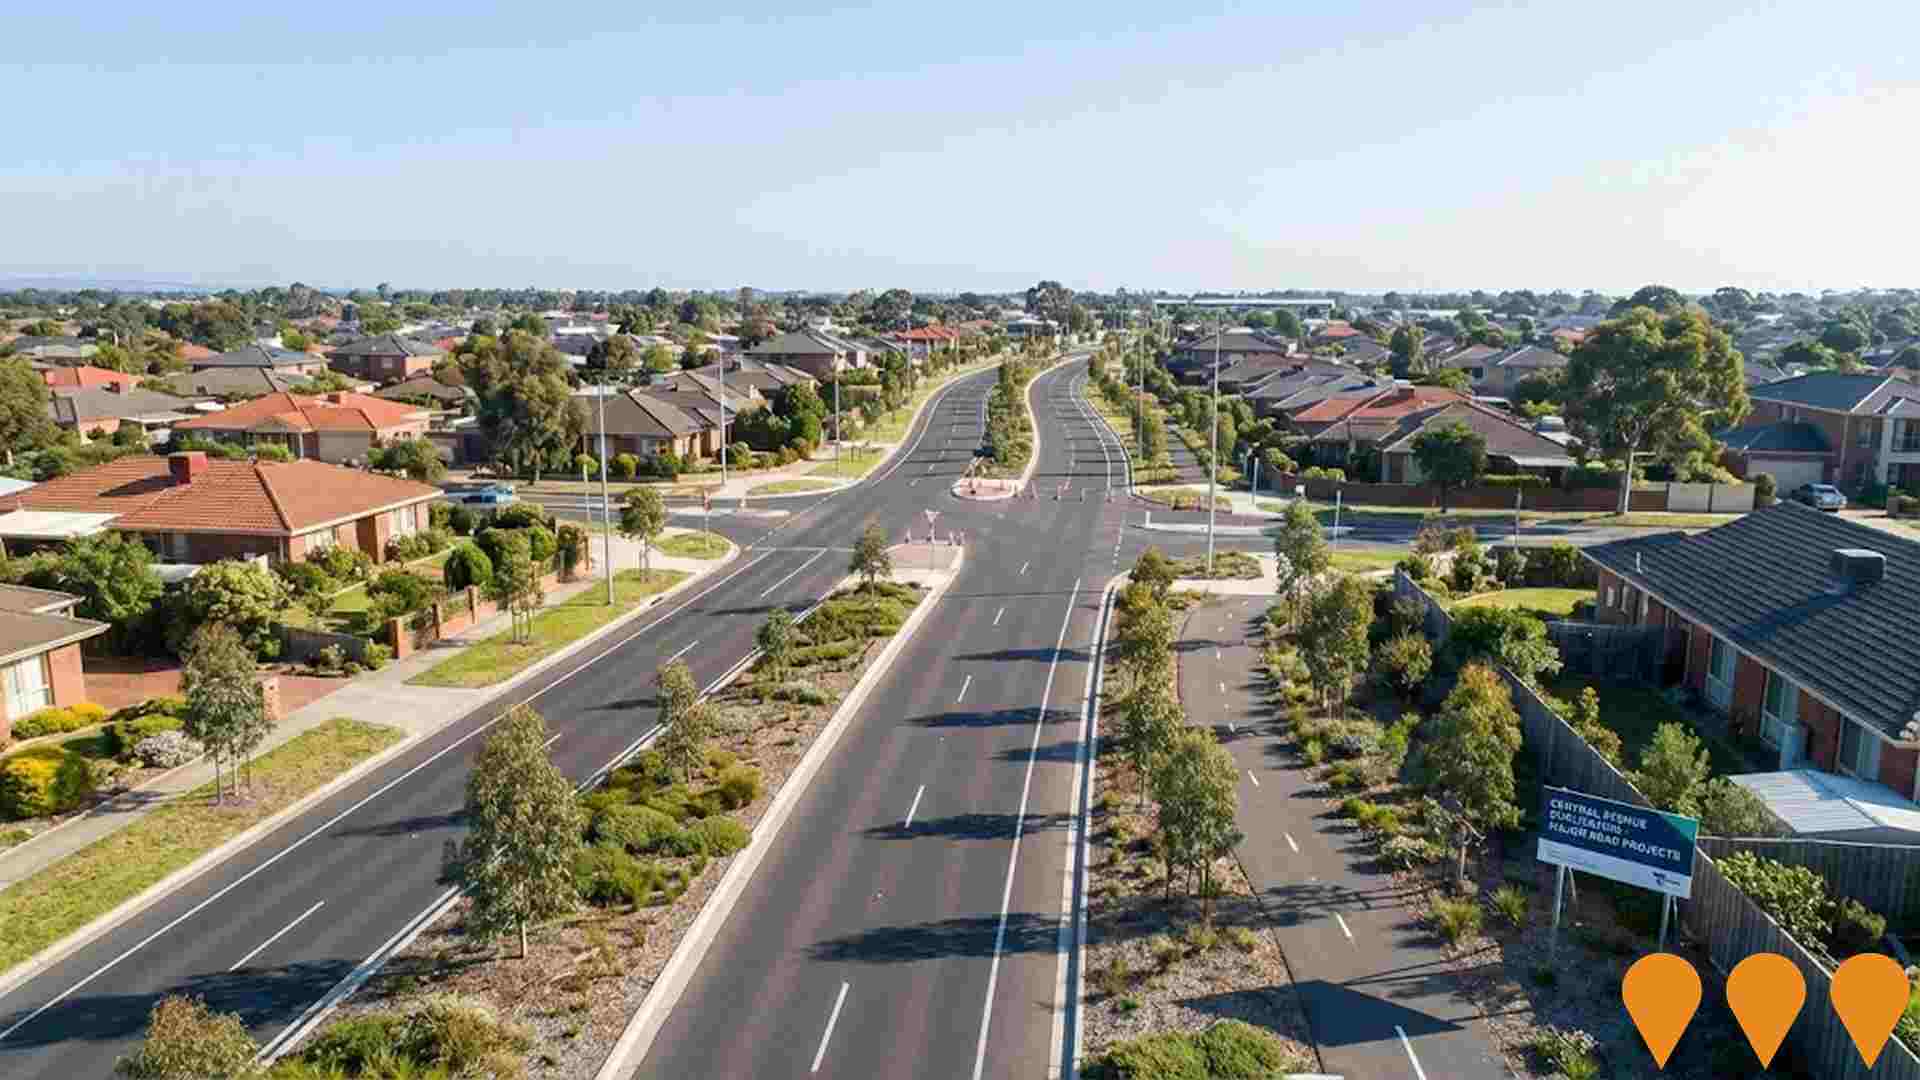
Point Cook Road and Central Avenue Intersection Upgrade
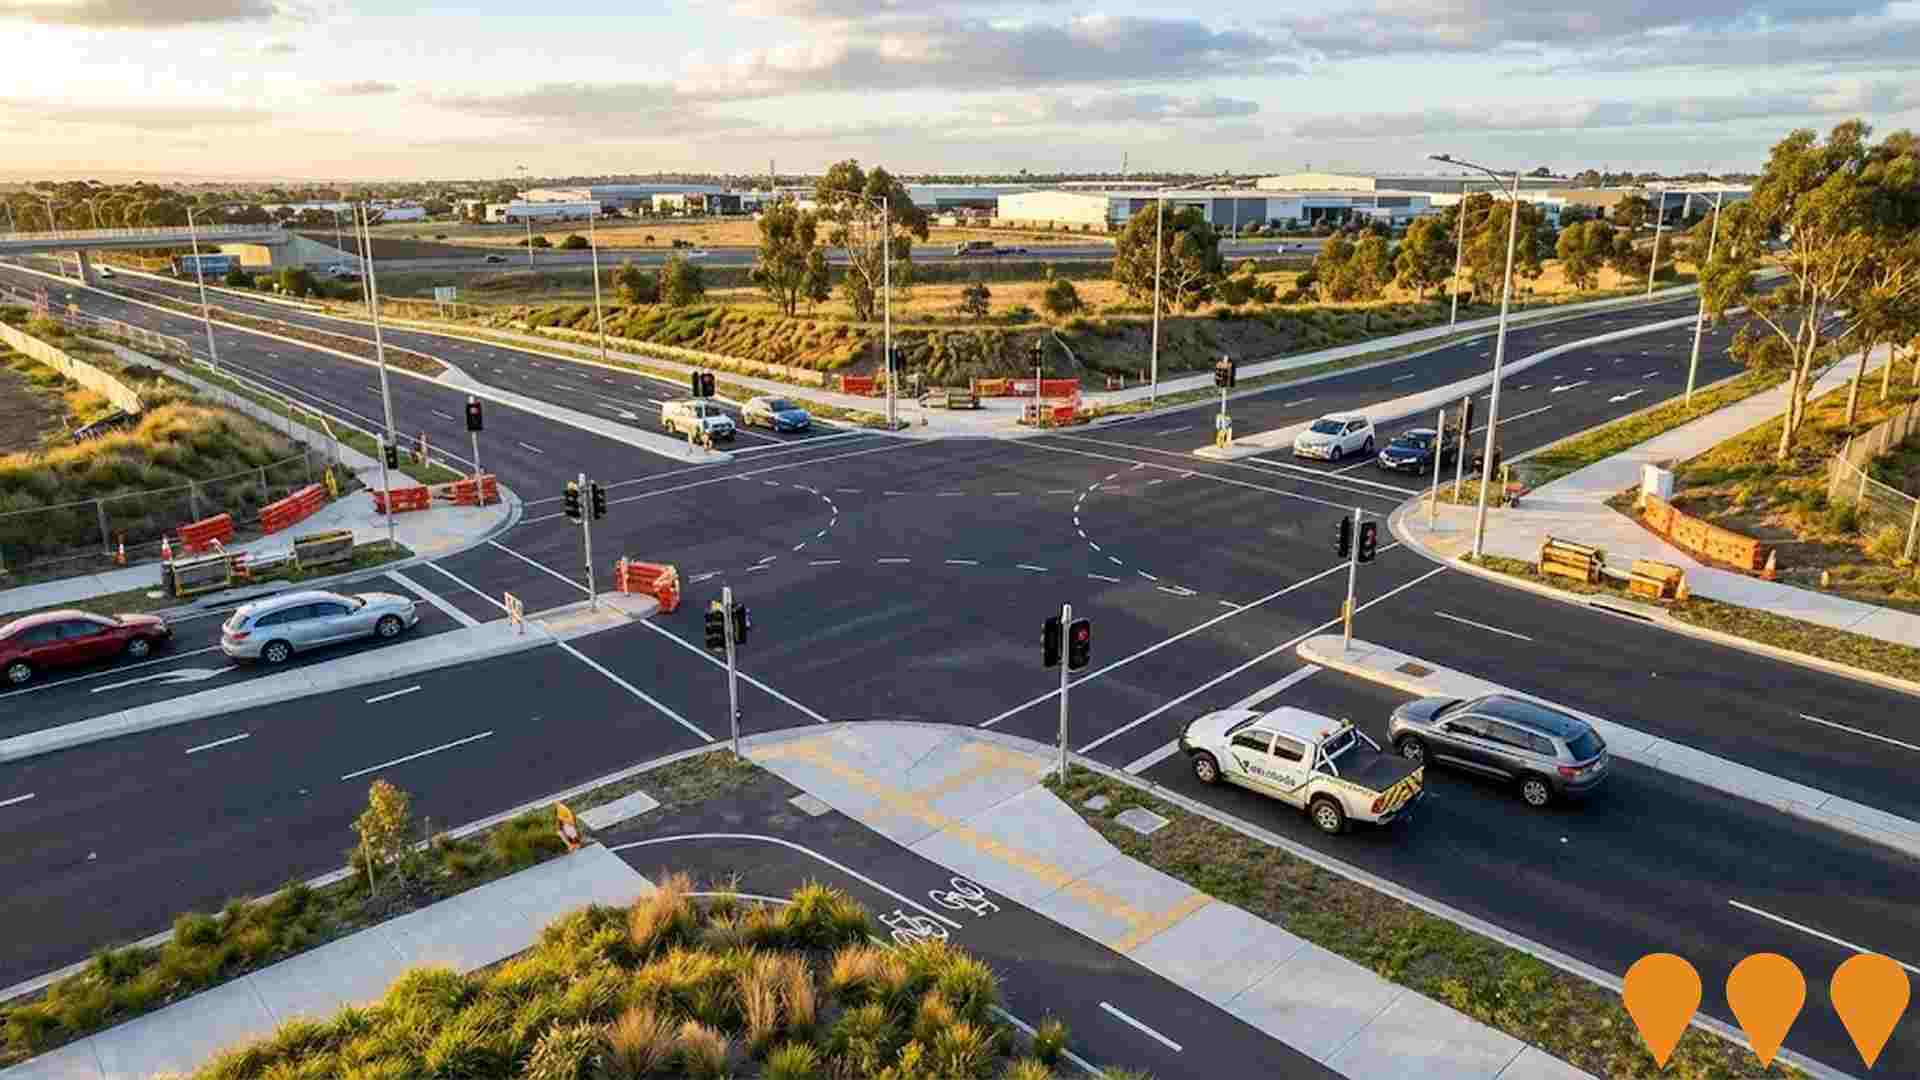
Major intersection upgrade project to remove the existing roundabout and replace it with traffic lights, add an outbound exit ramp, new lanes on Point Cook Road and Central Avenue, pedestrian crossings and upgraded walking and cycling paths. The intersection serves as a key connection to the Princes Freeway, used by nearly 28,000 vehicles daily.
Employment
The labour market in Laverton demonstrates typical performance when compared to similar areas across Australia
Laverton's workforce is highly educated with strong representation in professional services. The unemployment rate was 4.7% as of September 2025, with an estimated employment growth of 5.1% over the past year.
There were 7,909 residents employed by September 2025, with an unemployment rate aligning with Greater Melbourne's at 4.7%. Workforce participation was 68.2%, slightly higher than Greater Melbourne's 64.1%. Employment is concentrated in health care & social assistance, professional & technical services, and transport, postal & warehousing, with a notable concentration in the latter at 1.8 times the regional average. Education & training has limited presence, with 5.7% employment compared to 9.2% regionally.
There are 1.9 workers for every resident, indicating Laverton functions as an employment hub attracting workers from surrounding areas. Between September 2024 and September 2025, employment levels increased by 5.1%, labour force grew by 5.6%, causing the unemployment rate to rise by 0.5 percentage points. In contrast, Greater Melbourne saw employment rise by 3.0%, labour force grow by 3.3%, and unemployment increase by 0.3 percentage points. Statewide in Victoria as of 25-Nov-25, employment grew by 1.13% year-on-year, with an unemployment rate of 4.7%. National employment forecasts from May-25 project a 6.6% growth over five years and 13.7% over ten years. Applying these projections to Laverton's employment mix suggests local employment should increase by 6.5% over five years and 13.3% over ten years, assuming constant population projections for illustrative purposes.
Frequently Asked Questions - Employment
Income
Income analysis reveals strong economic positioning, with the area outperforming 60% of locations assessed nationally by AreaSearch
The median income among taxpayers in Laverton SA2 was $54,882 in financial year 2022. The average income stood at $65,760 during this period. In Greater Melbourne, the median and average incomes were $54,892 and $73,761 respectively. Based on a Wage Price Index growth of 12.16% since financial year 2022, estimated current incomes as of September 2025 would be approximately $61,556 (median) and $73,756 (average). Census data shows that household, family, and personal incomes in Laverton cluster around the 67th percentile nationally. Income distribution reveals that 35.5% of the population (4,697 individuals) fall within the $1,500 - 2,999 income range, which is consistent with broader trends across the surrounding region showing 32.8% in the same category. High housing costs consume 16.7% of income. Despite this, strong earnings place disposable income at the 70th percentile. The area's SEIFA income ranking places it in the 6th decile.
Frequently Asked Questions - Income
Housing
Laverton is characterized by a predominantly suburban housing profile, with a higher proportion of rental properties than the broader region
Laverton's dwelling structure, as per the latest Census, consisted of 81.8% houses and 18.1% other dwellings (semi-detached, apartments, 'other' dwellings). In comparison, Melbourne metro had 88.1% houses and 12.0% other dwellings. Home ownership in Laverton was at 16.2%, with the rest either mortgaged (36.9%) or rented (46.9%). The median monthly mortgage repayment was $2,000, exceeding Melbourne metro's average of $1,924 and the national average of $1,863. The median weekly rent in Laverton was $380, higher than Melbourne metro's $370 and the national figure of $375.
Frequently Asked Questions - Housing
Household Composition
Laverton features high concentrations of group households, with a lower-than-average median household size
Family households account for 72.9 percent of all households, including 37.9 percent couples with children, 22.3 percent couples without children, and 10.6 percent single parent families. Non-family households constitute the remaining 27.1 percent, with lone person households at 19.8 percent and group households comprising 7.3 percent of the total. The median household size is 2.8 people, which is smaller than the Greater Melbourne average of 3.1.
Frequently Asked Questions - Households
Local Schools & Education
The educational profile of Laverton exceeds national averages, with above-average qualification levels and academic performance metrics
Educational attainment in Laverton is notably higher than broader averages. 44.7% of residents aged 15 and above hold university qualifications, compared to 30.4% nationally and 32.0% in the SA4 region. Bachelor degrees are most common at 25.6%, followed by postgraduate qualifications (16.8%) and graduate diplomas (2.3%). Vocational credentials are also prevalent, with 25.6% of residents holding such qualifications, including advanced diplomas (11.5%) and certificates (14.1%).
Educational participation is high, with 34.2% of residents currently enrolled in formal education. This includes 10.1% in primary education, 7.3% in tertiary education, and 6.0% pursuing secondary education.
Frequently Asked Questions - Education
Schools Detail
Nearby Services & Amenities
Transport
Transport servicing is high compared to other areas nationally based on assessment of service frequency, route connectivity and accessibility
Laverton has 92 active public transport stops, consisting of a mix of train and bus services. These stops are served by 19 different routes, which together facilitate 15,344 weekly passenger trips. The accessibility of these transport options is rated as good, with residents on average located 274 meters from the nearest stop.
Across all routes, there are an average of 2,192 daily trips, equating to approximately 166 weekly trips per individual stop.
Frequently Asked Questions - Transport
Transport Stops Detail
Health
Laverton's residents boast exceedingly positive health performance metrics with a fairly standard level of common health conditions seen across both young and old age cohorts
Laverton's health outcomes show notable results with common health conditions seen across both young and old age groups at a standard level.
The private health cover rate stands at approximately 52%, higher than the average SA2 area (~6,933 people). Mental health issues affect 5.7% of residents, while asthma impacts 5.2%. A total of 81.6% report no medical ailments, compared to Greater Melbourne's 79.2%. Laverton has 6.8% of residents aged 65 and over (901 people), lower than Greater Melbourne's 8.3%.
Frequently Asked Questions - Health
Cultural Diversity
Laverton is among the most culturally diverse areas in the country based on AreaSearch assessment of a range of language and cultural background related metrics
Laverton has a high level of cultural diversity, with 60.6% of its population speaking a language other than English at home and 59.7% born overseas. Christianity is the predominant religion in Laverton, accounting for 34.0% of the population. Hinduism is notably higher in Laverton compared to Greater Melbourne, comprising 17.9% versus 15.7%.
The top three ancestry groups in Laverton are Other (24.7%), Indian (14.9%), and English (12.6%). Some ethnic groups show notable differences: Filipino is overrepresented at 3.7%, Samoan is slightly underrepresented at 0.9% compared to the regional figure of 1.0%, and Maori representation remains similar at 1.2%.
Frequently Asked Questions - Diversity
Age
Laverton hosts a very young demographic, ranking in the bottom 10% of areas nationwide
Laverton has a median age of 32 years, which is younger than Greater Melbourne's average of 37 years and the national average of 38 years. Compared to Greater Melbourne, Laverton has a higher percentage of residents aged 25-34 (23.8%) but fewer residents aged 75-84 (1.6%). This concentration of 25-34 year-olds is significantly higher than the national average of 14.5%. According to post-2021 Census data, the proportion of residents aged 45-54 has increased from 10.2% to 11.0%, while the percentage of those aged 35-44 has decreased from 19.8% to 18.6%. By 2041, demographic modeling projects significant changes in Laverton's age profile, with the strongest growth expected in the 45-54 age group, which is projected to grow by 74%, adding 1,072 residents to reach a total of 2,528.
