Chart Color Schemes
This analysis uses ABS Statistical Areas Level 2 (SA2) boundaries, which can materially differ from Suburbs and Localities (SAL) even when sharing similar names.
SA2 boundaries are defined by the Australian Bureau of Statistics and are designed to represent communities for statistical reporting (e.g., census and ERP).
Suburbs and Localities (SAL) represent commonly-used suburb/locality names (postal-style areas) and may use different geographic boundaries. For comprehensive analysis, consider reviewing both boundary types if available.
est. as @ -- *
ABS ERP | -- people | --
2021 Census | -- people
Sales Activity
Curious about local property values? Filter the chart to assess the volume and appreciation (including resales) trends and regional comparisons, or scroll to the map below view this information at an individual property level.
Find a Recent Sale
Sales Detail
Population
Carlton has seen population growth performance typically on par with national averages when looking at short and medium term trends
Carlton's population is 23,922 as of November 2025. This shows an increase of 7,267 people since the 2021 Census, which recorded a population of 16,655. The change is inferred from ABS' estimated resident population of 23,954 in June 2024 and 58 new addresses validated since the Census date. This results in a density ratio of 13,144 persons per square kilometer, placing Carlton in the top 10% of locations nationally. Carlton's growth rate of 43.6% since the 2021 census exceeds both national (8.9%) and state averages, indicating significant population growth driven primarily by overseas migration. AreaSearch uses ABS/Geoscience Australia projections for each SA2 area released in 2024 with a base year of 2022.
For areas not covered, they use Victorian Government's Regional/LGA projections from 2023, adjusted using weighted aggregation methods to SA2 levels. Growth rates by age group are applied across all areas until 2041. Future trends forecast Carlton's population increasing by 8,336 persons by 2041, reflecting a total gain of 35.0% over the 17-year period.
Frequently Asked Questions - Population
Development
AreaSearch assessment of residential approval activity sees Carlton among the top 30% of areas assessed nationwide
Carlton has averaged approximately 50 new dwelling approvals annually over the past five financial years, totalling 252 homes. As of FY-26 so far, there have been 0 approvals recorded. Between FY-21 and FY-25, an average of 11.6 new residents arrived per year for each dwelling constructed. This indicates significant demand exceeding supply, typically leading to price growth and increased buyer competition.
The average construction value of new properties is $587,000, suggesting developers target the premium market segment with higher-end properties. In FY-26, there have been $293.0 million in commercial approvals, indicating high levels of local commercial activity. Compared to Greater Melbourne, Carlton has significantly less development activity, 82.0% below the regional average per person. This constrained new construction often reinforces demand and pricing for existing dwellings. Nationally, Carlton's development activity is also lower, reflecting market maturity and potential development constraints.
All new construction in Carlton has been comprised of medium and high-density housing, offering affordable entry pathways and attracting downsizers, investors, and first-time purchasers. By 2041, AreaSearch estimates Carlton will add 8,368 residents. If current development rates continue, housing supply may not keep pace with population growth, potentially increasing buyer competition and supporting stronger price growth.
Frequently Asked Questions - Development
Infrastructure
Carlton has strong levels of nearby infrastructure activity, ranking in the top 30% nationally
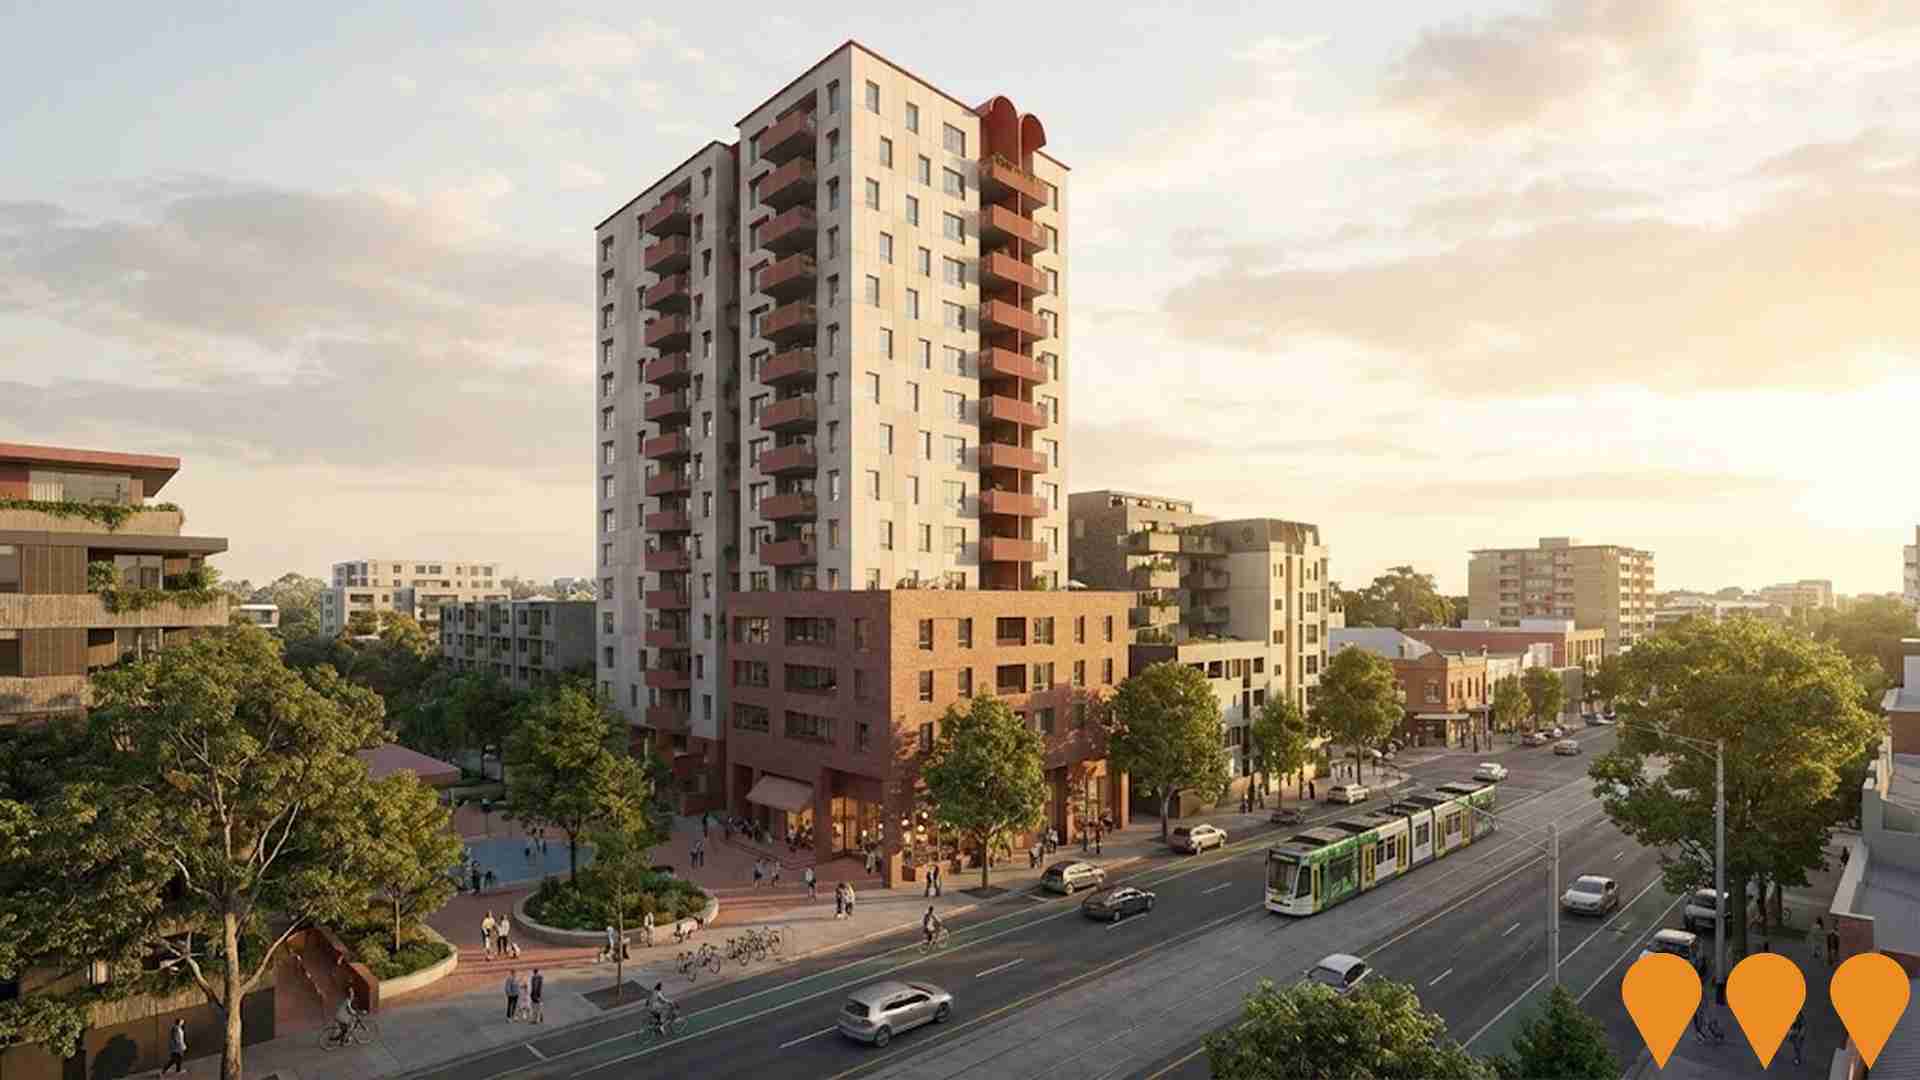
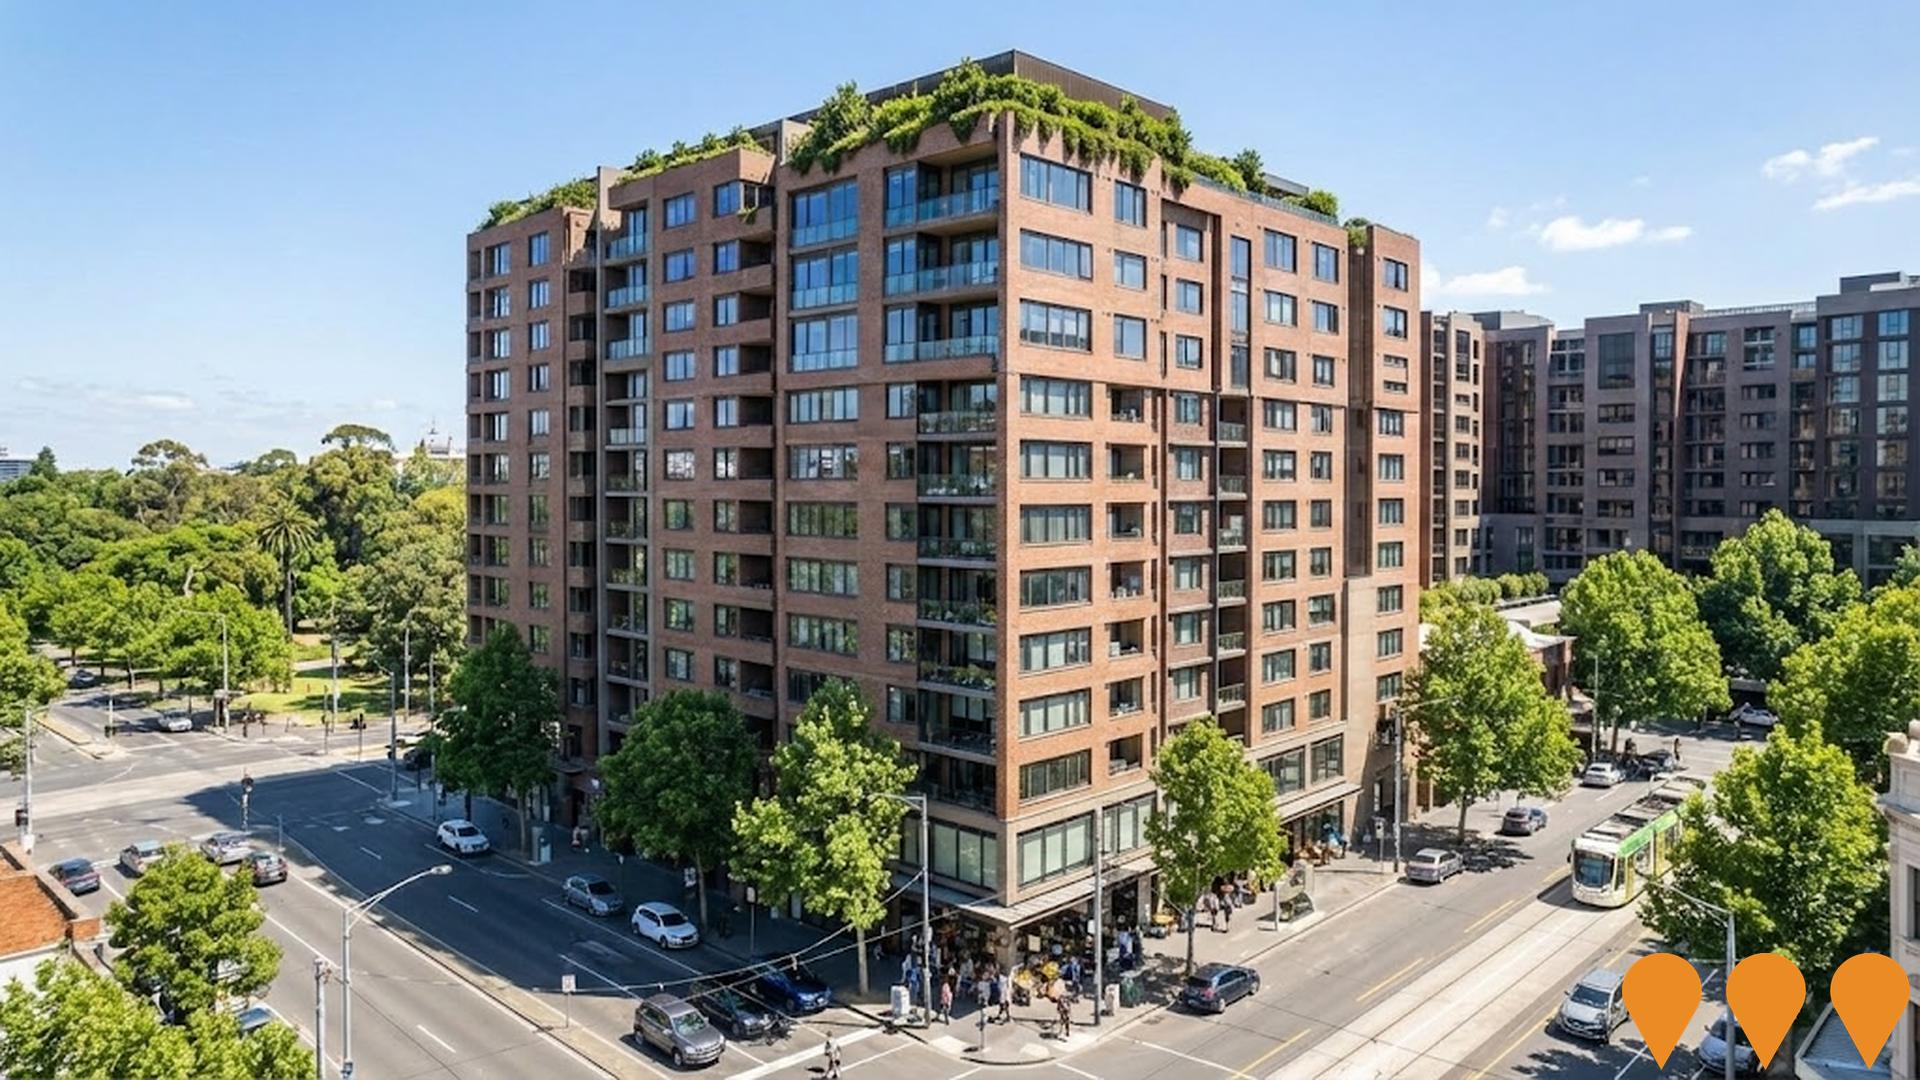
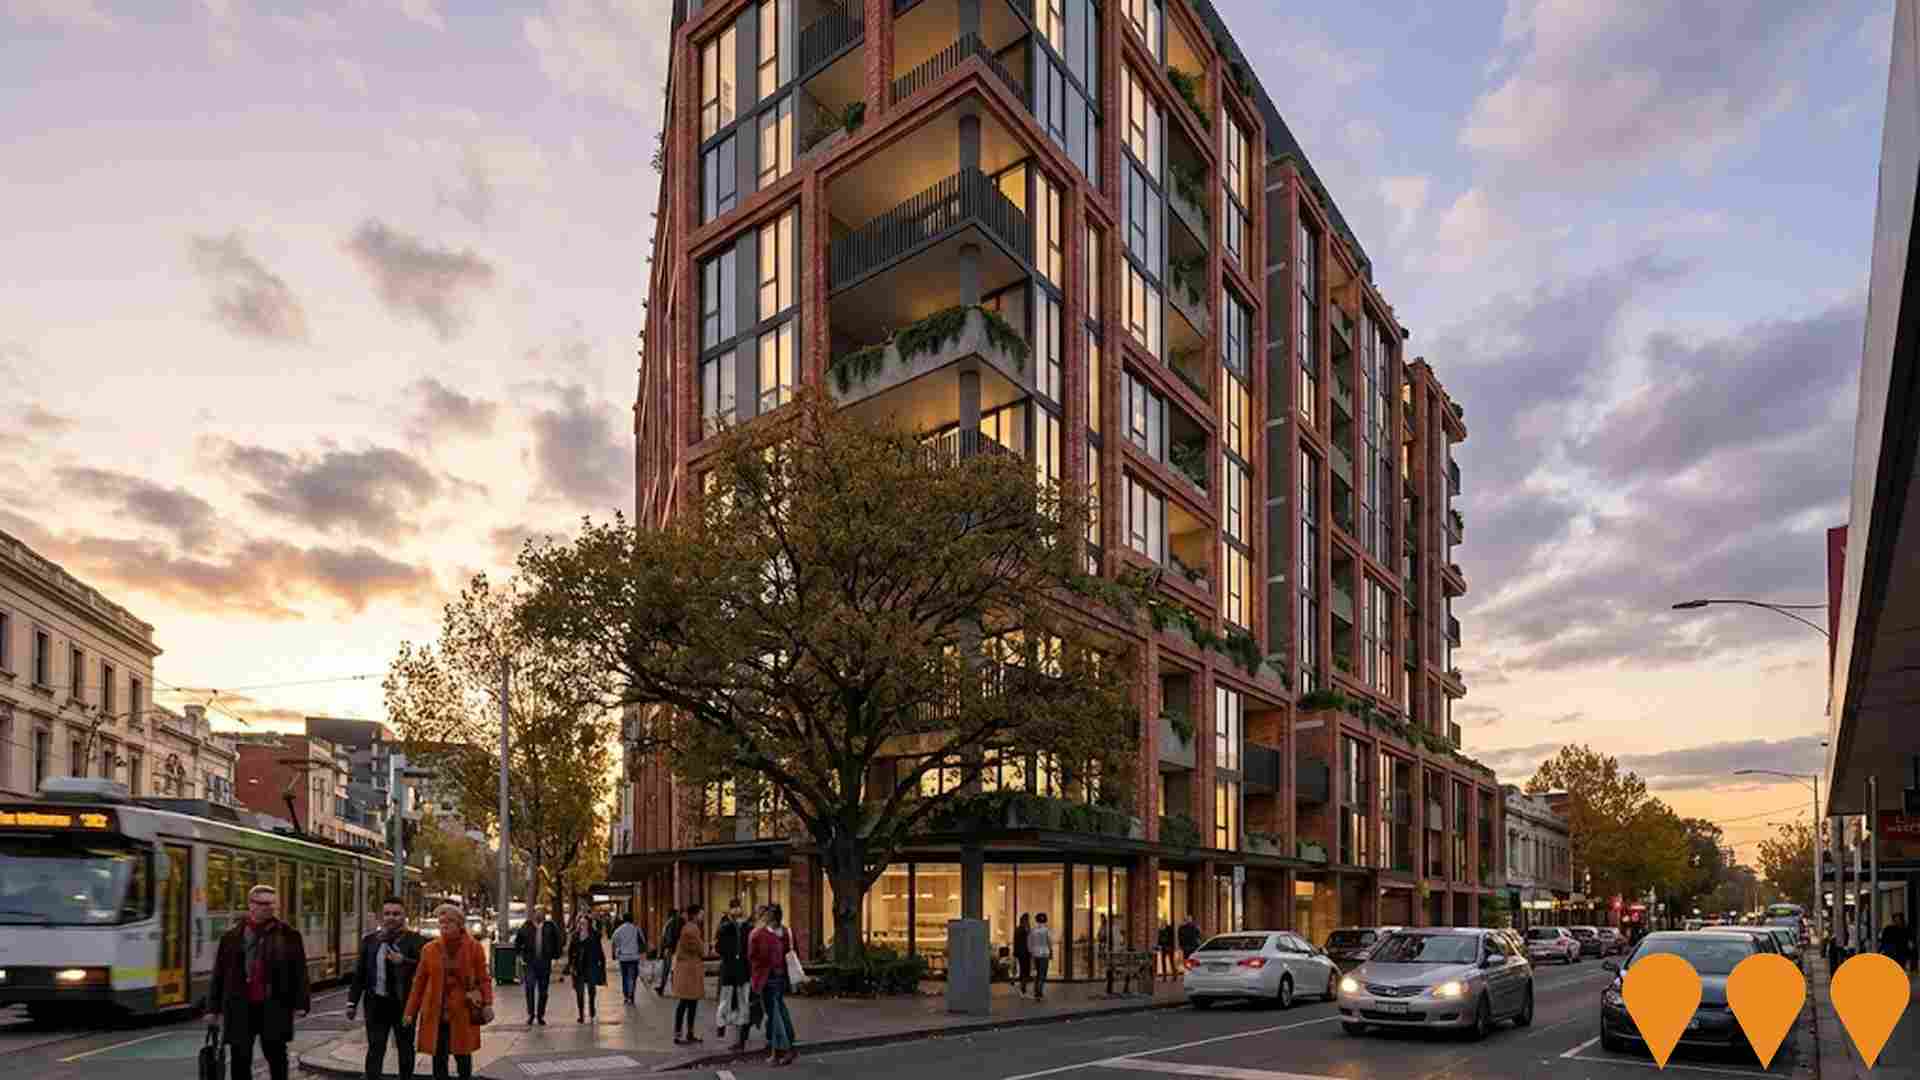
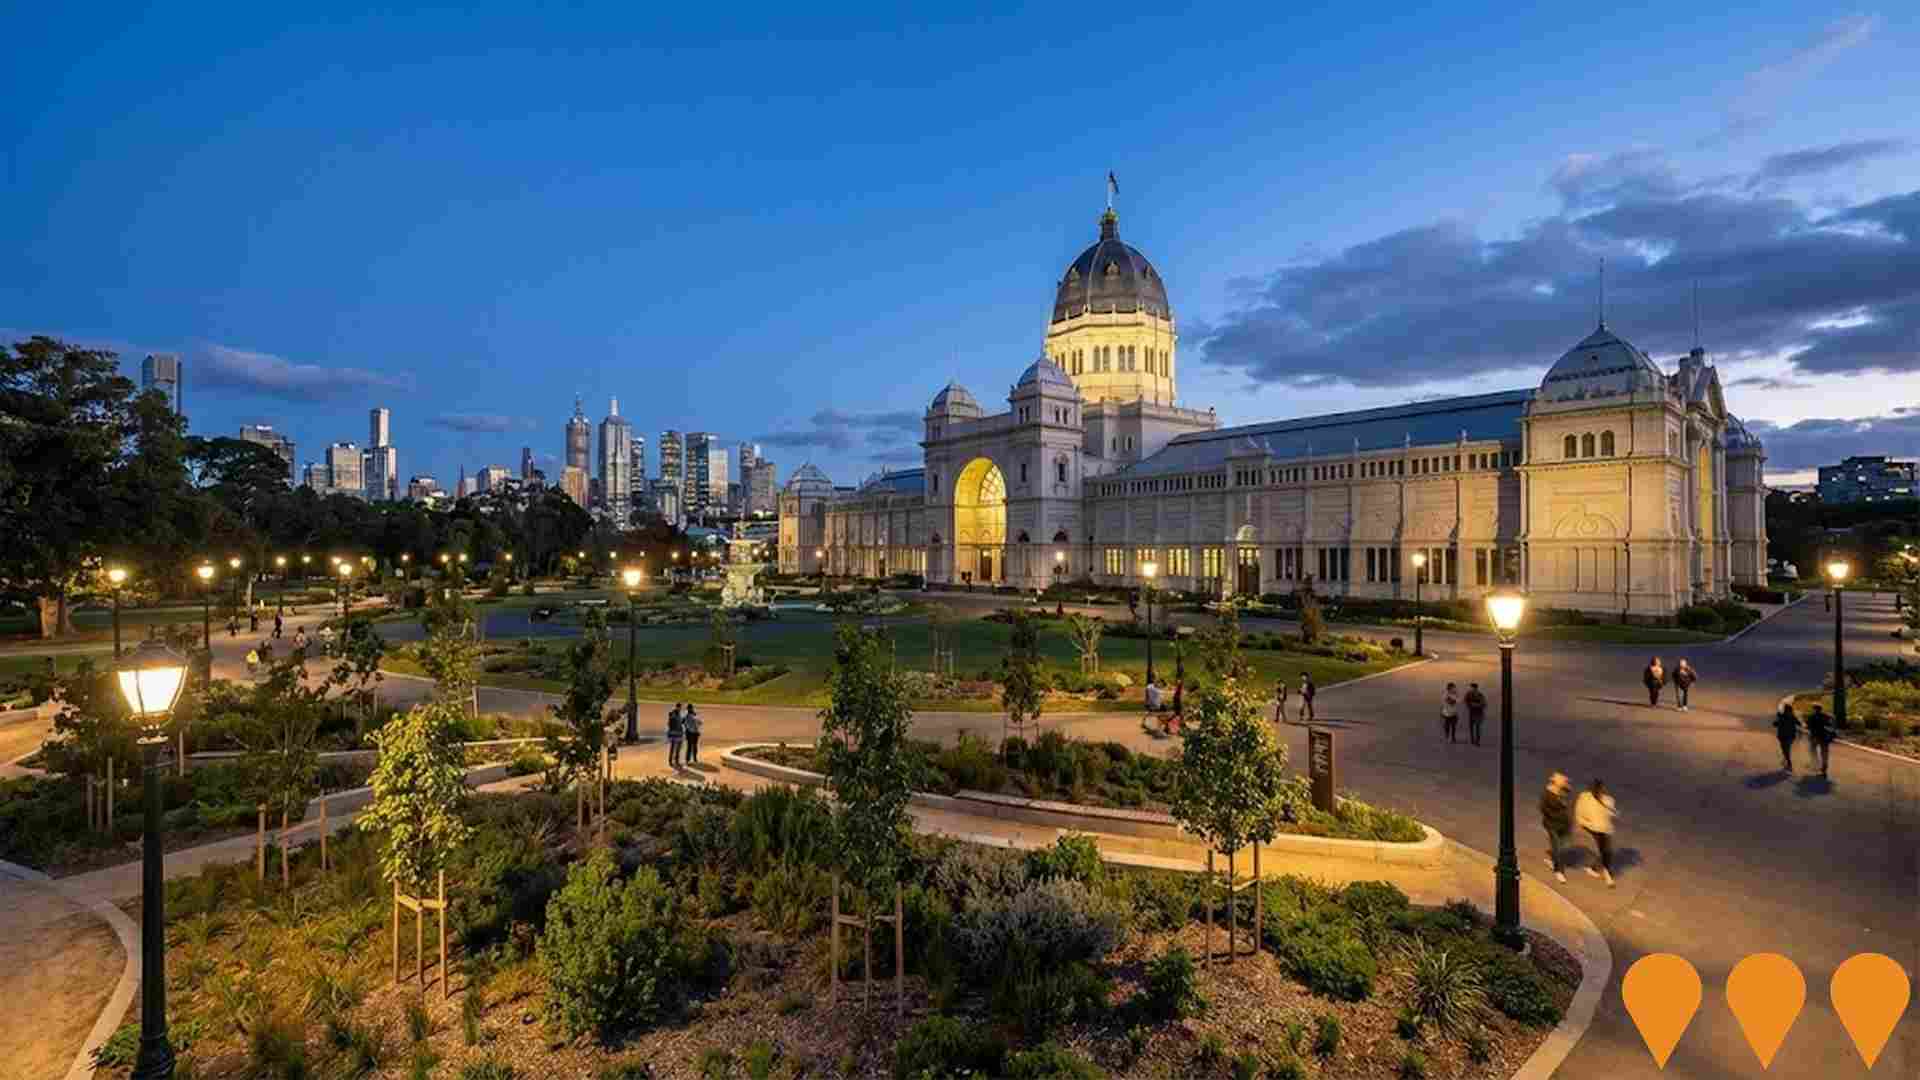
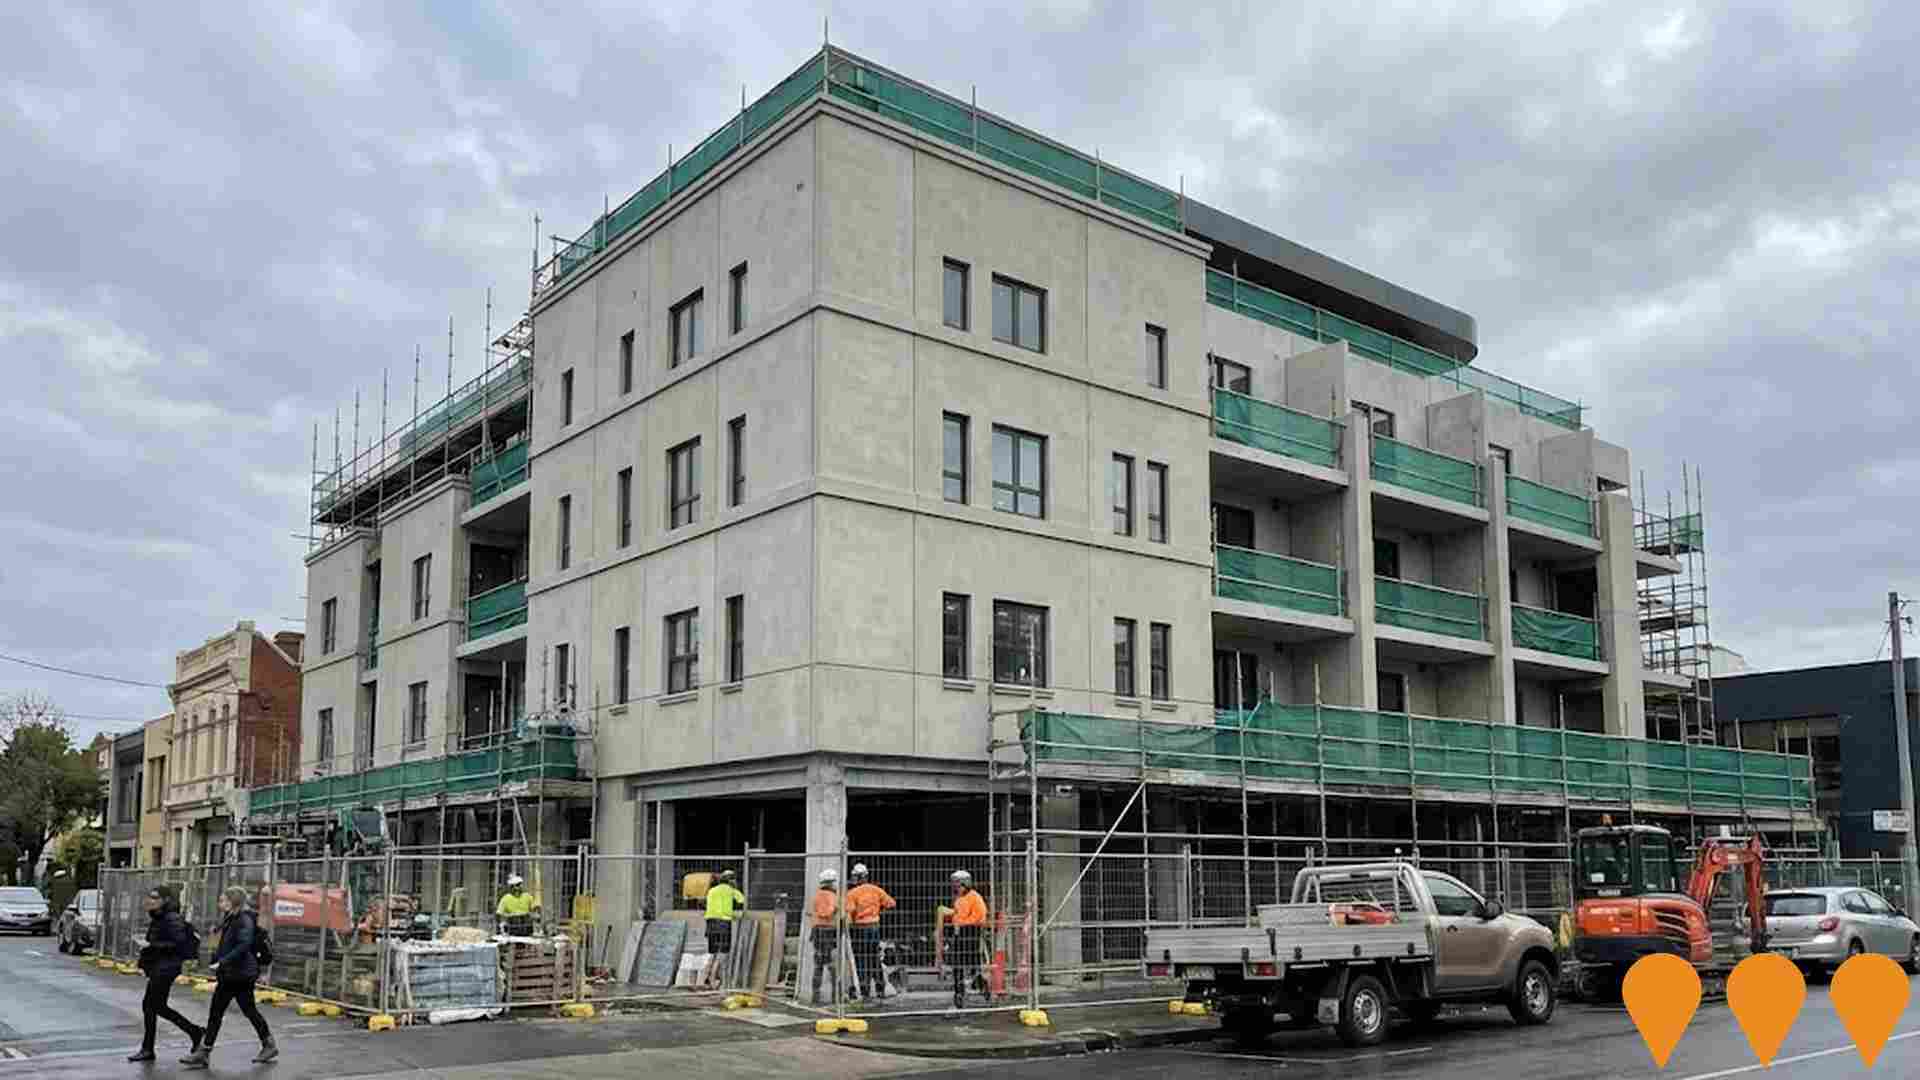
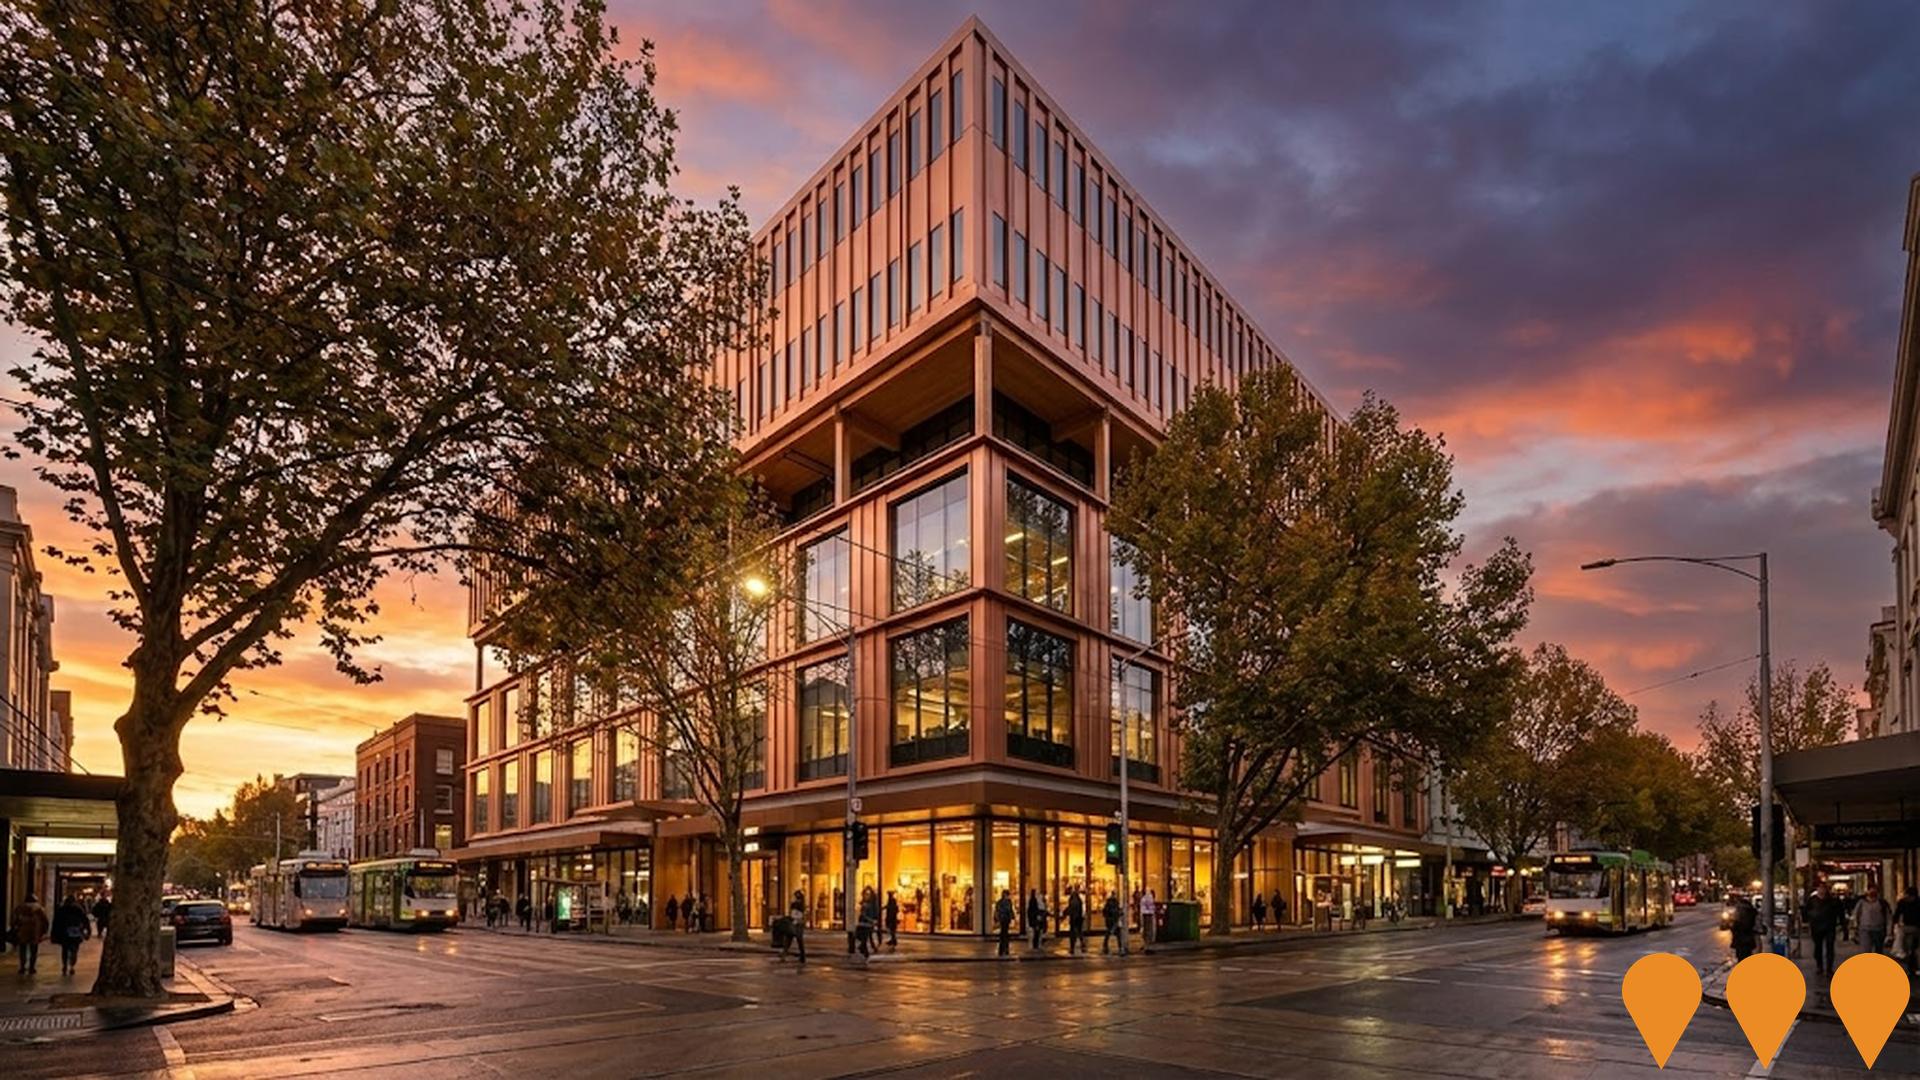
AreaSearch has identified 54 infrastructure projects that could impact the area's performance. Key projects include Elgin Towers Carlton Social Housing Redevelopment, Drummond House, Australian Institute for Infectious Disease (AIID), and Carlton Gardens Masterplan 2022. The following list details those likely to be most relevant.
Professional plan users can use the search below to filter and access additional projects.
INFRASTRUCTURE SEARCH
 Denotes AI-based impression for illustrative purposes only, not to be taken as definitive under any circumstances. Please follow links and conduct other investigations from the project's source for actual imagery. Developers and project owners wishing us to use original imagery please Contact Us and we will do so.
Frequently Asked Questions - Infrastructure
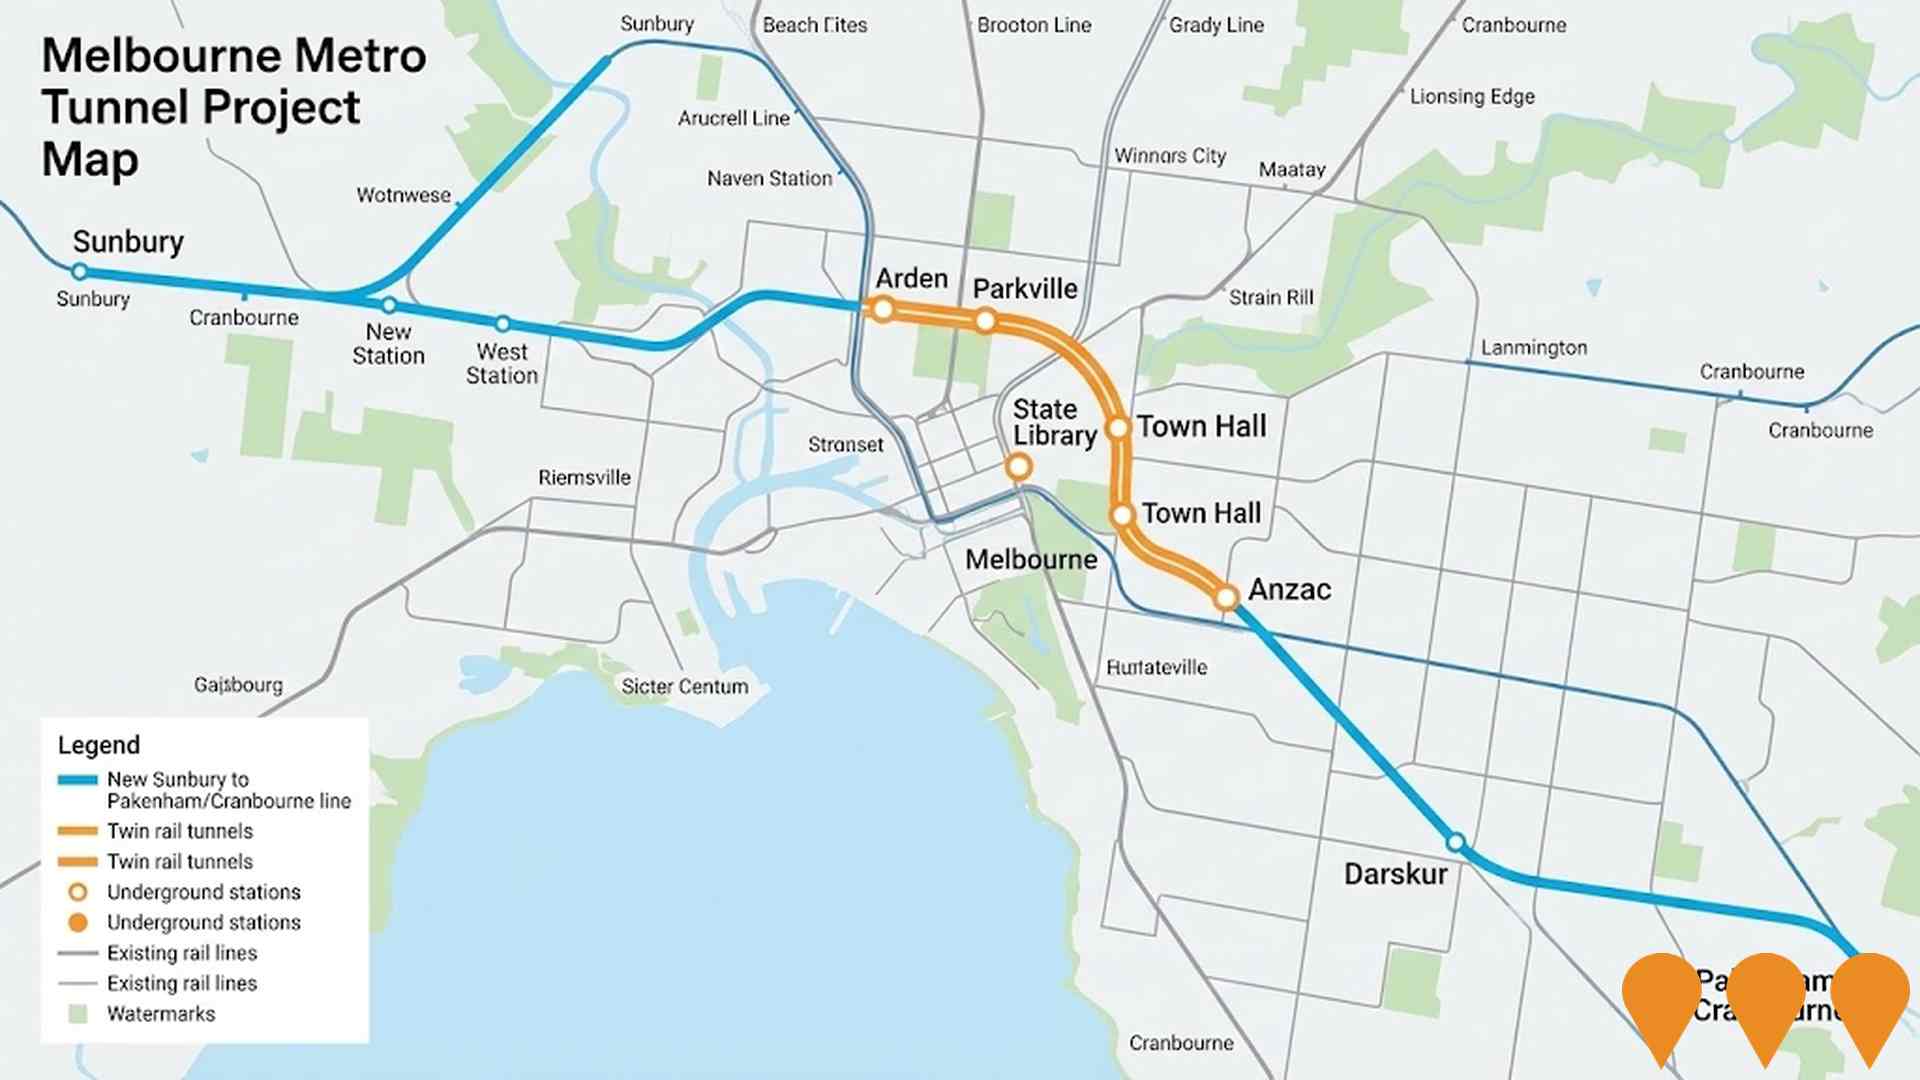
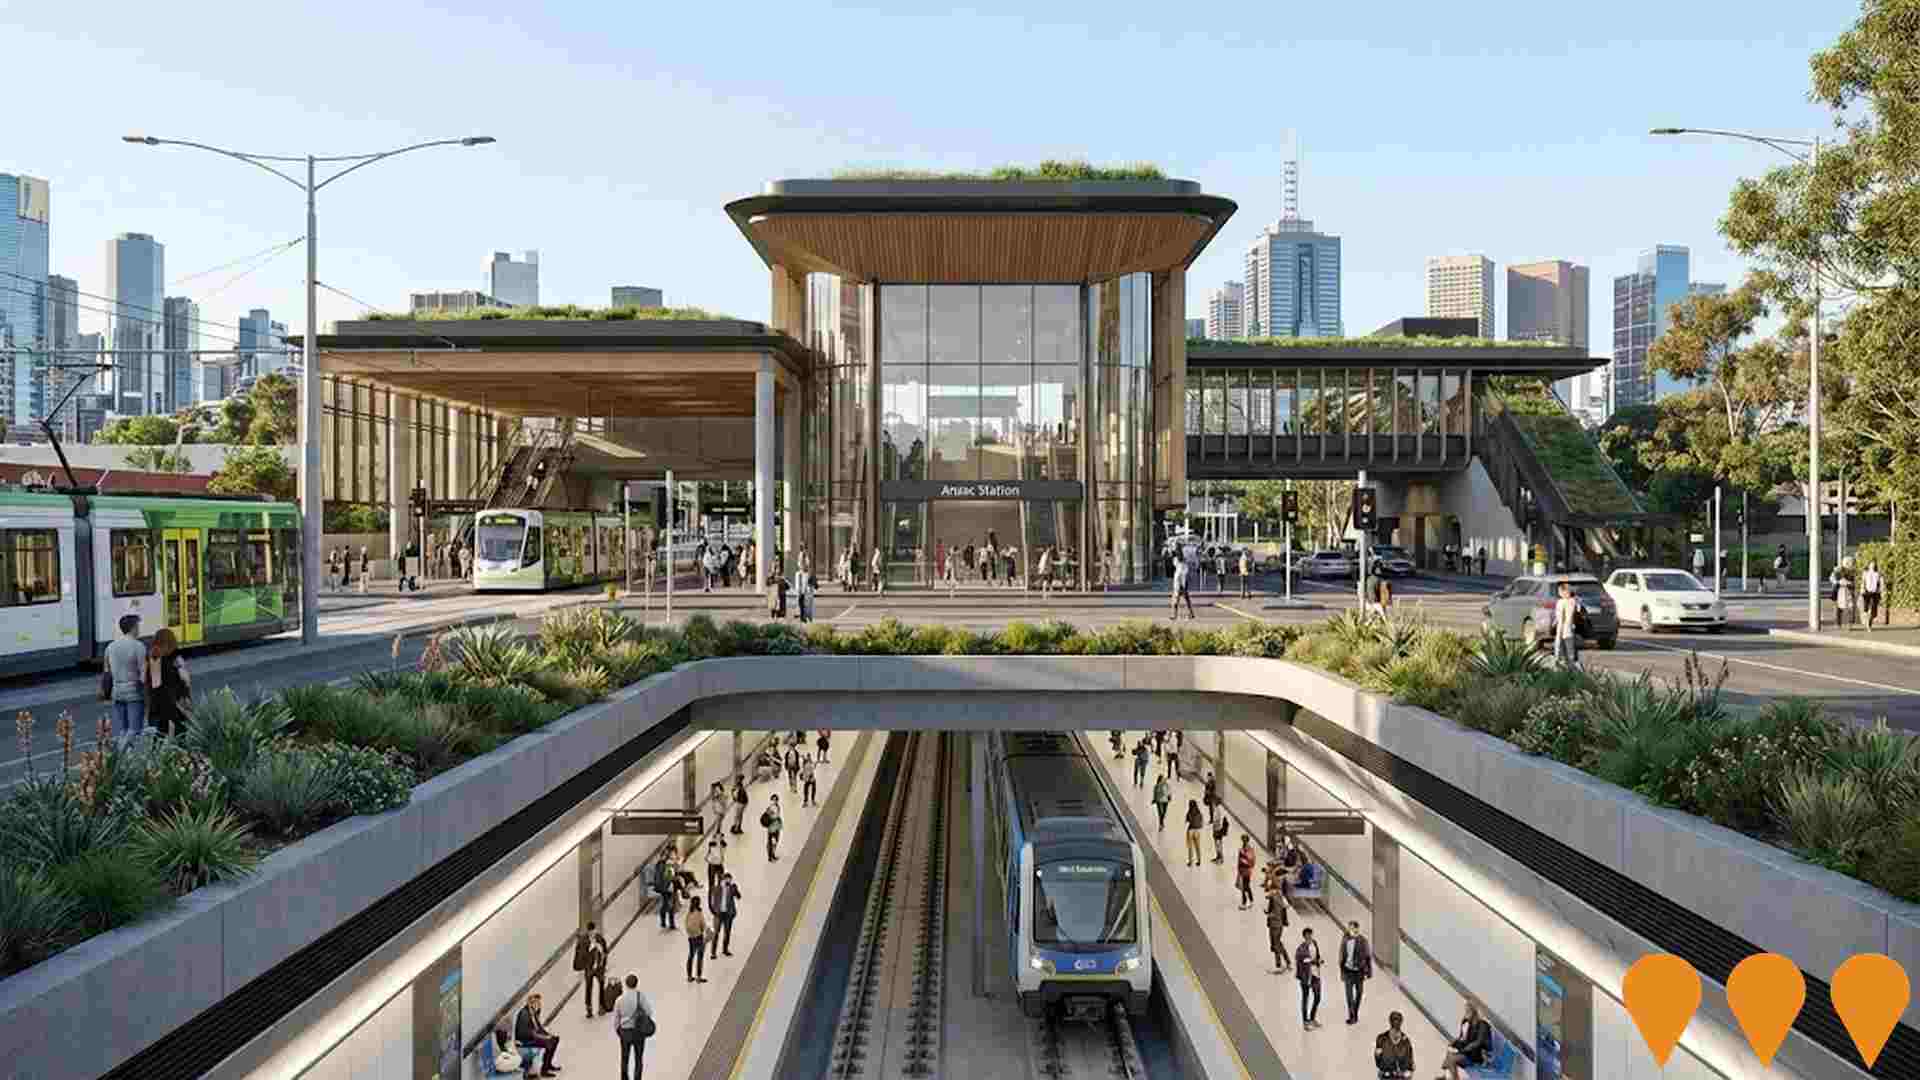
Metro Tunnel Project
The Metro Tunnel is Melbourne's largest public transport project, delivering twin 9km rail tunnels and five new underground stations (Arden, Parkville, State Library, Town Hall, Anzac). It creates a new end-to-end rail line from Sunbury to Cranbourne/Pakenham, introduces high-capacity signalling and new High Capacity Metro Trains to enable turn-up-and-go services every 2-3 minutes, and removes four level crossings on the Cranbourne-Pakenham line.
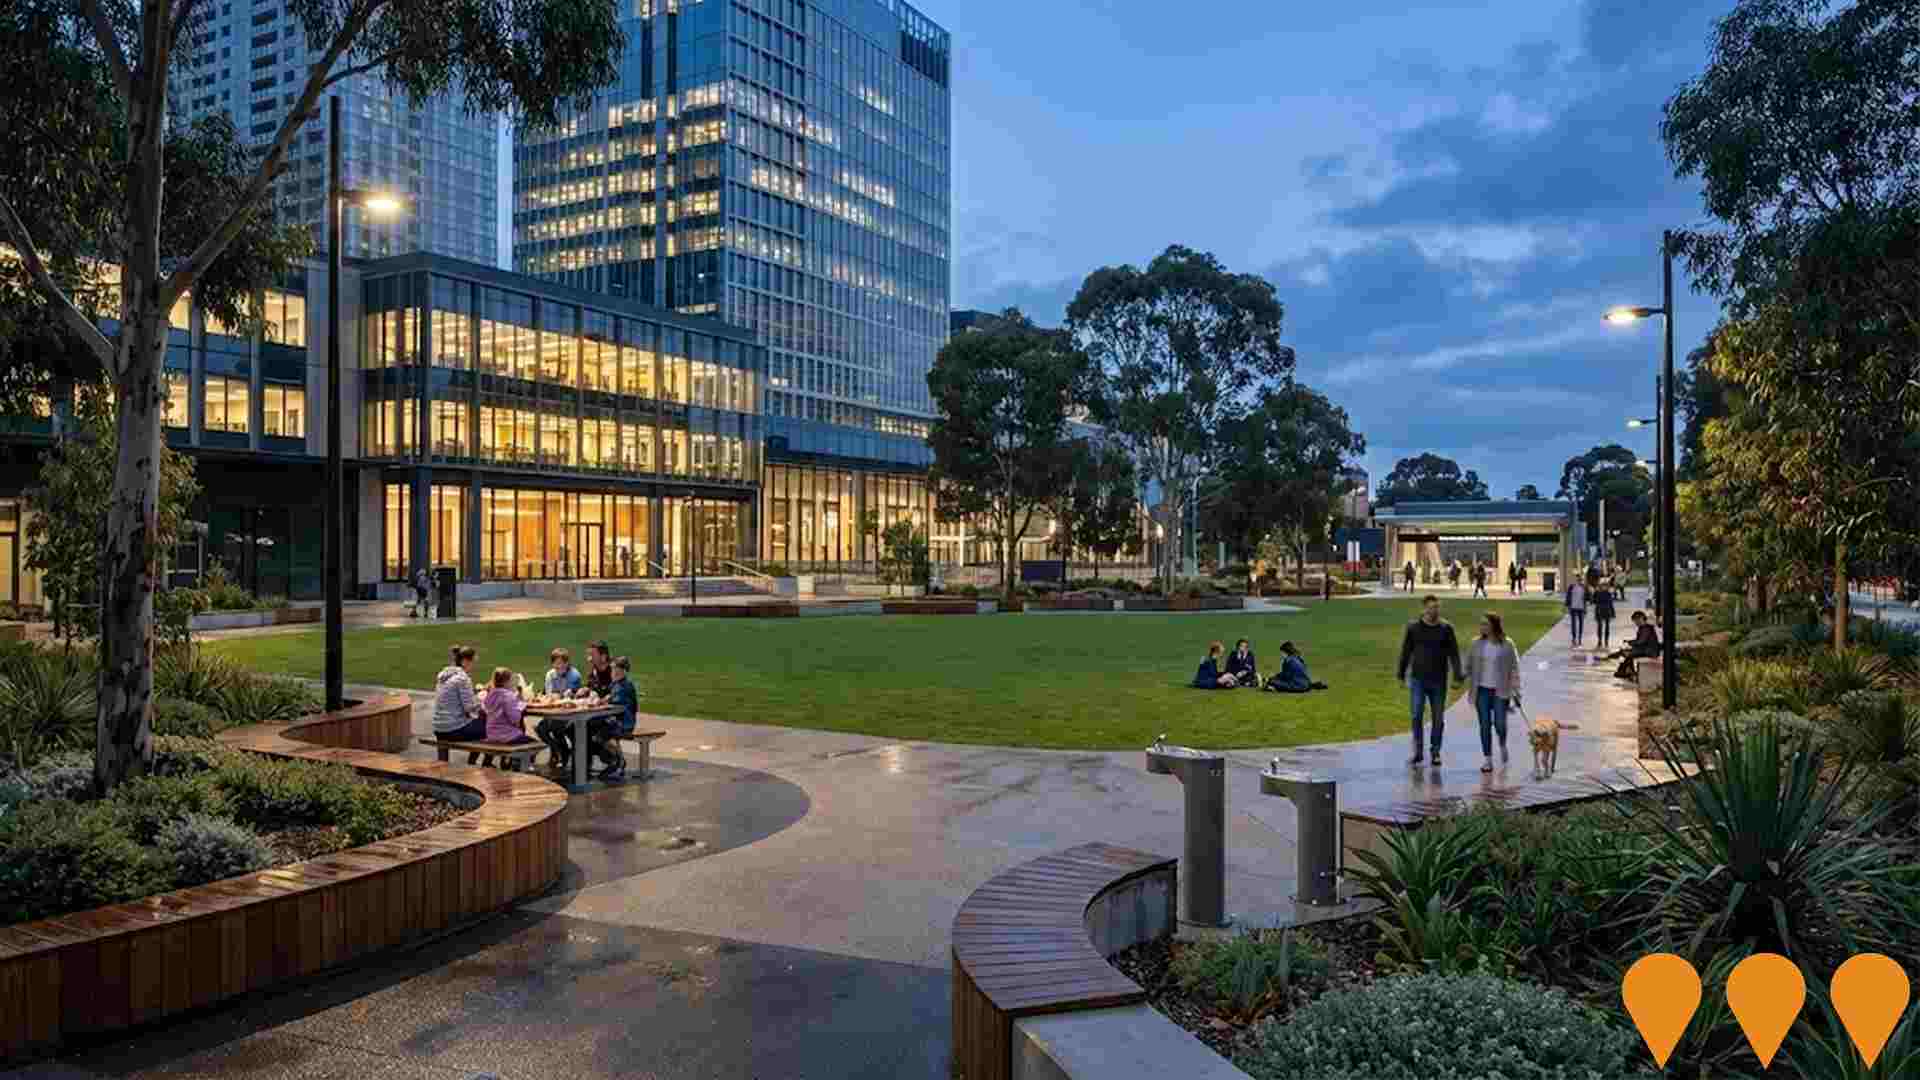
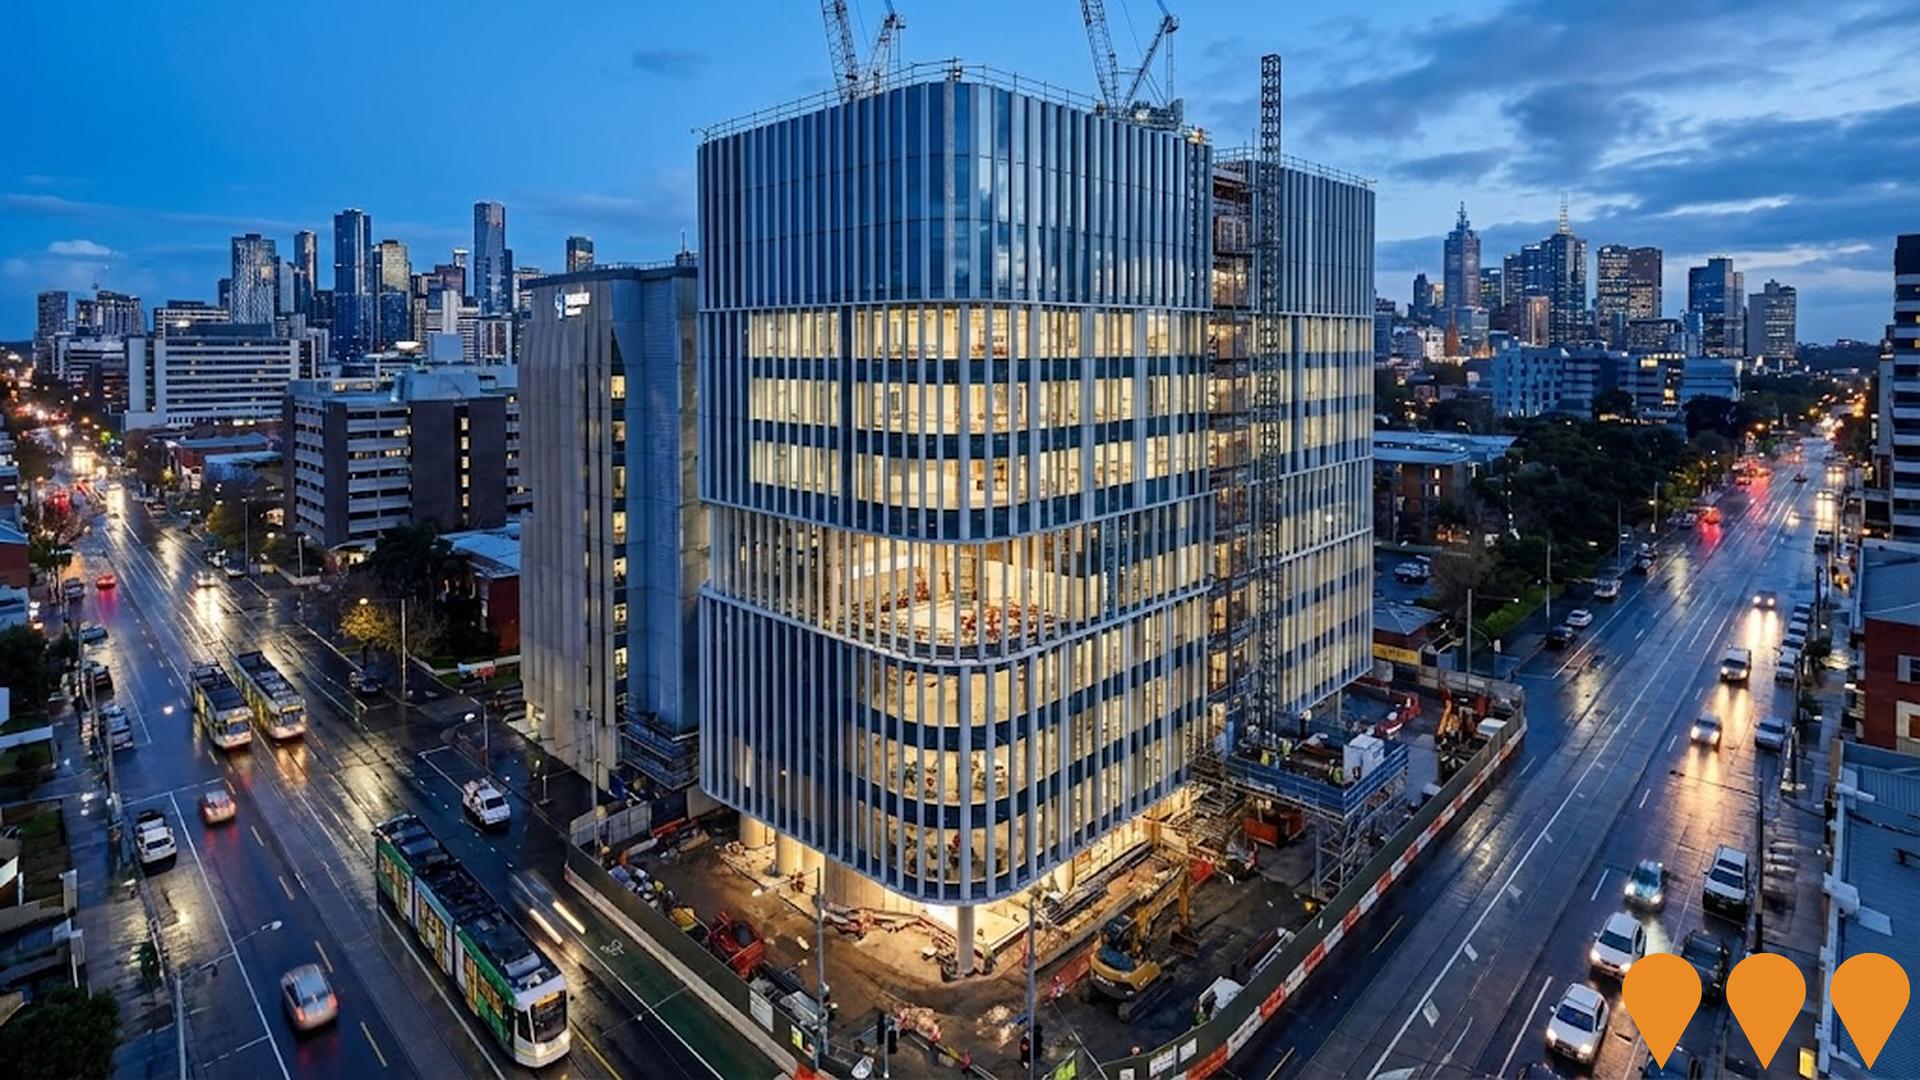
Australian Institute for Infectious Disease (AIID)
A $650 million world-class translational research facility in the Melbourne Biomedical Precinct, Parkville. Jointly led by the University of Melbourne, Doherty Institute and Burnet Institute. The 7-level building will accommodate over 1,000 researchers and feature PC3/PC4 laboratories, robotic biobanking, a human infection challenge unit, clinical trial capabilities, drug/vaccine development platforms and co-location space for industry partners. Demolition completed mid-2025, main works contractor (Multiplex) appointed September 2025, construction now underway with practical completion targeted for late 2027.
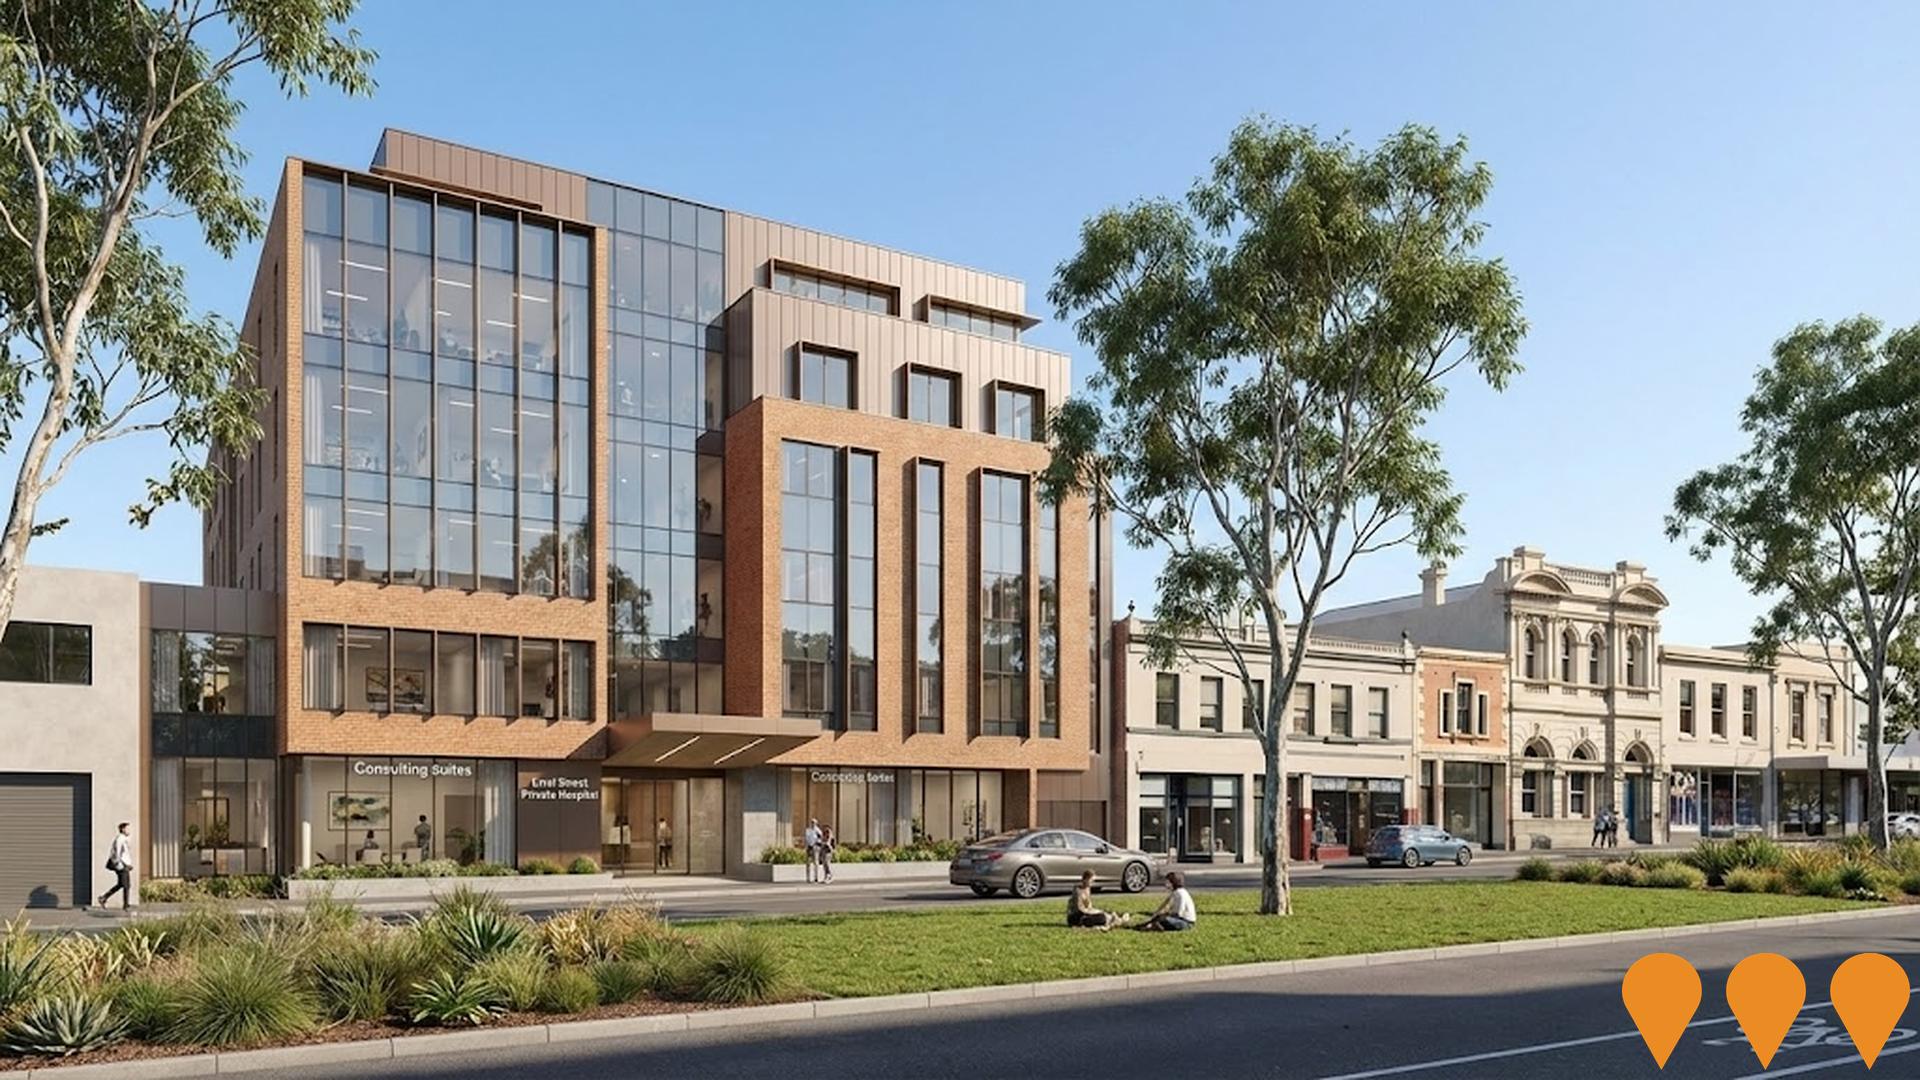
Errol Street Private Hospital
New 8-level private hospital in North Melbourne delivering 223 overnight beds, 10 ICU beds, 7 operating theatres, medical imaging, pathology and specialist consulting suites within the Parkville Biomedical Precinct.
Metro Tunnel Project
The Metro Tunnel is a 9km twin-tunnel underground rail project with five new stations (Arden, Parkville, State Library, Town Hall, Anzac). It creates a new end-to-end rail line from Sunbury to Cranbourne/Pakenham, includes High Capacity Signalling and new High Capacity Metro Trains. Major construction is complete, systems testing and trial operations are underway. Limited passenger services on the tunnel section commence 30 November 2025, with full integration into the metropolitan network and new timetable from early 2026.
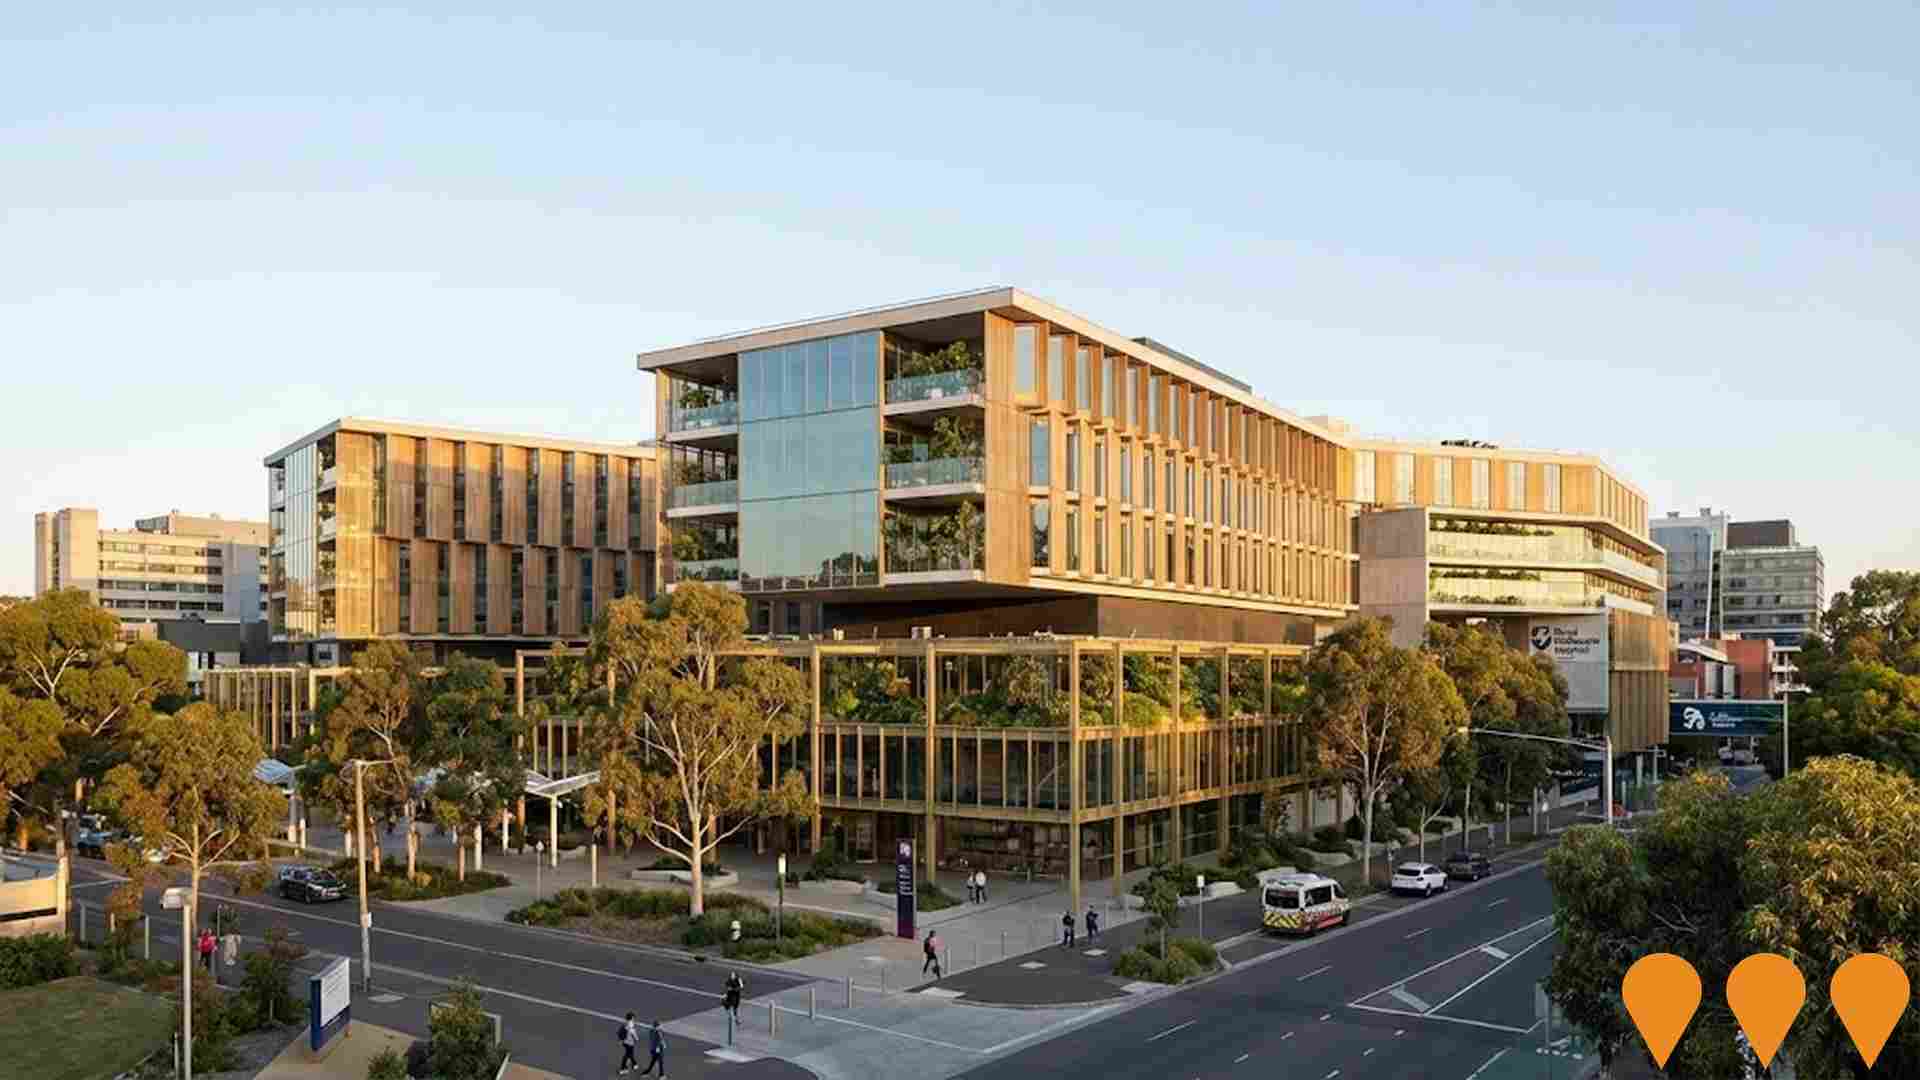
Parkville Precinct Redevelopment
The Parkville Precinct Redevelopment is a major hospital upgrade project involving the redevelopment of the Royal Melbourne Hospital and expansion of the Royal Women's Hospital into a single consolidated medical precinct in Parkville. The initial works include the decommissioning and demolition of the Materials Handling Building (MHB). The project was originally a $2.3 billion two-site redevelopment (Arden and Parkville), but was changed to a single-site redevelopment at Parkville due to technical issues (Electromagnetic Interference) at the Arden site. The overall scope of the Parkville building campus is still to be confirmed.
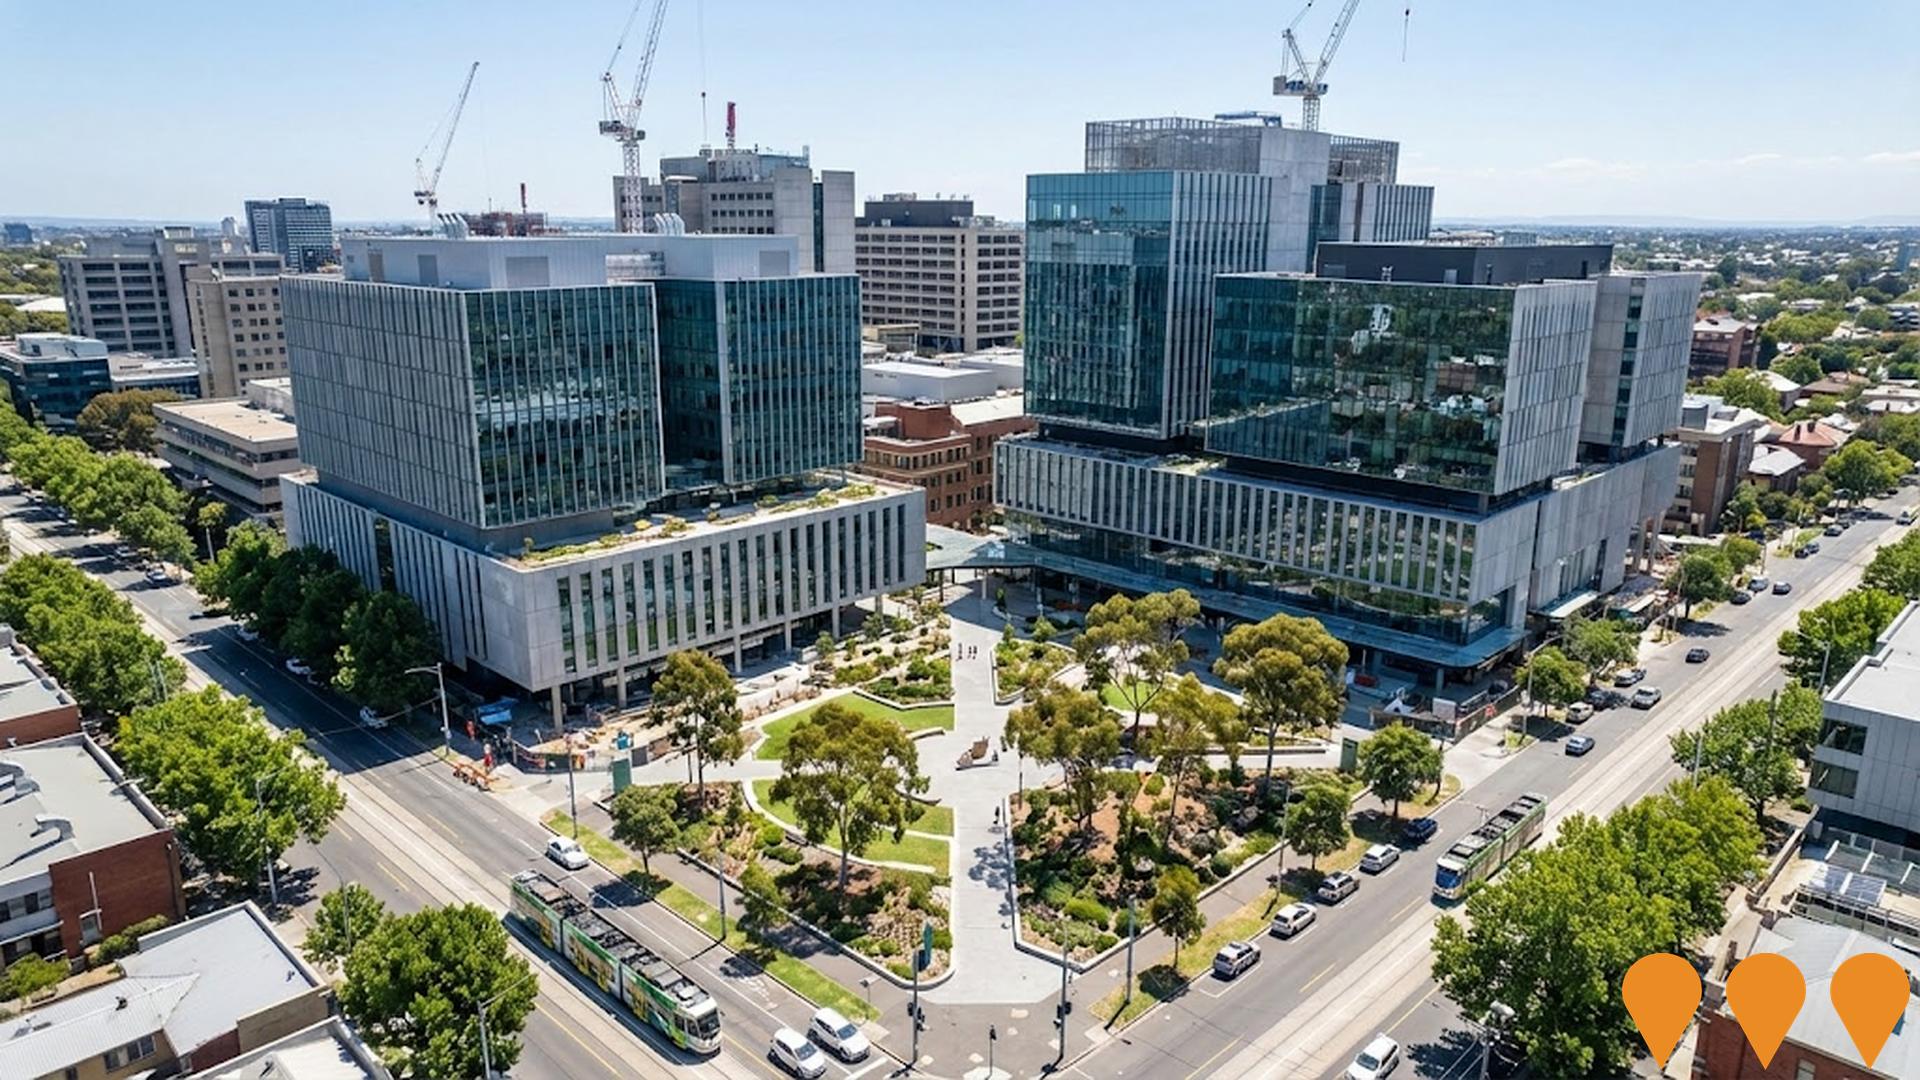
Parkville Precinct Redevelopment
A major $2.3 billion redevelopment of the Parkville biomedical precinct, consolidating the Royal Melbourne Hospital and Royal Women's Hospital upgrades onto a single site. Originally planned as a dual-site project, the Arden campus component was cancelled in 2024 due to electromagnetic interference risks. Current works include the decommissioning and demolition of the Materials Handling Building, with planning underway for new tower facilities to deliver 1,800+ beds and treatment spaces.
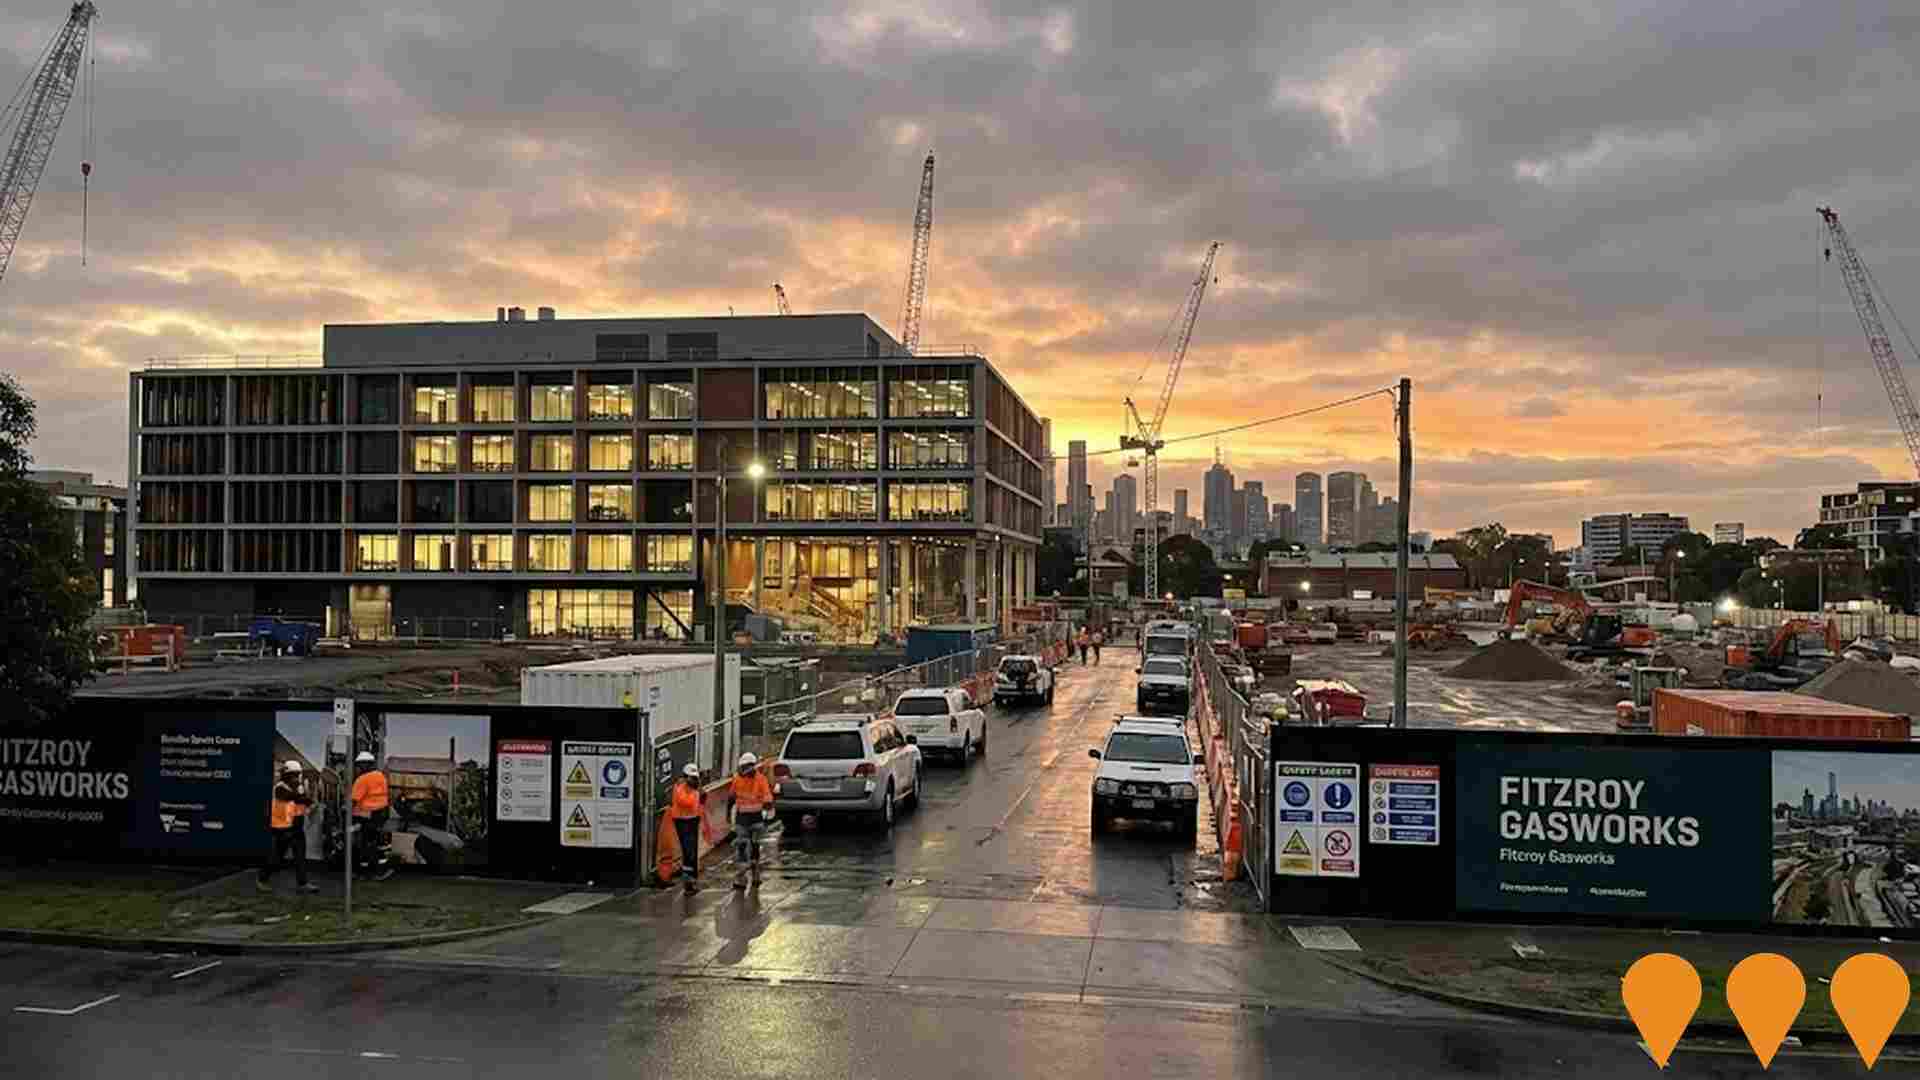
Fitzroy Gasworks
Ongoing transformation of the 3.9-hectare former gasworks site into a mixed-use urban renewal precinct delivering approximately 1,200 new homes (including 20% affordable housing), the operational Wurun Senior Campus (opened 2022), the Bundha Sports Centre (construction complete, opening early 2026), extensive public open space, commercial/community spaces, and heritage retention. Development Victoria leads the project. Parcels B & C (820 homes) by Inner North Collective JV (Assemble, Milieu, Hickory); Parcel A (approx. 350 homes) in RFP phase with developer appointment expected late 2025. Site remediation complete, early infrastructure works underway in 2025.
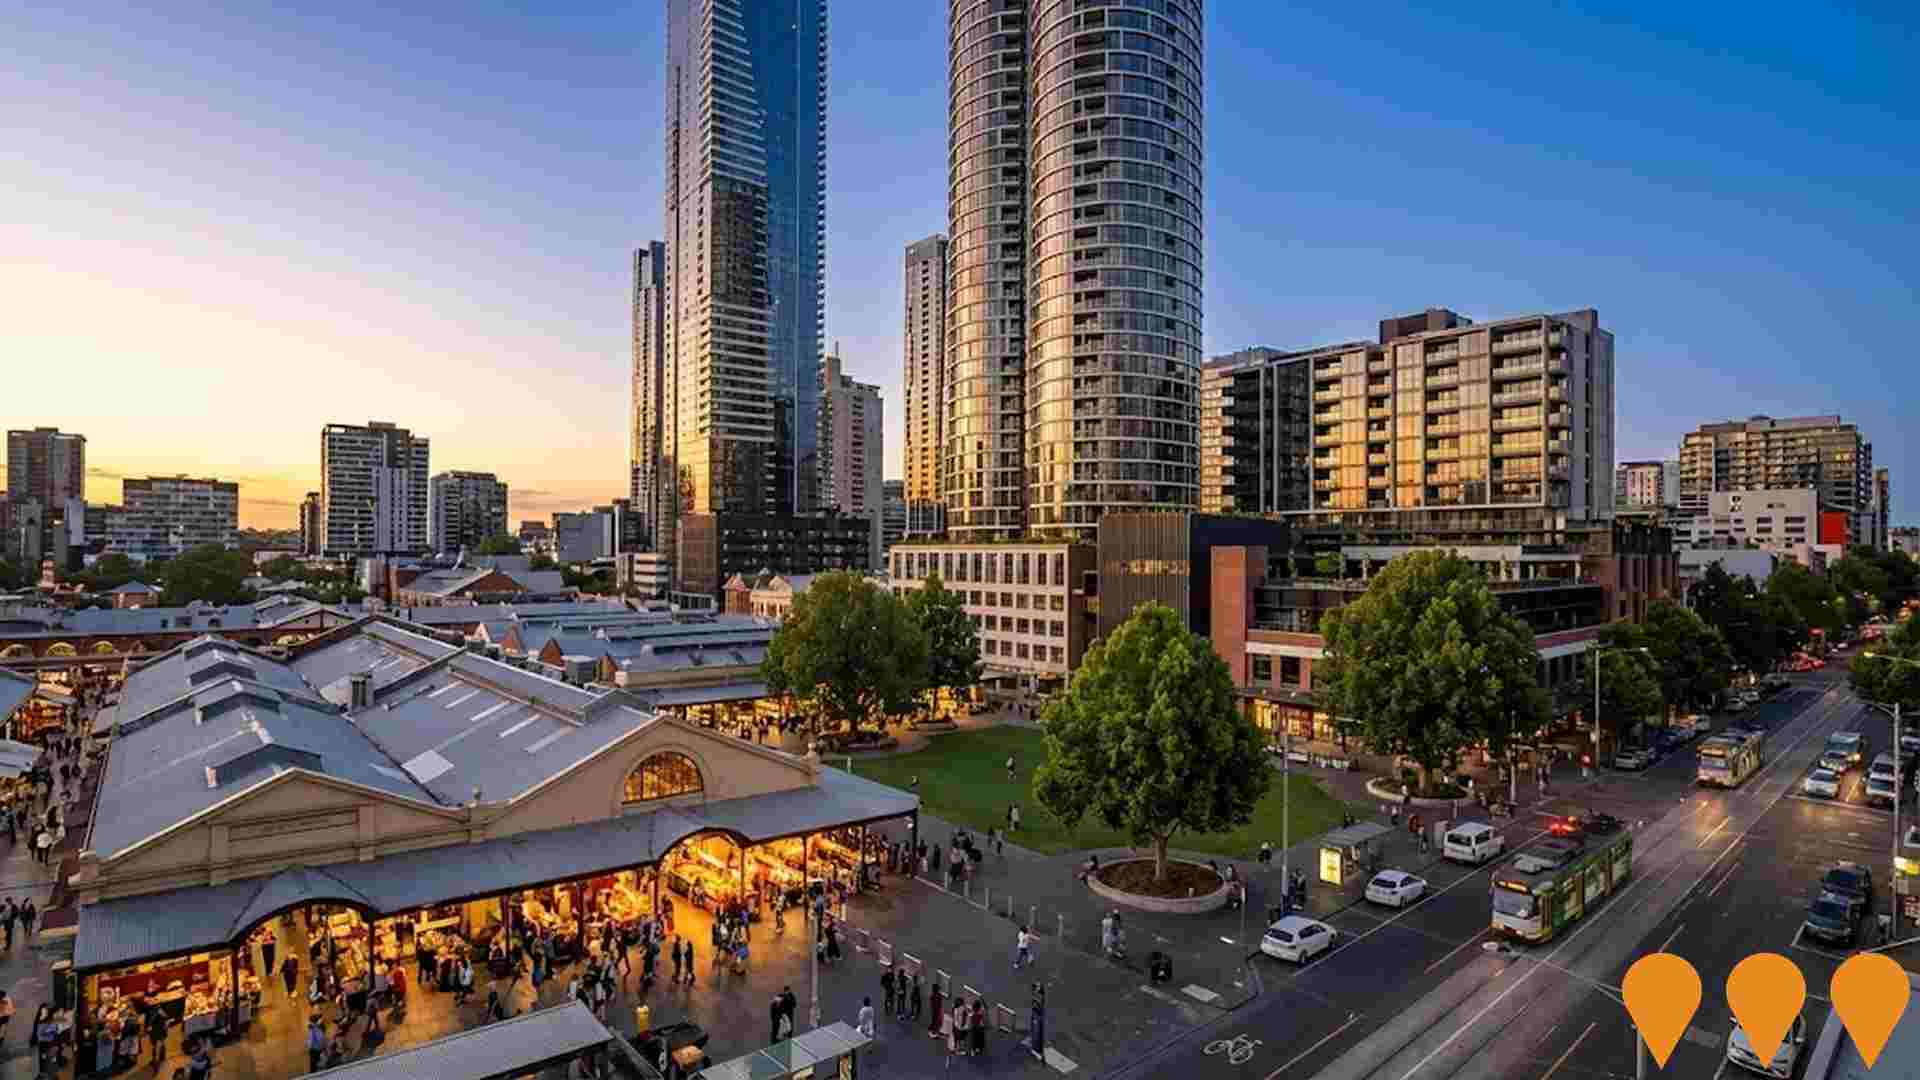
Queen Victoria Market Precinct Renewal
The City of Melbourne's Queen Victoria Market Precinct Renewal is a multi-stage program to preserve and modernise Australia's largest and most intact 19th-century market. Key completed/ongoing works include heritage shed restorations, new trader facilities, customer amenities and core market infrastructure (largely finished by end-2024). The southern development (Gurrowa Place), delivered in partnership with Lendlease and Scape, received final federal heritage approval in August 2025 and includes a new 1.8 ha public open space (Market Square), restoration of the Franklin Street Stores, a 220-space basement car park, and mixed-use towers providing student accommodation, build-to-rent and affordable housing. Total program value approximately $268 million, with full precinct completion expected later this decade.
Employment
Employment conditions in Carlton remain below the national average according to AreaSearch analysis
Carlton has a highly educated workforce with strong representation in professional services. The unemployment rate was 6.7% as of September 2025.
Employment growth over the past year was estimated at 6.5%. There were 15,041 residents employed in September 2025 with an unemployment rate of 2.0% higher than Greater Melbourne's rate of 4.7%. Workforce participation was broadly similar to Greater Melbourne's 64.1%. Employment among residents is concentrated in professional & technical, accommodation & food, and health care & social assistance sectors.
The area has a notably high concentration in accommodation & food employment at 2.3 times the regional average. Construction employment is limited at 3.0%, compared to the regional average of 9.7%. There are 1.1 workers for every resident in Carlton, indicating it functions as an employment hub attracting workers from surrounding areas. Between September 2024 and September 2025, employment levels increased by 6.5% and labour force grew by 6.4%, keeping the unemployment rate relatively stable at 6.7%. In contrast, Greater Melbourne saw employment rise by 3.0%, labour force grow by 3.3%, and unemployment rise to 5.0%. State-level data from VIC as of 25-Nov shows employment grew by 1.13% year-on-year with an unemployment rate of 4.7%. National employment forecasts from Jobs and Skills Australia suggest national employment will expand by 6.6% over five years and 13.7% over ten years. Applying these projections to Carlton's employment mix suggests local employment should increase by 7.0% over five years and 14.2% over ten years.
Frequently Asked Questions - Employment
Income
The area's income levels rank in the lower 15% nationally based on AreaSearch comparative data
Carlton SA2's median income among taxpayers was $35,604 in financial year 2022, according to ATO data aggregated by AreaSearch. This figure is below the national average. The average income for Carlton SA2 stood at $55,619 during this period. In comparison, Greater Melbourne's median and average incomes were $54,892 and $73,761 respectively. Based on Wage Price Index growth of 12.16% since financial year 2022, current estimates for Carlton SA2 would be approximately $39,933 (median) and $62,382 (average) as of September 2025. Census data indicates that household, family and personal incomes in Carlton all fall between the 19th and 19th percentiles nationally. Income distribution shows that 26.0% of Carlton's population (6,219 individuals) have incomes within the $1,500 - 2,999 range, which is consistent with broader trends across the surrounding region showing 32.8% in the same category. Housing affordability pressures are severe in Carlton, with only 75.1% of income remaining after housing costs, ranking at the 11th percentile. The area's SEIFA income ranking places it in the 7th decile.
Frequently Asked Questions - Income
Housing
Carlton features a more urban dwelling mix with significant apartment living, with a higher proportion of rental properties than the broader region
Carlton's dwelling structures, as per the latest Census, consisted of 1.3% houses and 98.7% other dwellings (semi-detached, apartments, 'other' dwellings). In comparison, Melbourne metro had 2.2% houses and 97.8% other dwellings. Home ownership in Carlton was 13.9%, with mortgages at 10.5% and rentals at 75.6%. The median monthly mortgage repayment was $1,871, below Melbourne metro's average of $1,962. Median weekly rent in Carlton was $365, compared to Melbourne metro's $396. Nationally, Carlton's mortgage repayments were higher than the Australian average of $1,863, while rents were lower than the national figure of $375.
Frequently Asked Questions - Housing
Household Composition
Carlton features high concentrations of group households and lone person households, with a fairly typical median household size
Family households account for 36.4% of all households, including 6.9% that are couples with children, 21.3% that are couples without children, and 5.1% that are single parent families. Non-family households constitute the remaining 63.6%, with lone person households at 45.5% and group households comprising 18.2%. The median household size is 1.8 people, which aligns with the Greater Melbourne average.
Frequently Asked Questions - Households
Local Schools & Education
The educational profile of Carlton exceeds national averages, with above-average qualification levels and academic performance metrics
Carlton has a higher educational attainment compared to broader benchmarks. Specifically, 59.5% of its residents aged 15 and above have university qualifications, surpassing the national average of 30.4% and the Victorian average of 33.4%. This high level of educational attainment is led by bachelor degrees, with 35.5% of residents holding such qualifications. Postgraduate qualifications follow at 21.3%, while graduate diplomas account for 2.7%.
Technical qualifications make up 13.9% of educational achievements in Carlton, with advanced diplomas representing 7.5% and certificates 6.4%. The area also has a notable high level of educational participation, with 48.2% of residents currently enrolled in formal education. This includes 35.4% in tertiary education, 2.5% in primary education, and 2.1% pursuing secondary education.
Frequently Asked Questions - Education
Schools Detail
Nearby Services & Amenities
Transport
Transport servicing is high compared to other areas nationally based on assessment of service frequency, route connectivity and accessibility
Carlton has 52 active public transport stops that operate a mix of lightrail and bus services. These stops are served by 30 individual routes, providing a total of 17,559 weekly passenger trips. The accessibility of these services is rated as excellent, with residents typically located just 106 meters from the nearest stop.
On average, there are 2,508 trips per day across all routes, which equates to approximately 337 weekly trips per individual stop.
Frequently Asked Questions - Transport
Transport Stops Detail
Health
Carlton's residents boast exceedingly positive health performance metrics with younger cohorts in particular seeing very low prevalence of common health conditions
Health outcomes data shows excellent results in Carlton, with younger cohorts experiencing very low prevalence of common health conditions. Approximately 48% of Carlton's total population (~11,386 people) has private health cover, compared to Greater Melbourne's 56.0%. Nationally, this figure stands at 55.3%.
Mental health issues and asthma are the most prevalent medical conditions in Carlton, affecting 10.1 and 7.0% of residents respectively. A total of 76.9% of Carlton residents declare themselves completely clear of medical ailments, compared to Greater Melbourne's 79.8%. As of a recent report (2021), 5.9% of Carlton's population is aged 65 and over (1,409 people).
Frequently Asked Questions - Health
Cultural Diversity
Carlton is among the most culturally diverse areas in the country based on AreaSearch assessment of a range of language and cultural background related metrics
Carlton has one of the highest language diversity rates in Australia, with 51.0% of its residents speaking a language other than English at home. Born overseas make up 58.6% of Carlton's population. Christianity is the predominant religion in Carlton, accounting for 22.7% of people.
Buddhism has a higher representation in Carlton compared to Greater Melbourne, with 6.6% versus 7.0%. The top three ancestry groups in Carlton are Chinese (20.3%), Other (18.3%), and English (15.7%). Spanish (0.8%) and Vietnamese (2.0%) show equal representation to the regional average while Korean (0.9%) is slightly underrepresented compared to Greater Melbourne's 1.5%.
Frequently Asked Questions - Diversity
Age
Carlton hosts a very young demographic, ranking in the bottom 10% of areas nationwide
Carlton's median age was 24 years as of a certain date, notably lower than Greater Melbourne's 37 and significantly below the national average of 38 years. Compared to Greater Melbourne, Carlton had a higher concentration of residents aged 15-24 (40.4%) but fewer residents aged 5-14 (1.9%). This concentration of 15-24 year-olds was well above the national average of 12.5%. Since the 2021 Census, younger residents have shifted Carlton's median age down by 3.5 years to 24. The 15 to 24 age group has grown from 30.7% to 40.4% of Carlton's population since then. Conversely, the 35 to 44 cohort has declined from 10.9% to 8.5%, and the 45 to 54 group has dropped from 6.3% to 4.4%. By a specific date in 2041, Carlton is expected to see notable shifts in its age composition, with the 25 to 34 group projected to grow by 43% (3,512 people), reaching 11,624 from 8,111.
