Chart Color Schemes
This analysis uses ABS Statistical Areas Level 2 (SA2) boundaries, which can materially differ from Suburbs and Localities (SAL) even when sharing similar names.
SA2 boundaries are defined by the Australian Bureau of Statistics and are designed to represent communities for statistical reporting (e.g., census and ERP).
Suburbs and Localities (SAL) represent commonly-used suburb/locality names (postal-style areas) and may use different geographic boundaries. For comprehensive analysis, consider reviewing both boundary types if available.
est. as @ -- *
ABS ERP | -- people | --
2021 Census | -- people
Sales Activity
Curious about local property values? Filter the chart to assess the volume and appreciation (including resales) trends and regional comparisons, or scroll to the map below view this information at an individual property level.
Find a Recent Sale
Sales Detail
Population
Population growth drivers in Bentleigh East - South are above average based on AreaSearch's ranking of recent, and medium to long-term trends
Bentleigh East - South's population, as of Nov 2025, is approximately 14,787, indicating a growth of 730 people since the 2021 Census. This increase represents a 5.2% rise from the previous figure of 14,057. The change can be attributed to an estimated resident population of 14,774 in June 2024 and an additional 168 validated new addresses since the Census date. This results in a population density ratio of 3,221 persons per square kilometer, placing Bentleigh East - South in the upper quartile compared to other locations assessed by AreaSearch. Over the past decade, from 2015 to 2025, Bentleigh East - South has shown consistent growth with a compound annual growth rate of 1.1%, outperforming its SA4 region. Overseas migration was the primary driver for population growth, contributing approximately 73.4% of overall population gains during recent periods.
AreaSearch uses ABS/Geoscience Australia projections for each SA2 area, released in 2024 with a base year of 2022. For areas not covered by this data, AreaSearch employs VIC State Government's Regional/LGA projections from 2023, adjusted using a method of weighted aggregation of population growth from LGA to SA2 levels. Growth rates by age group are applied across all areas for the years 2032 to 2041. Based on these projections, Bentleigh East - South is expected to experience above median population growth nationally, with an anticipated increase of 2,832 persons by 2041, reflecting a total rise of 19.0% over the 17-year period.
Frequently Asked Questions - Population
Development
AreaSearch assessment of residential approval activity sees Bentleigh East - South among the top 30% of areas assessed nationwide
Bentleigh East - South averaged approximately 113 new dwelling approvals per year over the past five financial years, totalling 565 homes. As of FY26, 26 approvals have been recorded. Based on an average of 1.3 new residents per year per dwelling constructed between FY21 and FY25, supply appears balanced with demand, maintaining stable market conditions. The average construction cost value of new properties is $465,000, which is somewhat higher than regional norms due to quality-focused development.
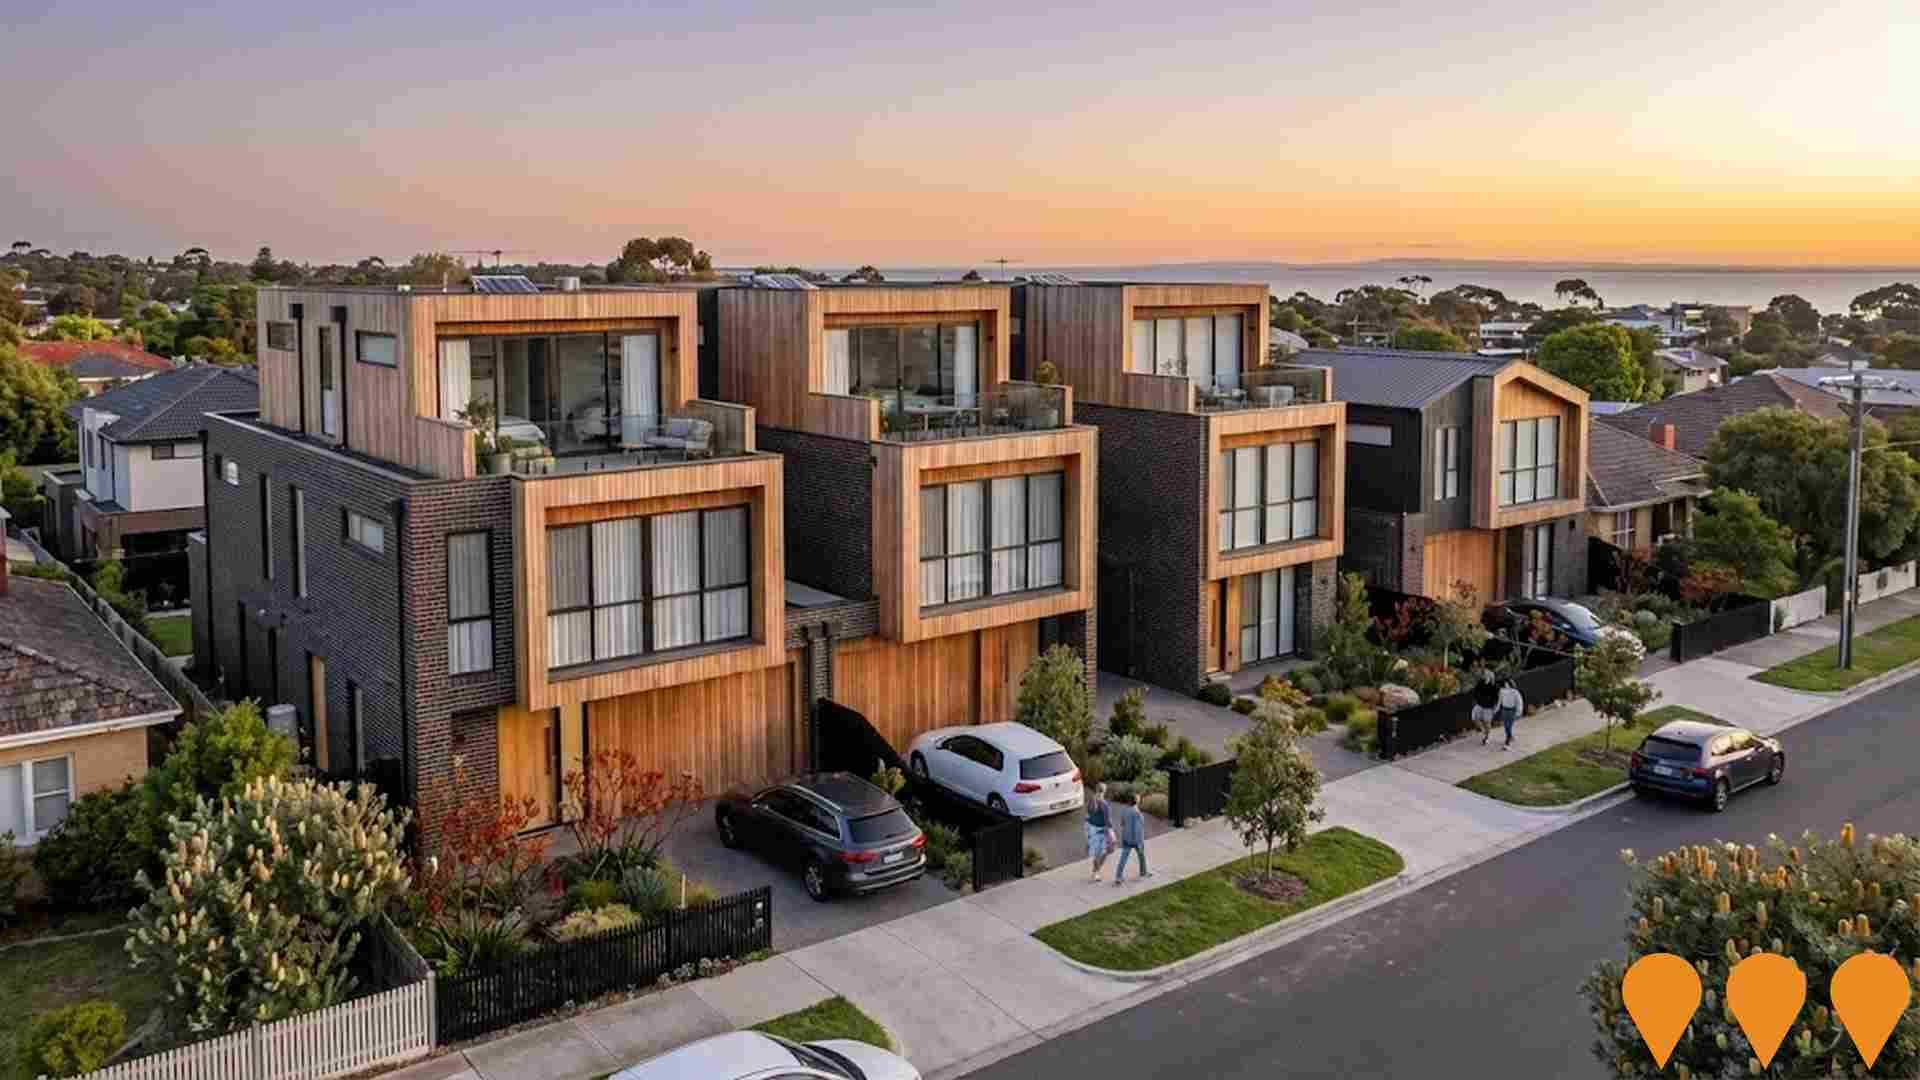
This financial year has seen $18.3 million in commercial development approvals, indicating moderate levels of commercial development. Compared to Greater Melbourne, Bentleigh East - South has had 24.0% more development per person over the past five years, offering good buyer choice while supporting existing property values. However, building activity has slowed recently. New building activity consists of 24.0% detached dwellings and 76.0% townhouses or apartments, reflecting a shift from the current housing mix of 70.0% houses. This change is due to reduced availability of development sites and shifting lifestyle demands and affordability requirements.
Bentleigh East - South has around 180 people per dwelling approval, indicating a low density area. Population forecasts estimate an increase of 2,815 residents by 2041. At current development rates, new housing supply should meet demand comfortably, providing good conditions for buyers and potentially supporting growth beyond current population projections.
Frequently Asked Questions - Development
Infrastructure
Bentleigh East - South has strong levels of nearby infrastructure activity, ranking in the top 40% nationally
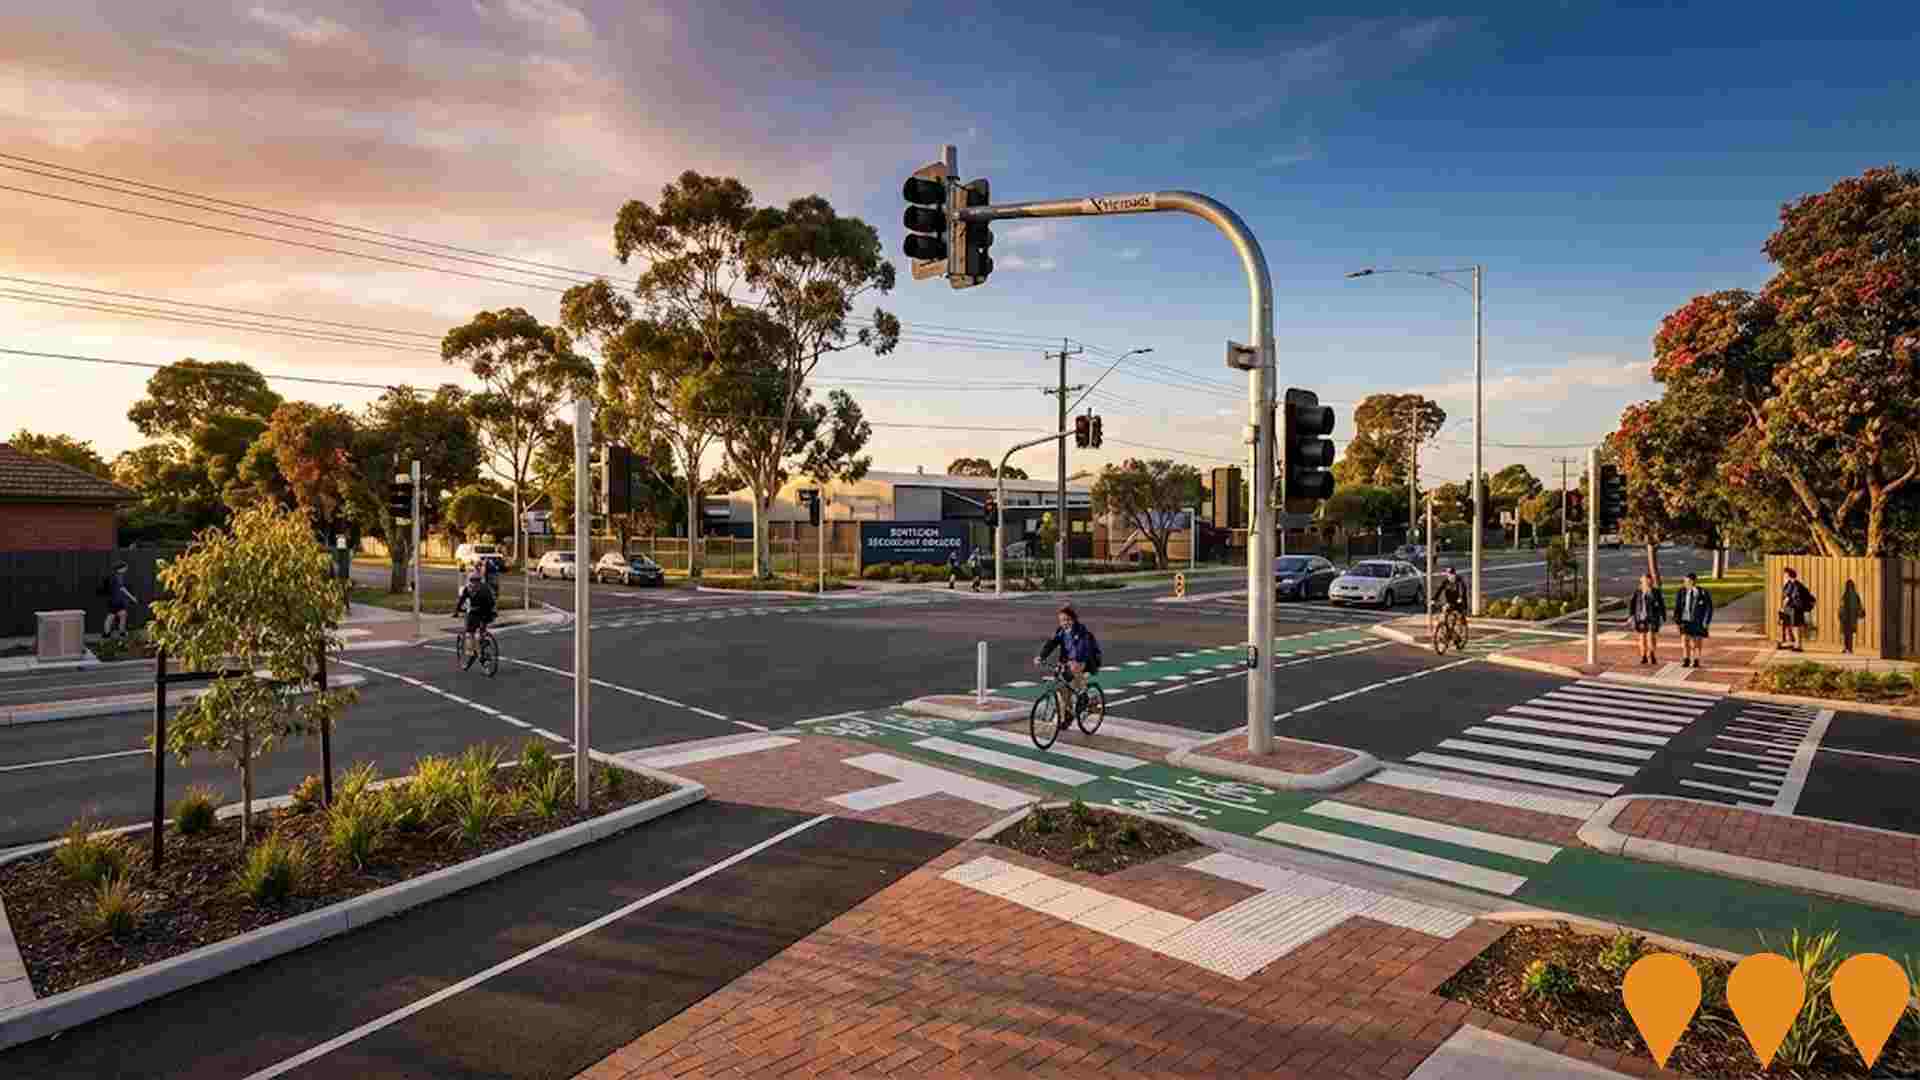
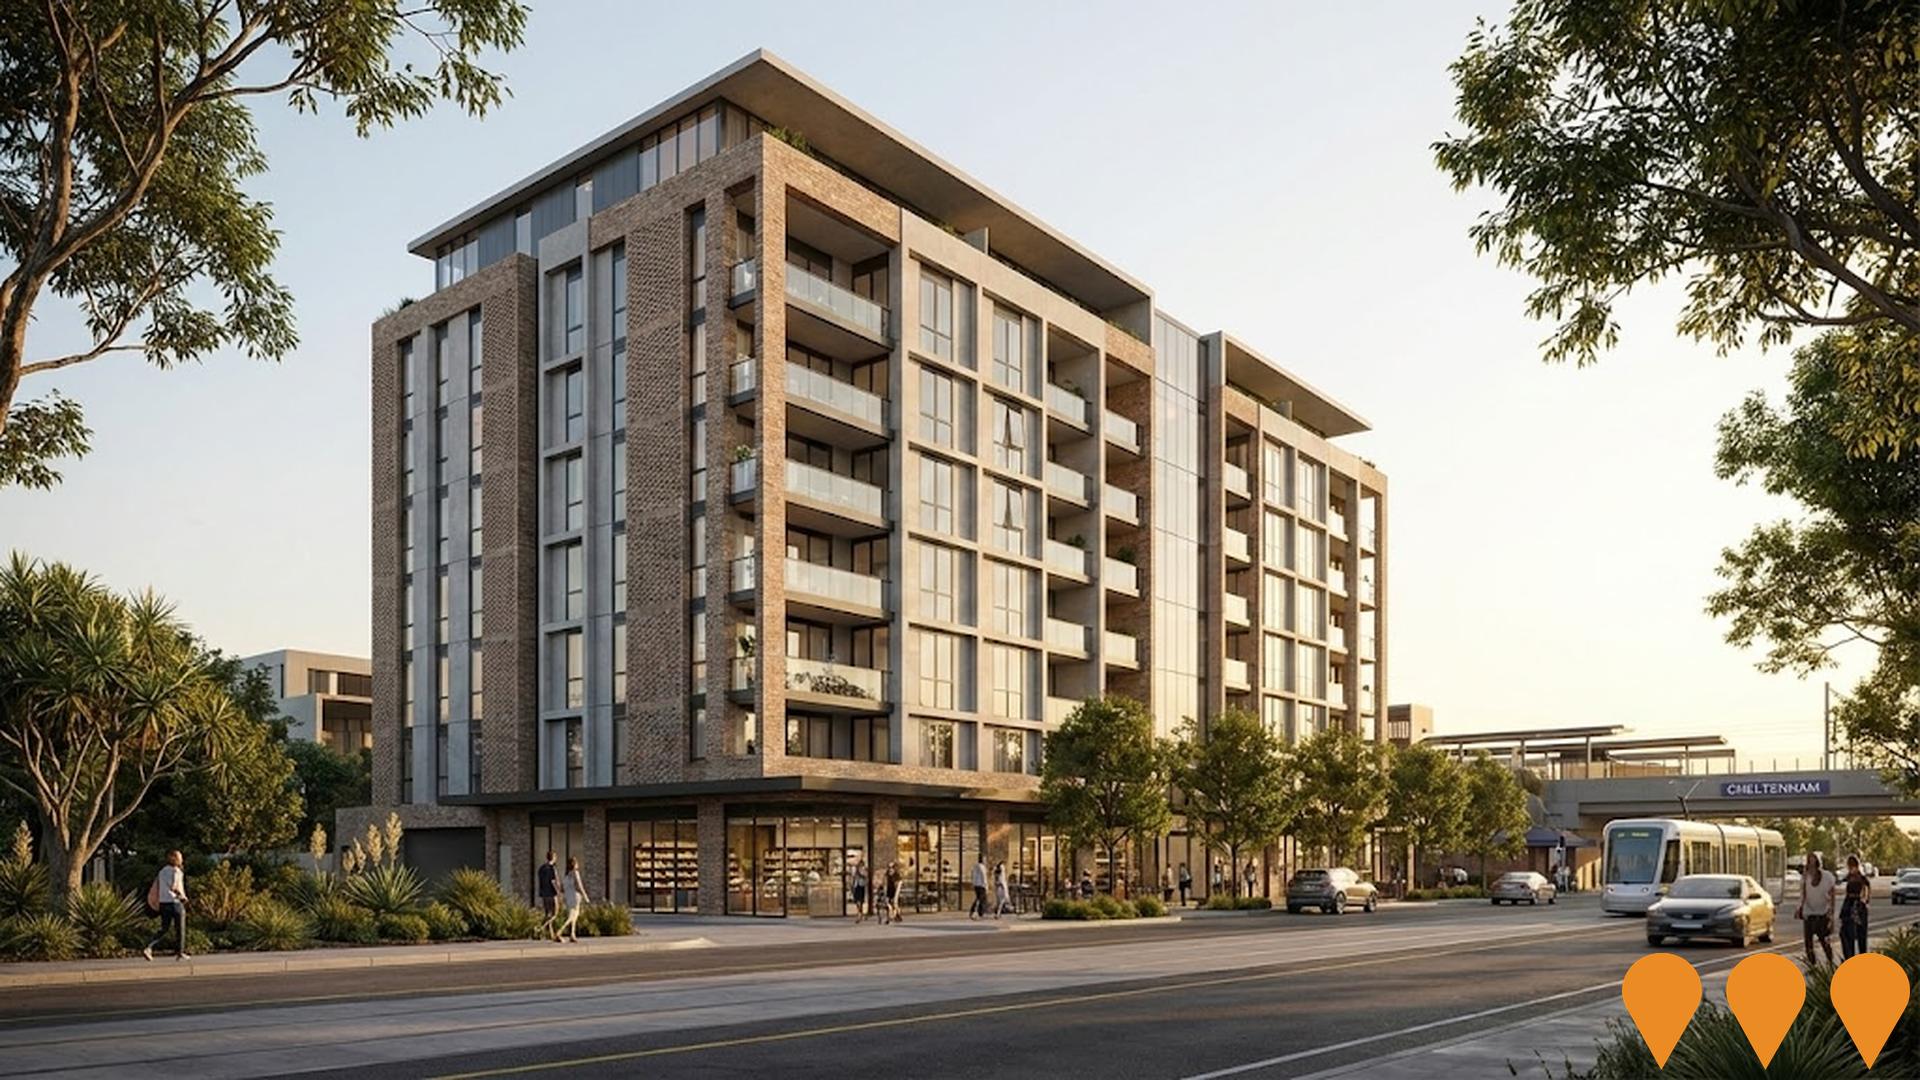
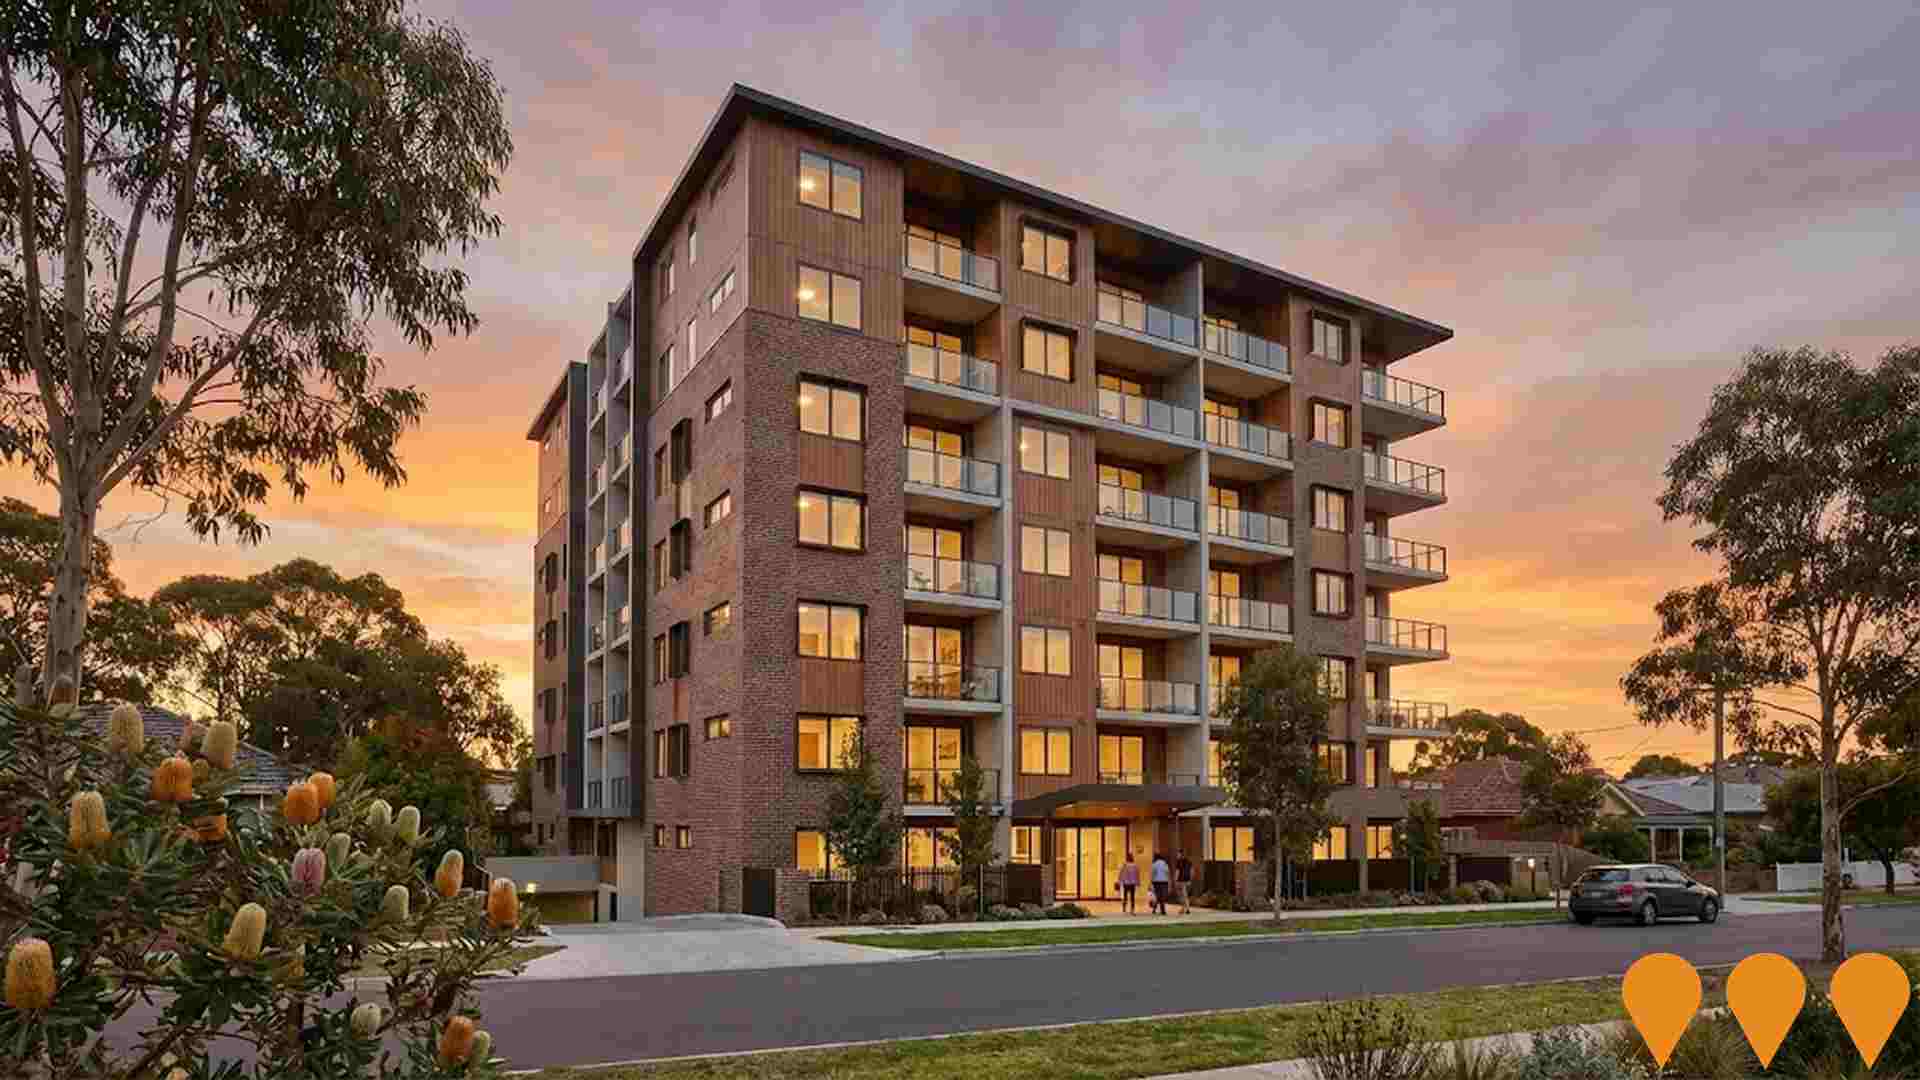
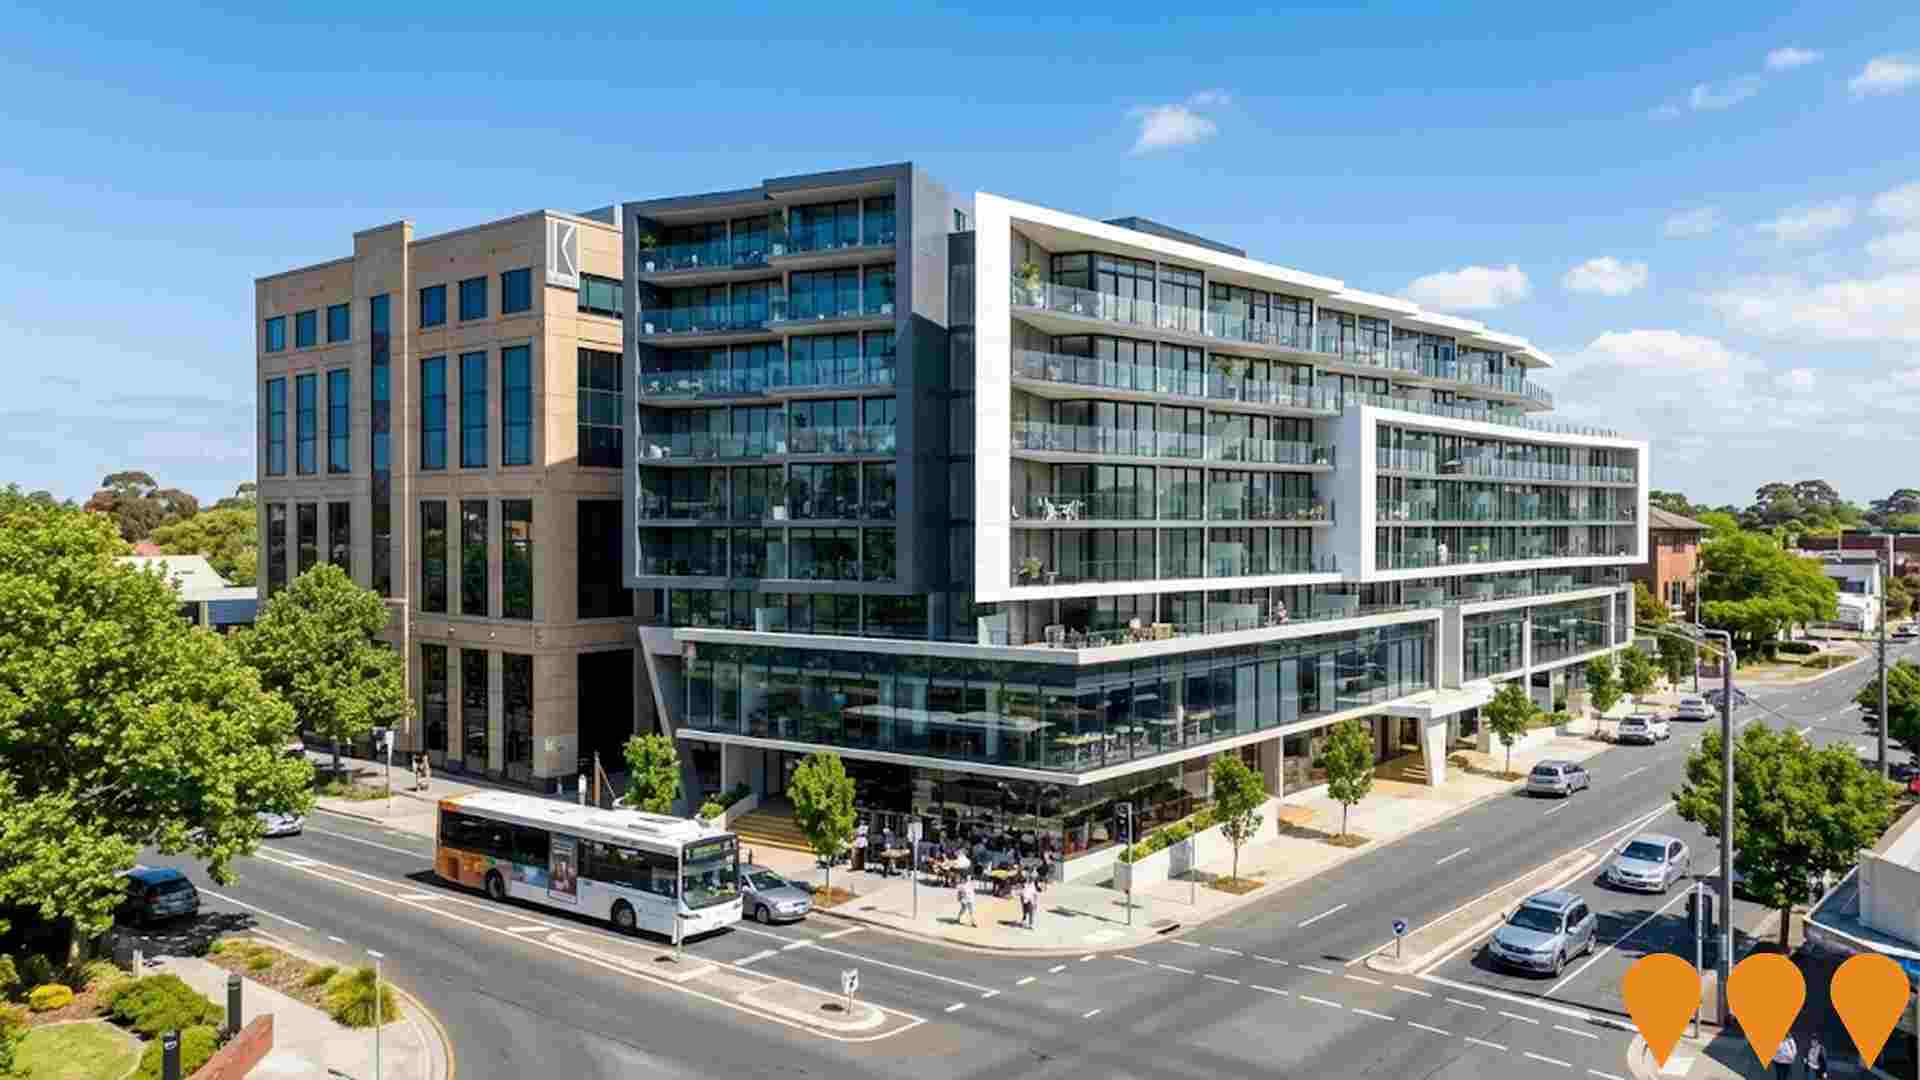
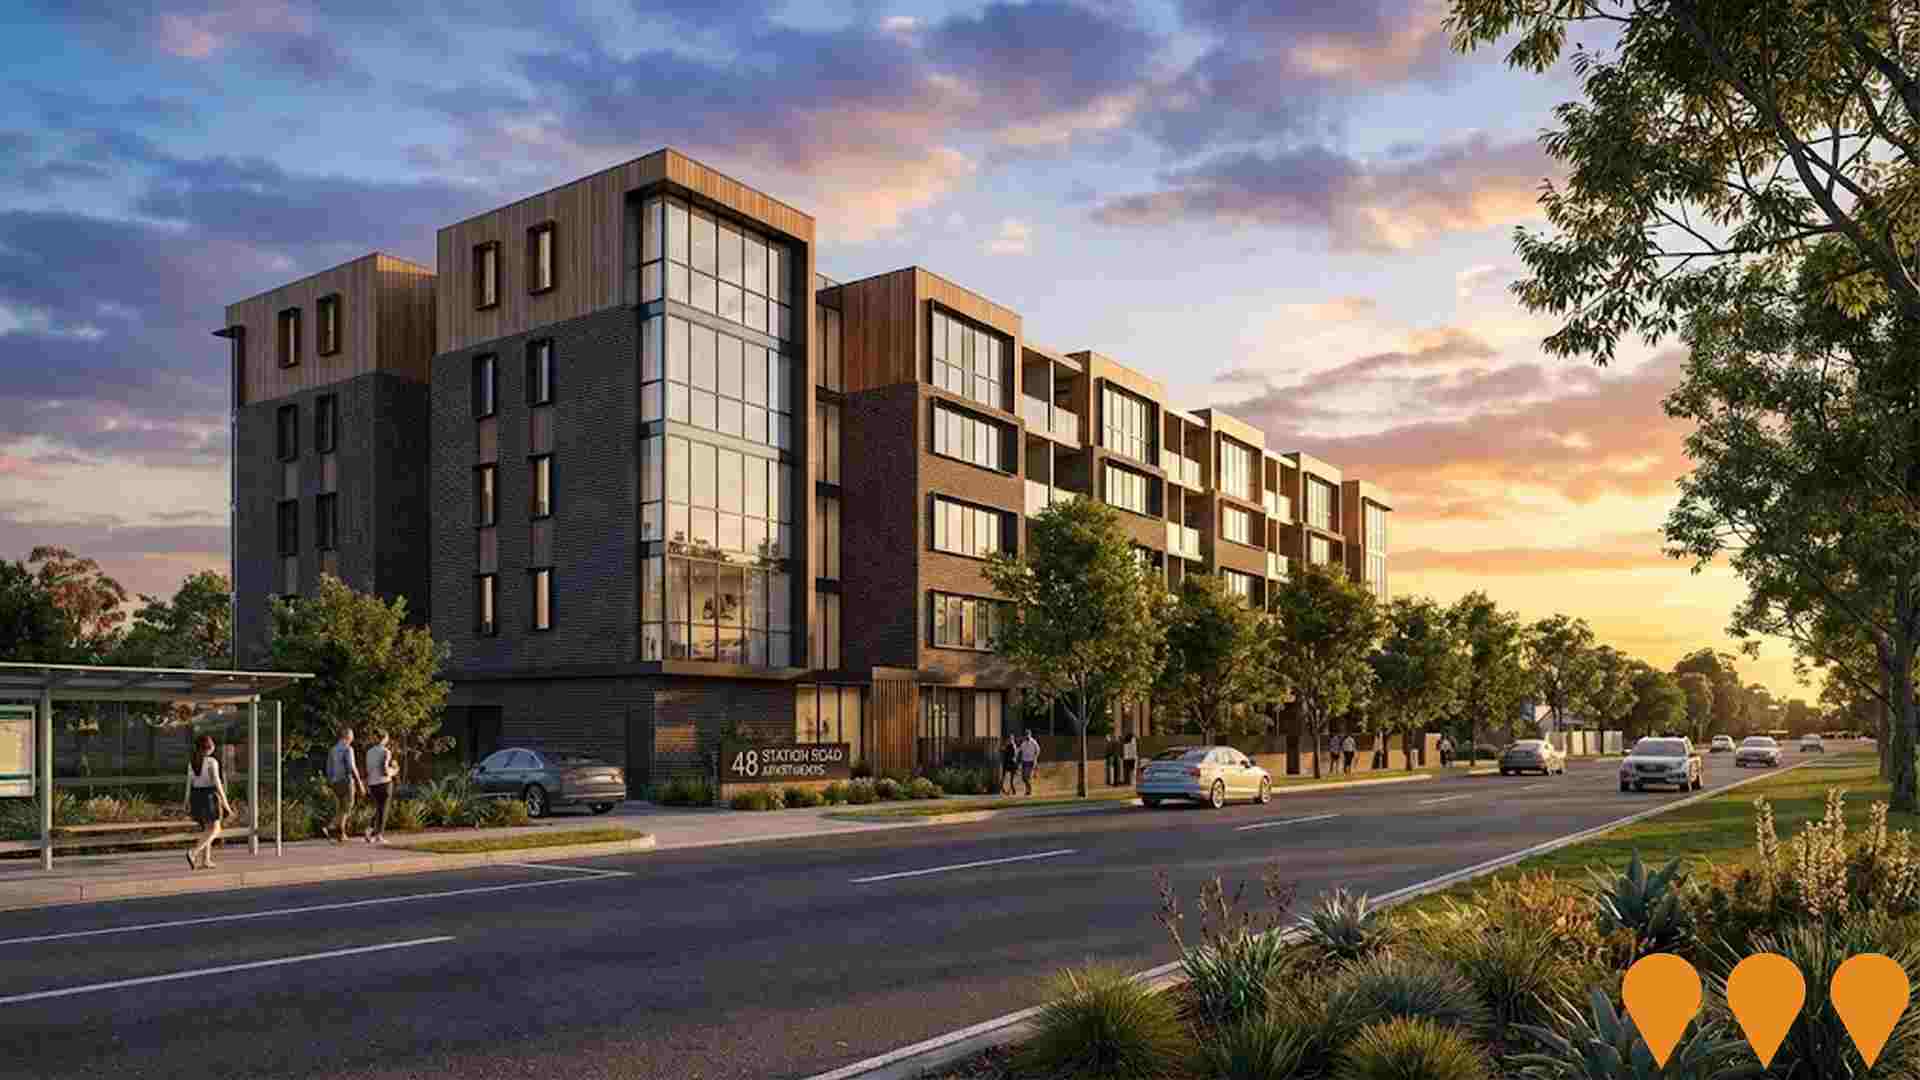
Infrastructure changes significantly affect an area's performance. AreaSearch identified 25 projects likely impacting the region. Notable initiatives include Westfield Southland Ongoing Upgrades, Mackie Road Reserve Upgrade, 1 Victor Road Retirement Village, and 7-21 Station Road Apartments. The following list details those most relevant.
Professional plan users can use the search below to filter and access additional projects.
INFRASTRUCTURE SEARCH
 Denotes AI-based impression for illustrative purposes only, not to be taken as definitive under any circumstances. Please follow links and conduct other investigations from the project's source for actual imagery. Developers and project owners wishing us to use original imagery please Contact Us and we will do so.
Frequently Asked Questions - Infrastructure
East Village
A $1.25 billion master-planned urban renewal precinct covering 24 hectares. Assemble Communities is developing a 4.3ha portion for ~940 build-to-rent dwellings. The wider precinct will comprise 3,000 dwellings, 15,000 sqm retail, 80,000 sqm commercial floorspace, and the completed McKinnon Secondary College East Campus.

Westfield Southland Ongoing Upgrades
Ongoing multi-stage redevelopment of Westfield Southland, one of Australia's largest shopping centres (129,180mý GLA) with over 400 retailers, major anchors (Myer, David Jones, Harris Scarfe), cinema complex, dining precincts, and direct connection to Southland Railway Station. Current works (commenced 2024-2025) include reconfiguration of department store space, transformation of dining/entertainment precincts (first stage opened June 2025), and David Jones store refresh (reopened late 2025). Total recent redevelopment value approximately $72 million. Serves a trade area of ~602,000 residents with annual retail spend exceeding $10.9 billion (2024).

East Bentleigh Ambulance Station
A new multi-million-dollar ambulance station on the Moorabbin Hospital campus, featuring a four-bay garage for ambulances, four rest and recline areas for paramedics, training facilities, a fully equipped kitchen, and secure car parking, to provide modern facilities for faster emergency responses across Melbourne's south-eastern suburbs including Bentleigh, East Bentleigh and Moorabbin.

Mackie Road Reserve Upgrade
Multi-phase implementation of the Mackie Road Reserve Masterplan including pavilion redevelopment (construction starting second half 2025), dedicated dog park with fenced area and agility equipment (works starting 2026), future all-ages playground with public amenities (seeking funding), and improvements to lighting, pathways, and gardens. The pavilion will be a modern, sustainable facility with new kitchen, change rooms, storerooms and large social area. The dog park will feature equestrian sand surface and safety fencing. Project developed through extensive community consultation.

Key Industrial Park - Stage 3
Premium industrial estate development delivering modern warehouses and office facilities in the heart of Moorabbin's industrial precinct.

Bentleigh East Structure Plan Implementation
Strategic planning framework to guide future development and growth in Bentleigh East activity centre. Includes provisions for increased housing density, improved public spaces, transport connections and community facilities to accommodate projected population growth.
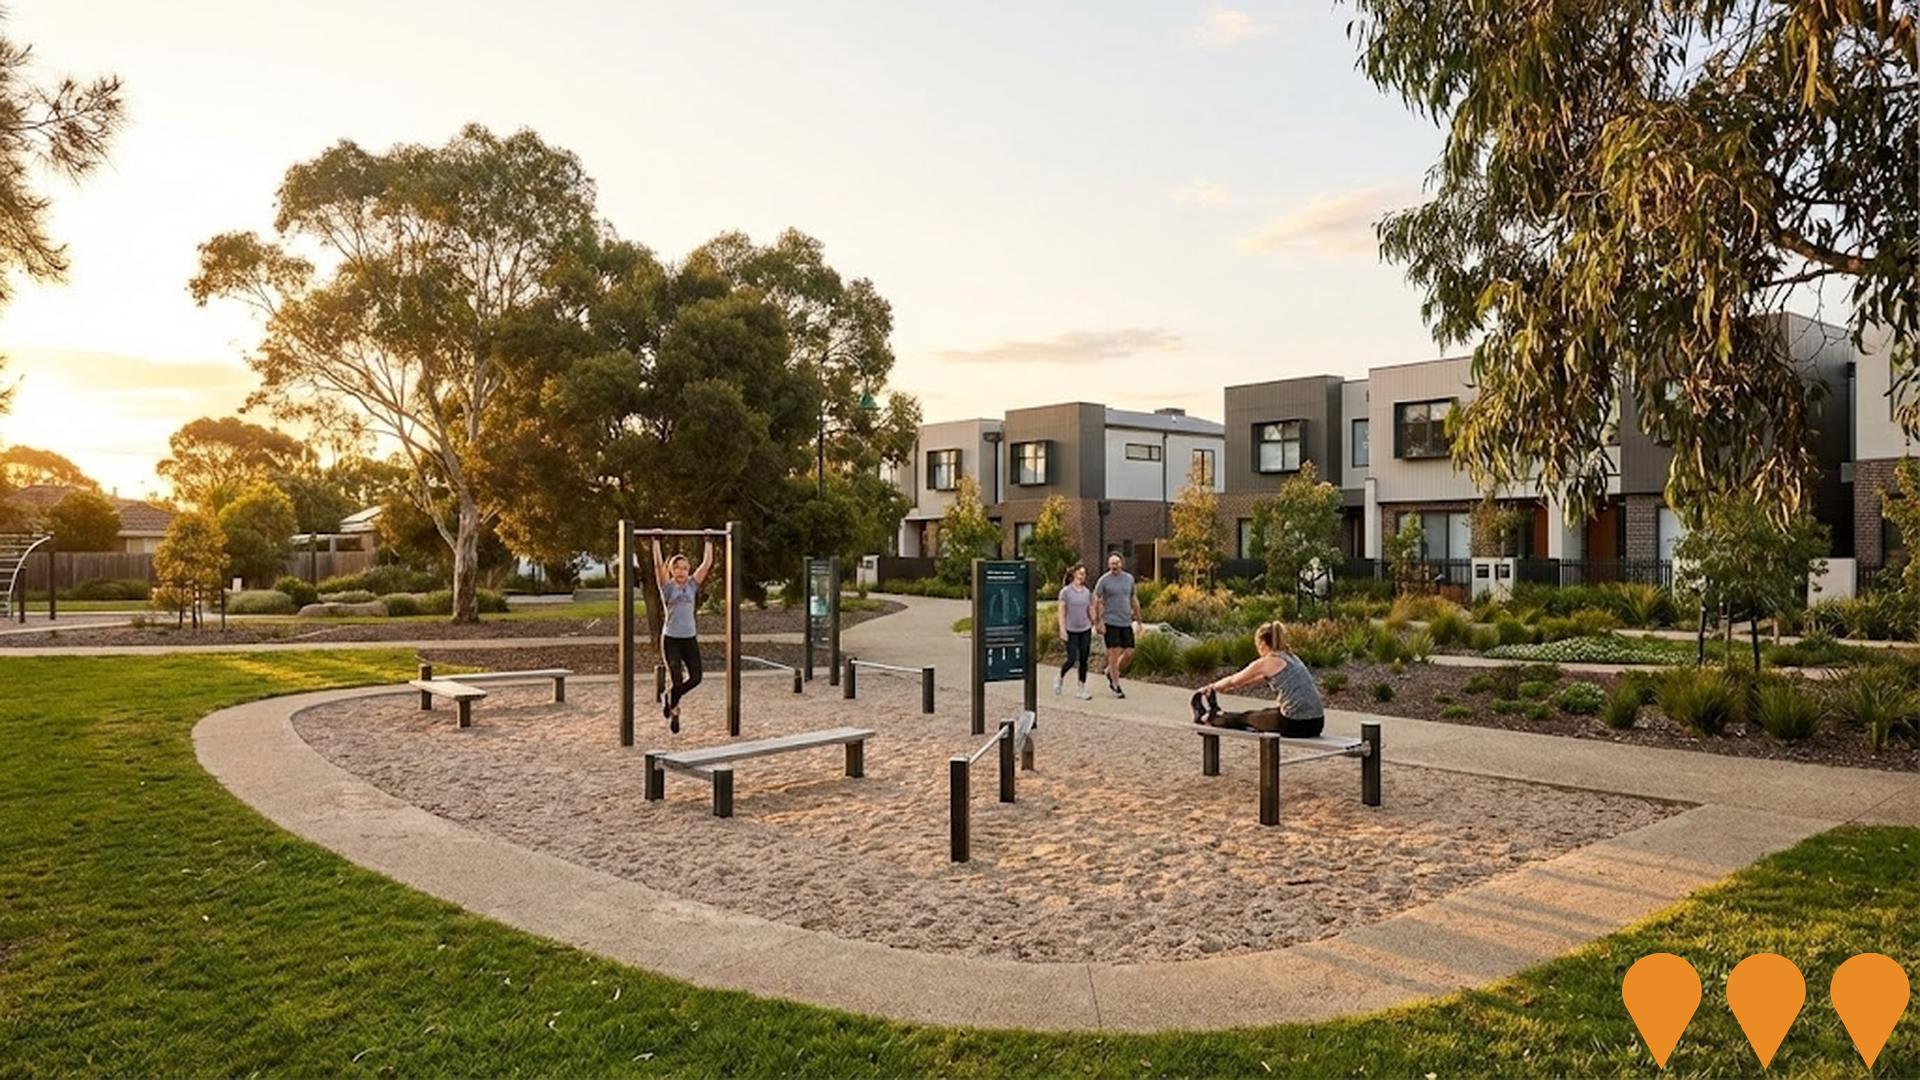
1 Victor Road Retirement Village
A four-storey purpose-built retirement village above a basement car park, containing 81 dwellings, situated in a Neighbourhood Residential Zone adjacent to the Yarra Yarra Golf Course. The development provides alternative housing choices for retirees in Bentleigh East, enabling locals to age in place within their community. The project features a highly integrated design response that references the emerging residential character in Victor Road.
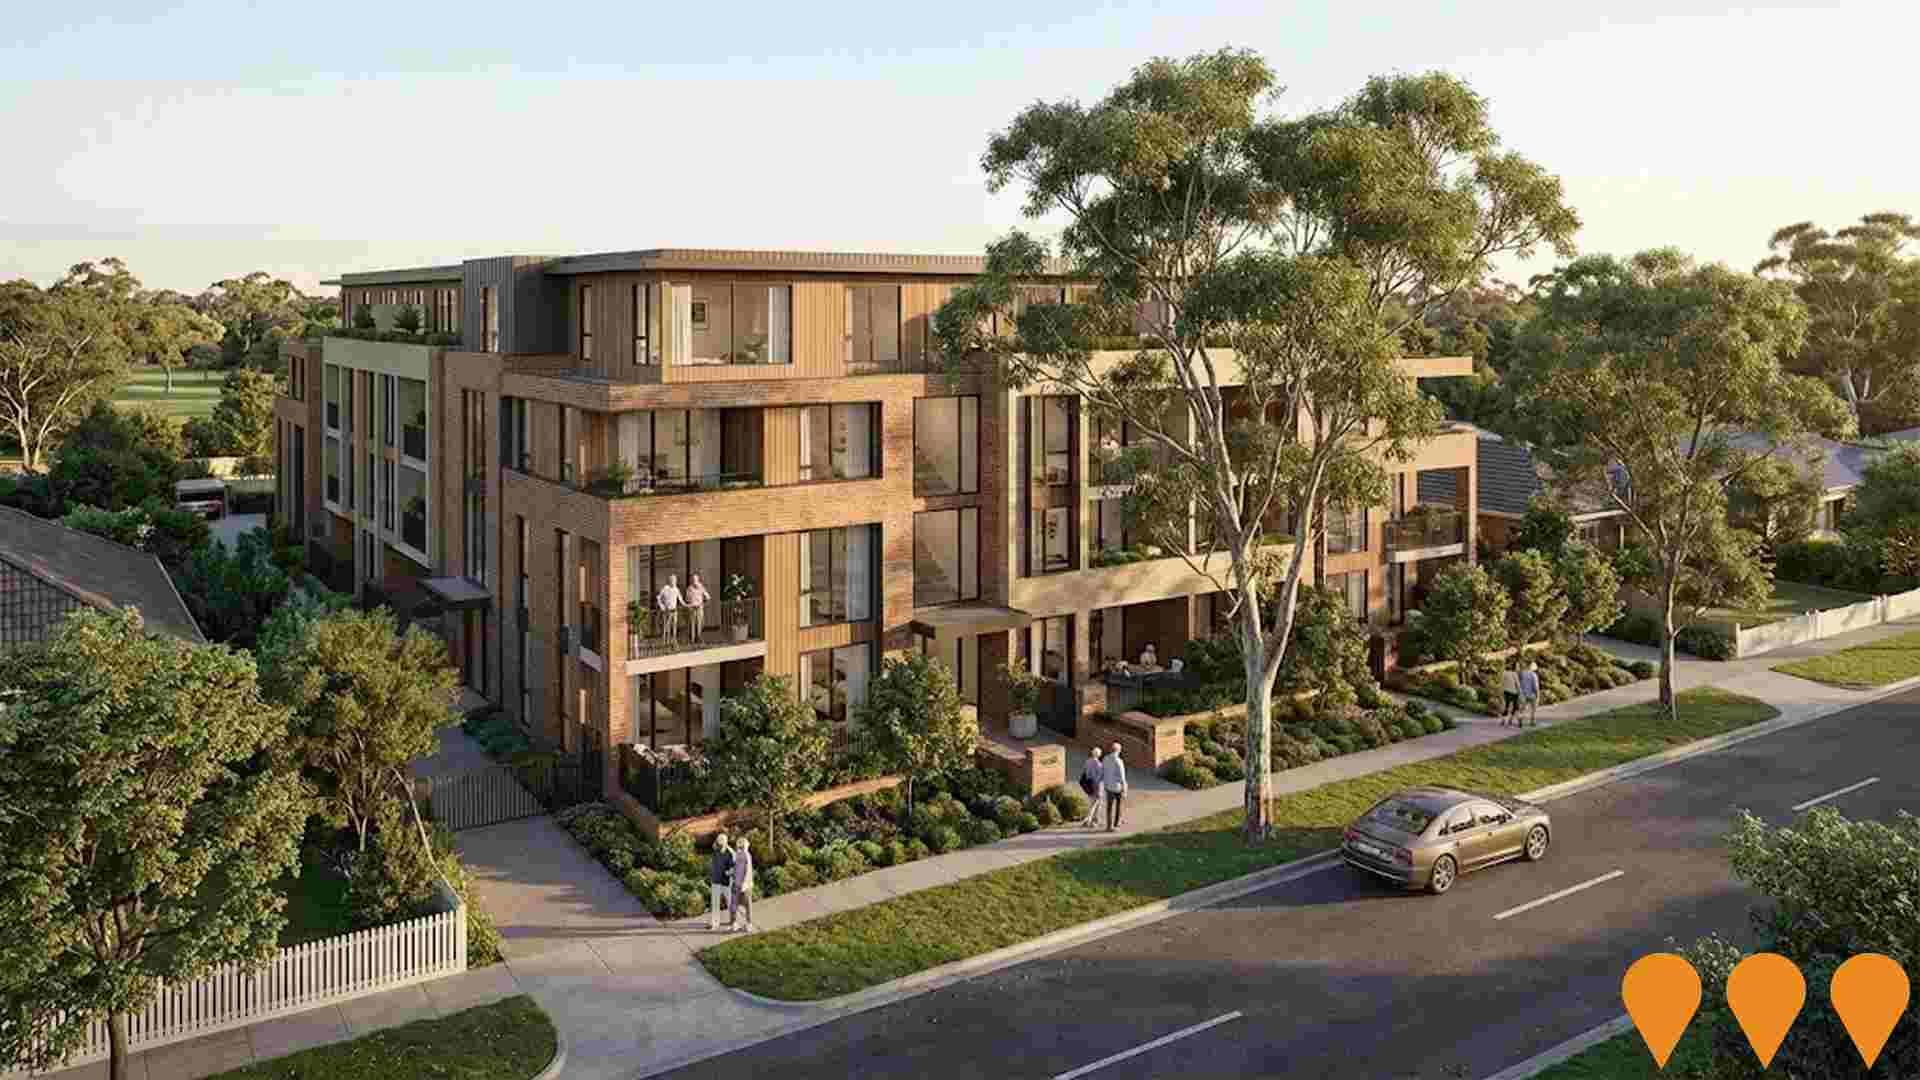
Aqualia by Mirvac
Aqualia by Mirvac is a premium collection of 3 and 4 bedroom townhomes in Bentleigh East. Completed in 2024, the project delivers high quality Mirvac design and construction, contemporary finishes, and landscaped communal open spaces close to established transport, schools and retail amenity.

Employment
Bentleigh East - South has seen below average employment performance when compared to national benchmarks
Bentleigh East - South has an educated workforce with professional services well represented, and an unemployment rate of 4.4% as of September 2025. There are 8,087 residents employed, with the unemployment rate at 0.3% below Greater Melbourne's rate of 4.7%.
Workforce participation is similar to Greater Melbourne at 66.6%. Key employment industries include health care & social assistance, professional & technical services, and retail trade. However, transport, postal & warehousing has lower representation than the regional average.
The area offers limited local employment opportunities based on Census data. Between September 2024 and September 2025, Bentleigh East - South's labour force increased by 0.7% while employment declined by 0.7%, causing unemployment to rise by 1.3 percentage points. In contrast, Greater Melbourne saw employment growth of 3.0%. State-level data from 25-Nov-25 shows Victoria's employment grew by 1.13% year-on-year, with an unemployment rate of 4.7%. National employment forecasts suggest a 6.6% increase over five years and 13.7% over ten years. Applying these projections to Bentleigh East - South's employment mix indicates local employment could grow by 6.8% in five years and 13.9% in ten years, assuming constant population projections.
Frequently Asked Questions - Employment
Income
Income metrics indicate excellent economic conditions, with the area achieving higher performance than 75% of national locations assessed by AreaSearch
AreaSearch's latest postcode level ATO data for financial year 2022 indicates that Bentleigh East - South SA2 had a median income among taxpayers of $60,365 and an average of $80,990. These figures are among the highest in Australia, with Greater Melbourne having a median of $54,892 and an average of $73,761. Based on Wage Price Index growth of 12.16% since financial year 2022, current estimates for Bentleigh East - South would be approximately $67,705 (median) and $90,838 (average) as of September 2025. Census 2021 income data shows that household, family and personal incomes in Bentleigh East - South cluster around the 73rd percentile nationally. Distribution data reveals that the $1,500 - $2,999 earnings band captures 28.7% of the community (4,243 individuals), similar to regional levels where this cohort represents 32.8%. Bentleigh East - South demonstrates considerable affluence with 35.0% earning over $3,000 per week, supporting premium retail and service offerings. High housing costs consume 16.0% of income, but strong earnings still place disposable income at the 76th percentile nationally. The area's SEIFA income ranking places it in the 9th decile.
Frequently Asked Questions - Income
Housing
Bentleigh East - South is characterized by a predominantly suburban housing profile, with above-average rates of outright home ownership
In Bentleigh East - South, as per the latest Census evaluation, 70.3% of dwellings were houses, with the remaining 29.7% consisting of semi-detached homes, apartments, and other types of dwellings. In contrast, Melbourne metropolitan area had 47.8% houses and 52.1% other dwellings. Home ownership in Bentleigh East - South stood at 36.6%, with mortgaged properties accounting for 40.1% and rented dwellings making up 23.3%. The median monthly mortgage repayment in the area was $2,512, exceeding Melbourne metro's average of $2,396. The median weekly rent figure in Bentleigh East - South was recorded at $490, compared to Melbourne metro's $435. Nationally, Bentleigh East - South's mortgage repayments were significantly higher than the Australian average of $1,863, with rents substantially above the national figure of $375.
Frequently Asked Questions - Housing
Household Composition
Bentleigh East - South has a typical household mix, with a higher-than-average median household size
Family households account for 76.0% of all households, including 40.1% couples with children, 23.9% couples without children, and 10.9% single parent families. Non-family households constitute the remaining 24.0%, with lone person households at 21.8% and group households comprising 2.2% of the total. The median household size is 2.6 people, larger than the Greater Melbourne average of 2.5.
Frequently Asked Questions - Households
Local Schools & Education
Bentleigh East - South shows strong educational performance, ranking in the upper quartile nationally when assessed across multiple qualification and achievement indicators
The area's university qualification rate is 40.4%, significantly lower than the SA3 area average of 50.6%. Bachelor degrees are most common at 26.5%, followed by postgraduate qualifications (10.2%) and graduate diplomas (3.7%). Vocational credentials are prevalent, with 26.4% of residents aged 15+ holding them, including advanced diplomas (11.4%) and certificates (15.0%). Educational participation is high, with 28.4% currently enrolled in formal education.
This includes 9.9% in primary, 7.6% in secondary, and 5.1% in tertiary education.
Frequently Asked Questions - Education
Schools Detail
Nearby Services & Amenities
Transport
Transport servicing is good compared to other areas nationally based on assessment of service frequency, route connectivity and accessibility
Bentleigh East - South has 82 active public transport stops, all of which are bus stops. These stops are served by 13 different routes that collectively facilitate 3,658 weekly passenger trips. Residents enjoy excellent transport accessibility, with an average distance of 148 meters to the nearest stop.
The service frequency is 522 trips per day across all routes, which translates to approximately 44 weekly trips per individual stop.
Frequently Asked Questions - Transport
Transport Stops Detail
Health
The level of general health in Bentleigh East - South is notably higher than the national average with prevalence of common health conditions low among the general population though higher than the nation's average across older, at risk cohorts
Bentleigh East - South shows better-than-average health outcomes, with lower prevalence of common conditions among its general population compared to national averages. However, older and at-risk cohorts have a higher prevalence.
Private health cover is exceptionally high, at approximately 60% (8,842 people), compared to Greater Melbourne's 65.2%. The most prevalent medical conditions are arthritis and mental health issues, affecting 6.5% and 6.4% of residents respectively. 73.4% of residents report no medical ailments, slightly lower than Greater Melbourne's 74.0%. The area has a higher proportion of residents aged 65 and over, at 17.9% (2,648 people), compared to Greater Melbourne's 16.8%.
Frequently Asked Questions - Health
Cultural Diversity
Bentleigh East - South was found to be more culturally diverse than the vast majority of local markets in Australia, upon assessment of a range of language and cultural background related metrics
Bentleigh East-South has high cultural diversity with 34.2% overseas-born population and 30.7% speaking non-English languages at home. Christianity is the main religion, at 46.5%. Judaism is lower than Melbourne average at 9.2%.
Top ancestry groups are Australian (19.0%), English (18.6%), and Other (12.3%). Russian (2.1% vs 2.2%), Polish (1.8% vs 3.1%), and Greek (6.5% vs 4.6%) have notable divergences in representation.
Frequently Asked Questions - Diversity
Age
Bentleigh East - South's population is slightly older than the national pattern
Bentleigh East - South has a median age of 40, which is slightly higher than Greater Melbourne's figure of 37 and Australia's national average of 38 years. The 45-54 age group is notably over-represented in Bentleigh East - South at 14.5%, compared to the Greater Melbourne average. Meanwhile, the 25-34 year-olds are under-represented at 10.1%. Between 2021 and present, the 15 to 24 age group has increased from 10.7% to 11.7% of the population, while the 25 to 34 cohort has decreased from 10.9% to 10.1%. By 2041, demographic modeling projects significant changes in Bentleigh East - South's age profile. The 45 to 54 age group is projected to expand by 596 people (28%), growing from 2,138 to 2,735. Conversely, the 0 to 4 cohort is expected to grow modestly by 5%.

