Chart Color Schemes
est. as @ -- *
ABS ERP | -- people | --
2021 Census | -- people
Sales Activity
Curious about local property values? Filter the chart to assess the volume and appreciation (including resales) trends and regional comparisons, or scroll to the map below view this information at an individual property level.
Find a Recent Sale
Sales Detail
Population
Cherrybrook is positioned among the lower quartile of areas assessed nationally for population growth based on AreaSearch's assessment of recent, and medium term trends
Cherrybrook's population was 18,948 as of November 2025. This showed a decrease of 134 people from the 2021 Census total of 19,082. The population change was inferred from ABS estimated resident population figures and validated new addresses since the Census date. The population density was 2,296 persons per square kilometer, higher than the average across national locations assessed by AreaSearch. Overseas migration primarily drove population growth in the area during recent periods.
AreaSearch uses ABS/Geoscience Australia projections for each SA2 area, released in 2024 with a base year of 2022. For areas not covered, NSW State Government's SA2 level projections are used, released in 2022 with a base year of 2021. Growth rates by age group are applied to all areas for years 2032 to 2041. Future demographic trends suggest lower quartile growth nationally, with Cherrybrook expected to grow by 56 persons to 2041 based on the latest annual ERP population numbers, reflecting a gain of 0.3% over the 17-year period.
Frequently Asked Questions - Population
Development
The level of residential development activity in Cherrybrook is very low in comparison to the average area assessed nationally by AreaSearch
Cherrybrook has seen approximately 15 new homes approved annually. Over the past five financial years, from FY21 to FY25, around 75 homes were approved, with an additional 5 approved so far in FY26. The population decline in recent years suggests that new supply has likely been meeting demand, providing good choices for buyers.
New properties are constructed at an average value of $1,025,000, indicating a focus on the premium market by developers. In FY26, $6.5 million worth of commercial approvals have been registered, reflecting the residential character of the area. Compared to Greater Sydney, Cherrybrook has significantly less development activity, at 92.0% below the regional average per person. This constrained new construction typically reinforces demand and pricing for existing dwellings. Similarly, development activity is lower than the national average, suggesting market maturity and possible development constraints.
New building activity consists of 93.0% detached houses and 7.0% medium to high-density housing, maintaining Cherrybrook's suburban identity with a concentration of family homes suited to buyers seeking space. With around 1224 people per dwelling approval, Cherrybrook reflects a highly mature market. According to the latest AreaSearch quarterly estimate, Cherrybrook is projected to gain 56 residents by 2041. Based on current development patterns, new housing supply should readily meet demand, offering good conditions for buyers and potentially facilitating population growth beyond current projections.
Frequently Asked Questions - Development
Infrastructure
Cherrybrook has strong levels of nearby infrastructure activity, ranking in the top 40% nationally
Changes to local infrastructure significantly impact an area's performance. AreaSearch has identified 15 projects likely to affect the area. Notable projects include Highforest by Mirvac, New Line Road Upgrade, West Pennant Hills Large Development Site (88 hectares), and Cherrybrook Precinct Rezoning Proposal. The following list details those most relevant.
Professional plan users can use the search below to filter and access additional projects.
INFRASTRUCTURE SEARCH
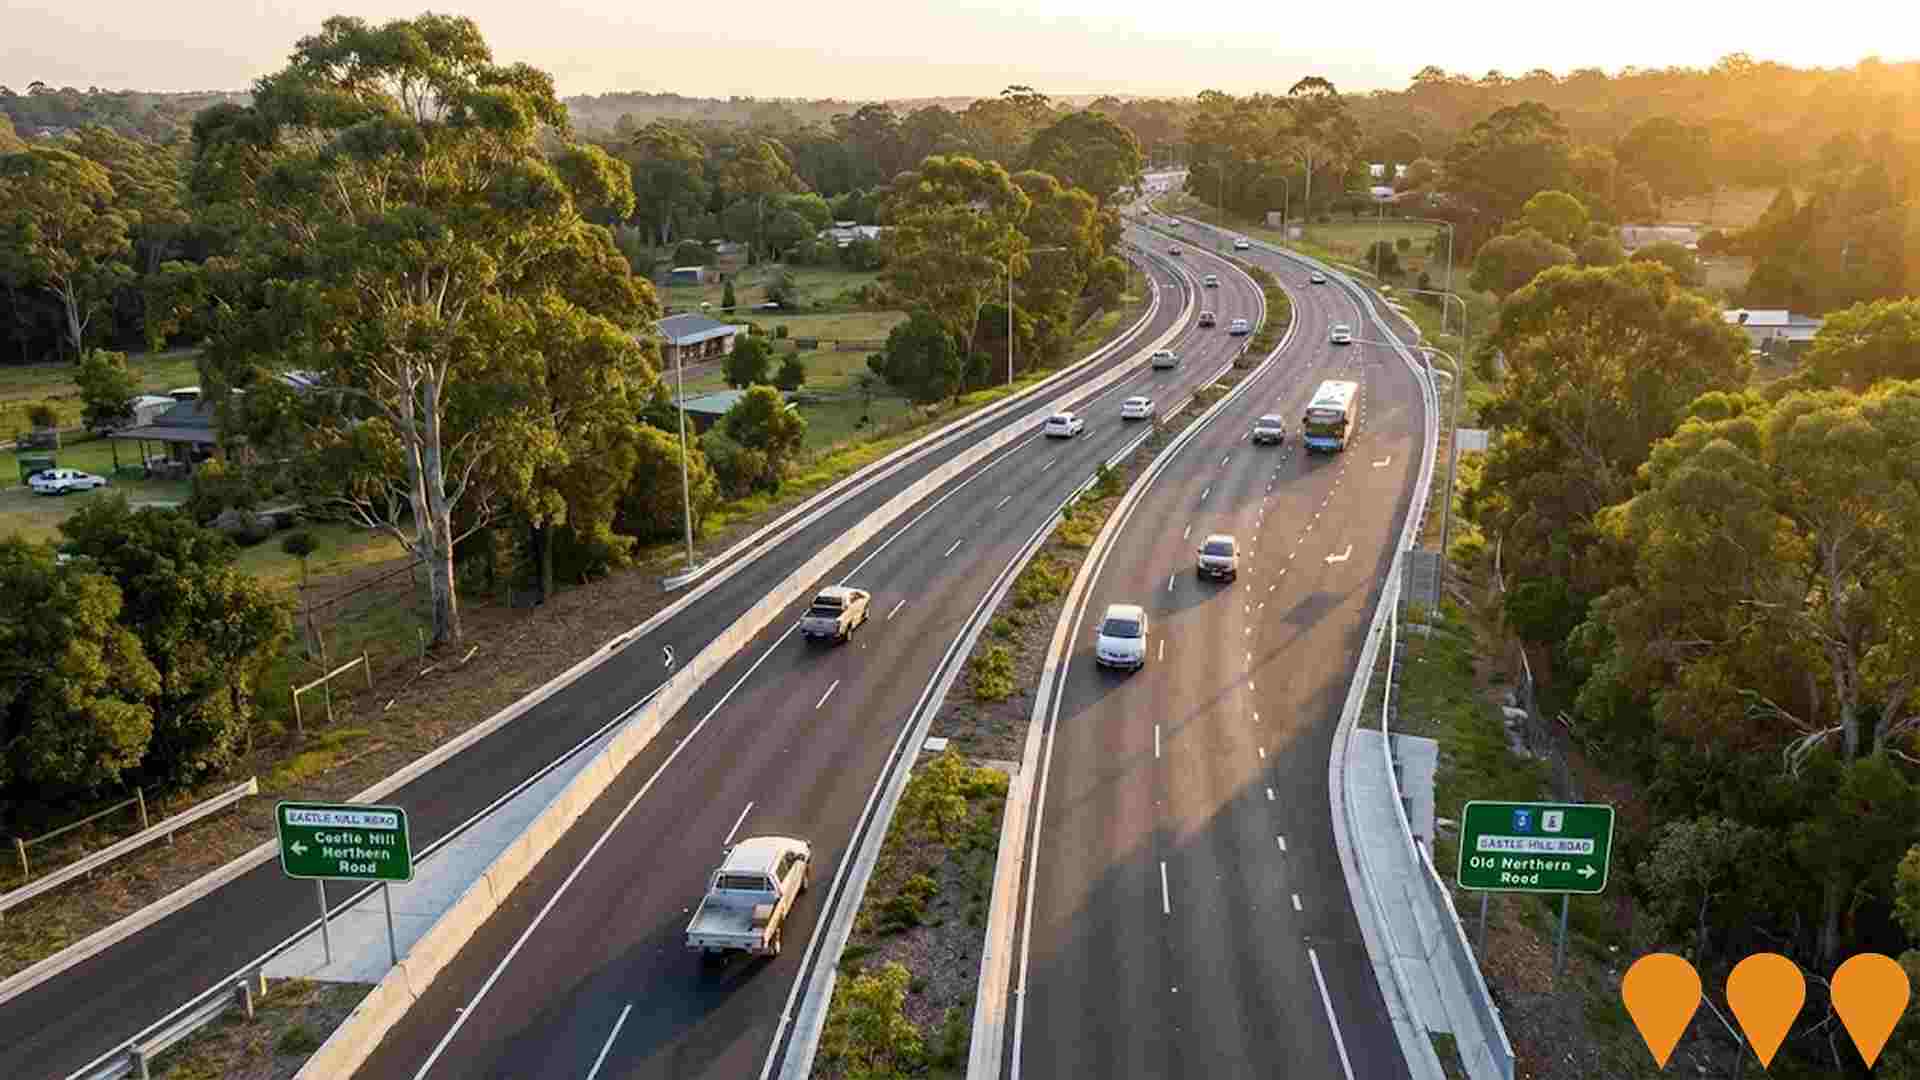
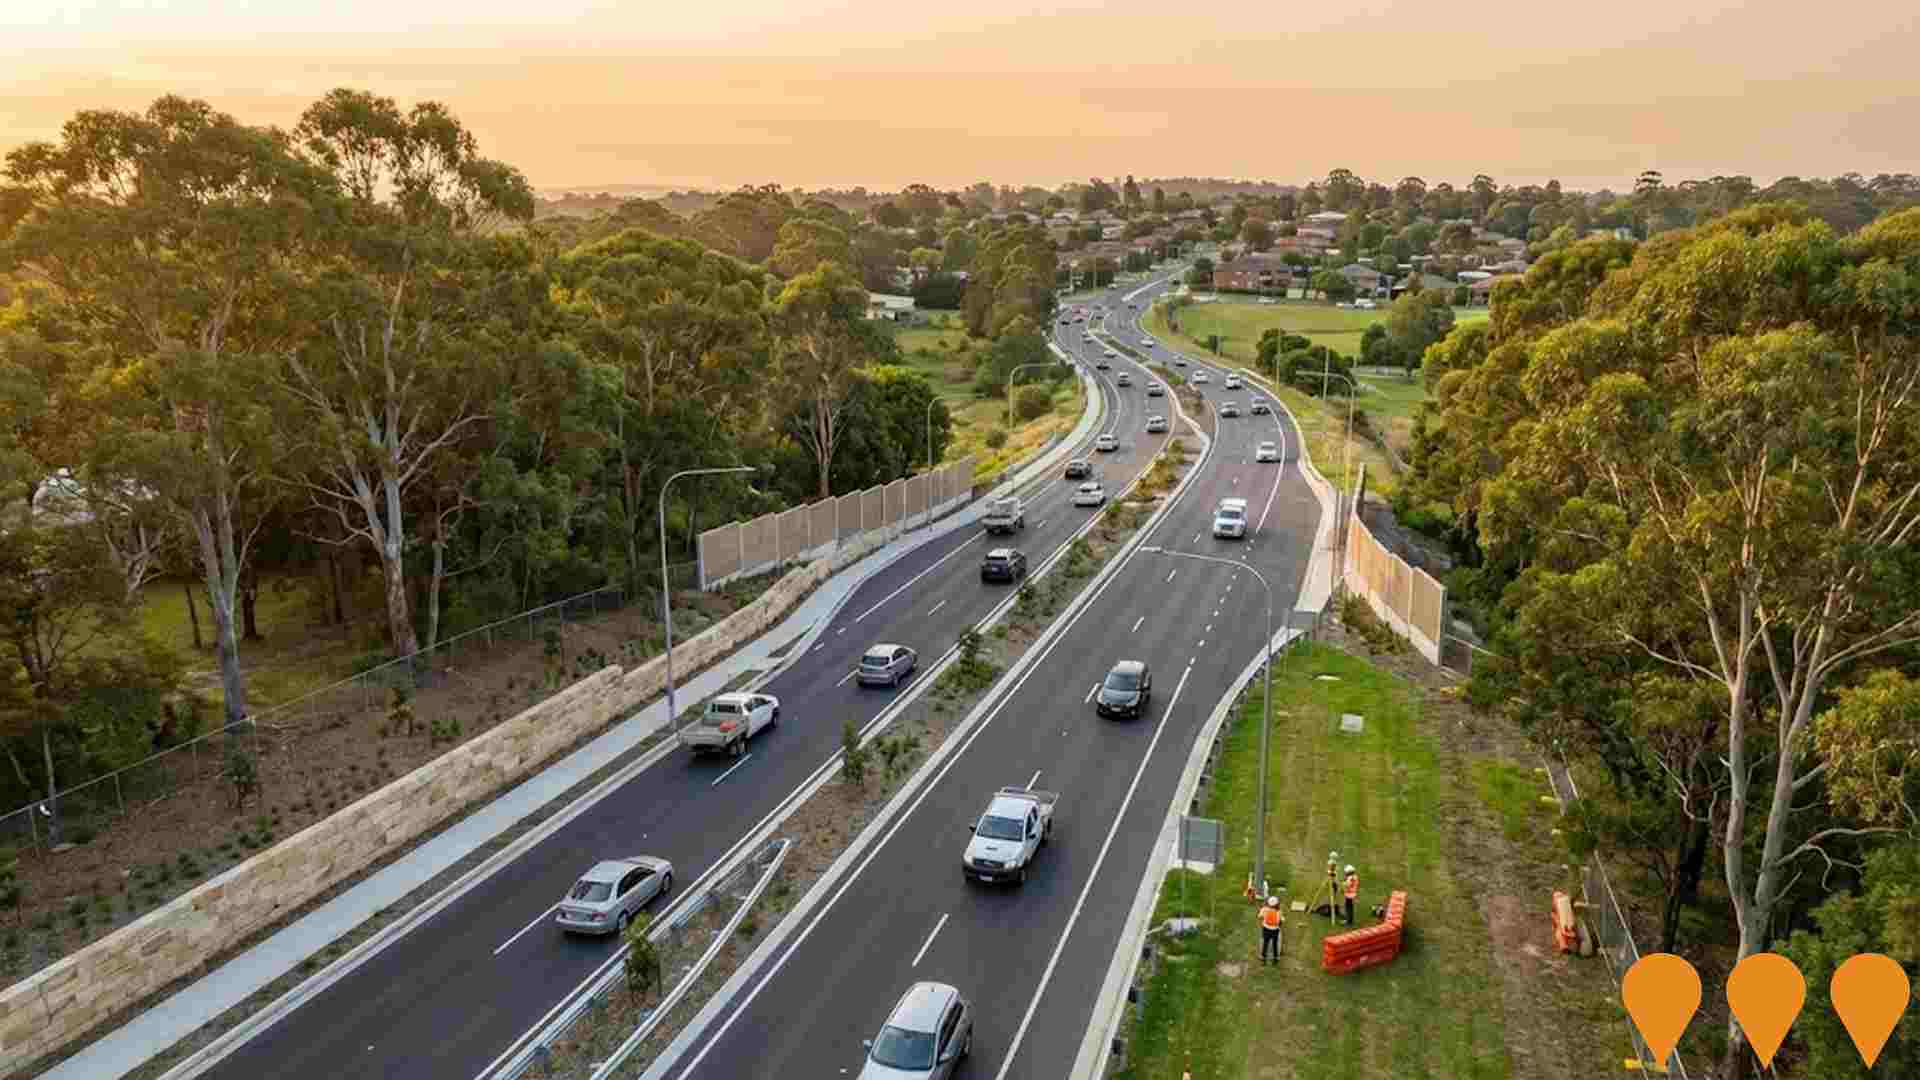
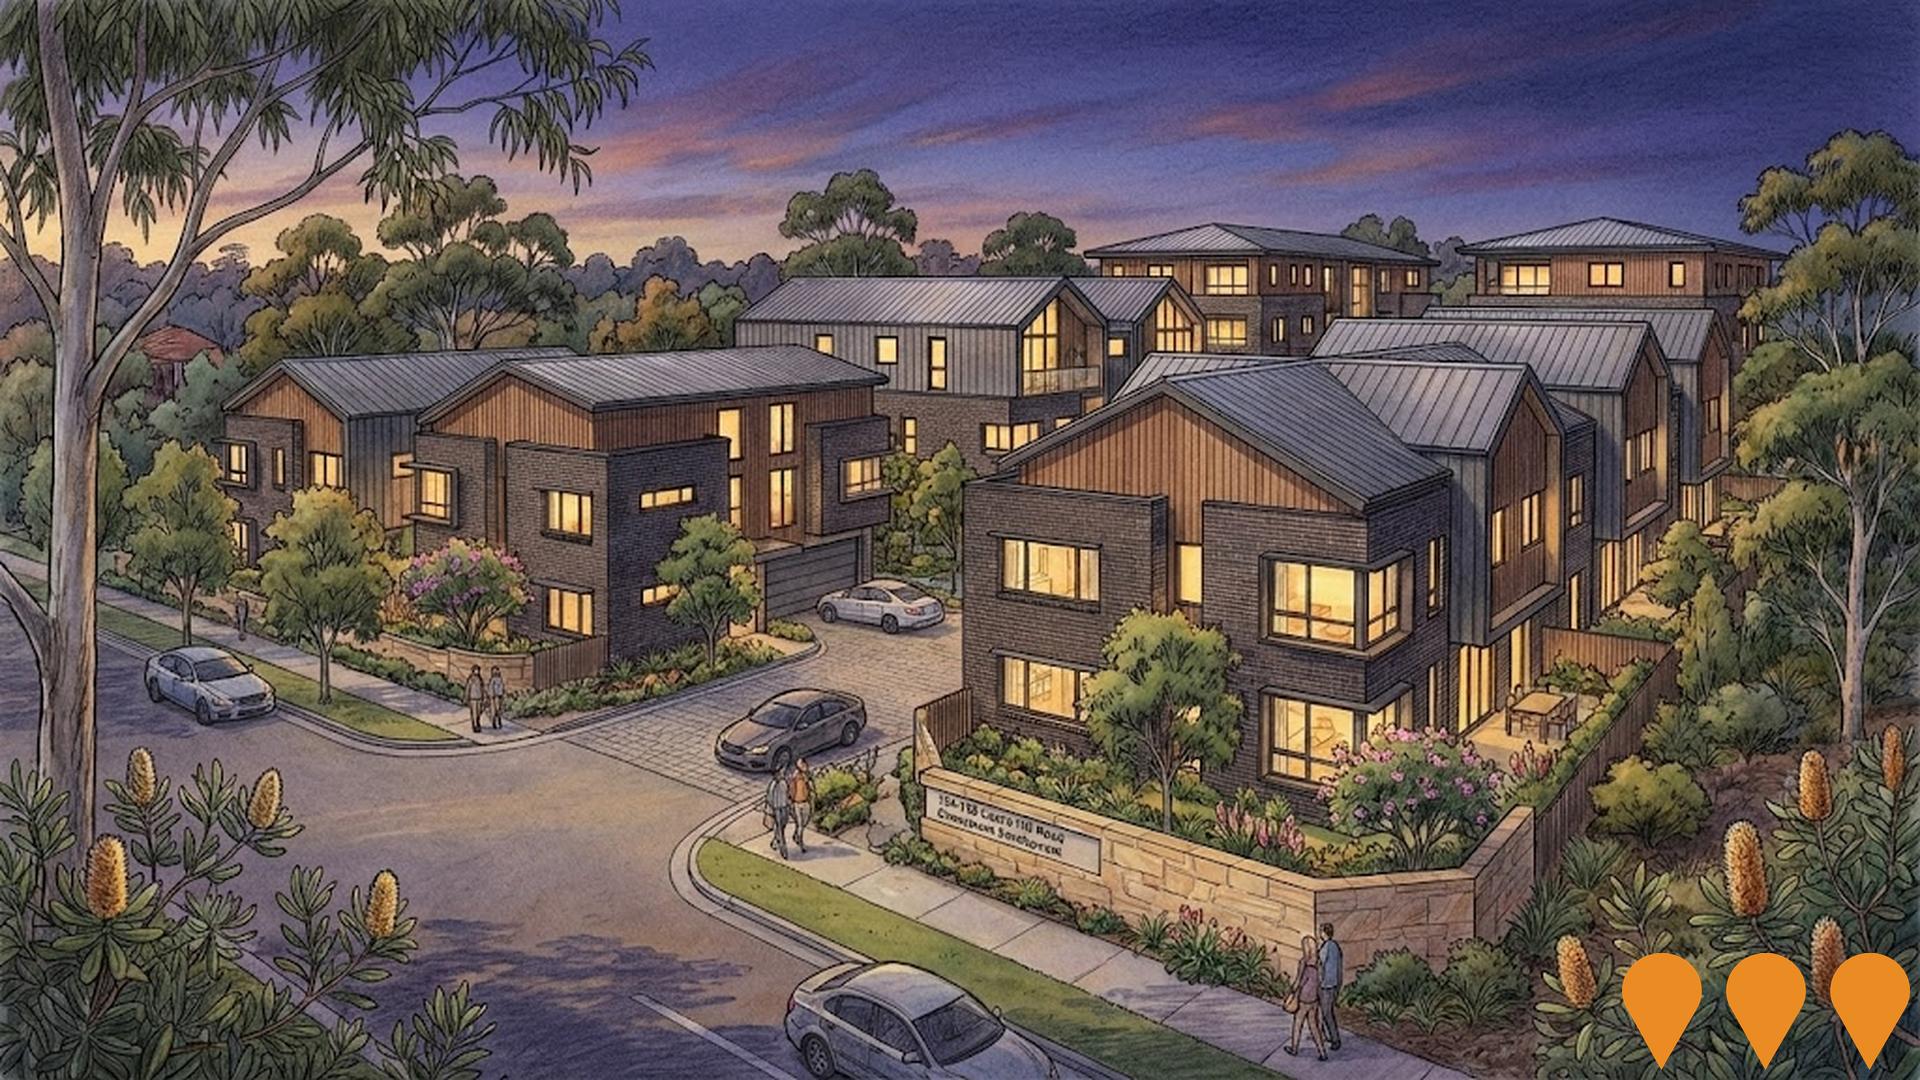
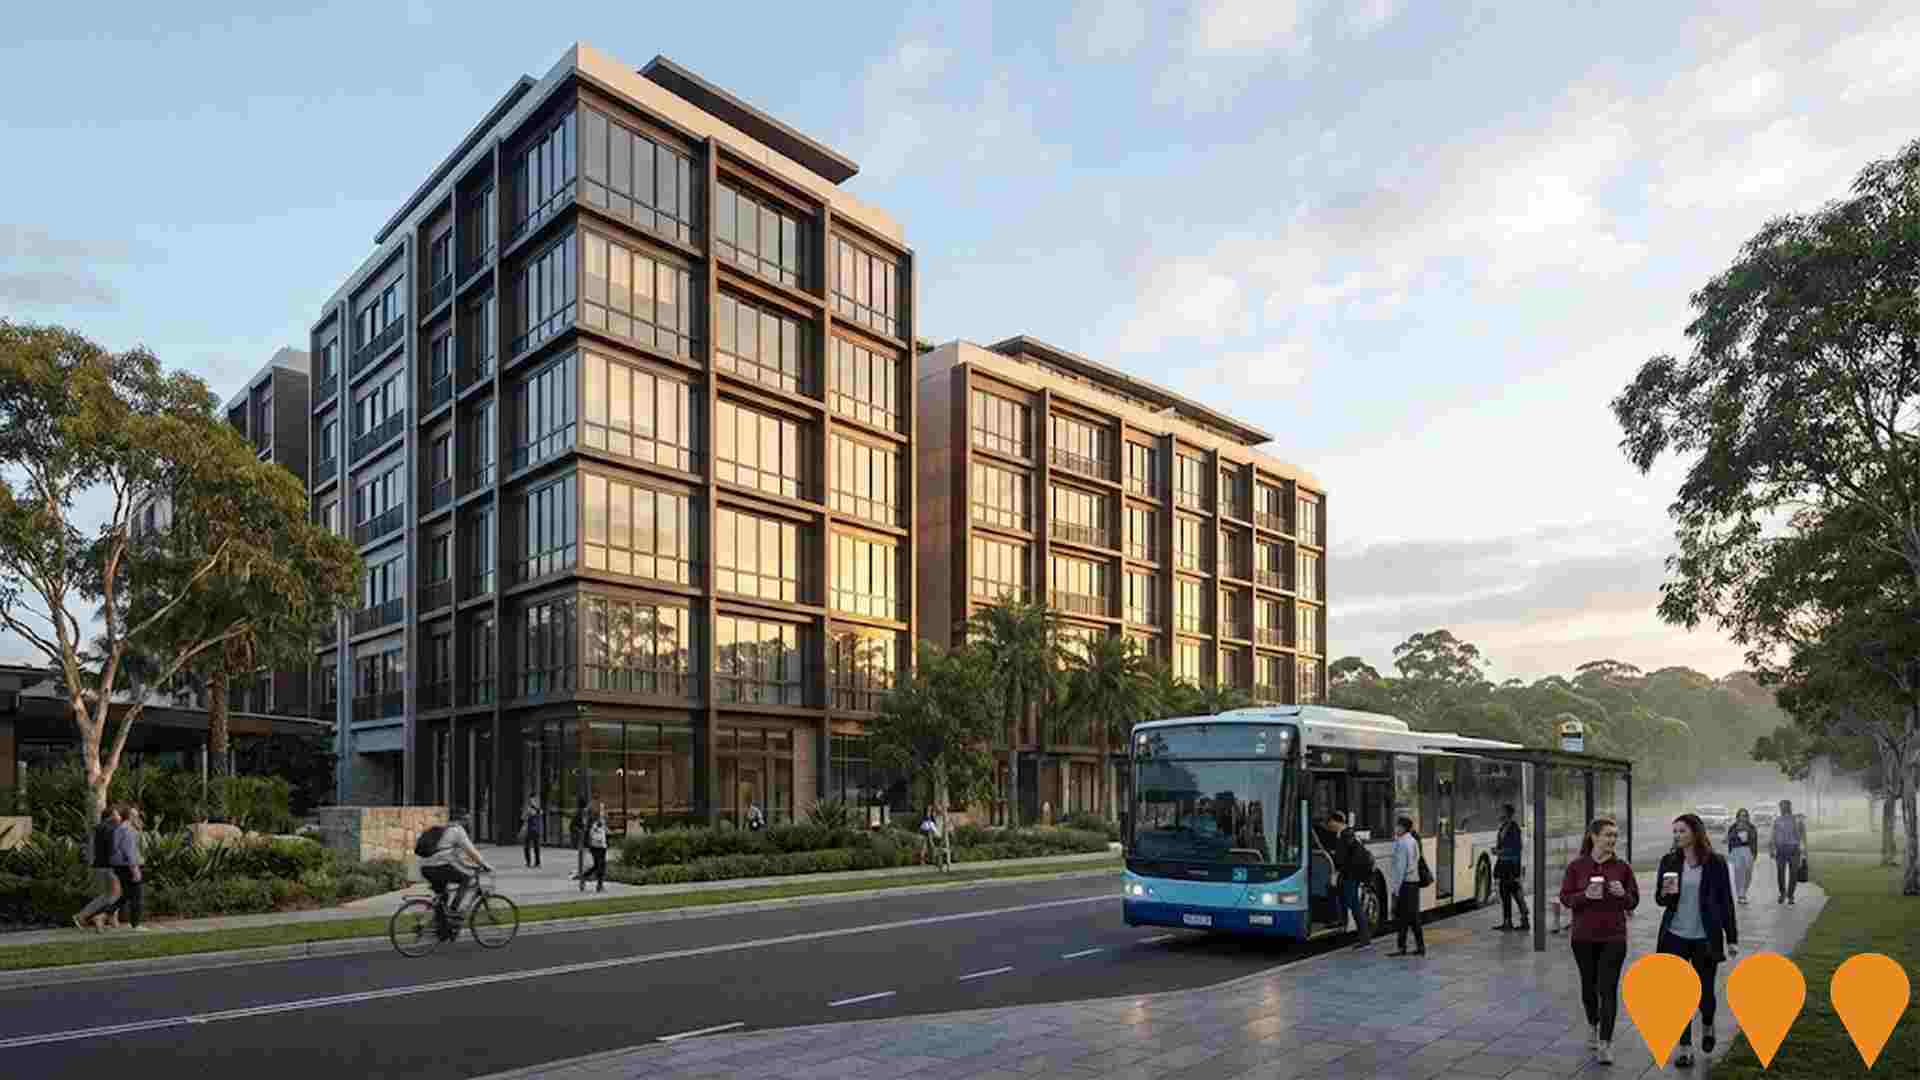
 Denotes AI-based impression for illustrative purposes only, not to be taken as definitive under any circumstances. Please follow links and conduct other investigations from the project's source for actual imagery. Developers and project owners wishing us to use original imagery please Contact Us and we will do so.
Frequently Asked Questions - Infrastructure
Sydney Metro Northwest
Australia's first fully automated metro rail system and the first stage of Sydney Metro. The 36 km line runs from Tallawong (Rouse Hill) to Chatswood with 13 stations (8 new stations plus the converted Epping to Chatswood rail link). Opened 26 May 2019 with turn-up-and-go services every 4 minutes in peak, platform screen doors and driverless trains. The line has carried over 150 million passenger journeys and now forms part of the extended Sydney Metro network.
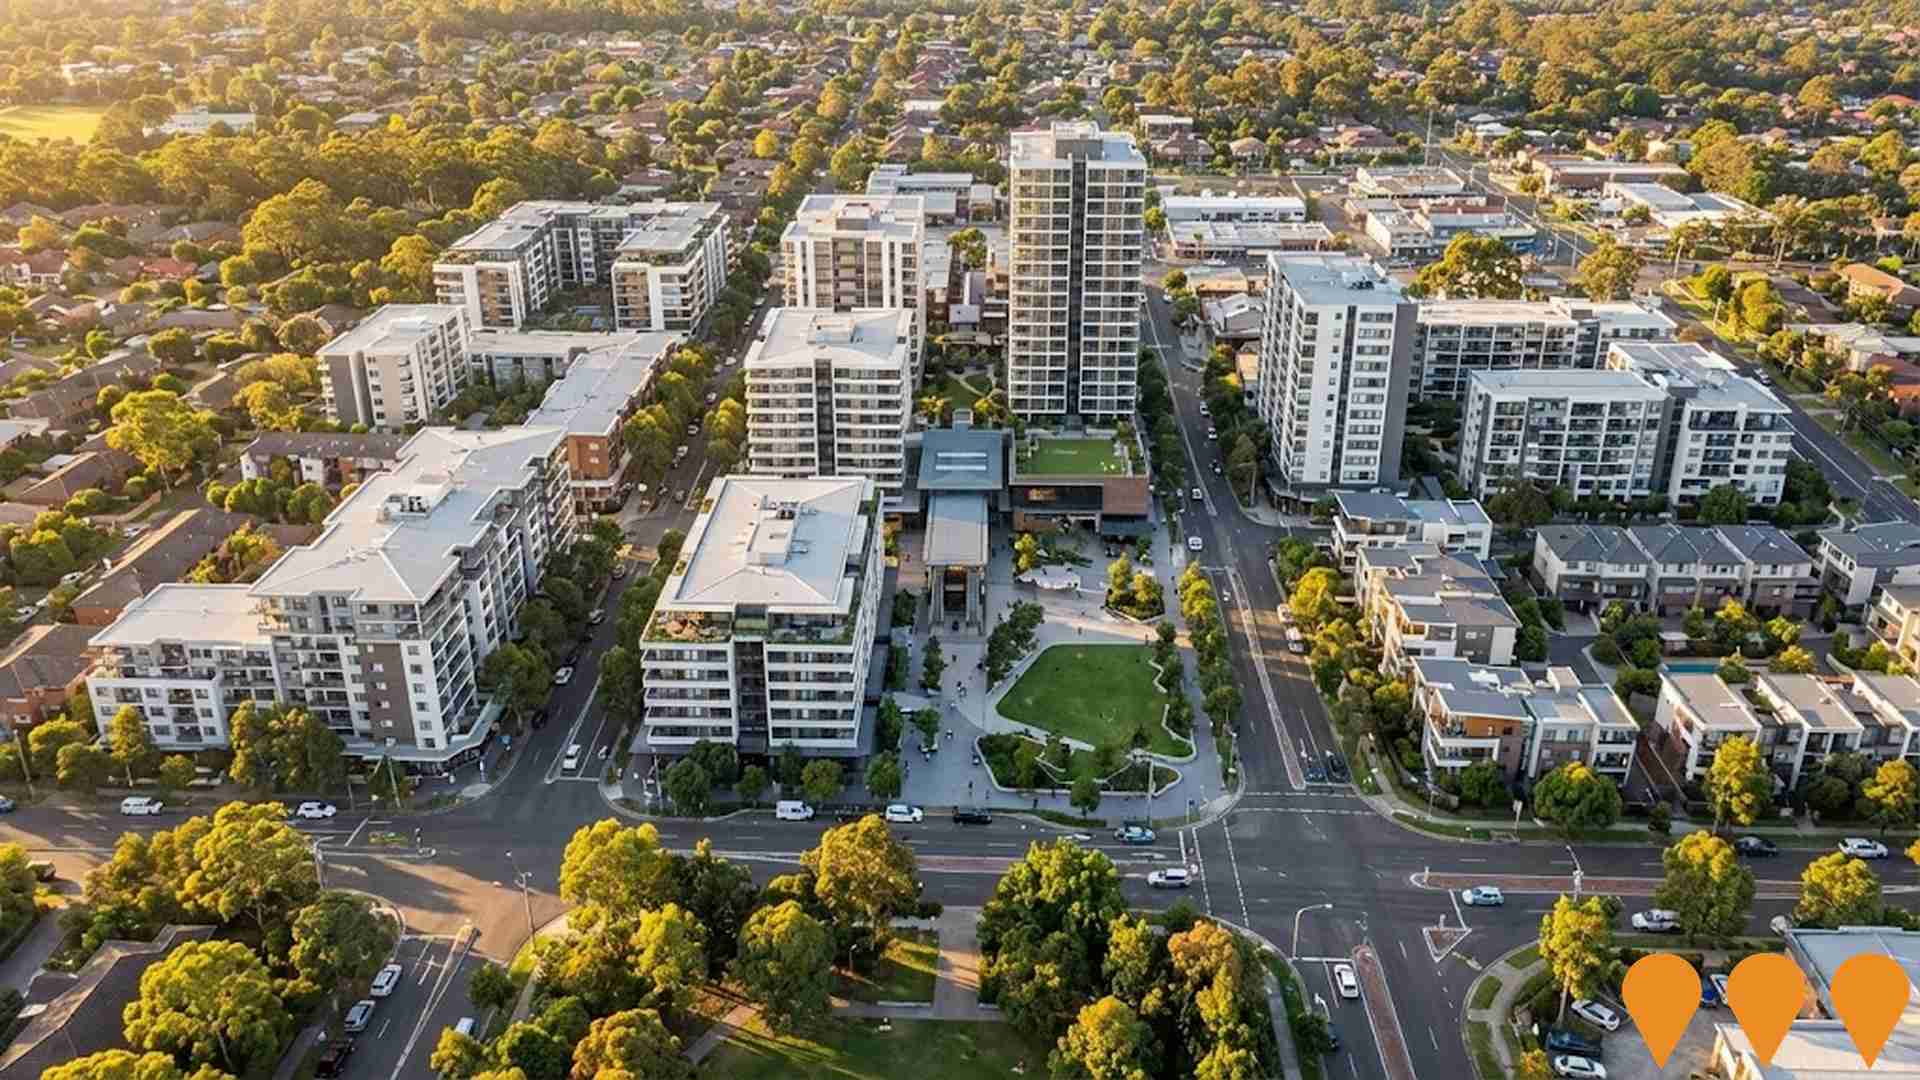
Cherrybrook Precinct Rezoning Proposal
State-led rezoning proposal for the broader Cherrybrook Precinct to create a new town centre and walkable urban community near the Metro station. The plan provides total capacity for up to 9,350 new homes, up to 28-storey maximum building heights, 4.5 hectares of new public open space, and includes mandatory affordable housing (5-10%).
Cherrybrook Village Shopping Centre
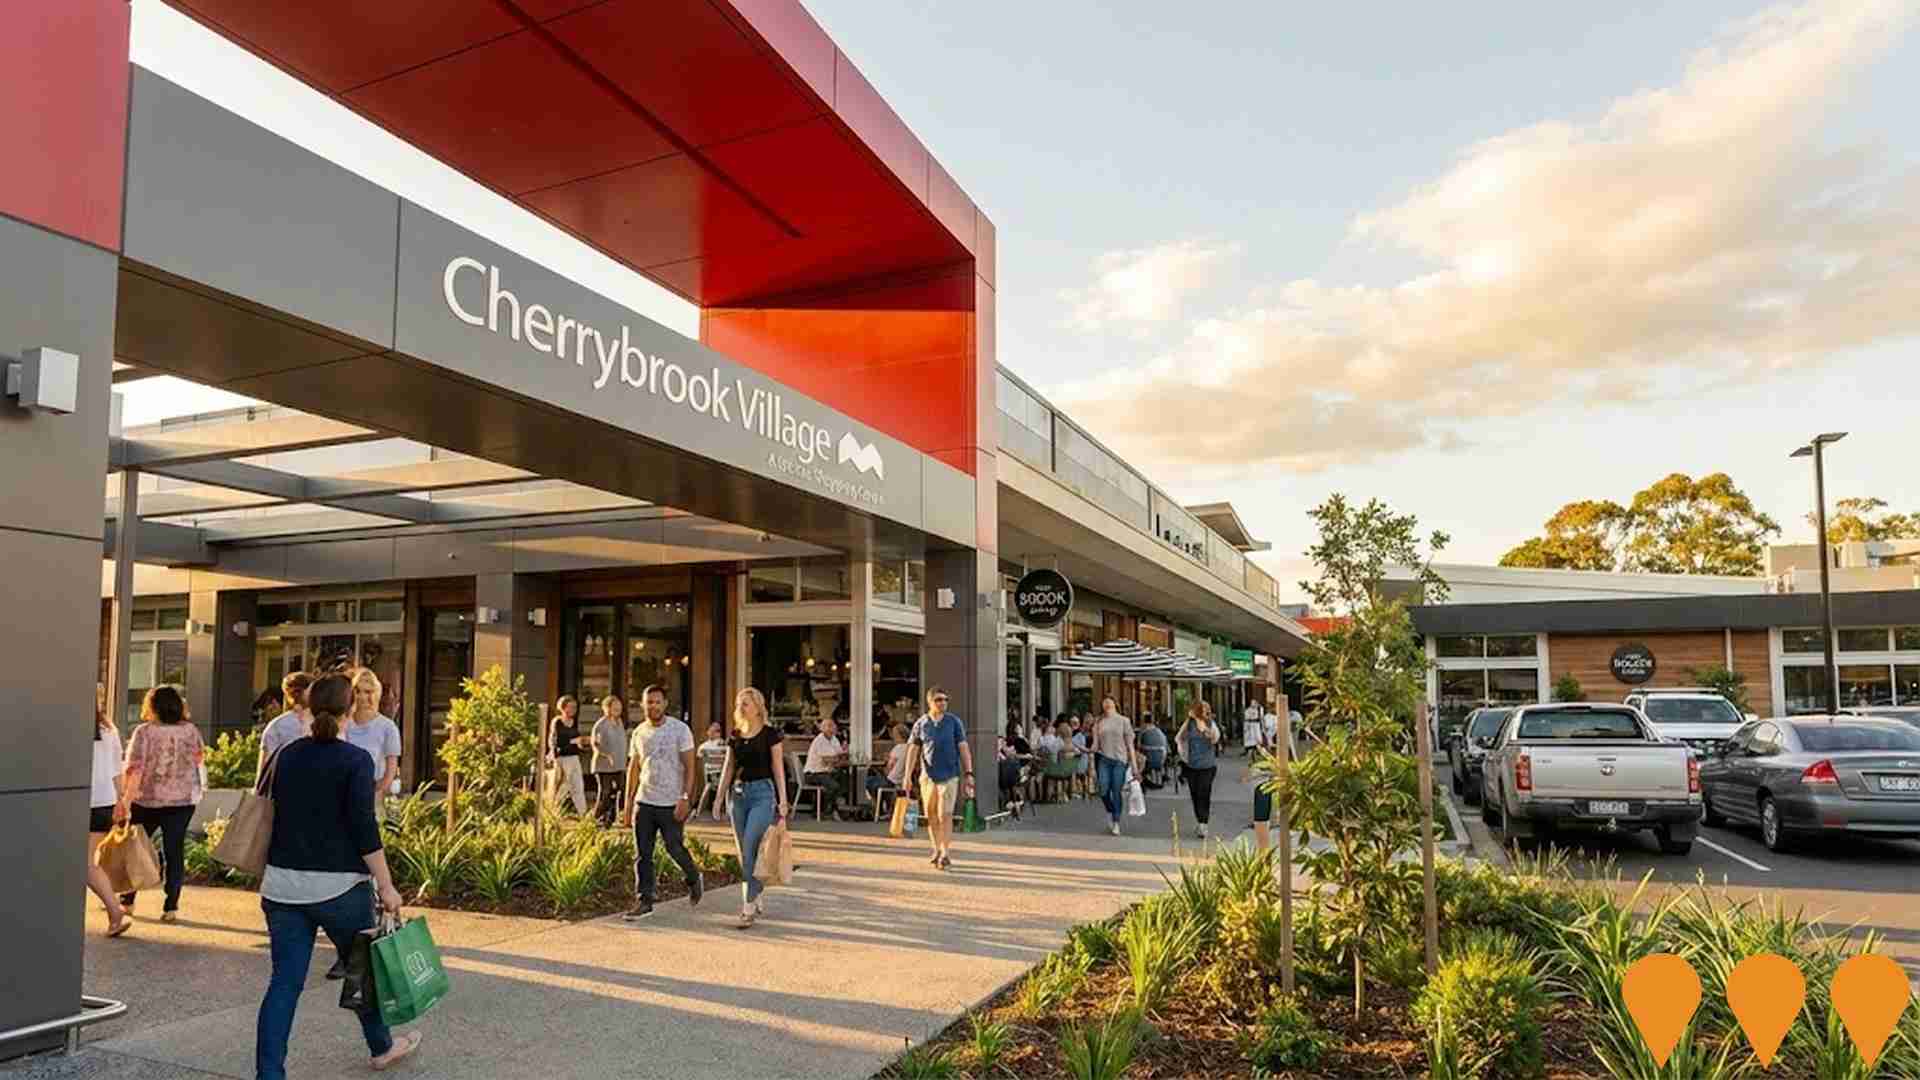
Redevelopment and refurbishment of the existing Cherrybrook Village neighbourhood shopping centre. The original large-scale expansion proposal was approved but ultimately not pursued. Instead, a more modest renovation and reconfiguration of the centre and car park was completed in 2023-2024, delivering refreshed retail tenancies, improved parking and enhanced community amenities.
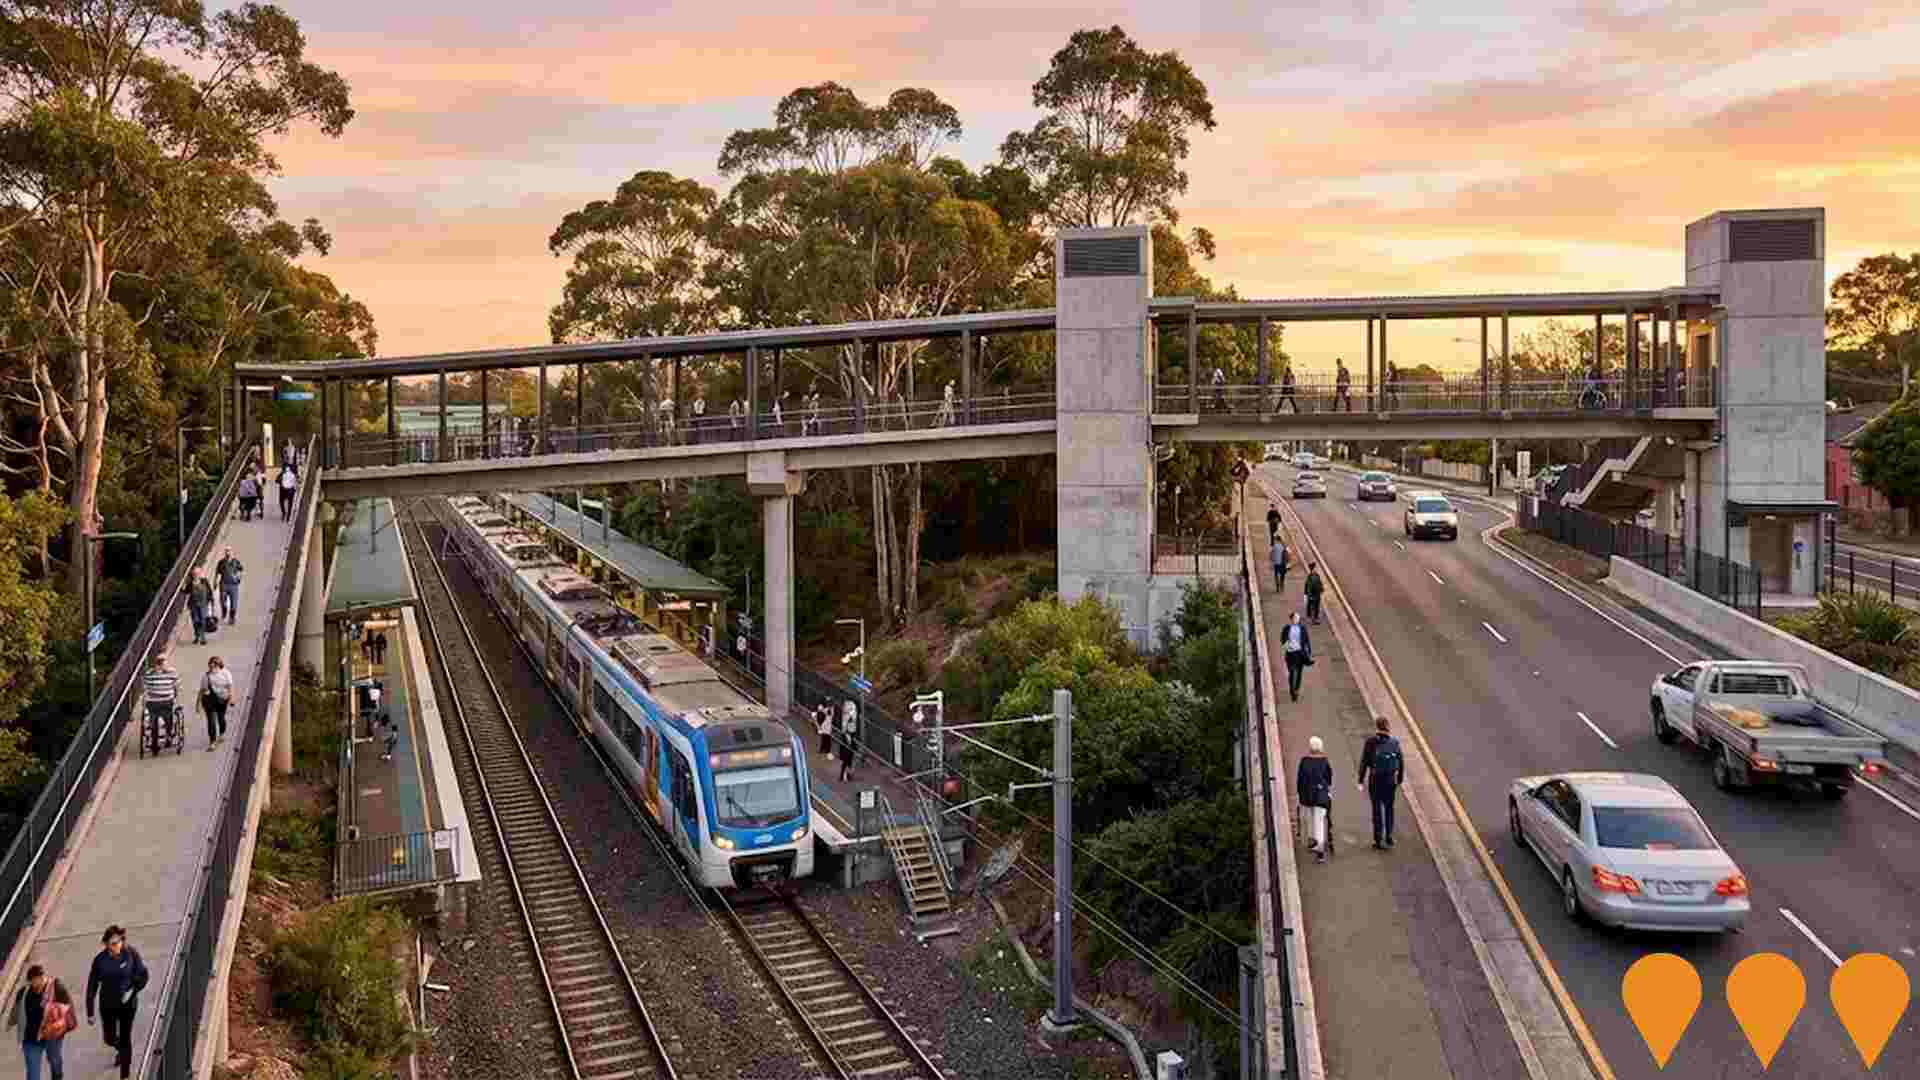
Cherrybrook Metro Station (Completed Infrastructure)
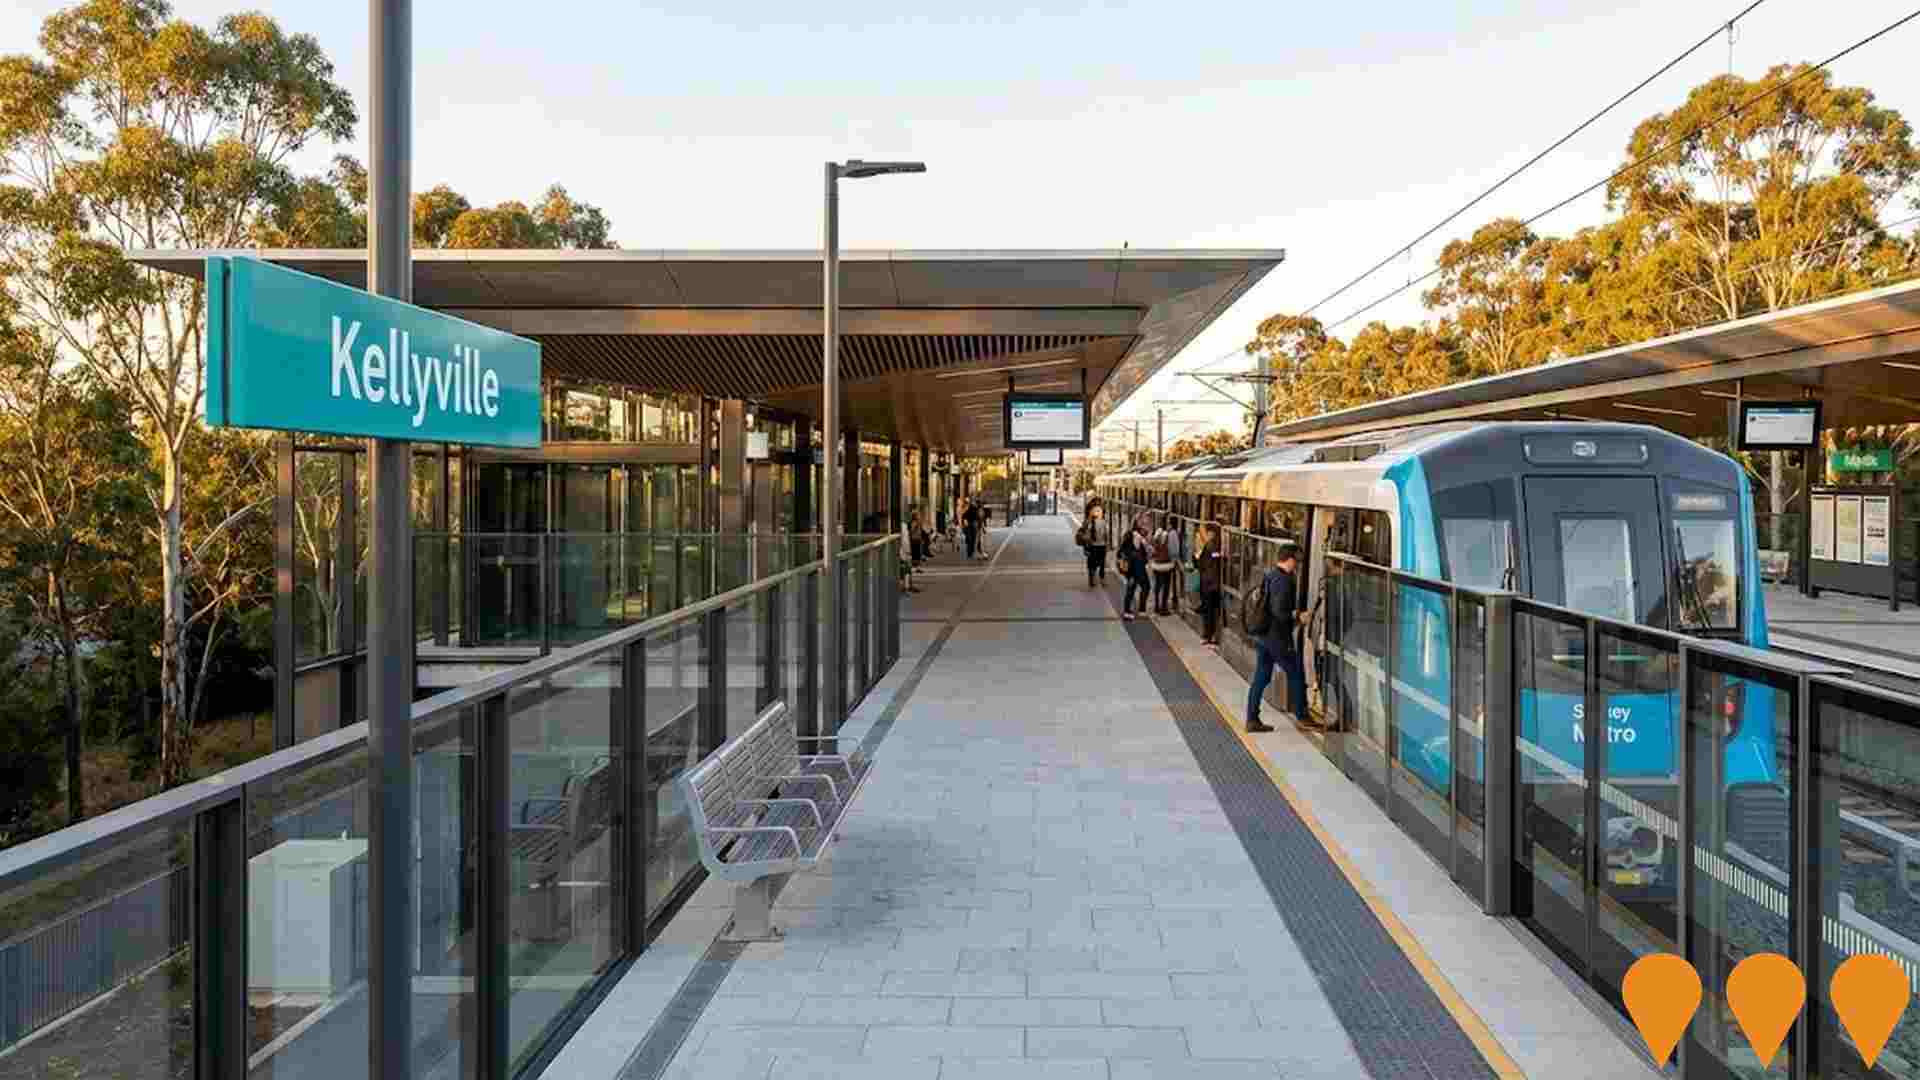
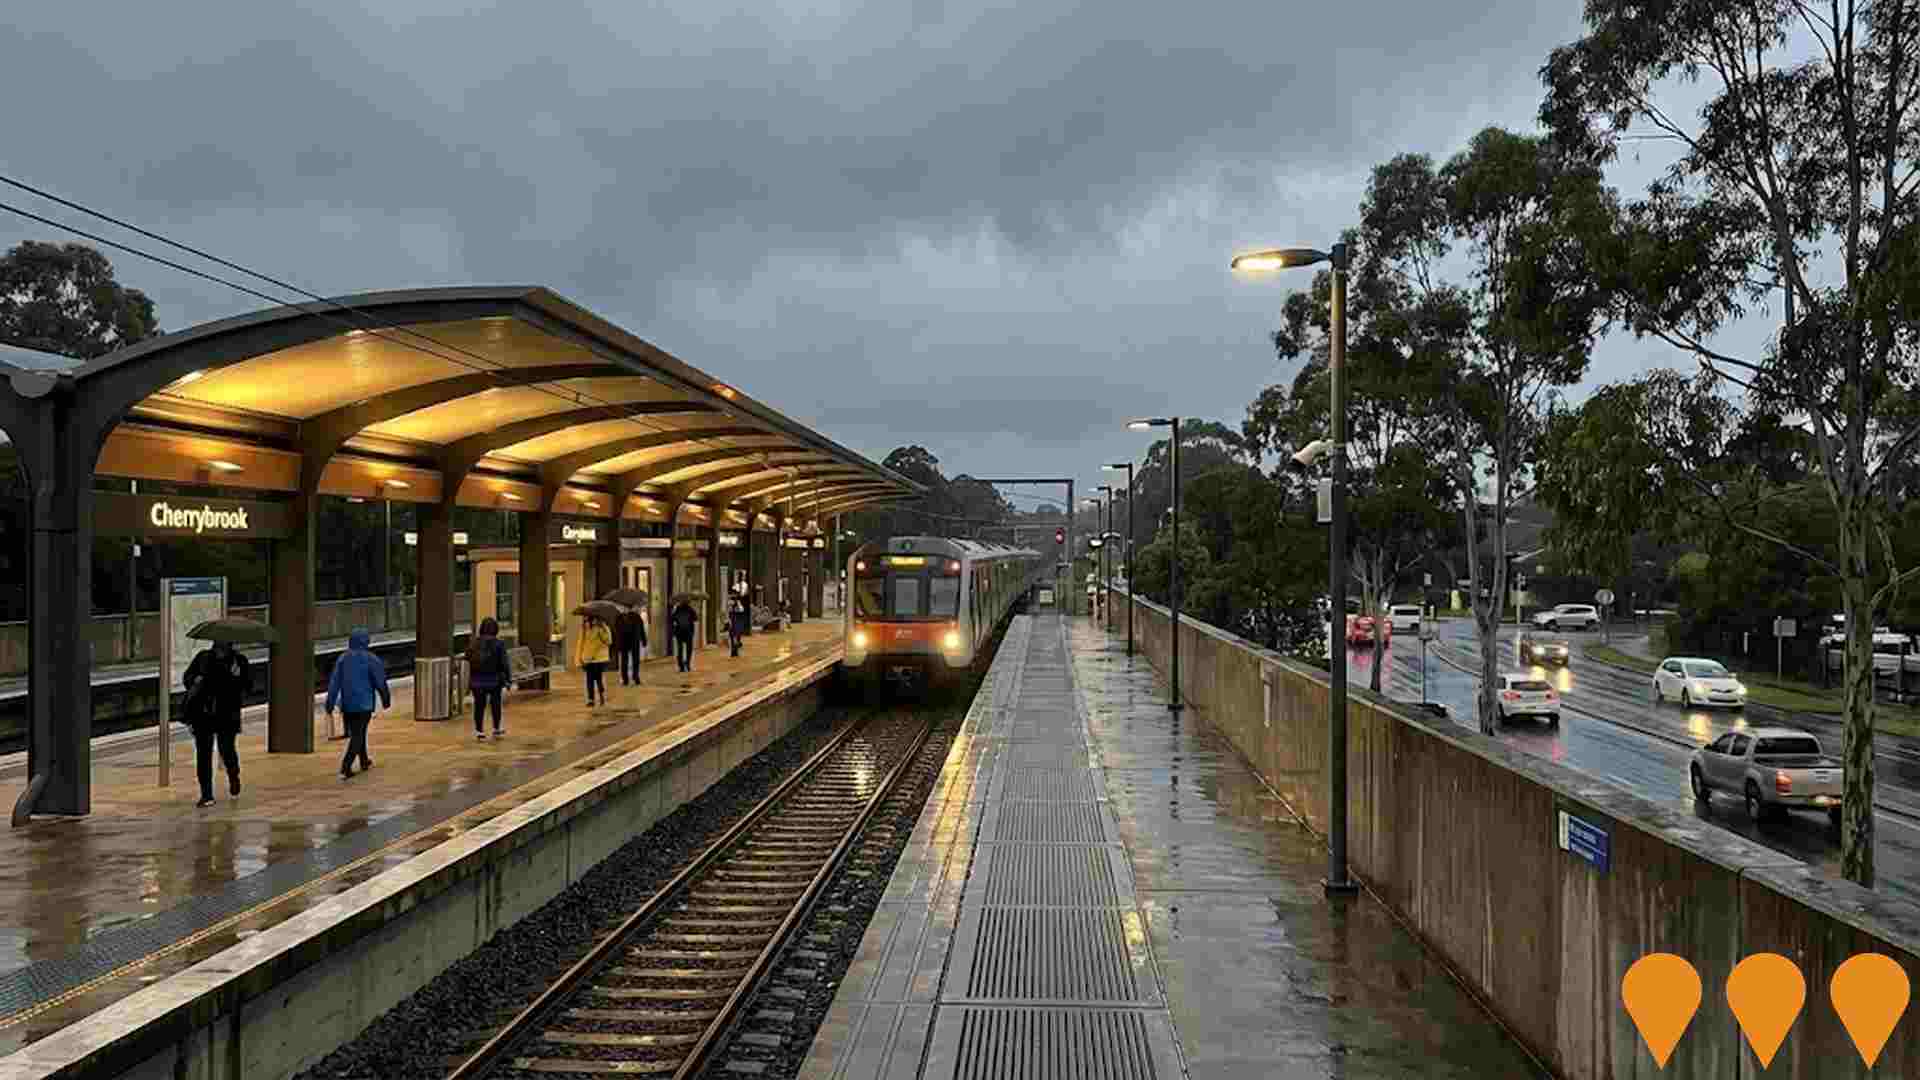
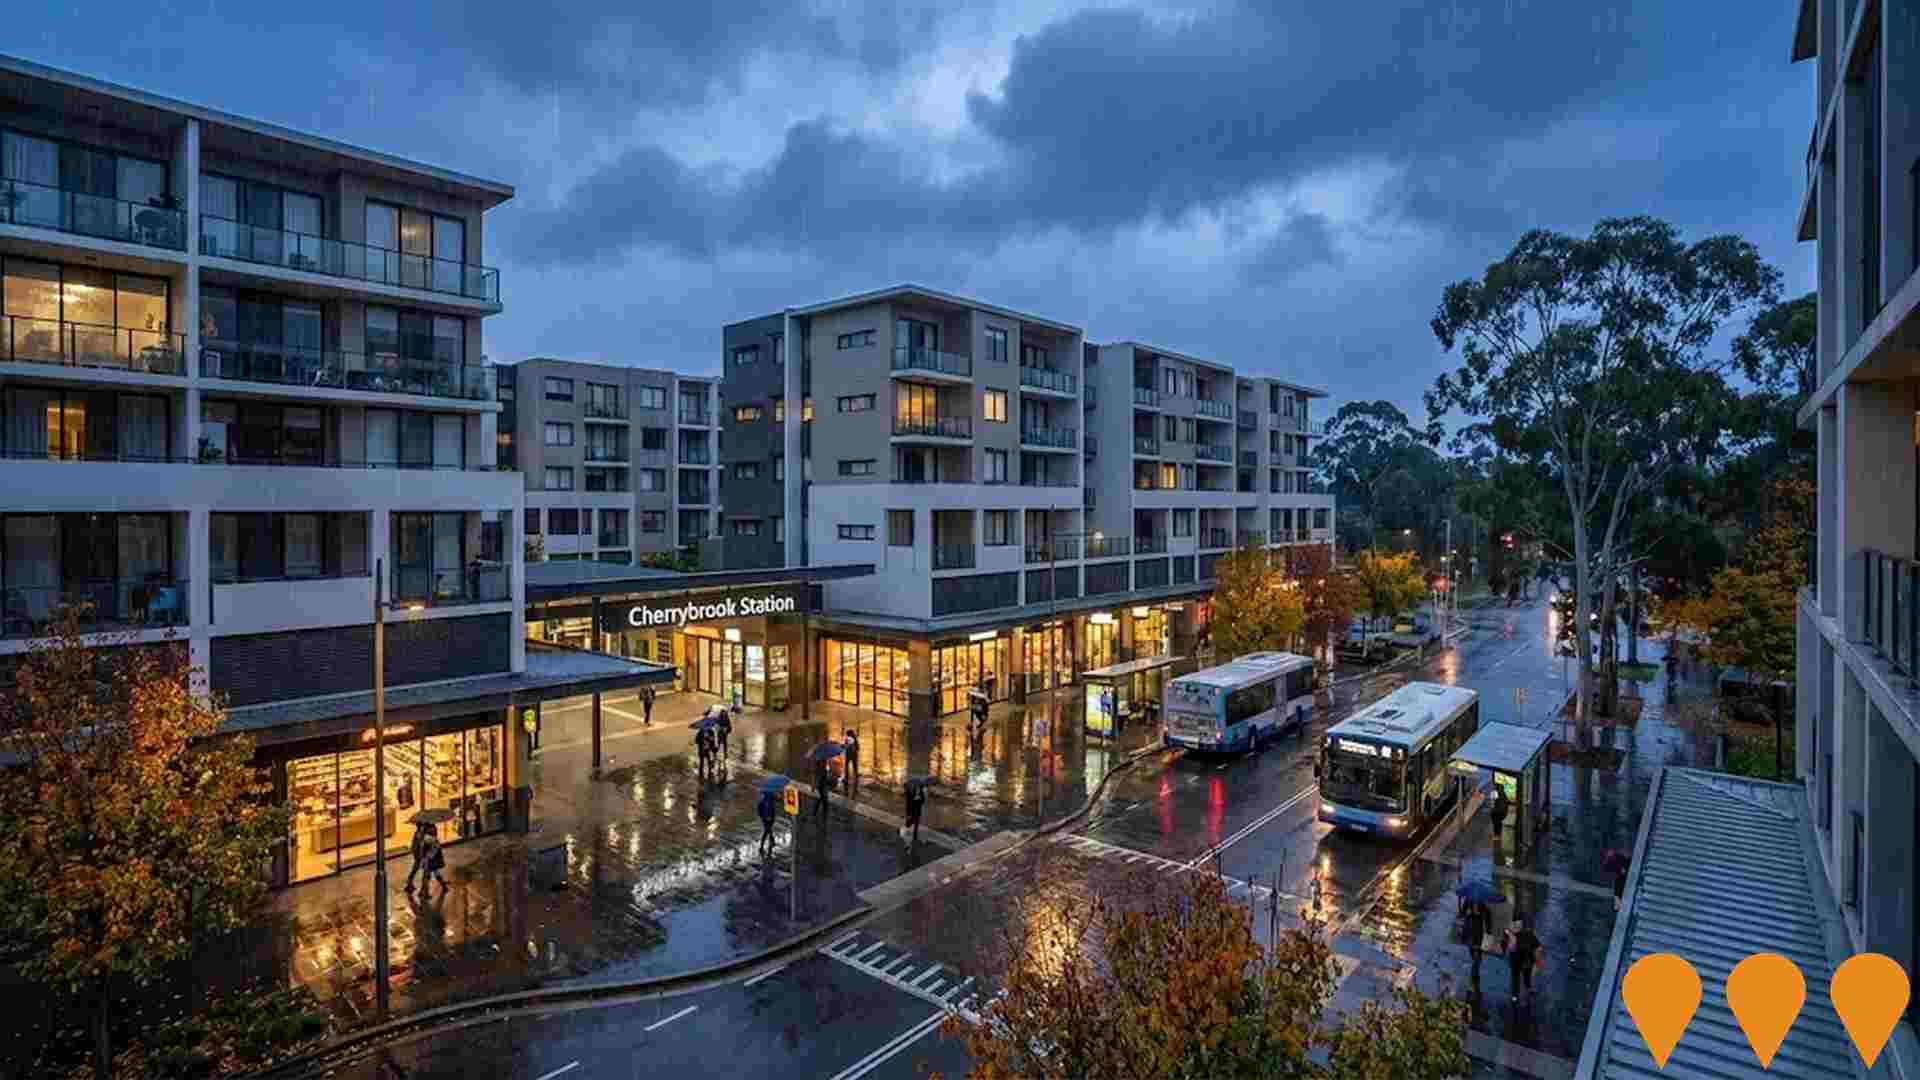
Metro station serving West Pennant Hills, Cherrybrook and surrounding areas. Part of Metro North West Line opened May 2019. Station located on Bradfield Parade near Castle Hill Road, providing direct access to Chatswood and Sydney CBD via the extended Metro network.
Hills Shire Council Delivery Program and Operational Plan 2024-2025 Infrastructure Works
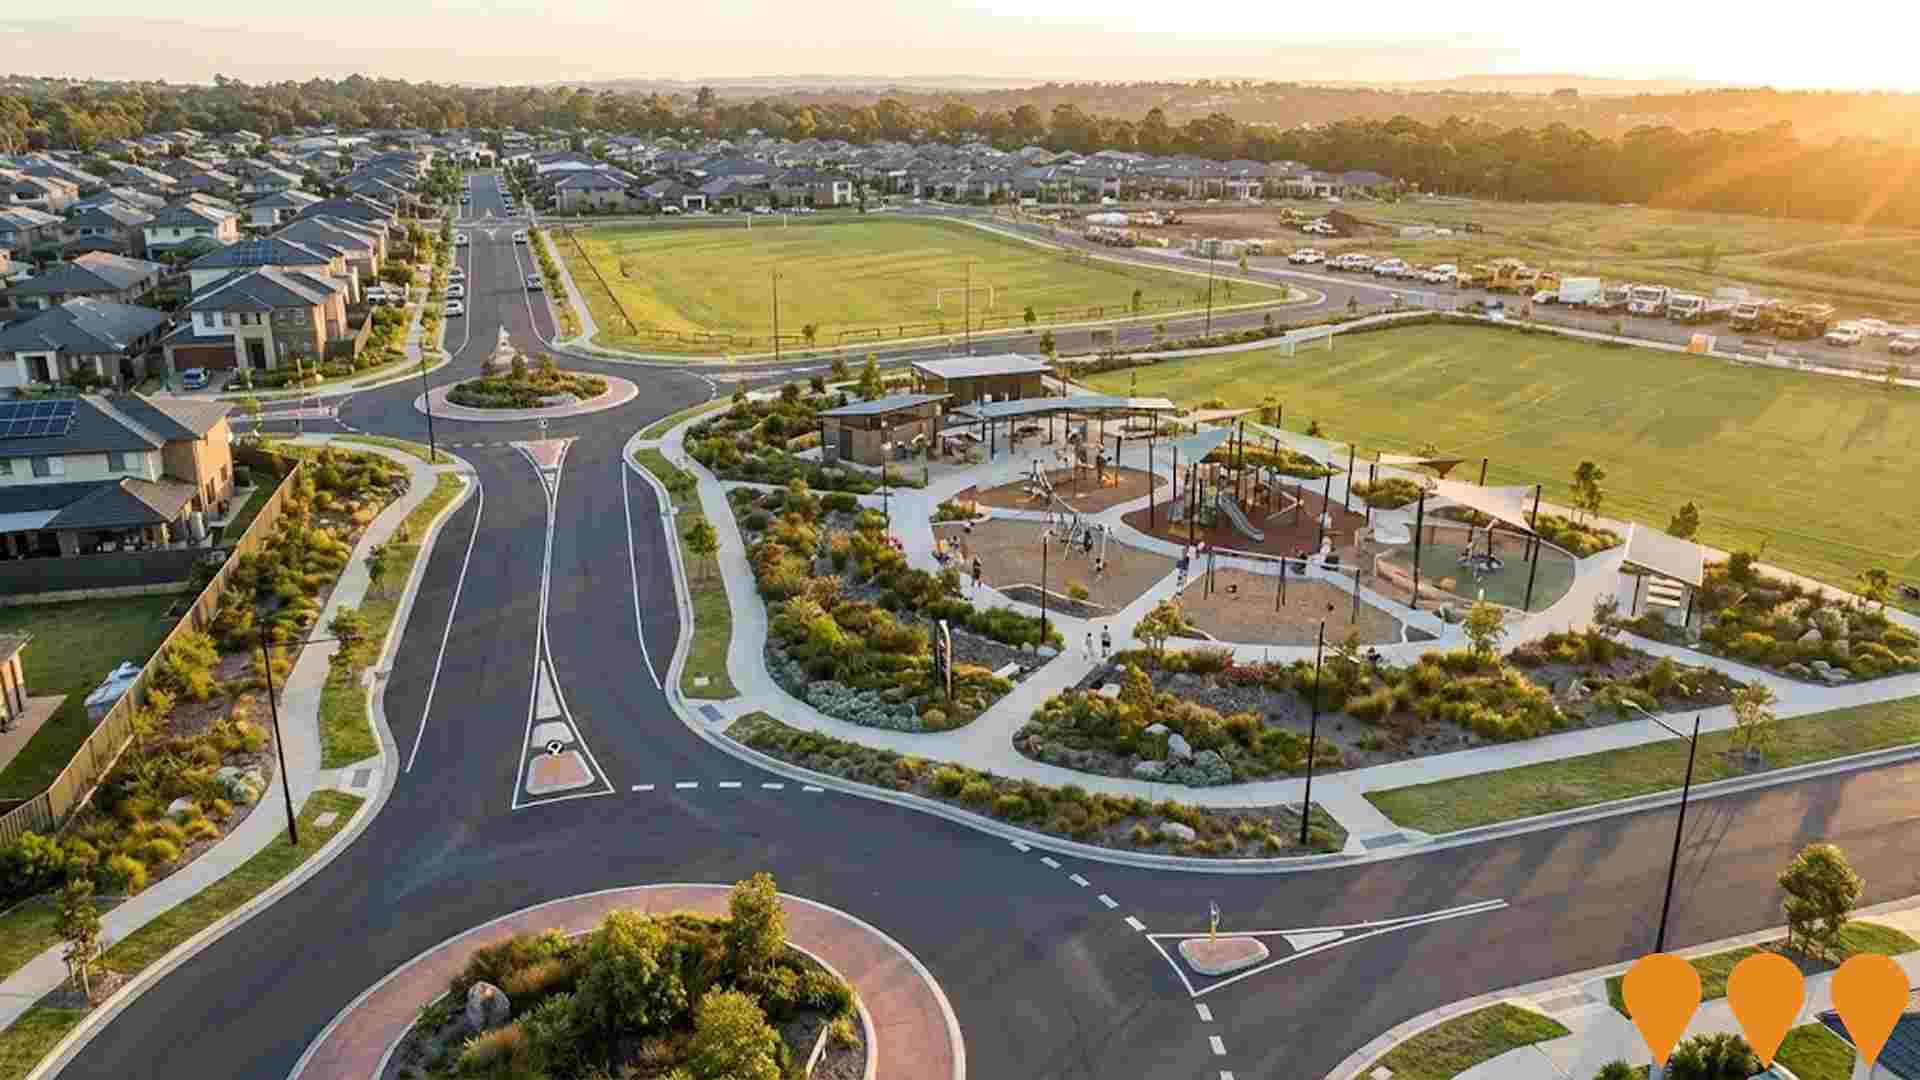
The Hills Shire Council's 2024-2025 infrastructure program is a significant component of the overall $308.5 million Delivery Program and Operational Plan. The total infrastructure expenditure for 2024-2025 is $162.8 million, focusing on maintaining, renewing, and building new assets like roads, parks, paths, and playgrounds across the Shire to accommodate rapid population growth. Key works include road upgrades (Annangrove Road, Withers Road, Boundary Road), new footpaths, cycleways, bridges, and new and refurbished parks and playgrounds, including Livvi's Place extension at Bernie Mullane Sports Complex. The Council is also actively campaigning for state and federal funding for critical infrastructure, particularly in high-growth areas like Box Hill and the Kellyville/Bella Vista precincts.
Thornleigh Marketplace Redevelopment
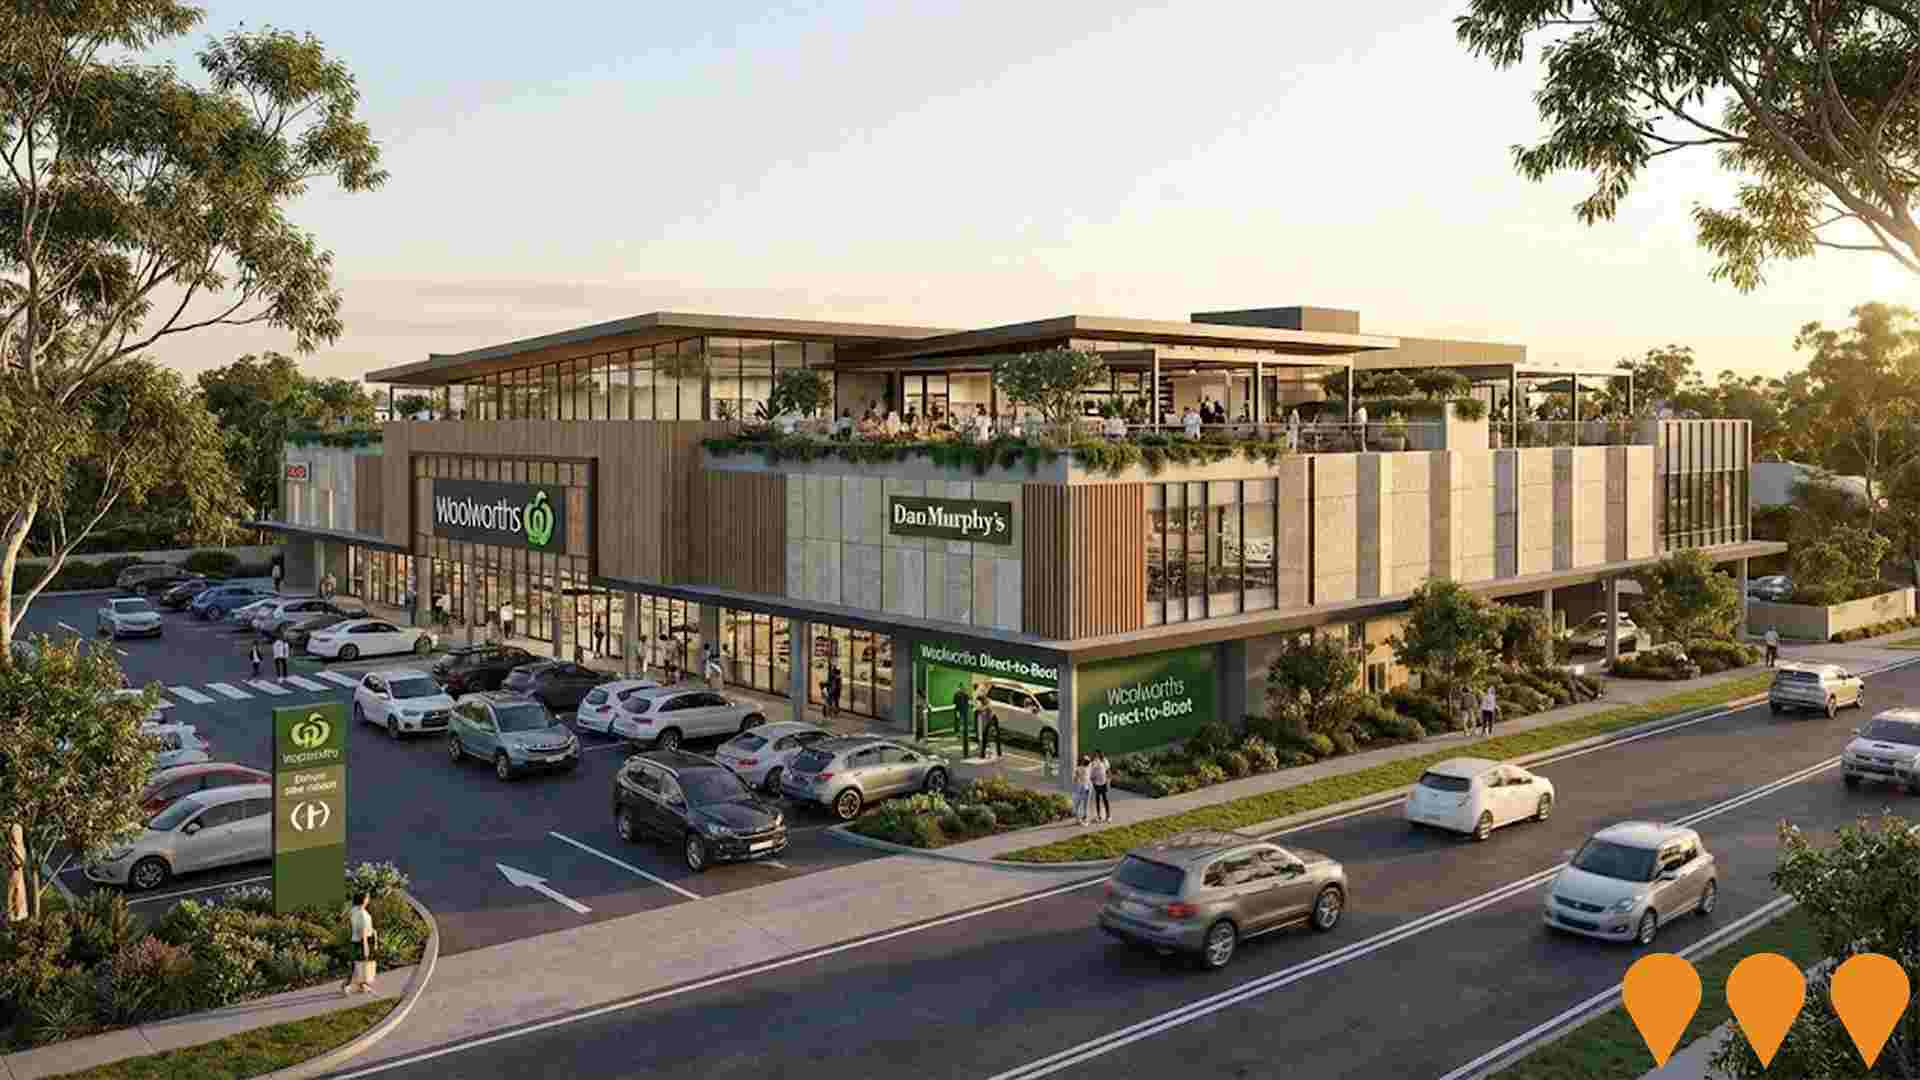
Holdmark is progressing an approved redevelopment of the Thornleigh Marketplace neighbourhood shopping centre at 2-12 The Comenarra Parkway, Thornleigh. The Hornsby Local Planning Panel granted development consent in 2020 for alterations and additions including demolition of existing rooftop elements, recladding of the facades, and construction of a new second-floor level above the rooftop car park with additional retail floorspace, food court areas, rooftop terraces, amenities and improved vertical circulation. A 2024 Section 4.55(2) modification reduced the approved additional floor area, refined the layout and added a Woolworths direct-to-boot facility within the first-floor car park while keeping the overall concept of an expanded centre. The centre is owned by Holdmark and anchored by Woolworths and Dan Murphys, with around 20 specialty tenancies and on-site parking, and will remain the primary full-line supermarket based centre for the Thornleigh trade area once works are delivered. [sources: :contentReference[oaicite:0]{index=0} :contentReference[oaicite:1]{index=1} ]
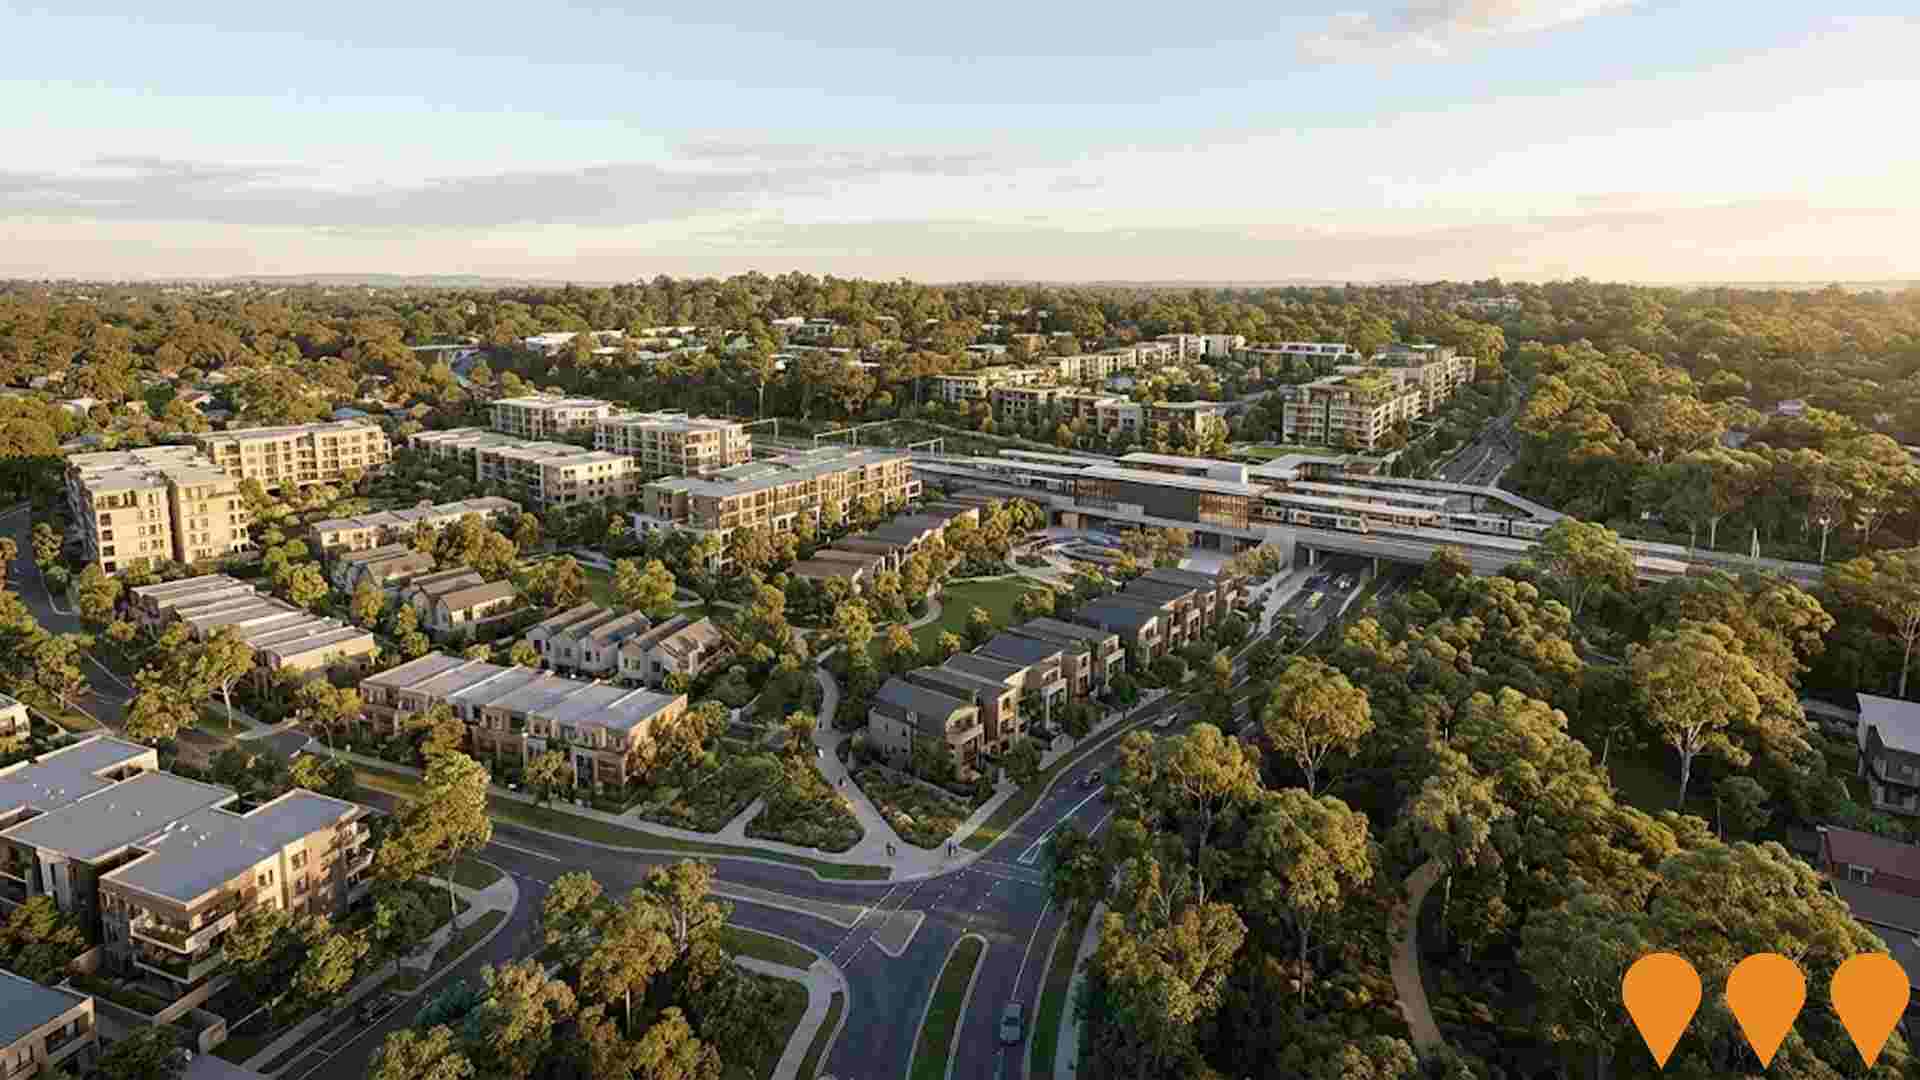
Cherrybrook Station State Significant Precinct
State Significant Precinct (7.7 hectares) led by Landcom on behalf of Sydney Metro, creating a compact green village with up to 410 new homes (minimum 5% affordable housing), 3,000sqm commercial space, 1,300sqm community facility, and over 1 hectare public open space including village square and environmental space around Blue Gum High Forest. Approved December 2022, seeking private developer through competitive tender. Delivery over 10+ years in stages.
Highforest by Mirvac
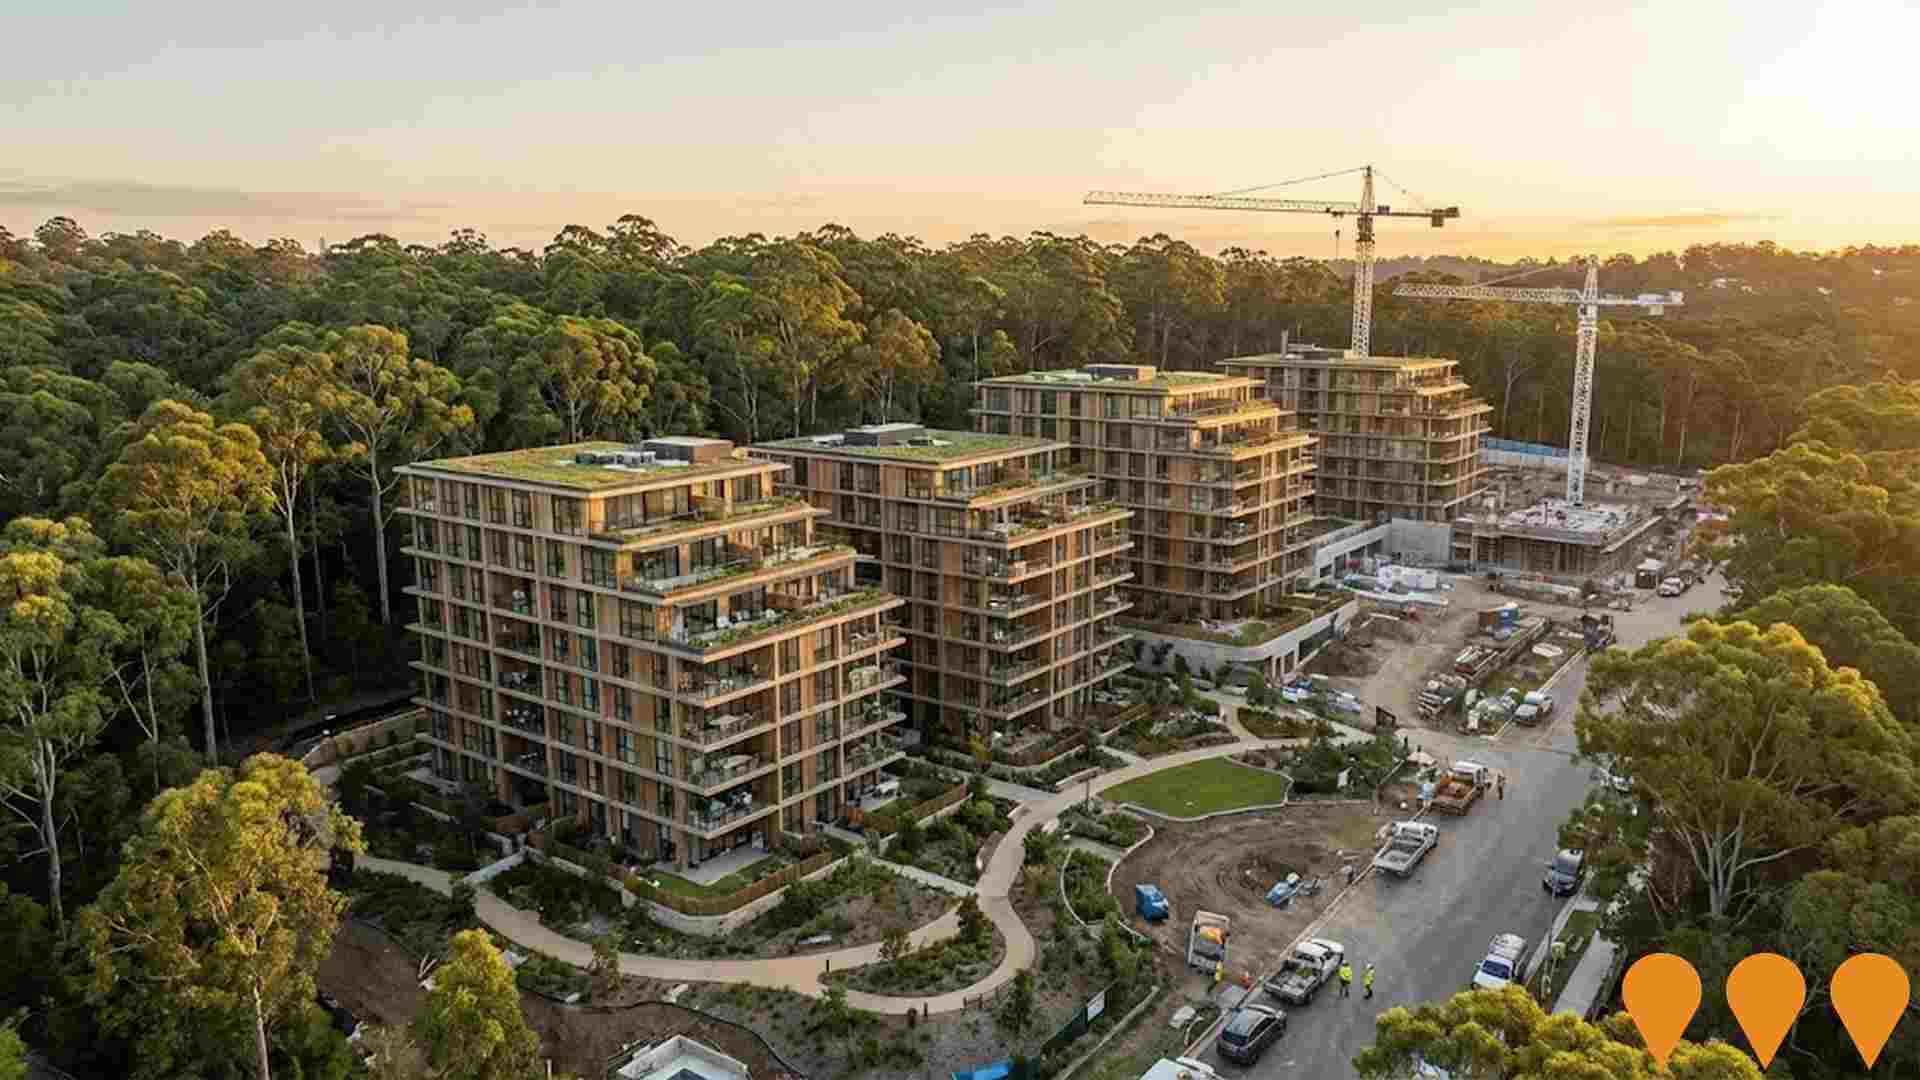
Large-scale residential development by Mirvac & Sumitomo Corporation comprising 249 apartments and 165 houses across 25.87 hectares. Features treehouse-inspired apartments in four 7-storey buildings alongside Cumberland State Forest, 800m from Cherrybrook Metro Station. Total project value ~$830 million, targeting 6-star Green Star Communities rating with all-electric homes and solar panels. Construction commenced 2024, completion forecast 2028.
Employment
Employment performance in Cherrybrook ranks among the strongest 15% of areas evaluated nationally
Cherrybrook has a highly educated workforce with notable representation in the technology sector. Its unemployment rate is 1.9%, lower than Greater Sydney's 4.2%.
Employment growth over the past year was estimated at 2.7%. As of June 2025, 10,566 residents are employed, with an unemployment rate of 2.2% and workforce participation of 62.2%. Leading industries include professional & technical services (1.4 times the regional average), health care & social assistance, and finance & insurance. Construction shows lower representation at 5.8%, compared to the regional average of 8.6%.
Employment opportunities locally appear limited based on Census data comparisons. Between June 2024 and June 2025, employment levels increased by 2.7% while labour force grew by 3.1%, raising the unemployment rate by 0.4 percentage points. In contrast, Greater Sydney experienced employment growth of 2.6% with a 0.3 percentage point rise in unemployment. State-level data to Nov-25 shows NSW employment contracted by 0.03%. National forecasts from May-25 project national employment growth at 6.6% over five years and 13.7% over ten years. Applying these projections to Cherrybrook's industry mix suggests local employment should increase by 7.3% over five years and 14.6% over ten years.
Frequently Asked Questions - Employment
Income
The economic profile demonstrates exceptional strength, placing the area among the top 10% nationally based on comprehensive AreaSearch income analysis
AreaSearch's latest postcode level ATO data for financial year 2022 shows that Cherrybrook SA2 has extremely high incomes nationally. The median income is $61,160 and the average income stands at $86,460. This contrasts with Greater Sydney's figures of a median income of $56,994 and an average income of $80,856. Based on Wage Price Index growth of 12.61% since financial year 2022, current estimates would be approximately $68,872 (median) and $97,363 (average) as of September 2025. According to the 2021 Census figures, household incomes rank exceptionally high at the 96th percentile ($2,924 weekly). Income analysis reveals that 34.2% of the community earns $4000+ (6,480 individuals), unlike surrounding regions where 30.9% fall within the $1,500 - 2,999 range. A significant 48.8% earn above $3,000 weekly. Housing accounts for 14.1% of income and strong earnings rank residents within the 96th percentile for disposable income. The area's SEIFA income ranking places it in the 10th decile.
Frequently Asked Questions - Income
Housing
Cherrybrook is characterized by a predominantly suburban housing profile, with above-average rates of outright home ownership
In Cherrybrook, as per the latest Census evaluation, 81.5% of dwellings were houses, with the remaining 18.5% consisting of semi-detached homes, apartments, and other dwelling types. In comparison, Sydney metropolitan area had 78.2% houses and 21.8% other dwellings. Home ownership in Cherrybrook stood at 40.7%, with mortgaged dwellings at 44.1% and rented ones at 15.2%. The median monthly mortgage repayment was $3,000, aligning with the Sydney metro average, while the median weekly rent was $695, higher than Sydney's $580. Nationally, Cherrybrook's mortgage repayments were significantly higher than the Australian average of $1,863, and rents were substantially above the national figure of $375.
Frequently Asked Questions - Housing
Household Composition
Cherrybrook features high concentrations of family households, with a higher-than-average median household size
Family households constitute 88.0% of all households, including 55.5% couples with children, 24.1% couples without children, and 7.9% single parent families. Non-family households account for the remaining 12.0%, with lone person households at 11.3% and group households comprising 0.7%. The median household size is 3.1 people, larger than the Greater Sydney average of 3.0.
Frequently Asked Questions - Households
Local Schools & Education
Cherrybrook demonstrates exceptional educational outcomes, ranking among the top 5% of areas nationally based on AreaSearch's comprehensive analysis of qualification and performance metrics
Cherrybrook has a notably high educational attainment level, with 52.5% of its residents aged 15 and above holding university qualifications. This figure is higher than the national average of 30.4% and the NSW state average of 32.2%. The area's most common university qualification is bachelor degrees (32.2%), followed by postgraduate qualifications (17.0%) and graduate diplomas (3.3%). Vocational pathways are also prevalent, accounting for 20.8% of qualifications among residents aged 15 and above.
This includes advanced diplomas (10.7%) and certificates (10.1%). Educational participation is high in Cherrybrook, with 33.1% of residents currently enrolled in formal education. This includes primary education (10.5%), secondary education (10.5%), and tertiary education (7.4%).
Frequently Asked Questions - Education
Schools Detail
Nearby Services & Amenities
Transport
Transport servicing is high compared to other areas nationally based on assessment of service frequency, route connectivity and accessibility
Cherrybrook has 112 active public transport stops offering a mix of light rail and bus services. These stops are served by 86 different routes that together facilitate 5,102 weekly passenger trips. The area's transport accessibility is rated excellent with residents on average being located 151 meters from the nearest stop.
On average, there are 728 trips daily across all routes, which translates to approximately 45 weekly trips per individual stop.
Frequently Asked Questions - Transport
Transport Stops Detail
Health
Cherrybrook's residents boast exceedingly positive health performance metrics with very low prevalence of common health conditions across all age groups
Cherrybrook shows excellent health outcomes across all age groups, with very low prevalence of common health conditions. The private health cover rate is exceptionally high at approximately 63% (11,994 people), compared to the national average of 55.3%.
The most prevalent medical conditions are arthritis and asthma, affecting 5.8% and 5.5% of residents respectively. A total of 76.0% of residents report being completely clear of medical ailments, slightly higher than Greater Sydney's 75.9%. Cherrybrook has a larger elderly population (aged 65 and over), with 20.9% (3,954 people) compared to Greater Sydney's 18.9%. Despite this, health outcomes among seniors are strong and largely align with the general population's health profile.
Frequently Asked Questions - Health
Cultural Diversity
Cherrybrook is among the most culturally diverse areas in the country based on AreaSearch assessment of a range of language and cultural background related metrics
Cherrybrook's population is culturally diverse, with 50.0% speaking a language other than English at home and 52.9% born overseas. Christianity is the main religion in Cherrybrook, comprising 44.8% of its population. Hinduism is overrepresented compared to Greater Sydney, making up 11.6% of Cherrybrook's population versus 8.6%.
The top three ancestry groups are Chinese (20.8%), English (16.1%), and Other (13.7%). Korean (2.6%) and Indian (10.2%) ethnicities are notably overrepresented, while Sri Lankan is slightly higher at 1.3% compared to regional averages of 2.3%, 7.5%, and 1.0% respectively.
Frequently Asked Questions - Diversity
Age
Cherrybrook's median age exceeds the national pattern
The median age in Cherrybrook is 43 years, significantly higher than Greater Sydney's average of 37 years and substantially exceeding the national average of 38 years. The age profile shows that those aged 65-74 years are particularly prominent, making up 11.6% of the population, while those aged 25-34 years are comparatively smaller at 5.8%. Between 2021 and present, the proportion of those aged 75-84 years has grown from 5.3% to 6.5%, while the 55-64 age group has declined from 13.8% to 12.4% and the 25-34 age group has dropped from 7.2% to 5.8%. Looking ahead to 2041, demographic projections reveal significant shifts in Cherrybrook's age structure. The 75-84 age cohort is projected to increase solidly by 588 people (48%) from 1,239 to 1,828. Notably, the combined 65+ age groups are expected to account for 99% of total population growth, reflecting the area's aging demographic profile. Conversely, the 55-64 and 45-54 age cohorts are expected to experience population declines.
