Chart Color Schemes
This analysis uses ABS Statistical Areas Level 2 (SA2) boundaries, which can materially differ from Suburbs and Localities (SAL) even when sharing similar names.
SA2 boundaries are defined by the Australian Bureau of Statistics and are designed to represent communities for statistical reporting (e.g., census and ERP).
Suburbs and Localities (SAL) represent commonly-used suburb/locality names (postal-style areas) and may use different geographic boundaries. For comprehensive analysis, consider reviewing both boundary types if available.
est. as @ -- *
ABS ERP | -- people | --
2021 Census | -- people
Sales Activity
Curious about local property values? Filter the chart to assess the volume and appreciation (including resales) trends and regional comparisons, or scroll to the map below view this information at an individual property level.
Find a Recent Sale
Sales Detail
Population
Cambridge Park is positioned among the lower quartile of areas assessed nationally for population growth based on AreaSearch's assessment of recent, and medium term trends
As of November 2025, Cambridge Park's population is approximately 16,381. This figure represents an increase of 377 people since the 2021 Census, which recorded a population of 16,004. The growth is inferred from ABS estimates; as of June 2024, the estimated resident population was 16,363, with an additional 31 validated new addresses since the Census date. This results in a population density ratio of 2,485 persons per square kilometer, placing Cambridge Park in the upper quartile relative to national locations assessed by AreaSearch. Natural growth contributed approximately 74.1% of overall population gains during recent periods.
AreaSearch adopts ABS/Geoscience Australia projections for each SA2 area, released in 2024 with a base year of 2022. For areas not covered, NSW State Government's SA2 level projections are used, released in 2022 with a base year of 2021. Growth rates by age group from these aggregations are applied to all areas for years 2032 to 2041. By 2041, Cambridge Park is projected to increase by 904 persons based on the latest annual ERP population numbers, reflecting a total increase of approximately 5.4% over the 17-year period.
Frequently Asked Questions - Population
Development
Residential development activity is lower than average in Cambridge Park according to AreaSearch's national comparison of local real estate markets
Cambridge Park has averaged approximately 53 new dwelling approvals per year over the past five financial years, totalling 267 homes. As of FY-26, 18 approvals have been recorded. On average, 0.6 new residents per year have arrived for each new home constructed between FY-21 and FY-25. This pace matches or exceeds demand, providing more housing options and potentially facilitating population growth beyond current projections.
The average construction value of new dwellings is $189,000, which is below regional norms, indicating more affordable housing options for purchasers. In FY-26, $9.7 million in commercial development approvals have been recorded, signifying moderate levels of commercial development. Compared to Greater Sydney, Cambridge Park has roughly half the building activity per person and ranks among the 46th percentile nationally, resulting in relatively constrained buyer choice and supporting interest in existing homes. Recent construction comprises 74.0% detached houses and 26.0% attached dwellings, preserving the area's suburban character while attracting space-seeking buyers. This represents a notable shift from the current housing composition of 92.0% houses, suggesting decreasing availability of developable sites and reflecting changing lifestyles' need for diverse, affordable housing options.
With approximately 366 people per approval, Cambridge Park indicates a mature market. According to AreaSearch's latest quarterly estimate, the area is projected to gain 886 residents by 2041. Given current construction levels, housing supply should adequately meet demand, creating favourable conditions for buyers while potentially enabling growth that exceeds current forecasts.
Frequently Asked Questions - Development
Infrastructure
Cambridge Park has moderate levels of nearby infrastructure activity, ranking in the top 50% nationally
Changes in local infrastructure significantly affect an area's performance. AreaSearch has identified 24 projects likely to impact the region. Notable initiatives include The Quarter - Penrith Health & Education Precinct, Cambridge Gardens Estate (Stage 3 & 4), Oxford Green Estate, and Nepean Hospital Redevelopment. Below is a list of projects expected to have the most relevance.
Professional plan users can use the search below to filter and access additional projects.
INFRASTRUCTURE SEARCH
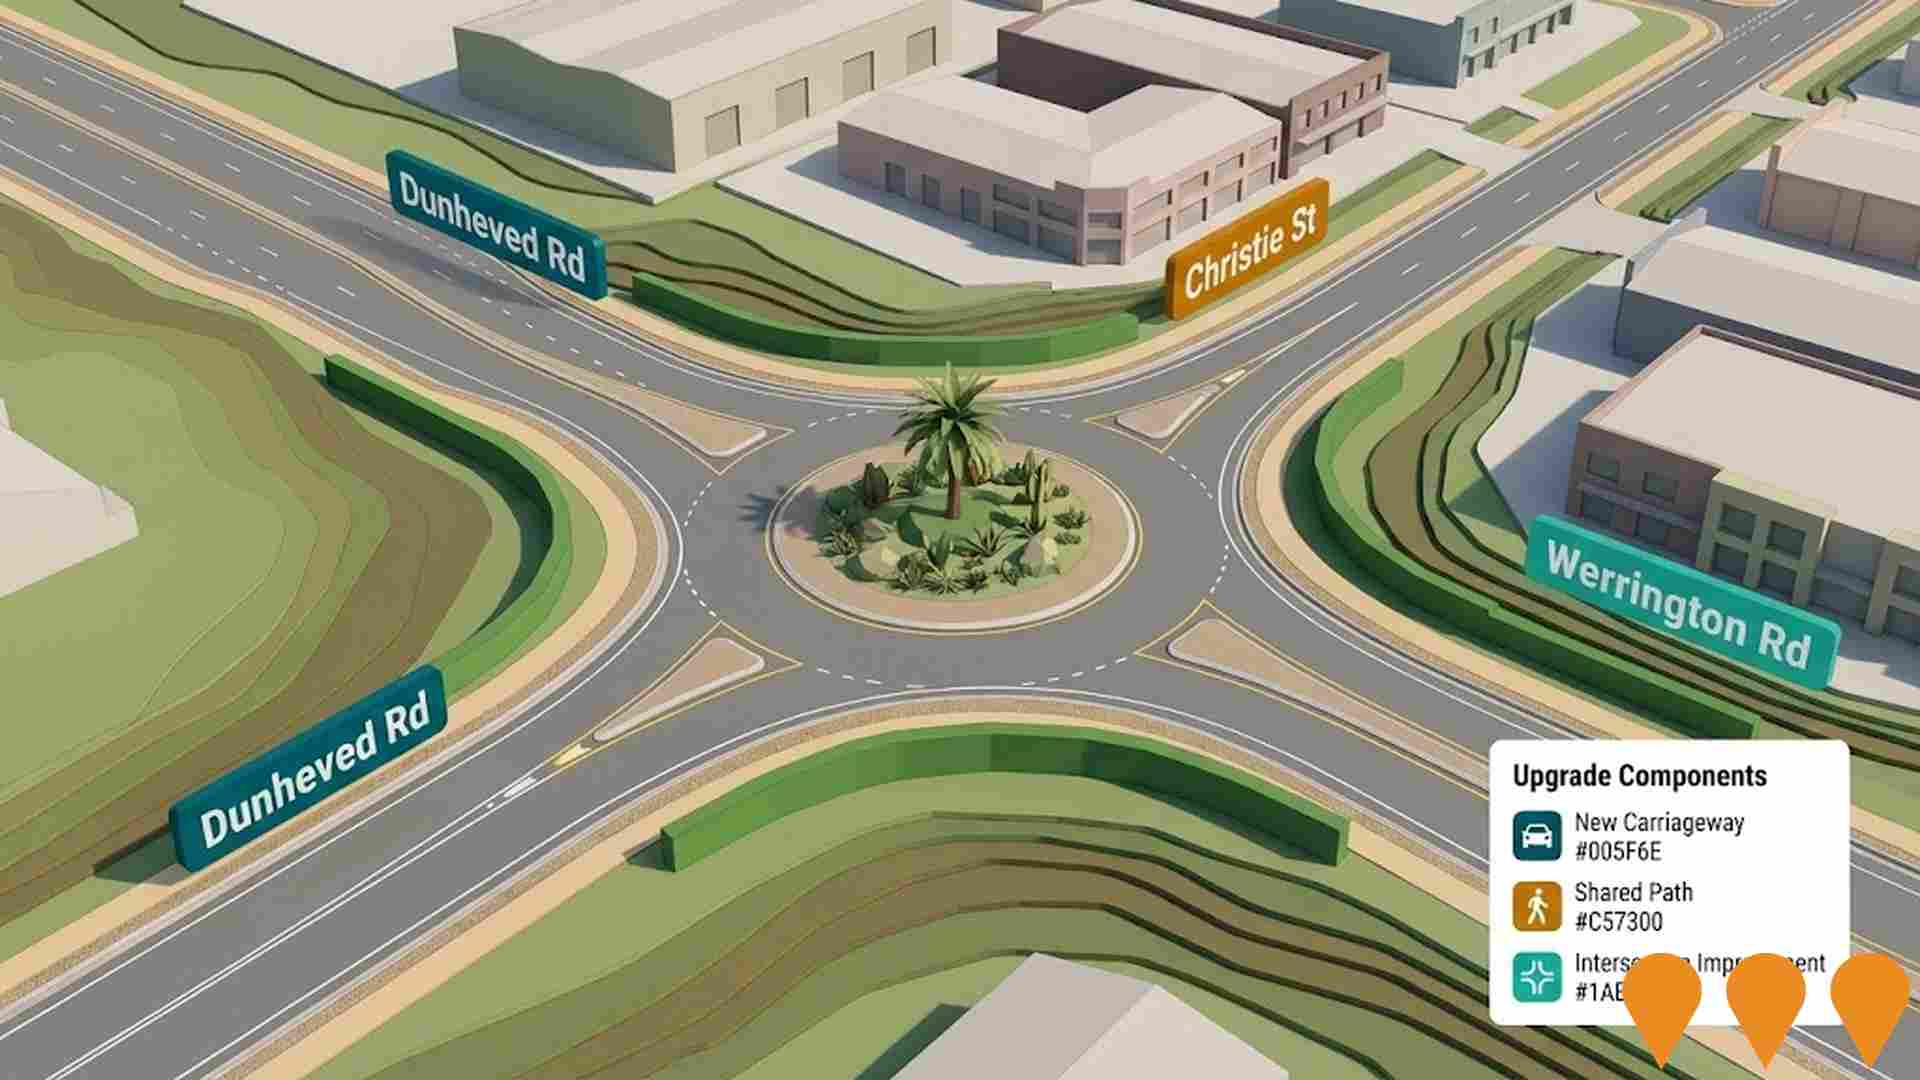
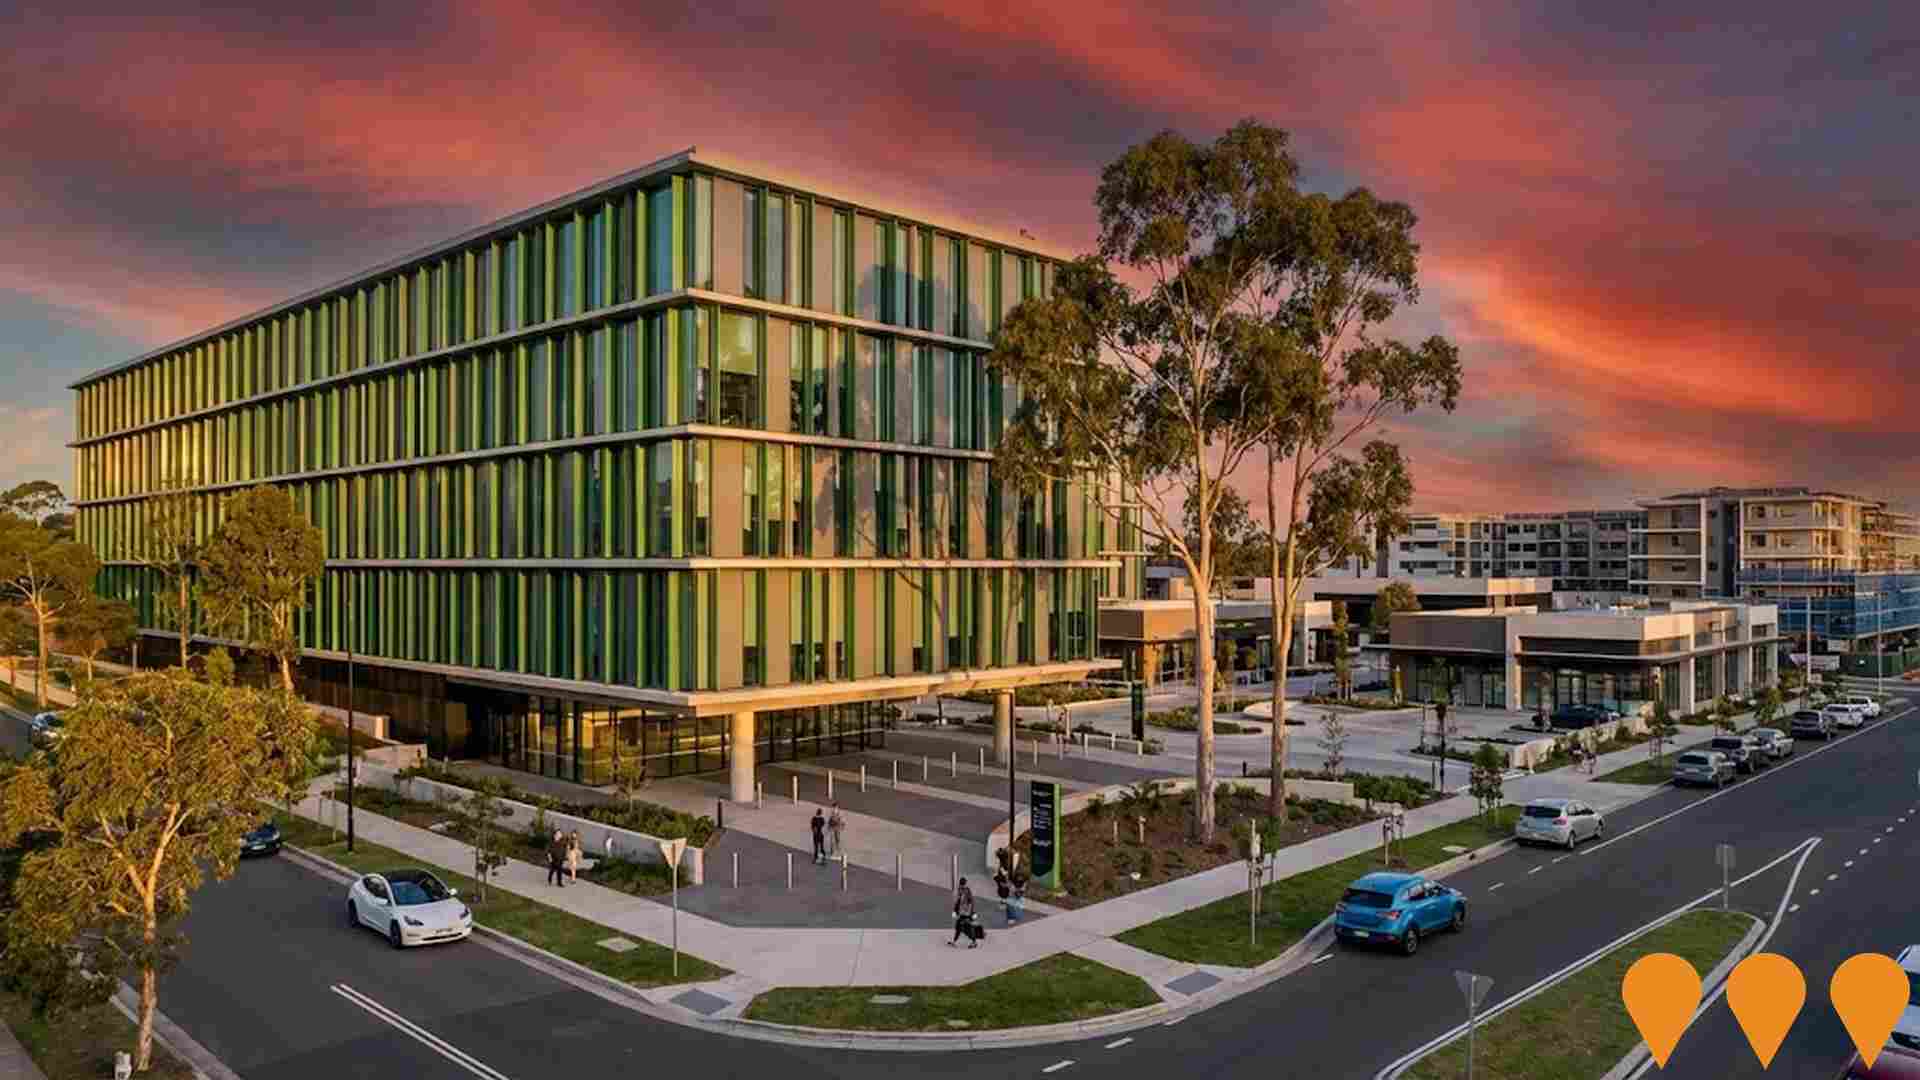
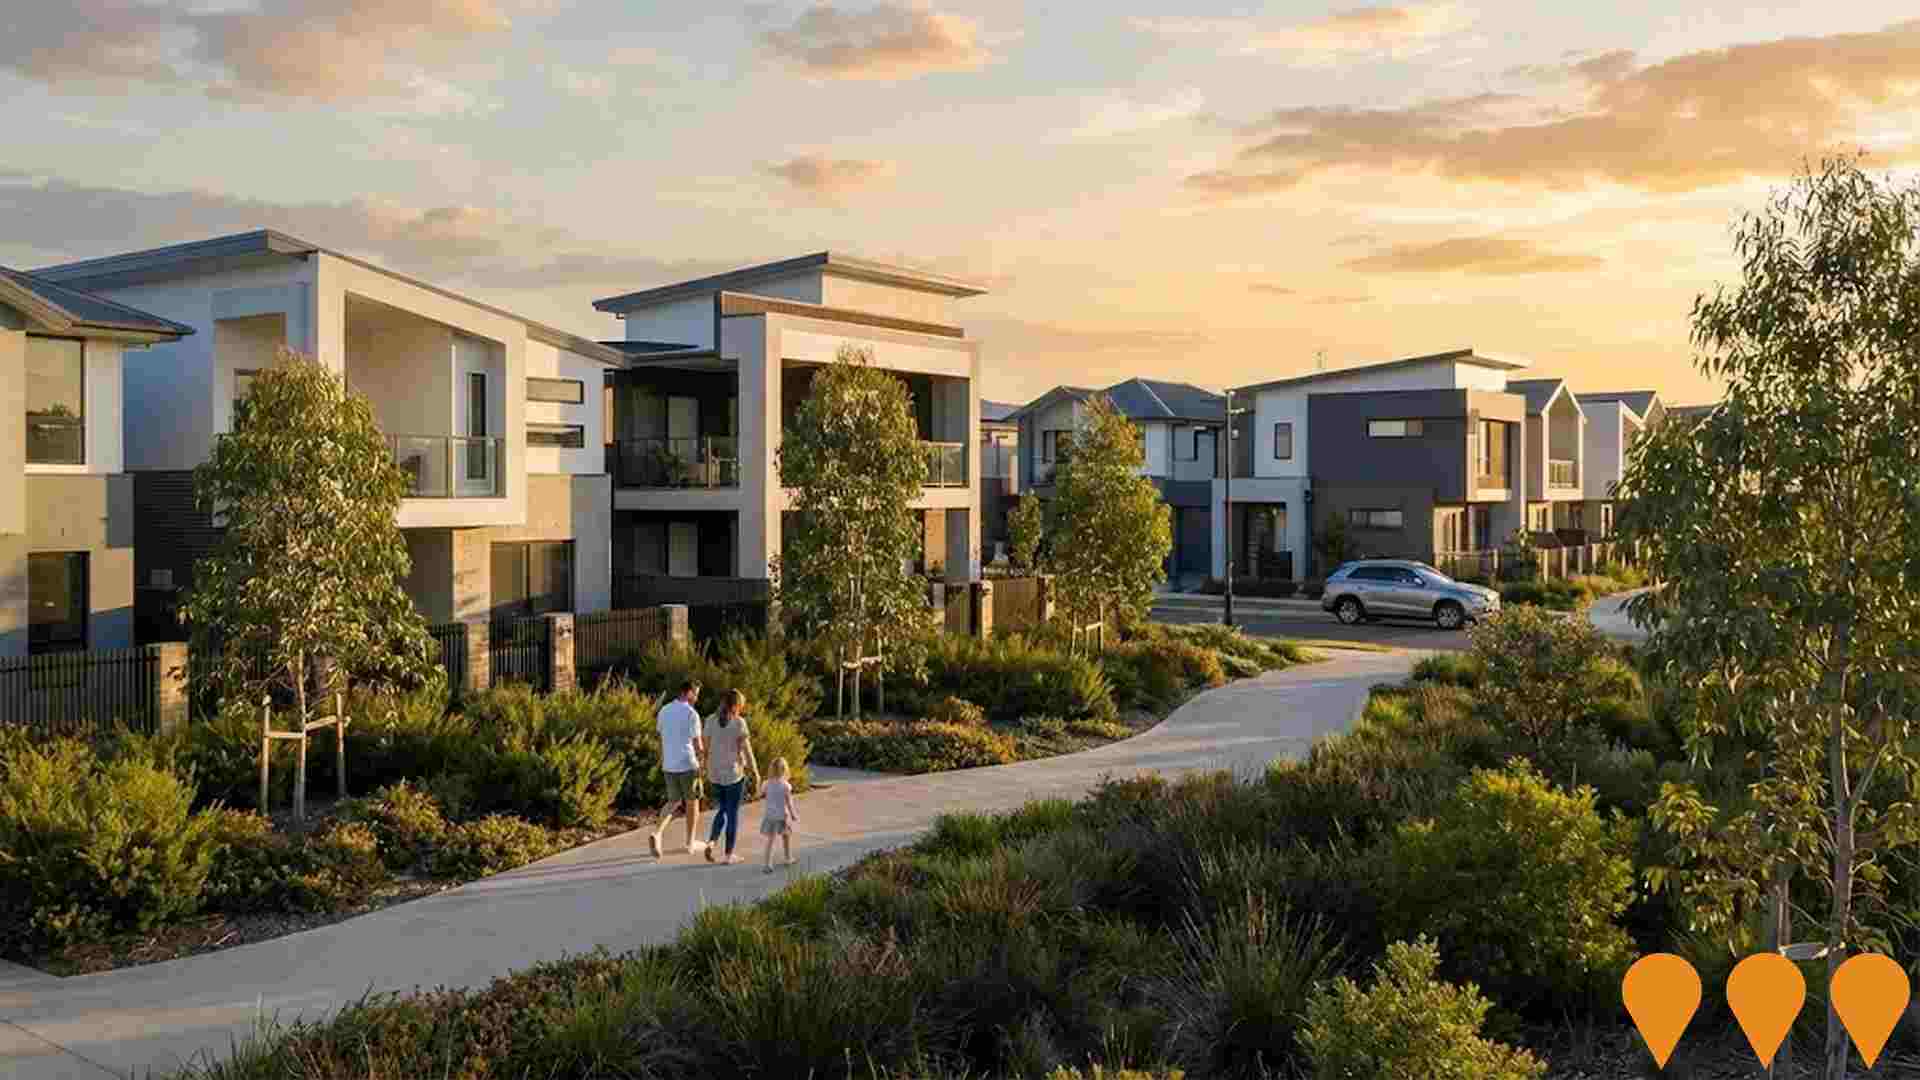
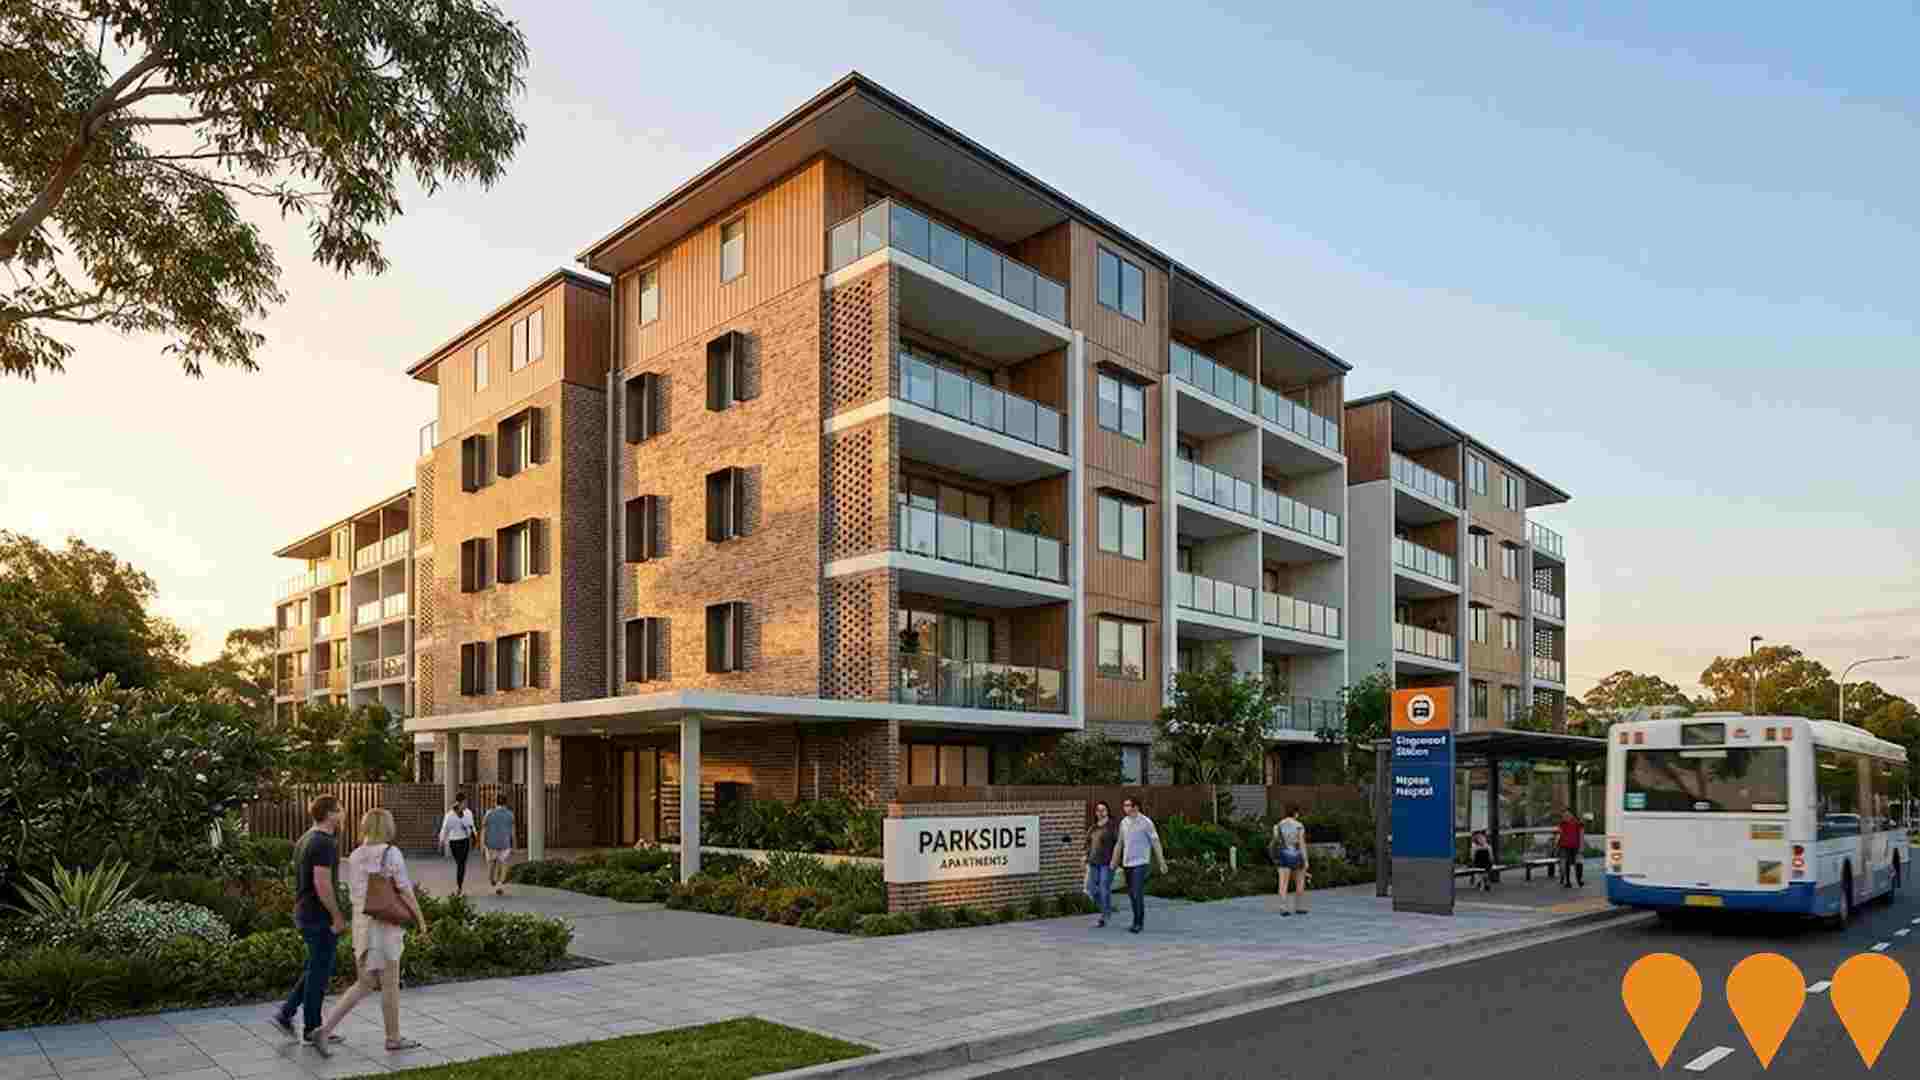
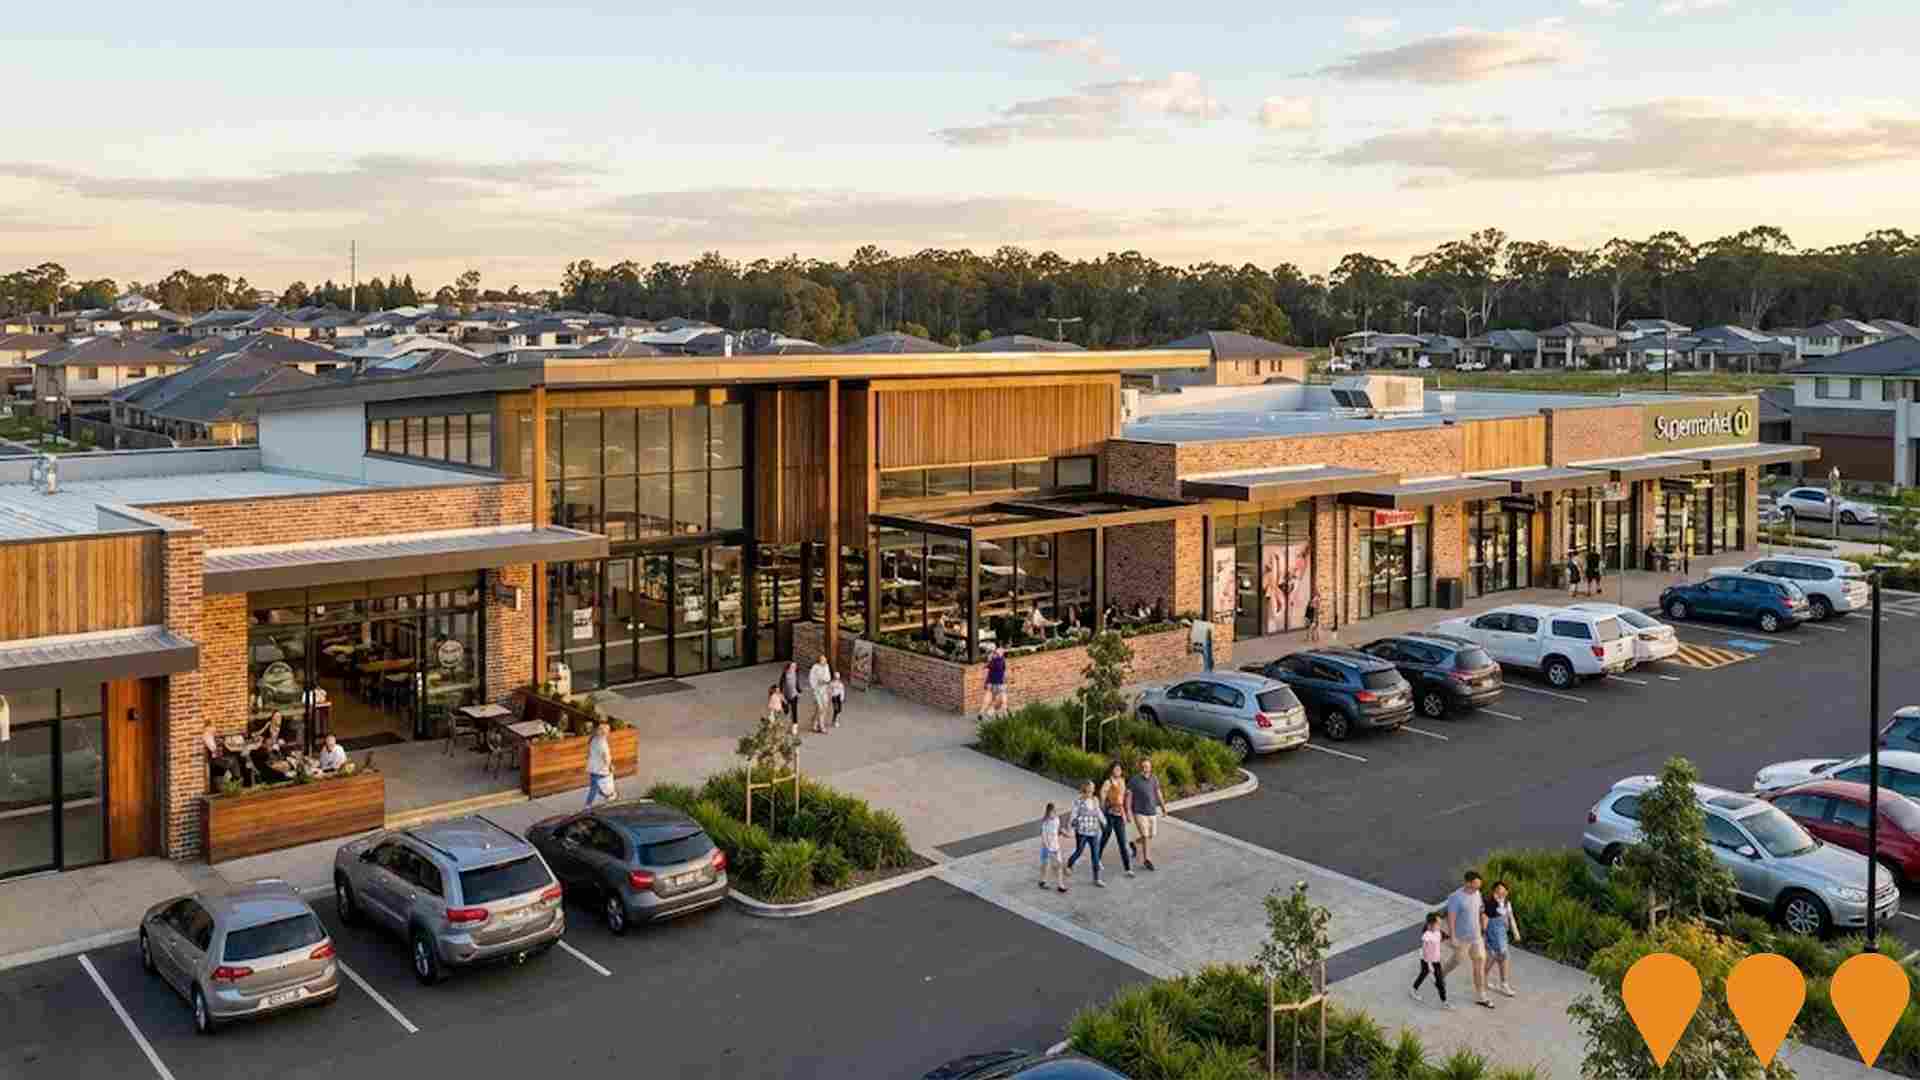
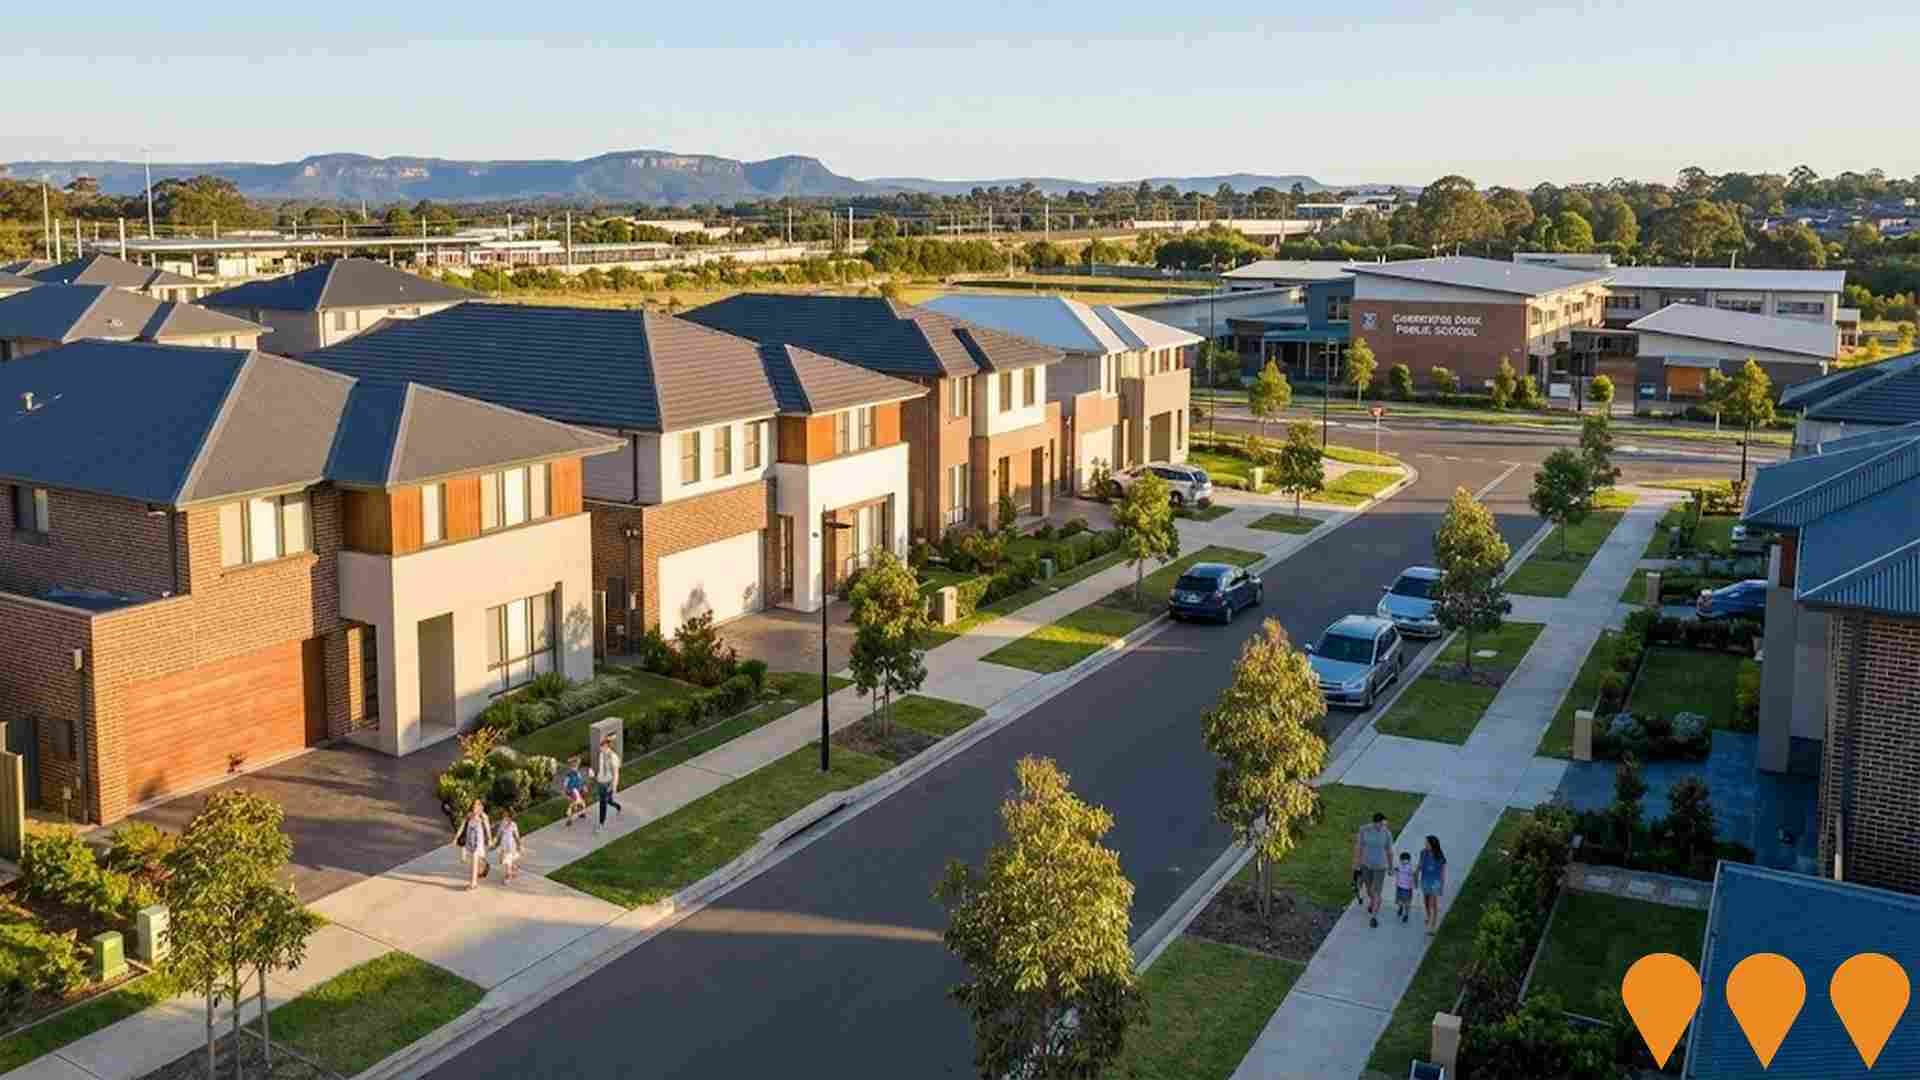
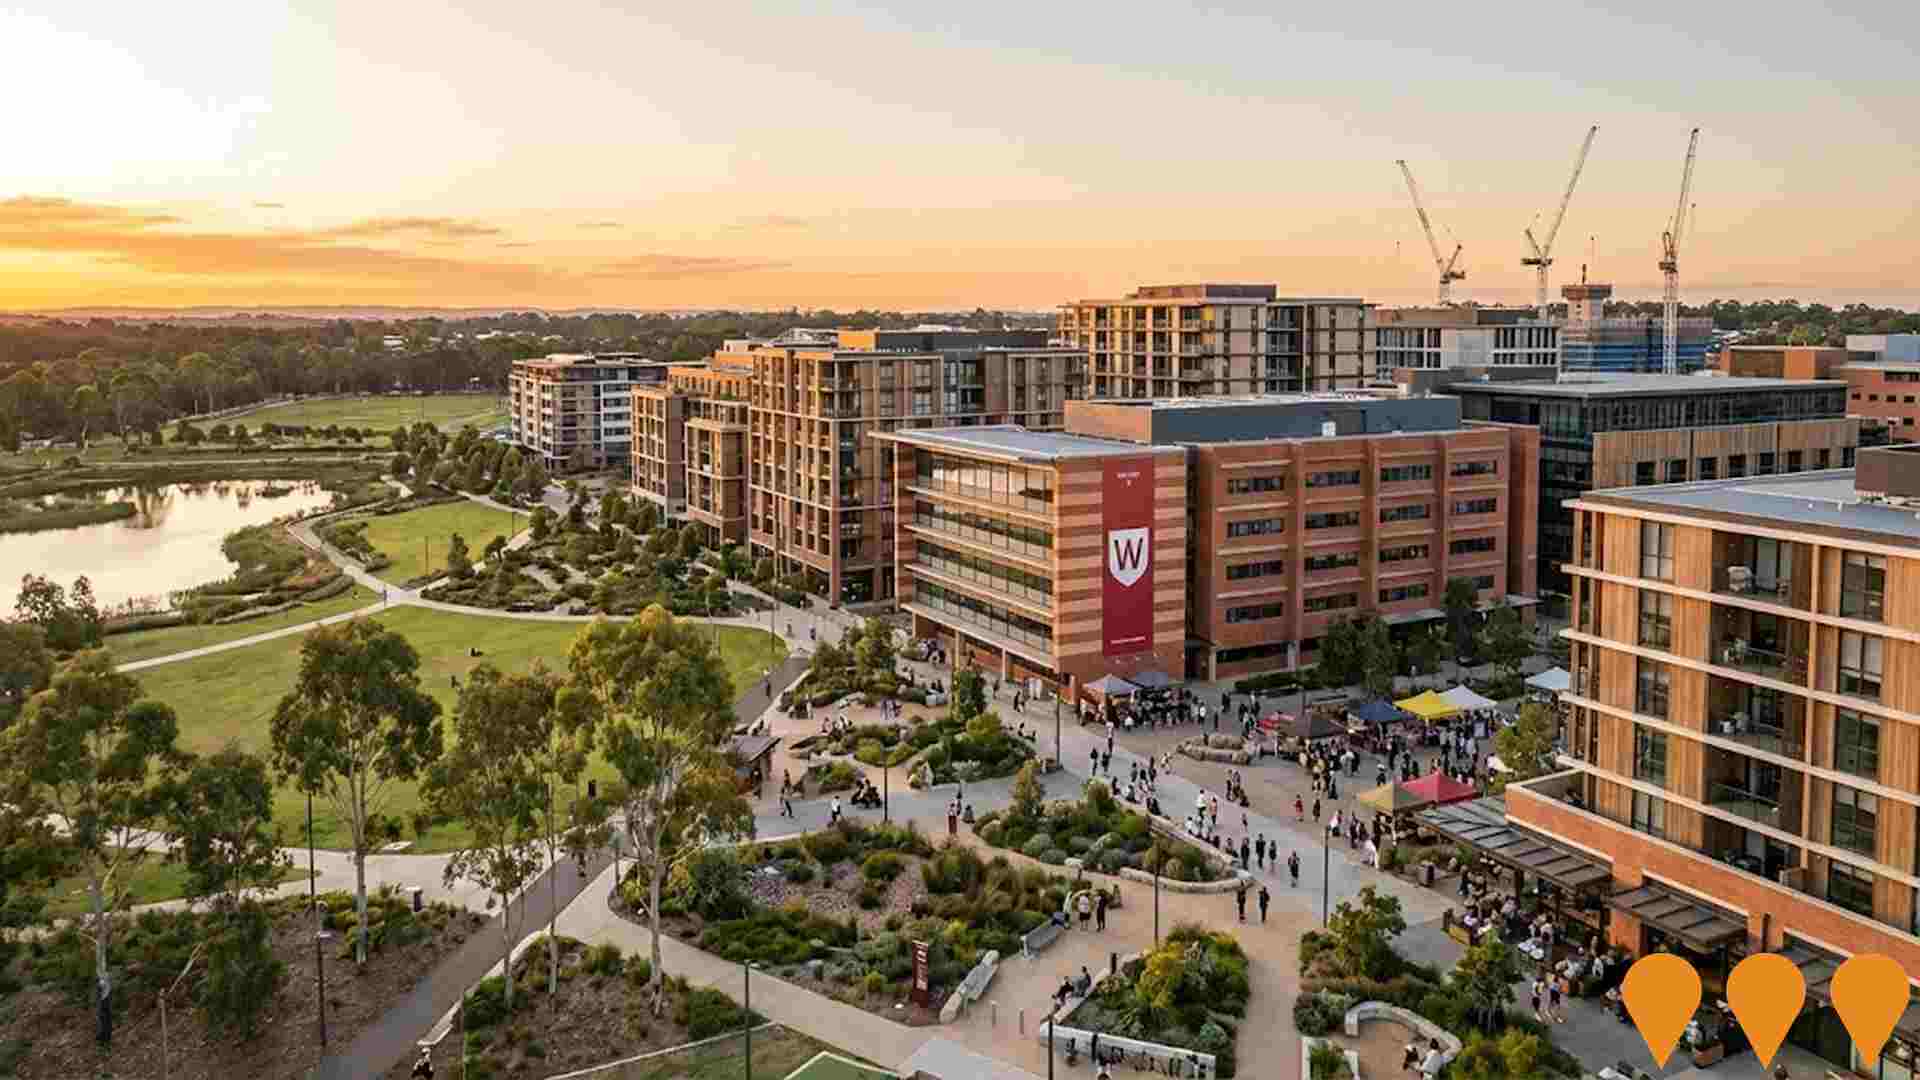
 Denotes AI-based impression for illustrative purposes only, not to be taken as definitive under any circumstances. Please follow links and conduct other investigations from the project's source for actual imagery. Developers and project owners wishing us to use original imagery please Contact Us and we will do so.
Frequently Asked Questions - Infrastructure
The Quarter - Penrith Health & Education Precinct
One of the largest health, education, research, training, and living precincts in Australia, spanning 400 hectares between Penrith and St Marys. It aims to become an international destination for investment and excellence in healthcare, medical research, and world-class education featuring unprecedented infrastructure investment including hospital upgrades, university facilities, and research centres.
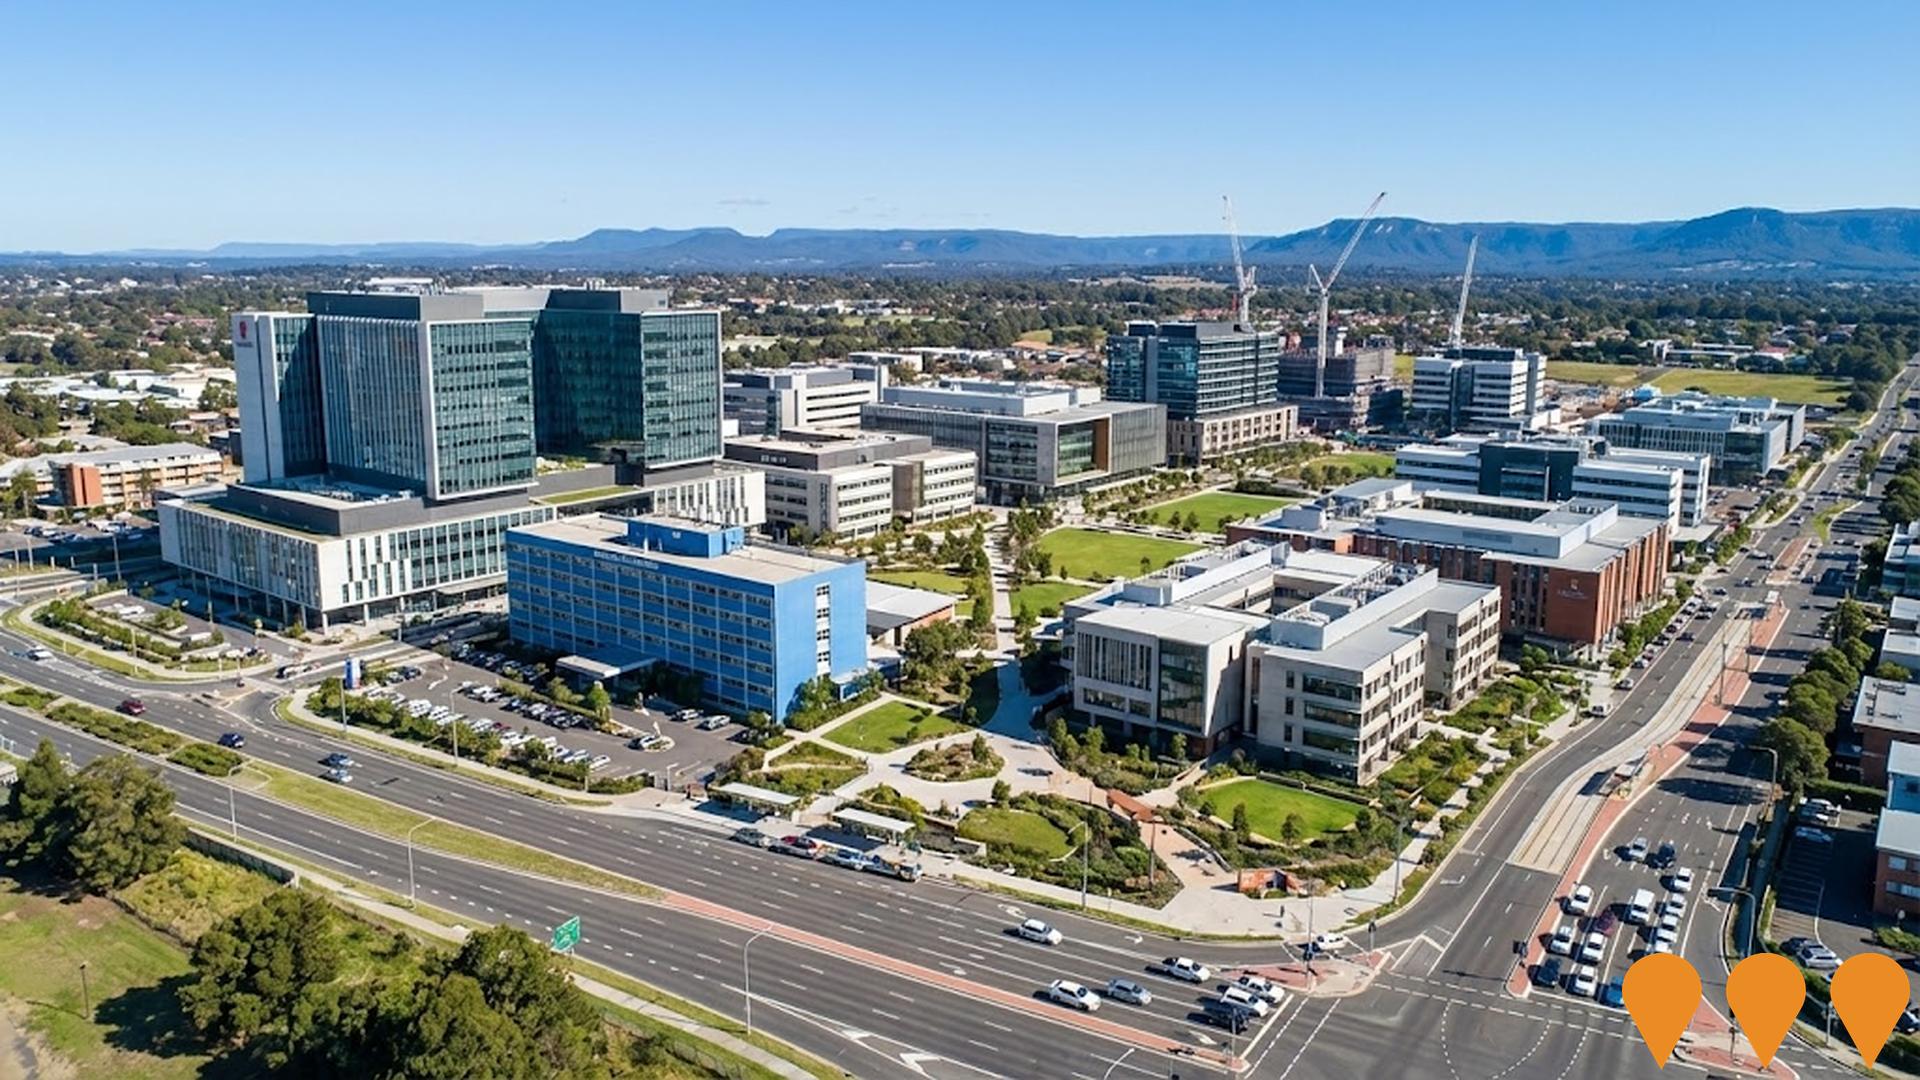
Nepean Hospital Redevelopment
A $1 billion redevelopment of Nepean Hospital including a new 14-storey hospital tower, expanding capacity for Western Sydney's growing population and creating thousands of jobs.

Stockland x Western Sydney University Mixed-Use Precinct
A 99-hectare mixed-use precinct at Western Sydney University's Werrington campus featuring new housing, 18+ hectares of open space, retail, commercial spaces, and a 'living laboratory' for research and innovation. Subject to rezoning and planning approvals.
Nepean Business Park
Transformation of a 47ha degraded former quarry site into a productive business park, providing local jobs while protecting and enhancing the environment, located 2km from Penrith CBD.

Cambridge Park North Precinct Rezoning
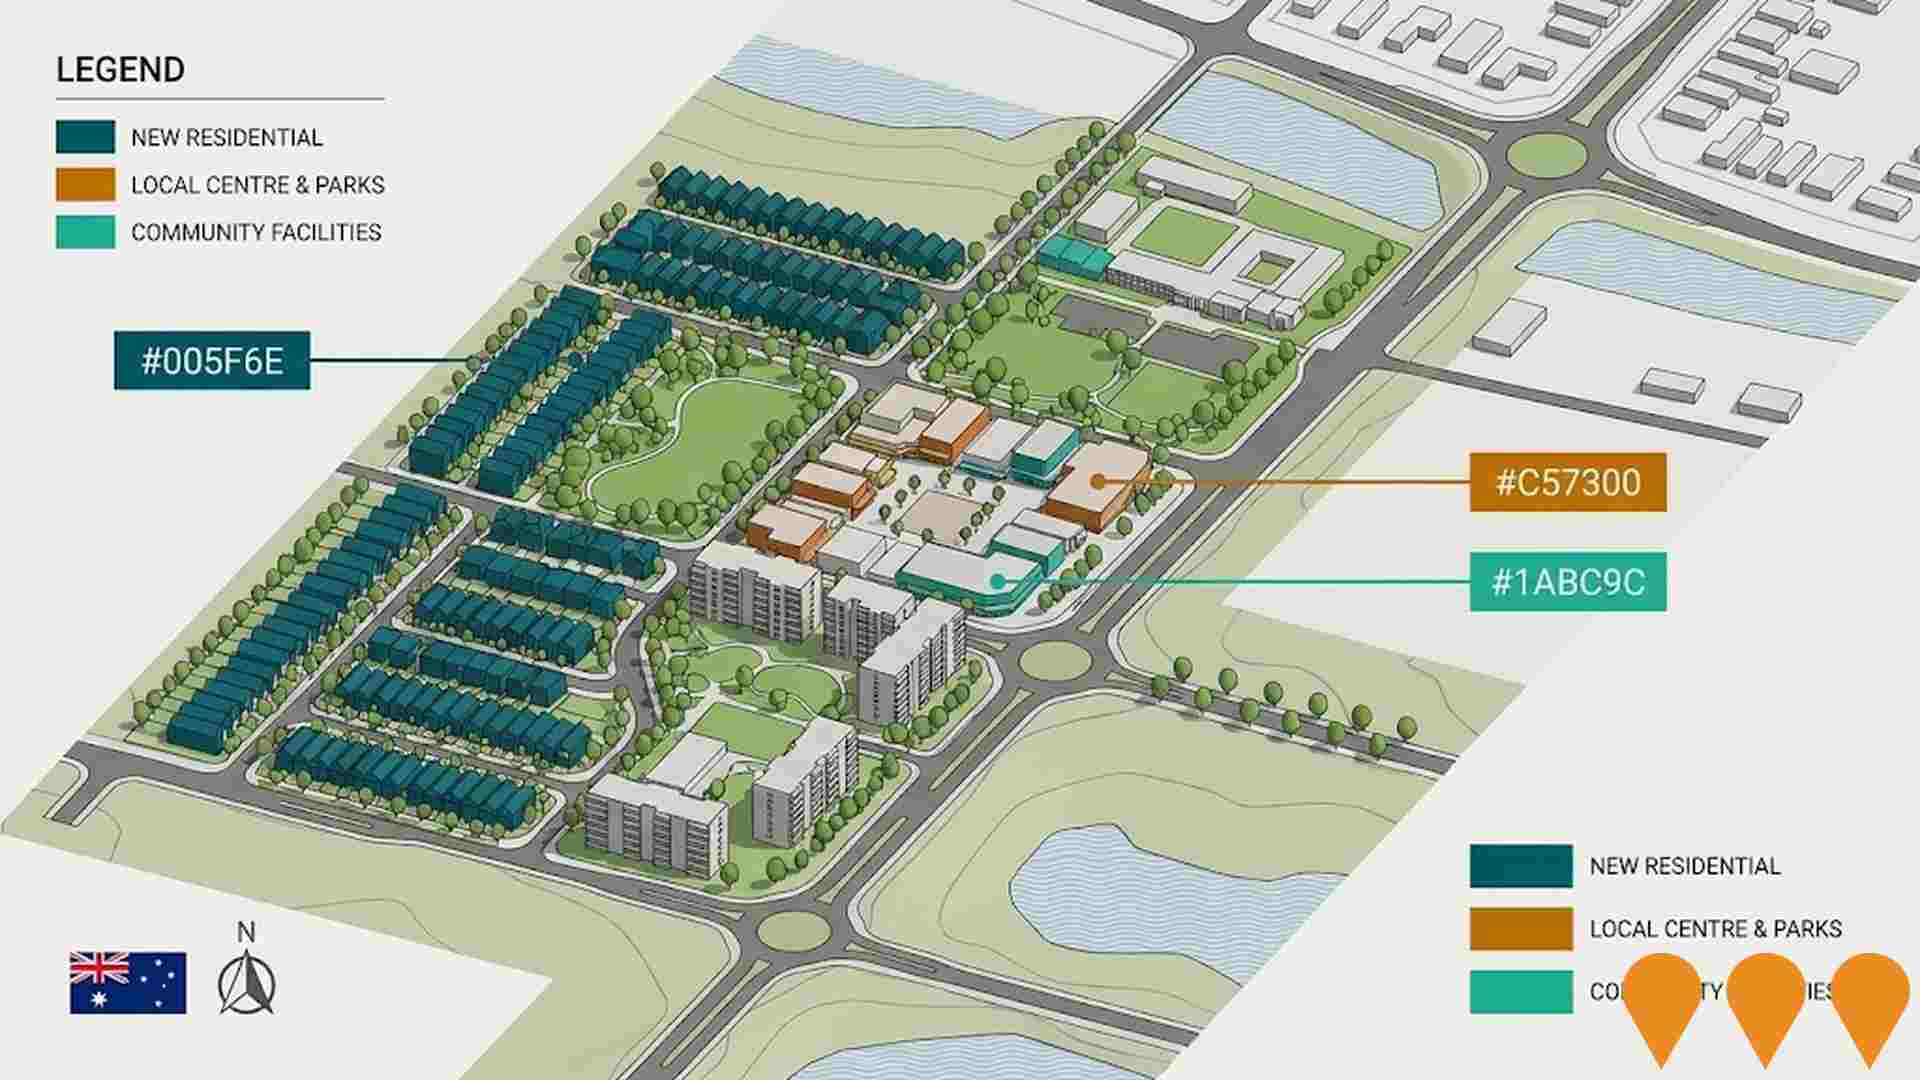
Major rezoning of approximately 50 hectares in Cambridge Park North to deliver up to 1,800 new dwellings, new local centre, parks and community facilities as part of the Glenmore Park to St Marys growth corridor.
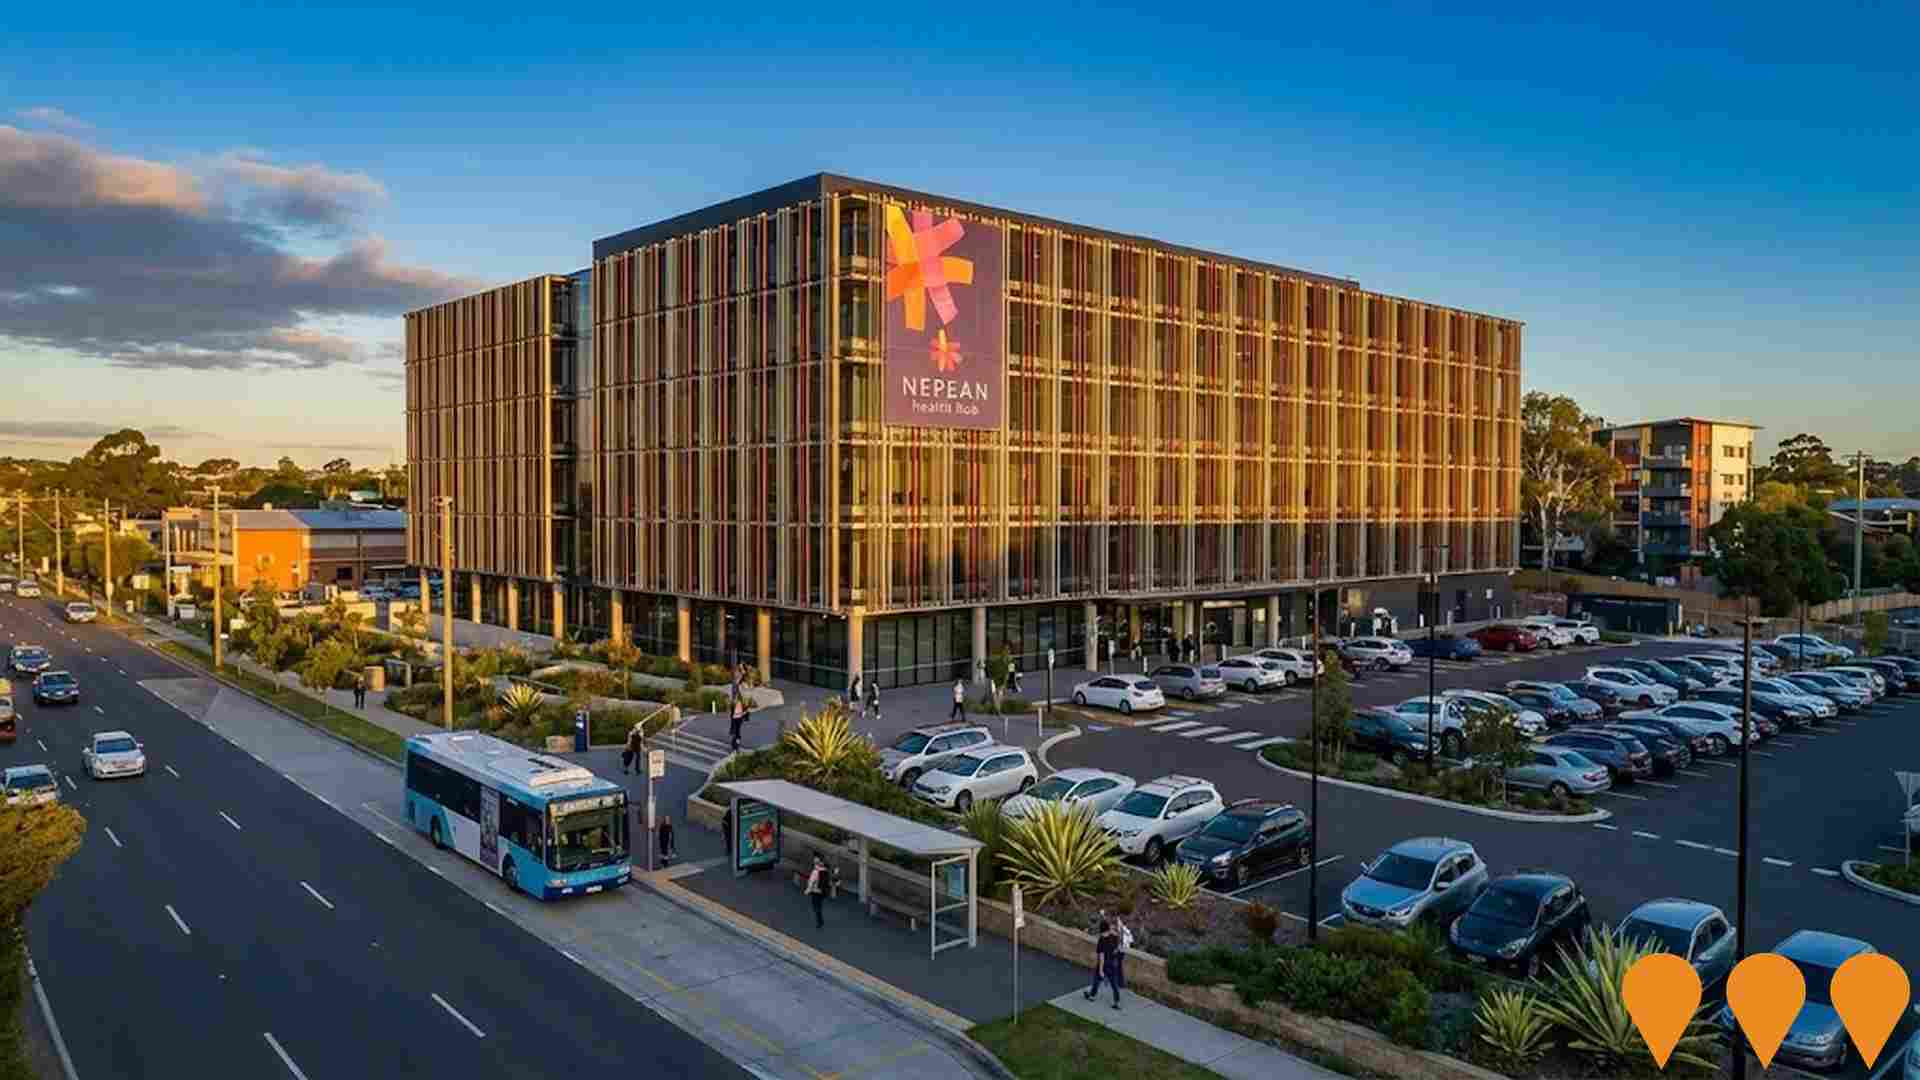
Nepean Health Hub
A $50 million, 6-storey health hub adjacent to Nepean Hospital providing space for GPs, specialists, research, allied health services, dental services, and diagnostic facilities.
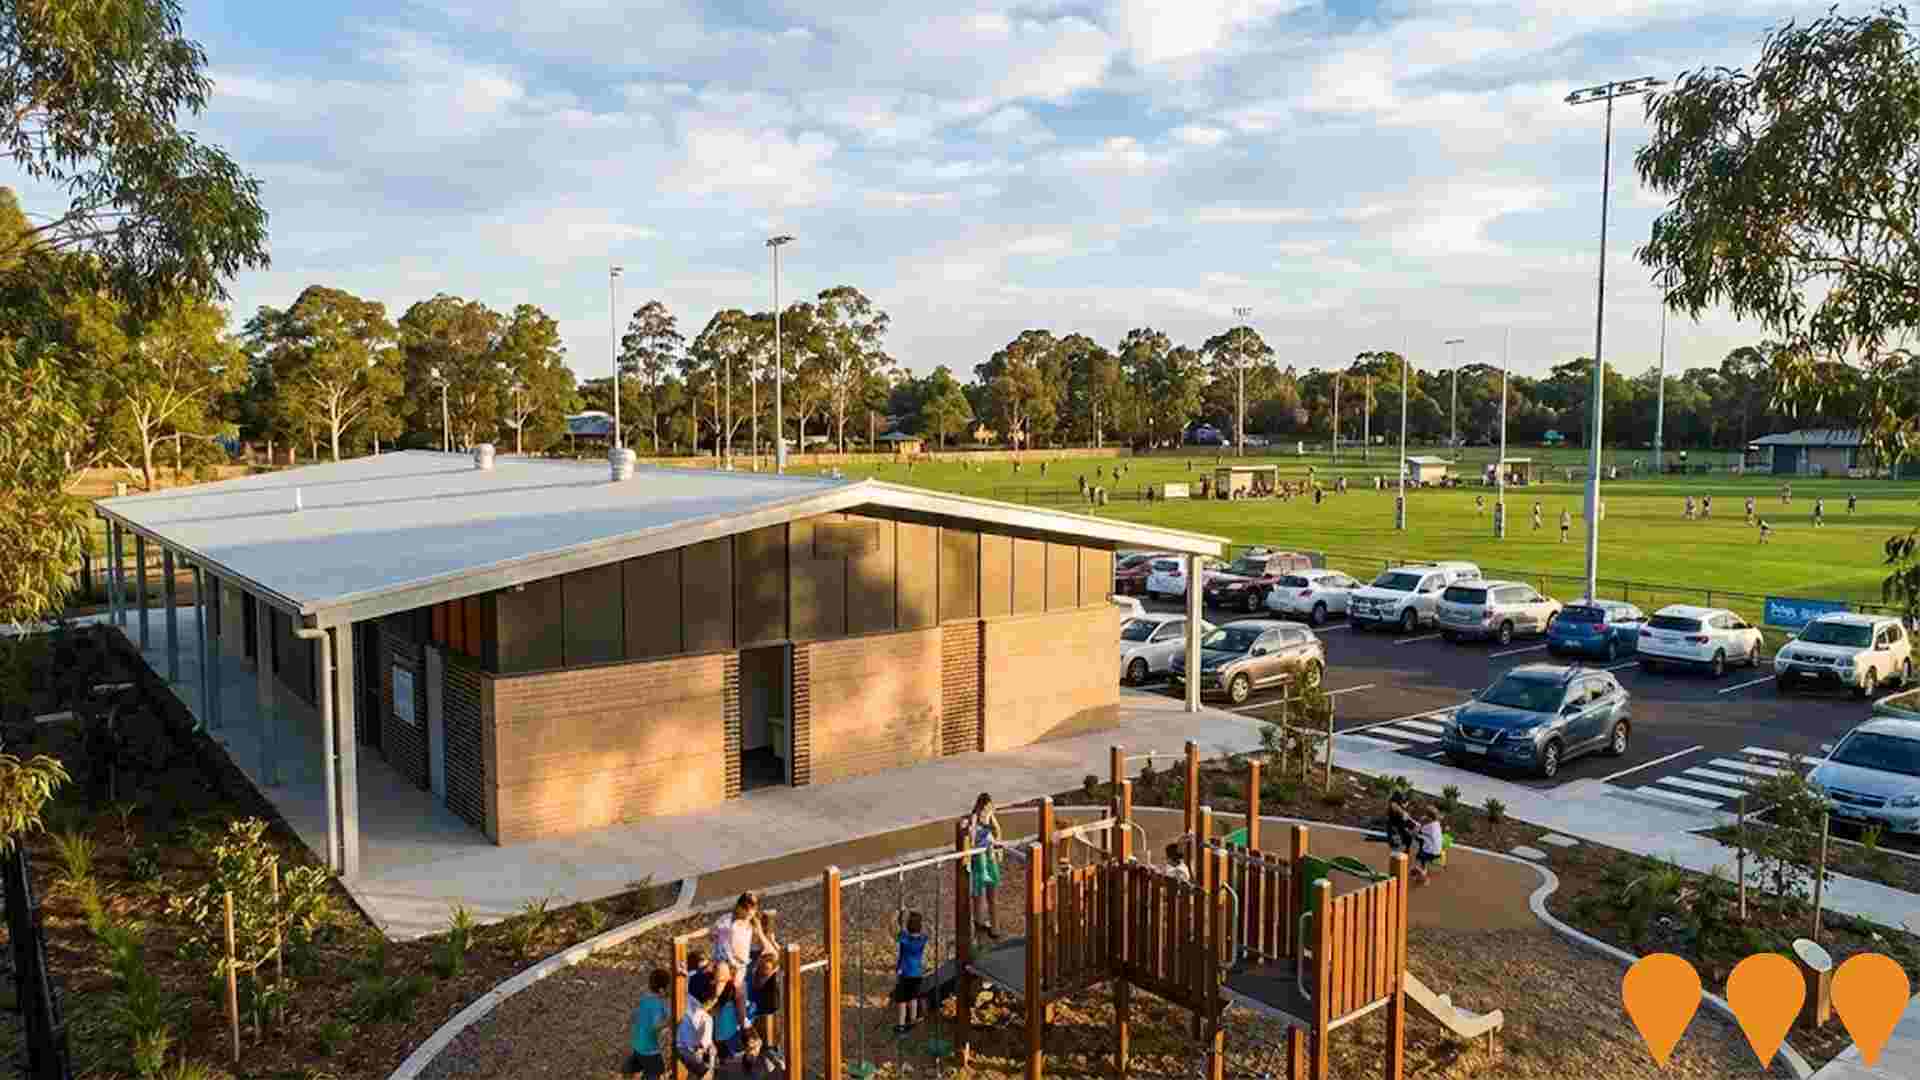
Parker Street Reserve Sport and Recreation Precinct
Multi-phase upgrade including new amenities building (completed 2023), playspace replacement, refurbishment of existing amenities building, car park resurfacing with accessible parking, drainage improvements, remediation of playing surfaces, landscaping and tree planting. Project delivers enhanced facilities for rugby league, cricket and athletics groups serving 200,000 annual visitors.
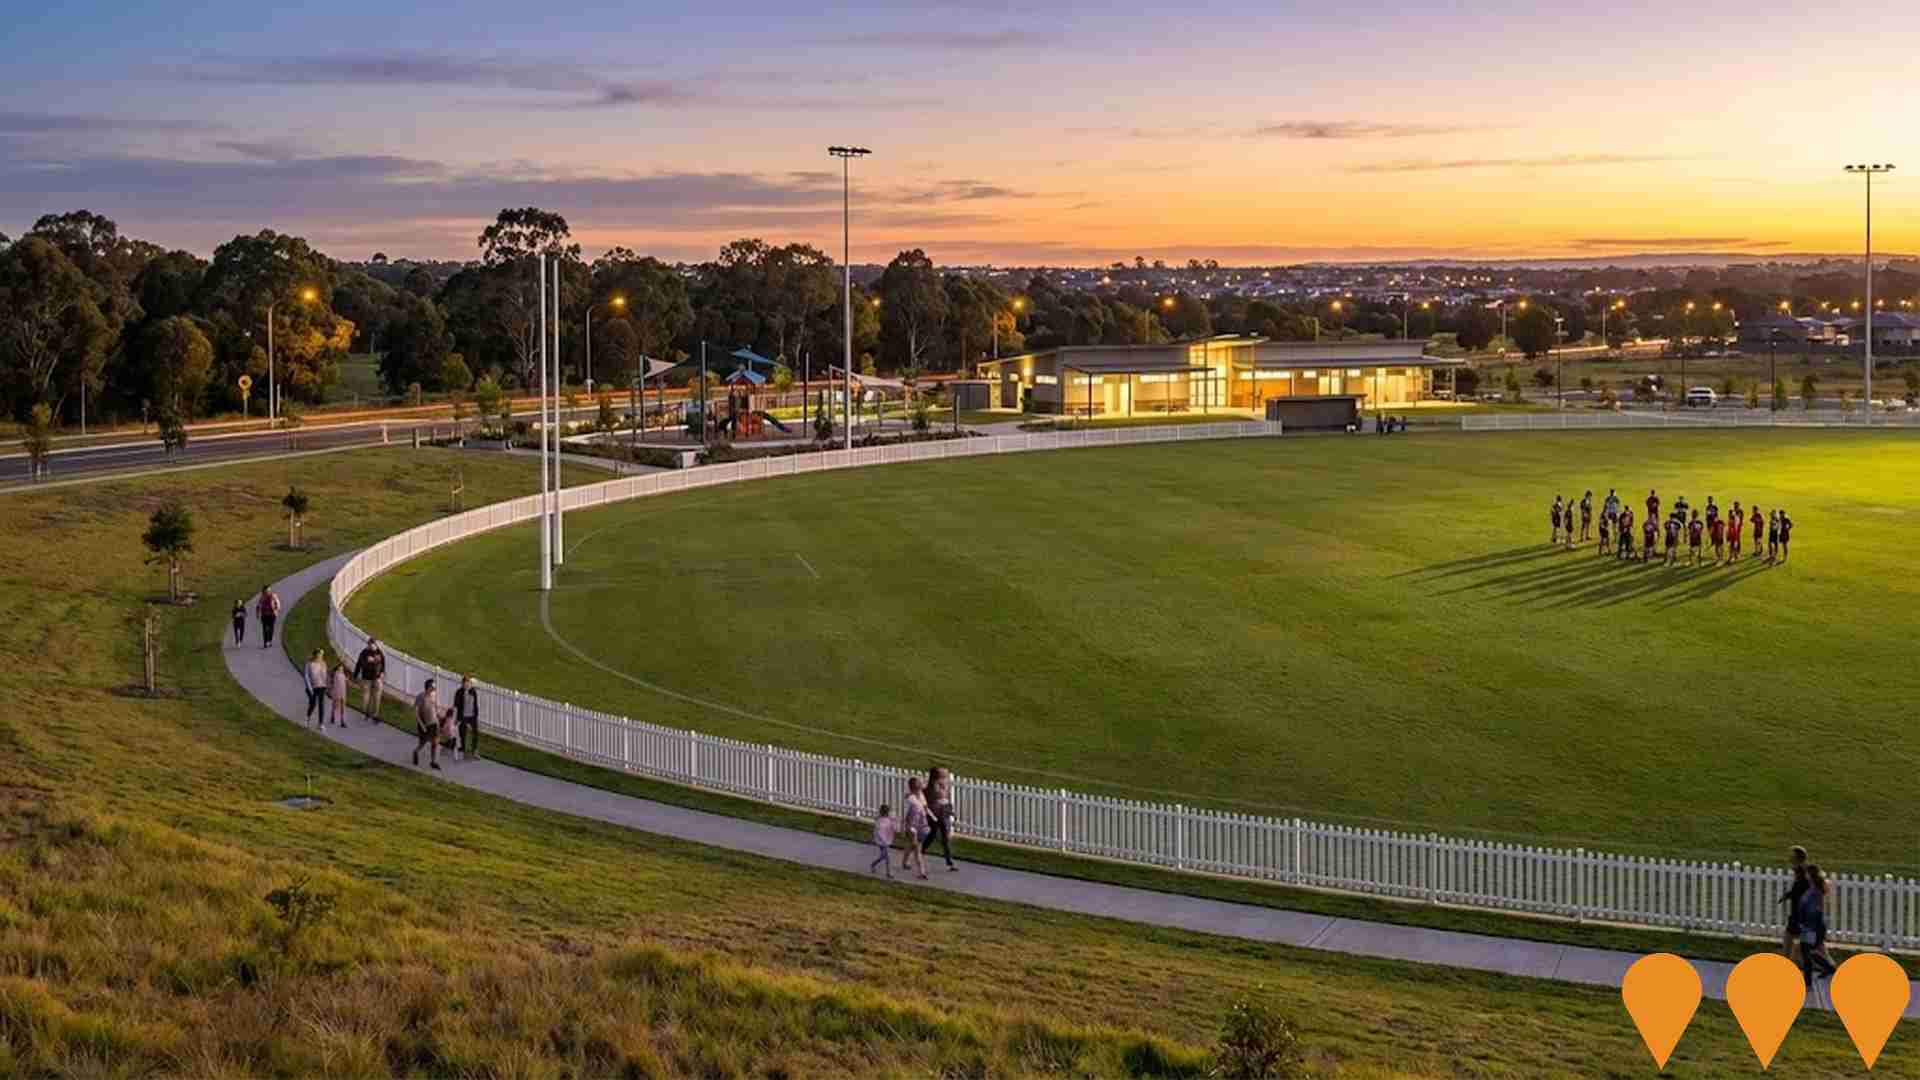
Caddens Hill Sports Precinct
Community sports precinct serving Caddens and Kingswood, delivered with Penrith City Council as part of the Caddens Hill development. Facilities include a fully irrigated multi-purpose sports field for cricket, soccer and AFL, a 150 m2 amenities building, children's playground, basketball half-court, netted cricket training area and a perimeter shared path accessible from Caddens Road.
Employment
While Cambridge Park retains a healthy unemployment rate of 3.3%, recent employment declines have impacted its national performance ranking
Cambridge Park had, as of September 2025, an unemployment rate of 3.3%. It has a balanced workforce spanning white and blue collar employment, with the construction sector notably represented.
There were 8,553 residents in work at this time, with an unemployment rate 0.9% lower than Greater Sydney's rate of 4.2%. Workforce participation was broadly similar to Greater Sydney's 60.0%. Key industries of employment among residents were construction, health care & social assistance, and retail trade. Construction had particularly notable concentration, with employment levels at 1.6 times the regional average.
Professional & technical services had limited presence, with 3.9% employment compared to 11.5% regionally. The area appeared to offer limited local employment opportunities, as indicated by Census data comparing working population and resident population. In the 12 months prior, labour force decreased by 4.0%, while employment declined by 3.3%, causing unemployment rate to fall by 0.7 percentage points. By comparison, Greater Sydney recorded employment growth of 2.1% and labour force growth of 2.4%, with unemployment rising slightly by 0.2 percentage points. State-level data to 25-Nov showed NSW employment contracted by 0.03% (losing 2,260 jobs), with the state unemployment rate at 3.9%. National employment forecasts from Jobs and Skills Australia, as of May-25, projected national employment growth of 6.6% over five years and 13.7% over ten years. Applying these projections to Cambridge Park's employment mix suggested local employment should increase by 6.2% over five years and 12.8% over ten years.
Frequently Asked Questions - Employment
Income
Income levels align closely with national averages, indicating typical economic conditions for Australian communities according to AreaSearch analysis
The Cambridge Park SA2's income level is below the national average according to the latest ATO data aggregated by AreaSearch for financial year 2022. The median income among taxpayers in Cambridge Park SA2 is $52,324 and the average income stands at $59,083. In comparison, Greater Sydney's median income is $56,994 and average income is $80,856. Based on Wage Price Index growth of 12.61% since financial year 2022, current estimates for Cambridge Park SA2 would be approximately $58,922 (median) and $66,533 (average) as of September 2025. According to the 2021 Census, household, family and personal incomes in Cambridge Park cluster around the 52nd percentile nationally. In terms of income distribution, 38.0% of individuals in Cambridge Park earn between $1,500 - 2,999, aligning with the metropolitan region where this cohort represents 30.9%. High housing costs consume 17.2% of income, yet strong earnings place disposable income at the 52nd percentile.
Frequently Asked Questions - Income
Housing
Cambridge Park is characterized by a predominantly suburban housing profile, with above-average rates of outright home ownership
Dwelling structure in Cambridge Park, as evaluated at the latest Census, comprised 92.3% houses and 7.7% other dwellings. In comparison, Sydney metro had 77.4% houses and 22.6% other dwellings. Home ownership in Cambridge Park was 30.3%, with mortgaged dwellings at 42.6% and rented at 27.0%. The median monthly mortgage repayment was $2,058, below Sydney metro's average of $2,167. Median weekly rent in Cambridge Park was $400, the same as Sydney metro's figure. Nationally, mortgage repayments in Cambridge Park were higher at $2,058 compared to Australia's average of $1,863, while rents were also higher at $400 versus Australia's average of $375.
Frequently Asked Questions - Housing
Household Composition
Cambridge Park features high concentrations of family households, with a lower-than-average median household size
Family households account for 77.7% of all households, including 33.7% couples with children, 25.6% couples without children, and 17.0% single parent families. Non-family households constitute the remaining 22.3%, with lone person households at 19.7% and group households comprising 2.6%. The median household size is 2.7 people, which is smaller than the Greater Sydney average of 2.8.
Frequently Asked Questions - Households
Local Schools & Education
Cambridge Park faces educational challenges, with performance metrics placing it in the bottom quartile of areas assessed nationally
The area's university qualification rate is 13.5%, significantly lower than Greater Sydney's average of 38.0%. This disparity presents both a challenge and an opportunity for targeted educational initiatives. Bachelor degrees are the most common, at 9.3%, followed by postgraduate qualifications (2.8%) and graduate diplomas (1.4%). Trade and technical skills are prominent, with 41.4% of residents aged 15+ holding vocational credentials – advanced diplomas at 9.7% and certificates at 31.7%.
Educational participation is high, with 29.5% of residents currently enrolled in formal education. This includes 11.3% in primary, 7.8% in secondary, and 3.1% in tertiary education.
Frequently Asked Questions - Education
Schools Detail
Nearby Services & Amenities
Transport
Transport servicing is moderate compared to other areas nationally based on assessment of service frequency, route connectivity and accessibility
Transport analysis in Cambridge Park shows 108 active transport stops, serving a mix of bus routes. These stops are covered by 41 individual routes, offering 1,484 weekly passenger trips collectively. Transport accessibility is rated excellent, with residents typically located 155 meters from the nearest stop.
Service frequency averages 212 trips per day across all routes, equating to approximately 13 weekly trips per individual stop.
Frequently Asked Questions - Transport
Transport Stops Detail
Health
Health performance in Cambridge Park is lower than average with common health conditions somewhat prevalent across both younger and older age cohorts
Cambridge Park faces significant health challenges, with common health conditions prevalent across both younger and older age cohorts. Private health cover is relatively low at approximately 49% of the total population (~8,043 people), compared to 53.8% across Greater Sydney (as of 2021). Nationally, the average private health cover stands at 55.3%.
The most common medical conditions in the area are asthma and mental health issues, impacting 9.7% and 9.0% of residents respectively, as per data from March 2021. Conversely, 64.7% of residents declared themselves completely clear of medical ailments, compared to 69.5% across Greater Sydney. The area has 16.5% of residents aged 65 and over (2,704 people), higher than the 14.1% in Greater Sydney as of March 2021. Health outcomes among seniors present some challenges, broadly in line with the general population's health profile.
Frequently Asked Questions - Health
Cultural Diversity
Cambridge Park ranks below the Australian average when compared to other local markets across a number of language and cultural background related metrics
Cambridge Park was found to be below average in terms of cultural diversity, with 82.9% of its population born in Australia, 88.9% being citizens, and 88.8% speaking English only at home. The main religion in Cambridge Park is Christianity, which makes up 56.2% of people in the suburb. This compares to 57.9% across Greater Sydney.
In terms of ancestry, the top three represented groups are Australian (29.3%), English (26.3%), and Other (7.3%). Notably, Maltese is overrepresented at 1.9%, compared to 2.9% regionally, Samoan at 1.0%, compared to 0.6%, and Australian Aboriginal at 5.2%, compared to 3.6%.
Frequently Asked Questions - Diversity
Age
Cambridge Park's population is younger than the national pattern
Cambridge Park's median age is 35 years, which is slightly younger than Greater Sydney's 37 years and somewhat younger than the national average of 38 years. The 5-14 age group comprises 14.1% of Cambridge Park's population, compared to Greater Sydney's figure. However, the 55-64 cohort makes up only 9.0%. Between 2021 and present, the 75-84 age group has increased from 3.7% to 5.3%, while the 55-64 cohort has decreased from 11.1% to 9.0%. By 2041, population forecasts indicate significant demographic changes for Cambridge Park. The 85+ age cohort is projected to grow by 421 people (191%), from 221 to 643. Notably, the combined 65+ age groups will account for 62% of total population growth, reflecting the area's aging demographic profile. In contrast, both the 5-14 and 0-4 age groups are expected to decrease in number.
