Chart Color Schemes
This analysis uses ABS Statistical Areas Level 2 (SA2) boundaries, which can materially differ from Suburbs and Localities (SAL) even when sharing similar names.
SA2 boundaries are defined by the Australian Bureau of Statistics and are designed to represent communities for statistical reporting (e.g., census and ERP).
Suburbs and Localities (SAL) represent commonly-used suburb/locality names (postal-style areas) and may use different geographic boundaries. For comprehensive analysis, consider reviewing both boundary types if available.
est. as @ -- *
ABS ERP | -- people | --
2021 Census | -- people
Sales Activity
Curious about local property values? Filter the chart to assess the volume and appreciation (including resales) trends and regional comparisons, or scroll to the map below view this information at an individual property level.
Find a Recent Sale
Sales Detail
Population
An assessment of population growth drivers in West Wodonga reveals an overall ranking slightly below national averages considering recent, and medium term trends
West Wodonga's population is approximately 15,782 as of November 2025. This figure represents an increase of 386 people, equating to a 2.5% rise since the 2021 Census, which recorded a population of 15,396. The change is inferred from the estimated resident population of 15,650 in June 2024 and an additional 100 validated new addresses since the Census date. This results in a density ratio of 102 persons per square kilometer. West Wodonga's growth rate since the census places it within 1.7 percentage points of its SA3 area (4.2%), indicating competitive growth fundamentals. Overseas migration contributed approximately 54.6% of overall population gains during recent periods, driving primary growth in the area.
AreaSearch is adopting ABS/Geoscience Australia projections for each SA2 area, released in 2024 with a base year of 2022. For areas not covered by this data, AreaSearch utilises the VIC State Government's Regional/LGA projections from 2023, adjusting using weighted aggregation methods to SA2 levels. Growth rates by age group are applied across all areas for years 2032 to 2041. Population projections indicate an above median growth in non-metropolitan areas nationally. West Wodonga is expected to grow by 3,318 persons to 2041 based on the latest annual ERP population numbers, reflecting a total gain of 20.2% over the 17-year period.
Frequently Asked Questions - Population
Development
AreaSearch analysis of residential development drivers sees West Wodonga recording a relatively average level of approval activity when compared to local markets analysed countrywide
West Wodonga has received around 72 dwelling approvals per year over the past five financial years, totalling 364 homes. As of FY-26, 24 approvals have been recorded. On average, 0.9 new residents settle annually for each dwelling constructed between FY-21 and FY-25. This suggests that supply meets or exceeds demand, offering more buyer choices while supporting potential population growth.
The average construction cost per dwelling is $304,000. In FY-26, West Wodonga has seen $12.9 million in commercial approvals, indicating moderate commercial development activity. Comparatively, West Wodonga shows approximately 68% of the construction activity per person when compared to the Rest of Vic., and it ranks among the 47th percentile nationally for areas assessed.
This results in relatively constrained buyer choice, supporting interest in existing dwellings. New developments comprise 91.0% standalone homes and 9.0% medium to high-density housing, preserving West Wodonga's low-density nature and attracting space-seeking buyers. The area has an estimated 350 people per dwelling approval, reflecting its quiet development environment. According to the latest AreaSearch quarterly estimate, West Wodonga is projected to add 3,186 residents by 2041. If current construction levels persist, housing supply may lag population growth, potentially intensifying buyer competition and driving price growth.
Frequently Asked Questions - Development
Infrastructure
West Wodonga has emerging levels of nearby infrastructure activity, ranking in the 36thth percentile nationally
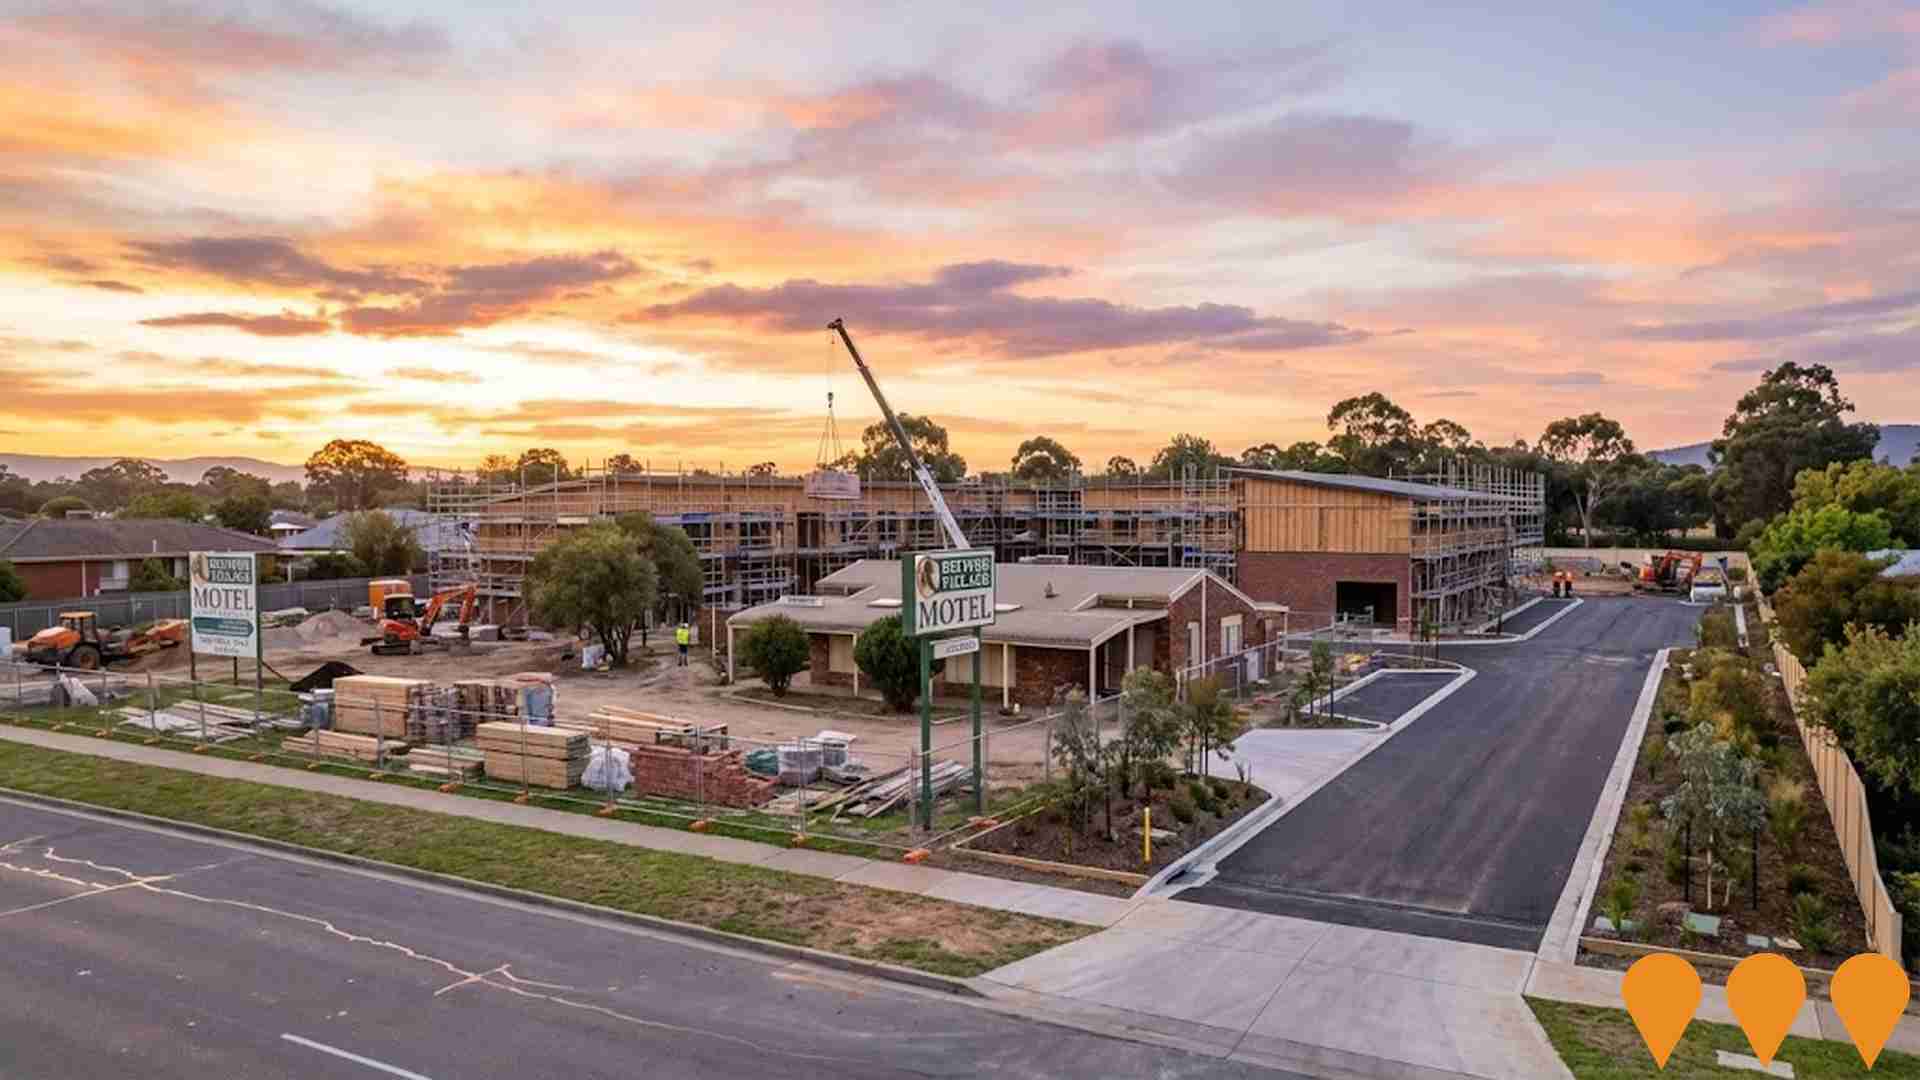
The performance of an area can significantly be influenced by changes in local infrastructure, major projects, and planning initiatives. AreaSearch has identified a total of 21 such projects that could potentially impact the area. Notable among these are the Wodonga Wastewater Treatment Plant Expansion, Mars Wodonga Solar Thermal Plant, Belvoir Village Motel Expansion - Additional 20 Motel Units, and Hydrogen Park Murray Valley (HyP Murray Valley). The following list provides details on those projects likely to be most relevant.
Professional plan users can use the search below to filter and access additional projects.
INFRASTRUCTURE SEARCH
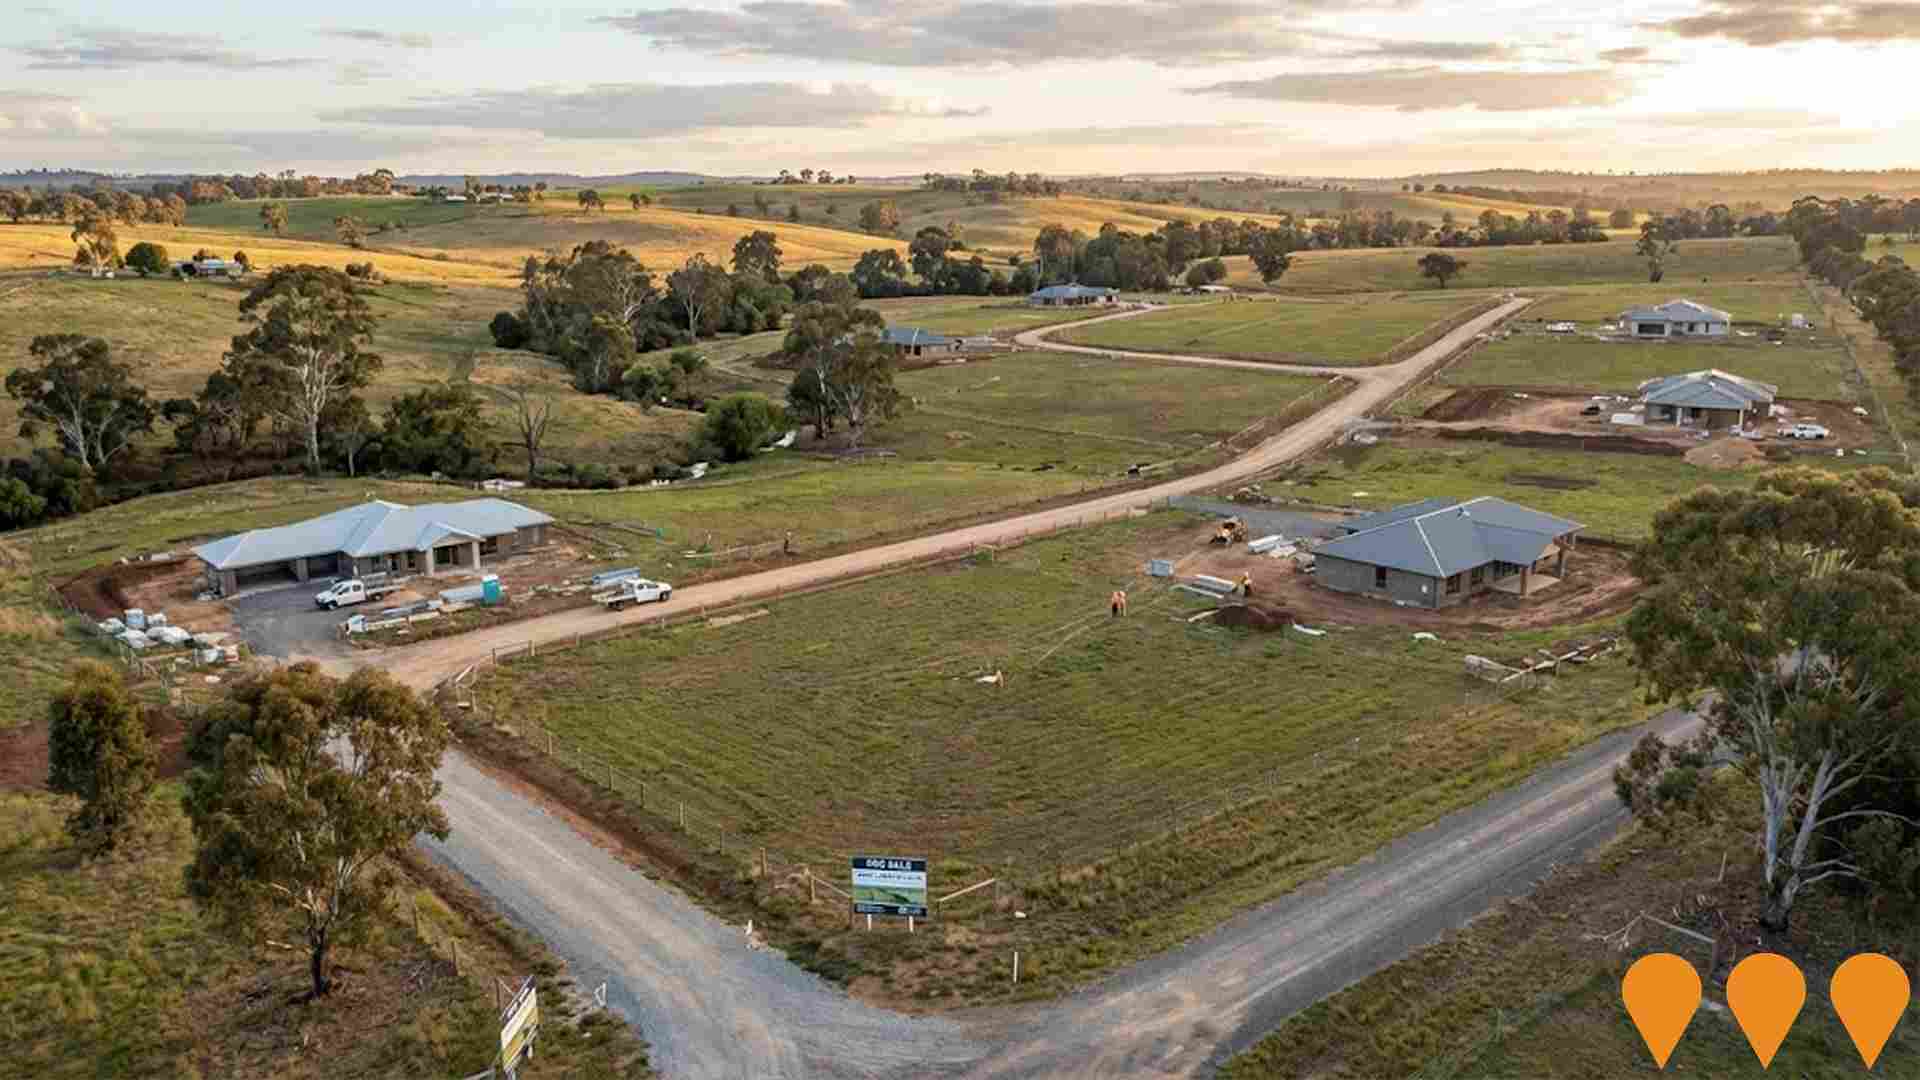
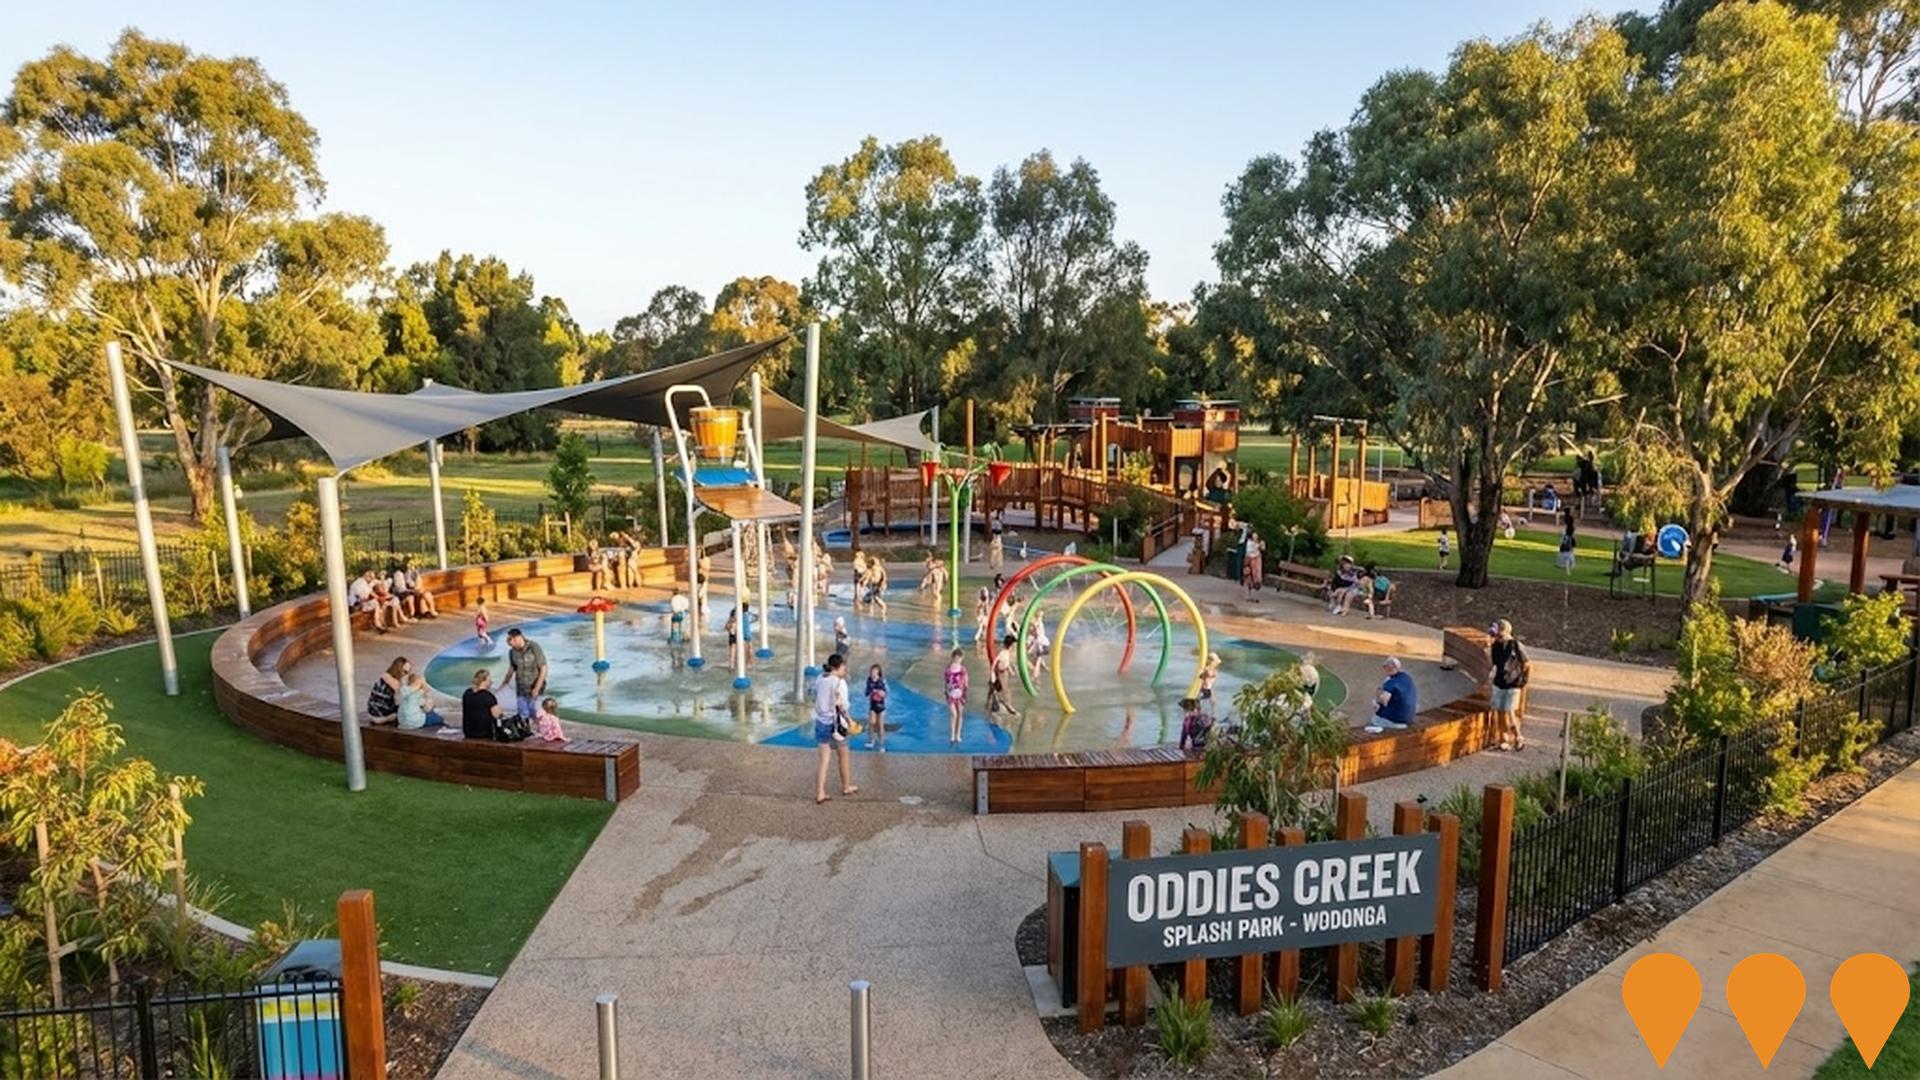
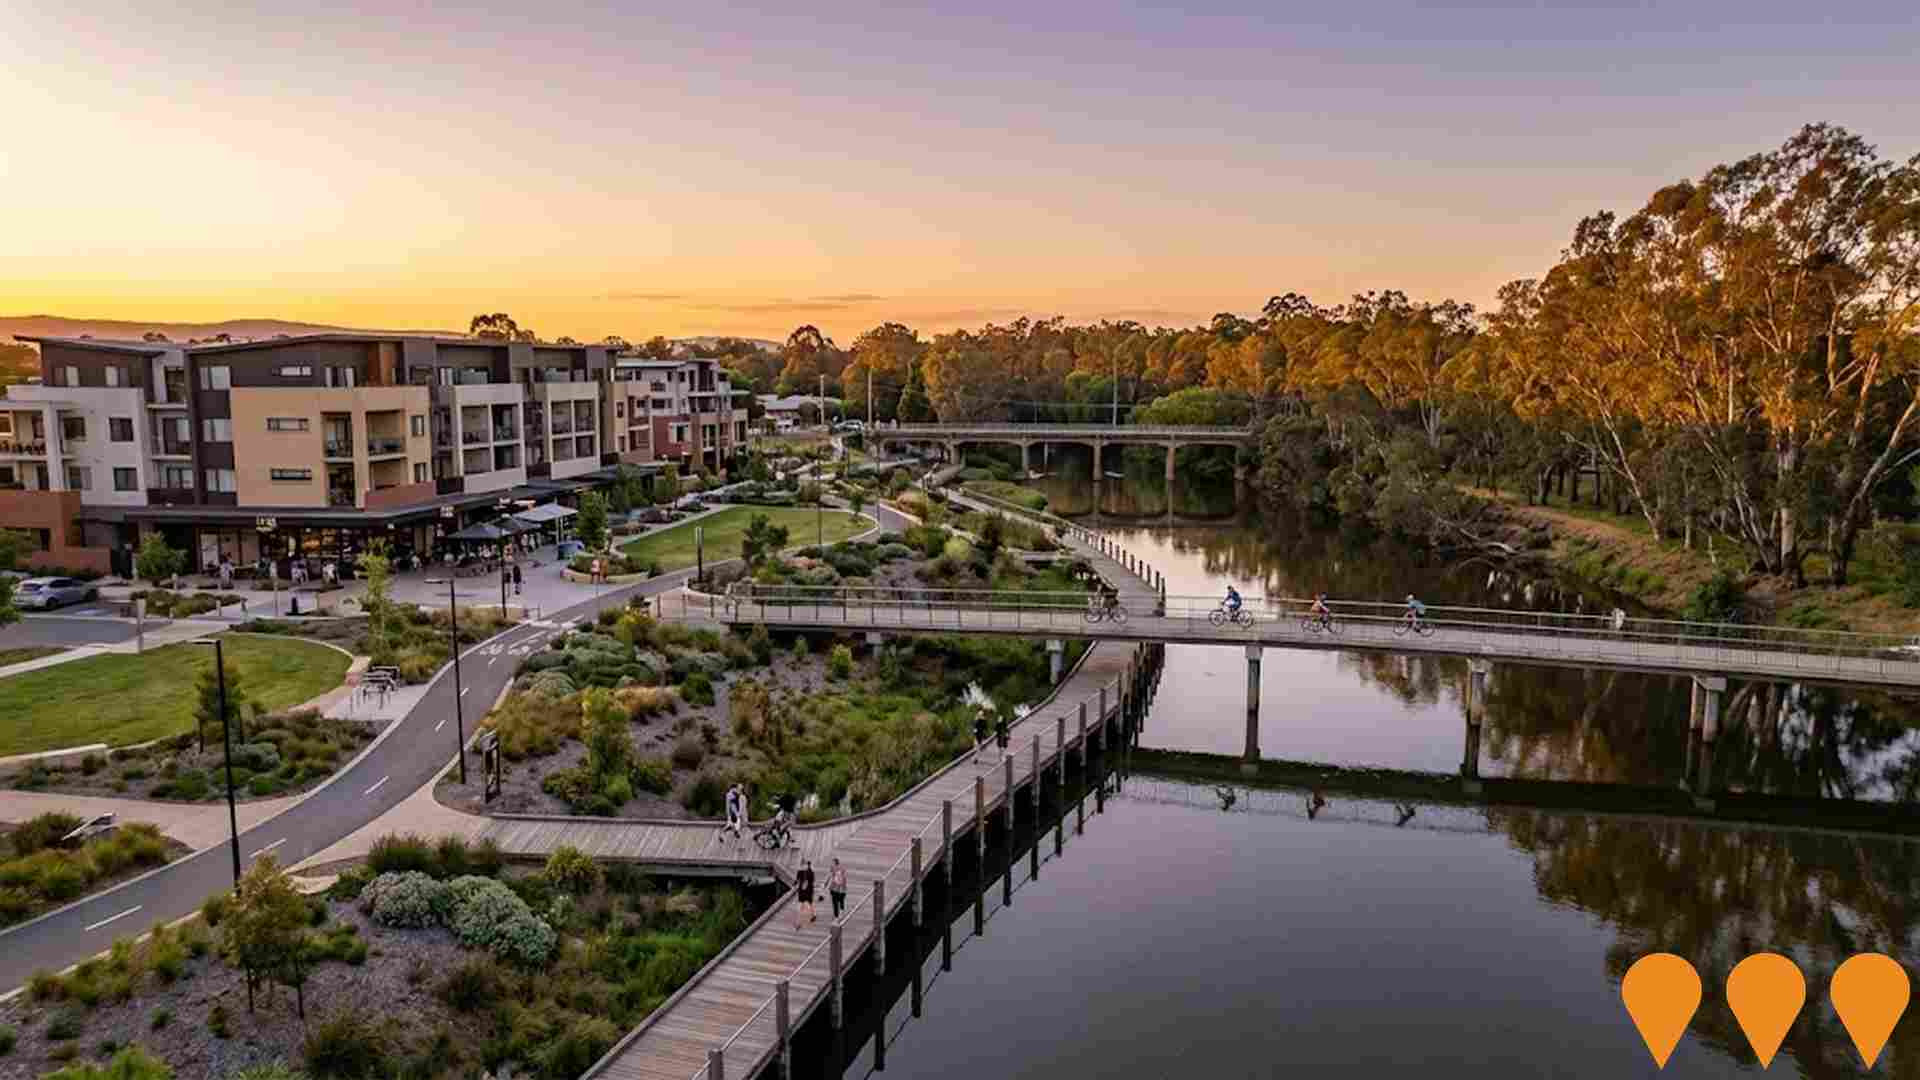
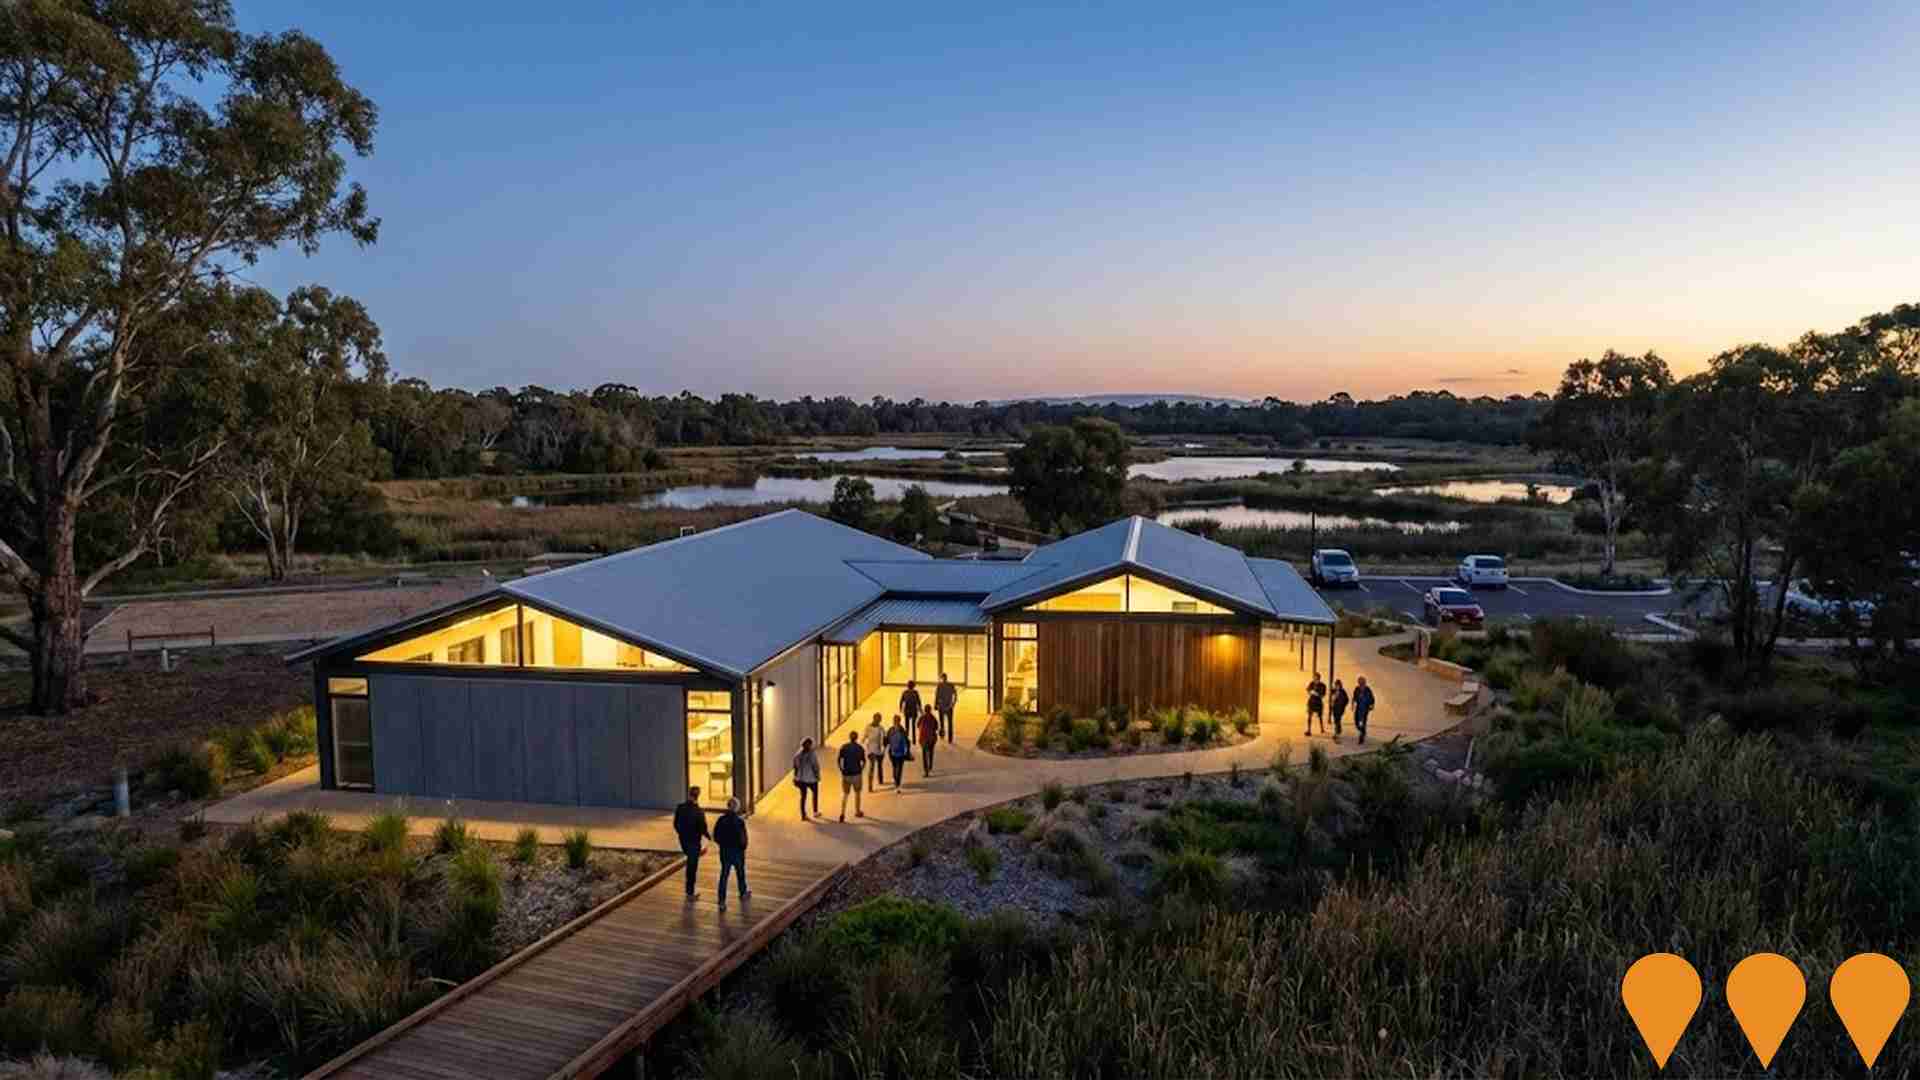
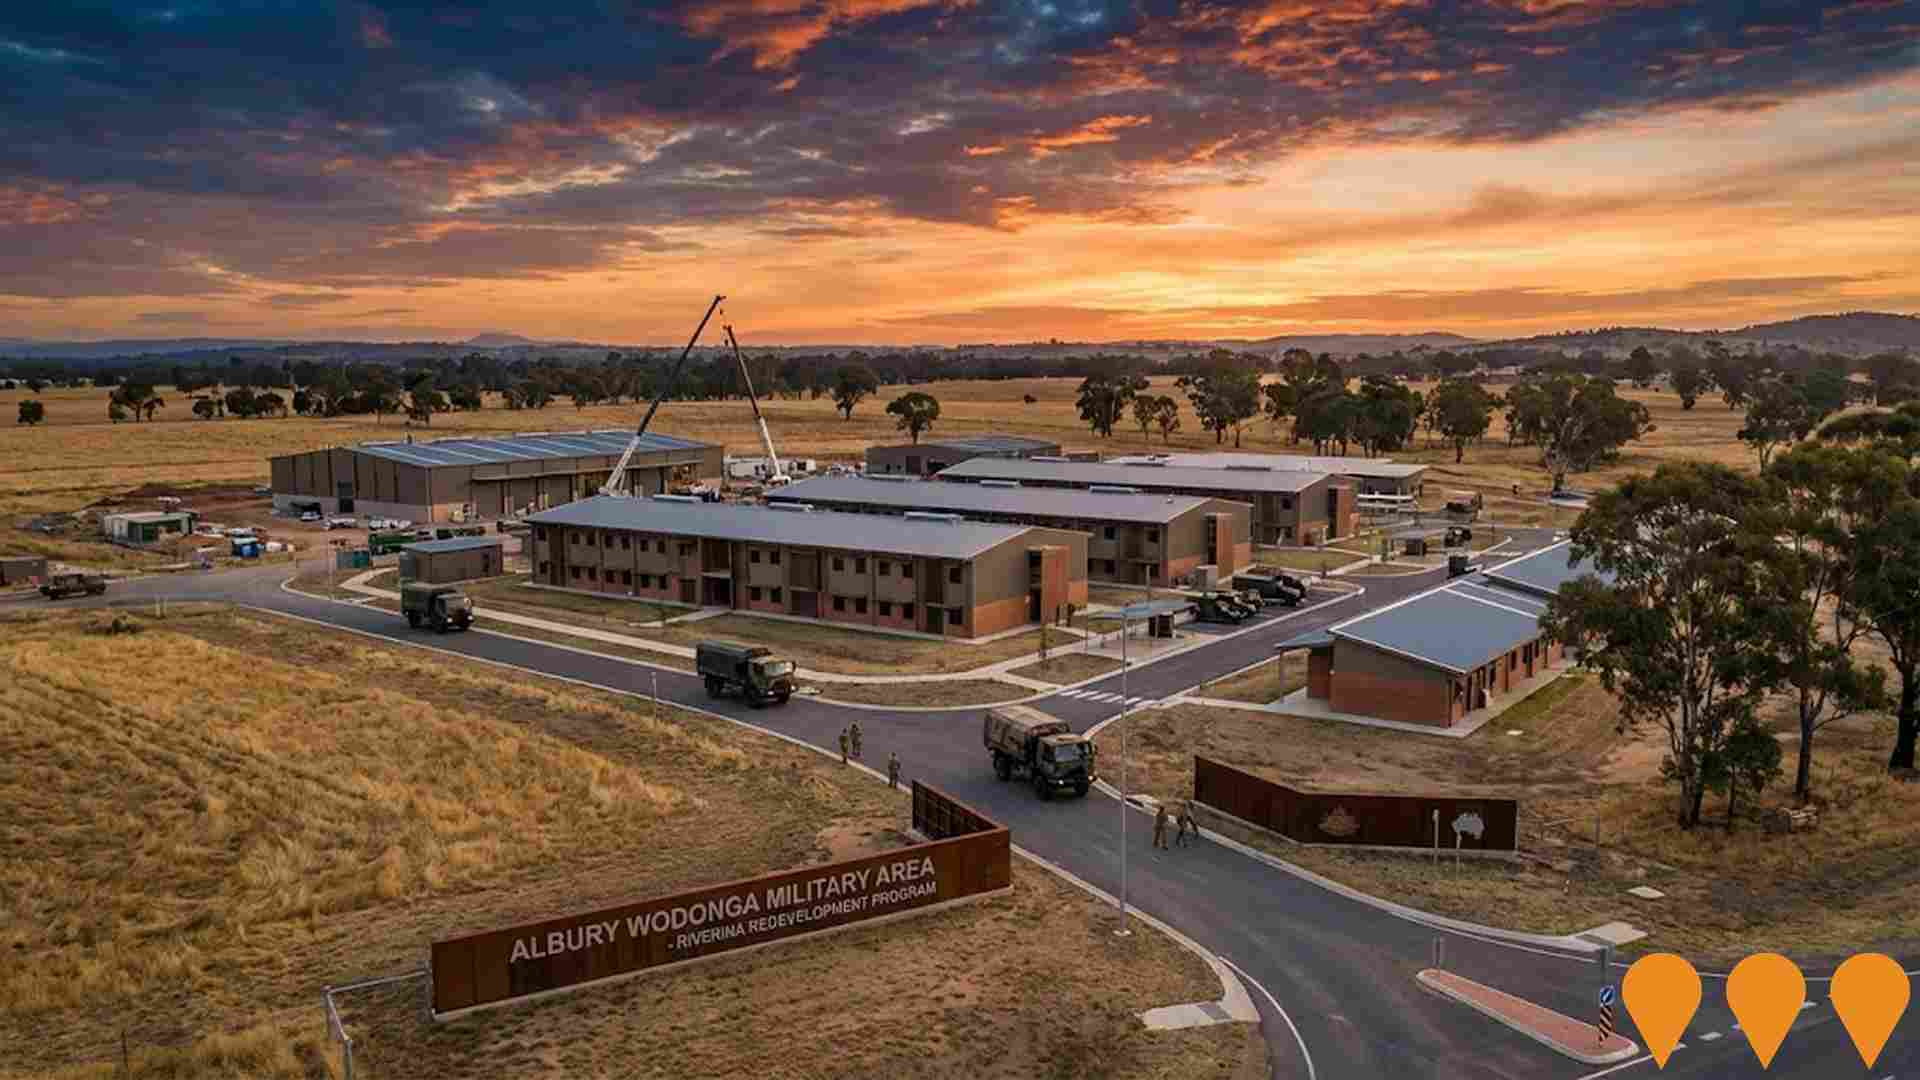
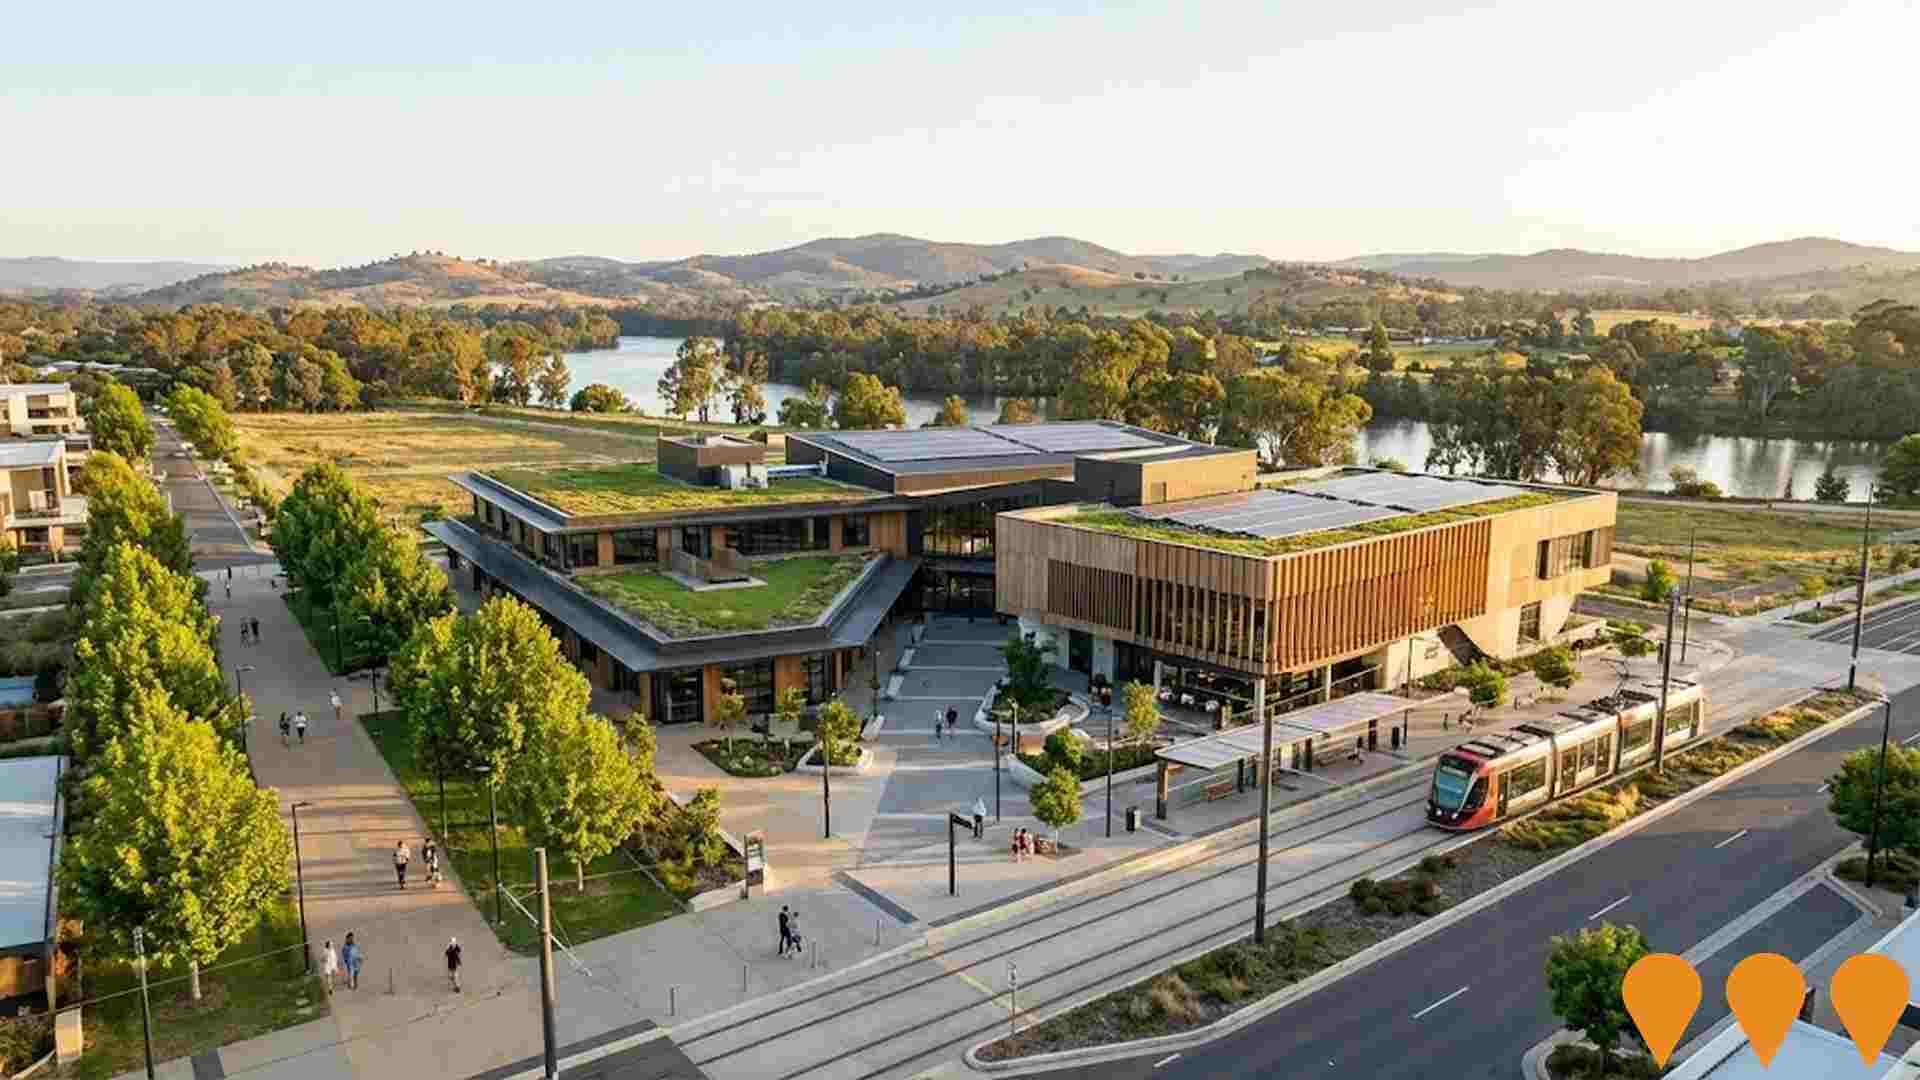
 Denotes AI-based impression for illustrative purposes only, not to be taken as definitive under any circumstances. Please follow links and conduct other investigations from the project's source for actual imagery. Developers and project owners wishing us to use original imagery please Contact Us and we will do so.
Frequently Asked Questions - Infrastructure
Towards Albury 2050 Community Strategic Plan
The finalized Community Strategic Plan for Albury (2022-2050), developed with and for the community, providing a long-term vision and priorities for the city under four key themes: A Growing Sustainable Economy, An Enhanced Natural Environment, A Caring Community, and A Leading Community. It guides all council and partner strategies and plans to achieve the community's vision.
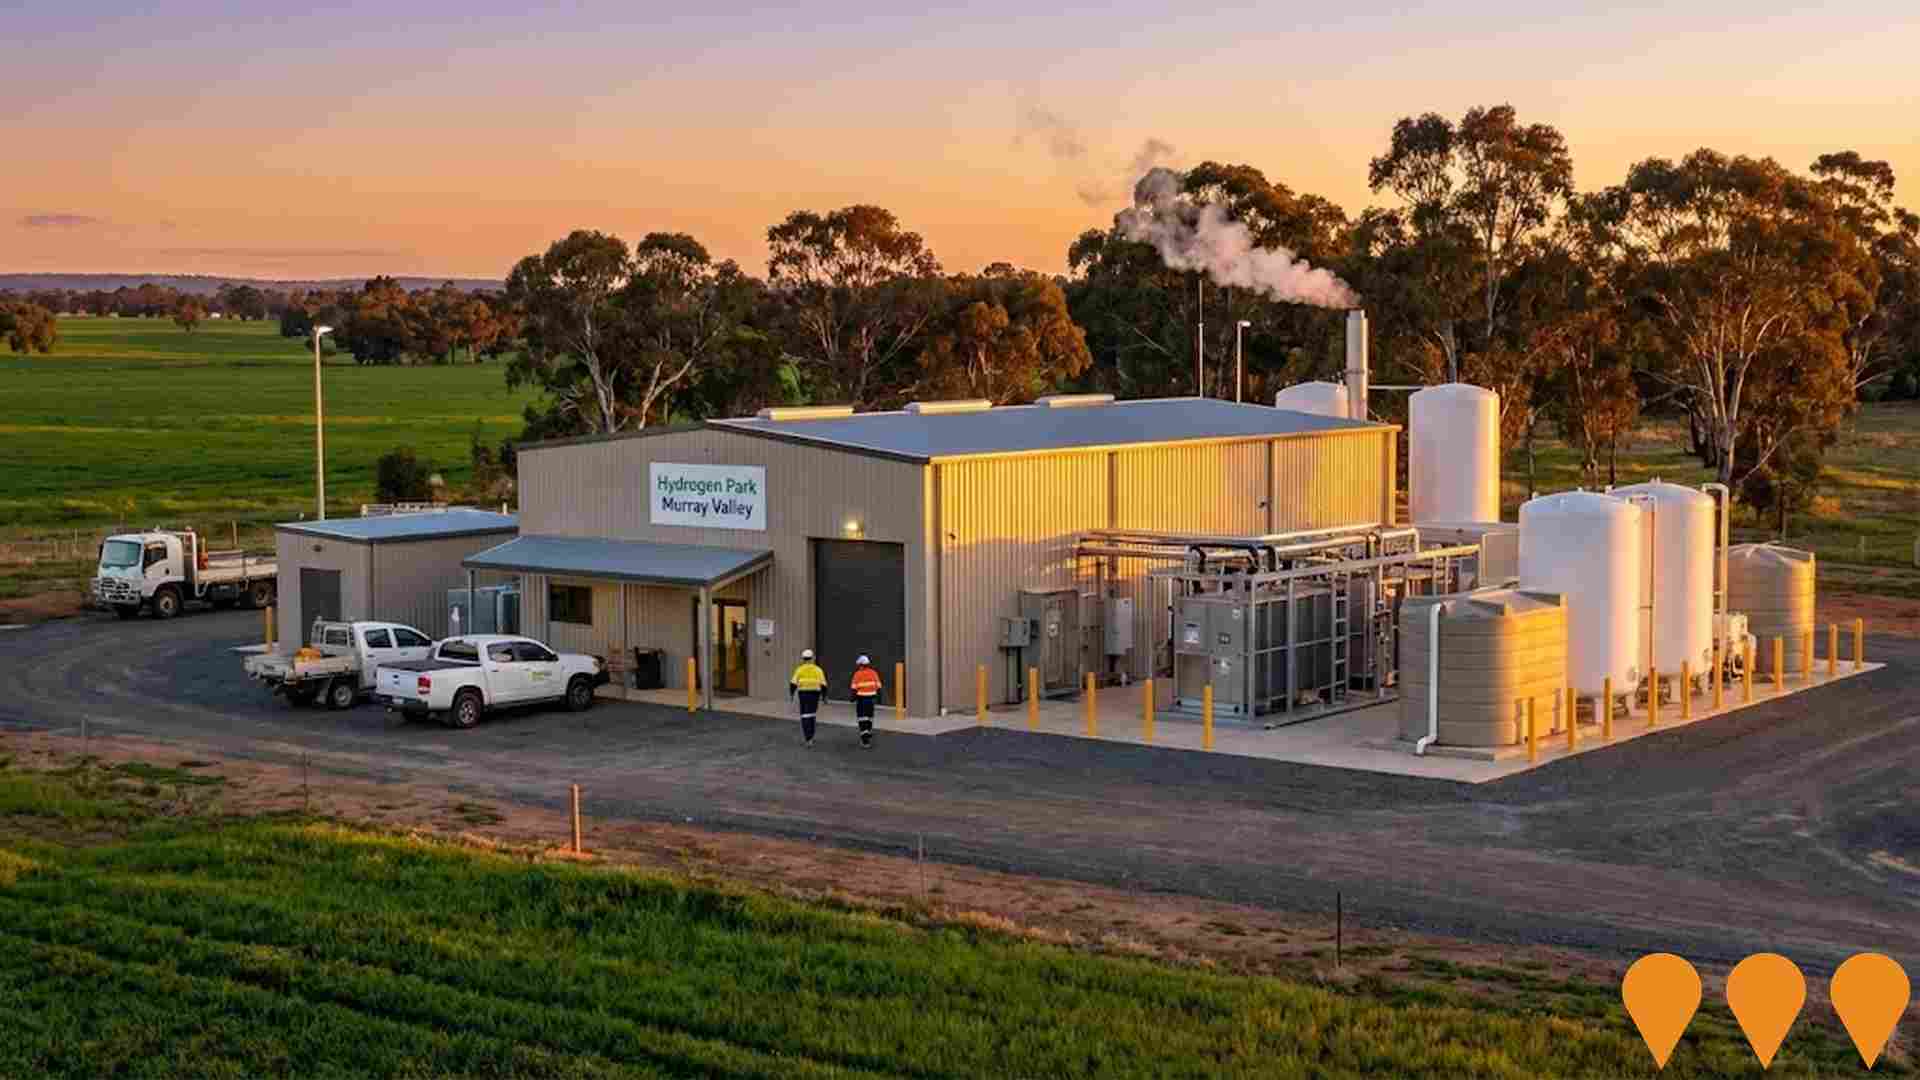
Hydrogen Park Murray Valley (HyP Murray Valley)
A 10 MW renewable hydrogen production facility using solar-powered electrolysis. Produces green hydrogen that is blended at up to 10% into the local Albury-Wodonga gas network, serving over 40,000 customers. Officially opened in September 2024 and now fully operational.
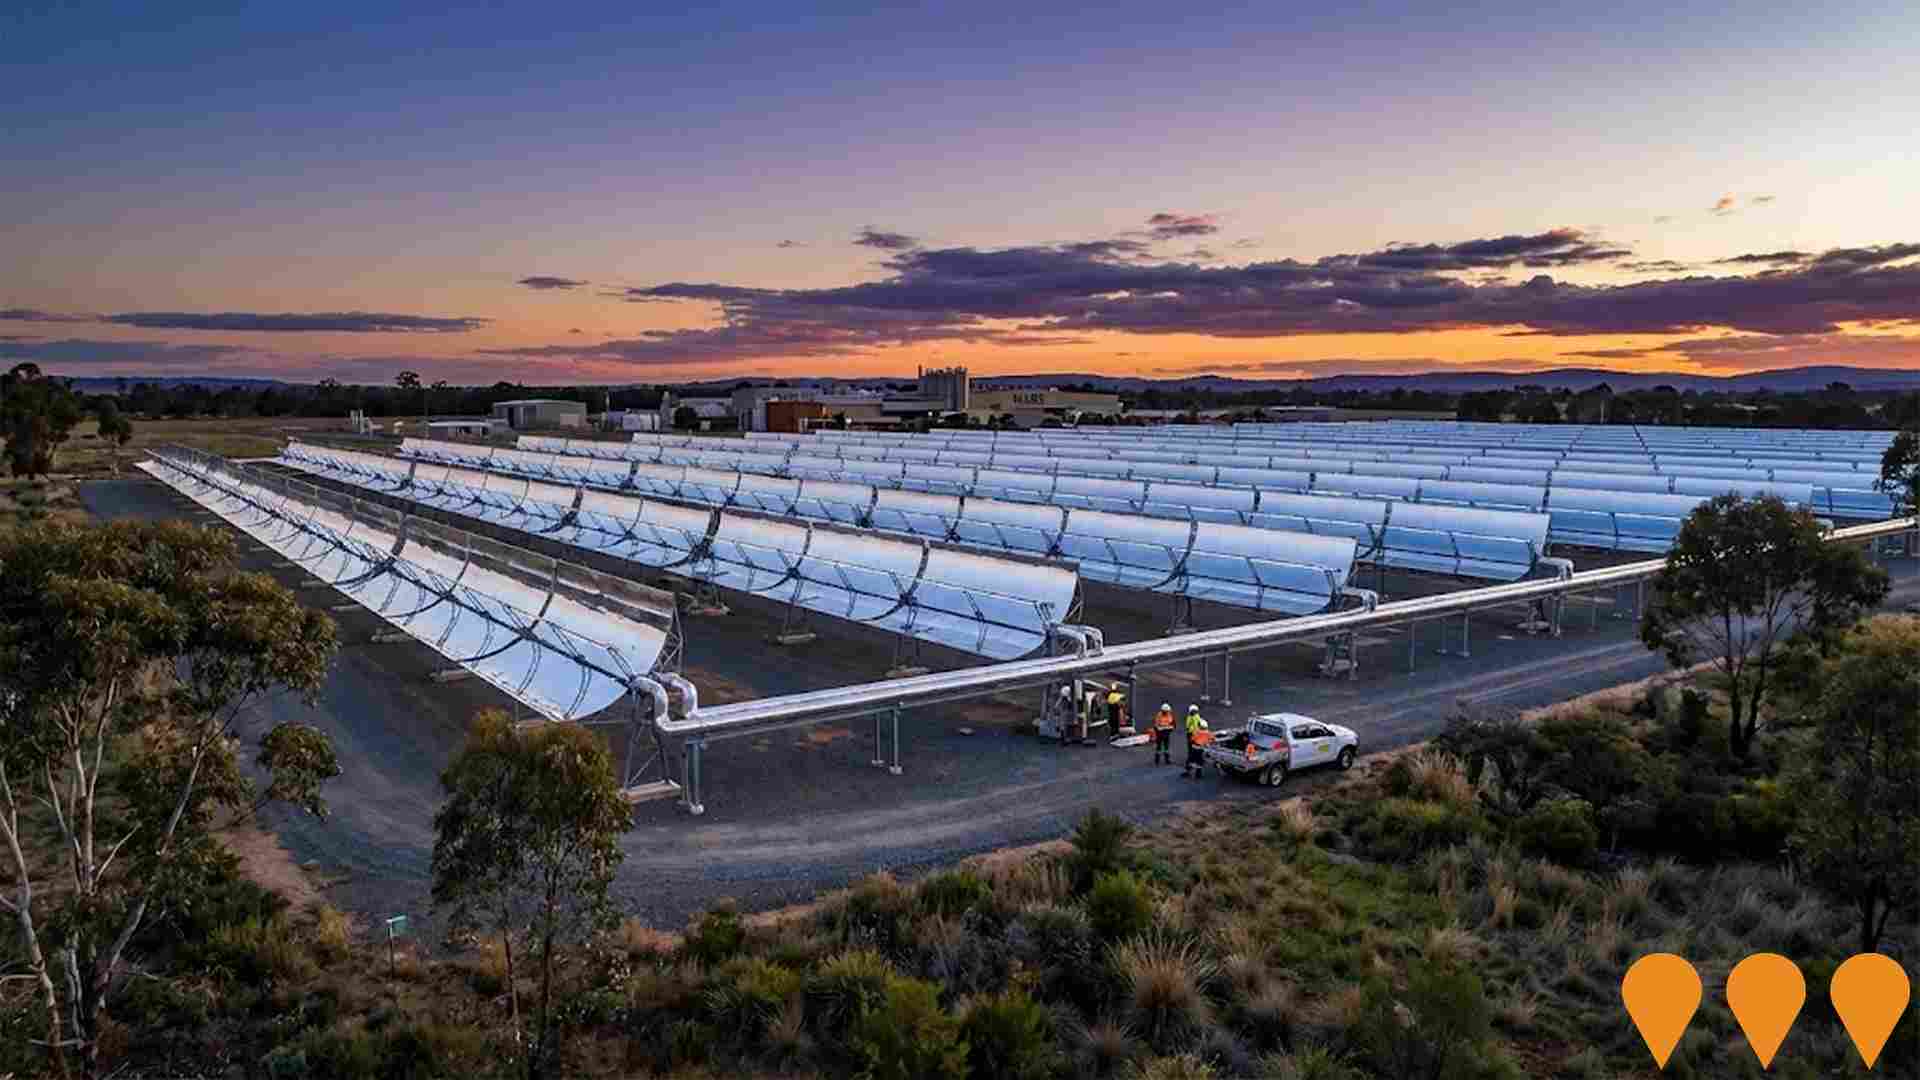
Mars Wodonga Solar Thermal Plant
Australia's first commercial deployment of parabolic trough concentrated solar thermal (CST) technology. The $39.3 million project includes an 18-megawatt CST plant providing up to 10 hours of thermal energy storage for cooking pet food. Combined with electric thermal energy storage (eTES) and renewable gas certificates, it will make Mars Wodonga the first large-scale steam-based manufacturing site in Australia to operate on 100% renewable energy by 2026.
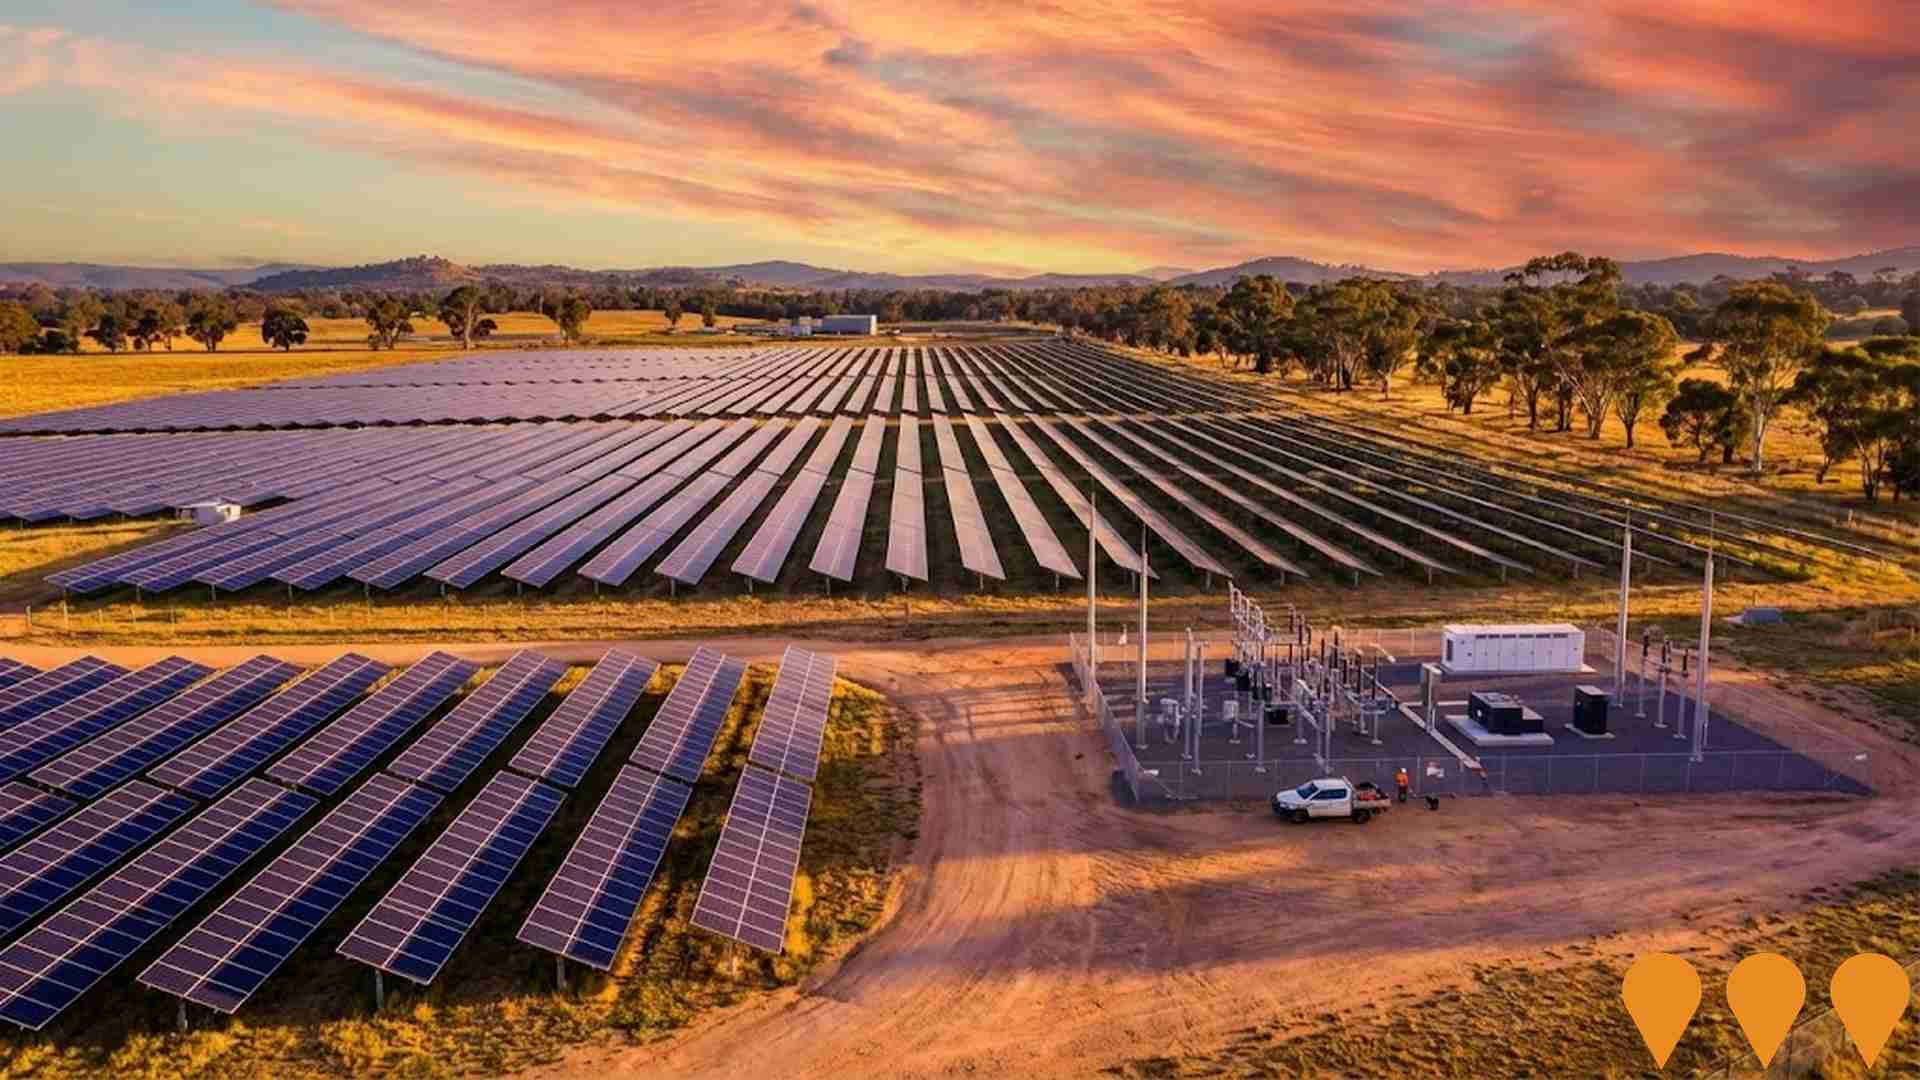
Wodonga Solar Farm
A completed 3 megawatt solar farm featuring 6,500 panels with single-axis tracking system, now powering the Wodonga Wastewater Treatment Plant with renewable energy. Operational since August 2023, the facility generates enough electricity to power the treatment plant during daylight hours with surplus energy fed back to the grid. The project reduces North East Water's carbon footprint by 6,000 tonnes of CO2 annually and contributes to the corporation's 100% renewable energy achievement.
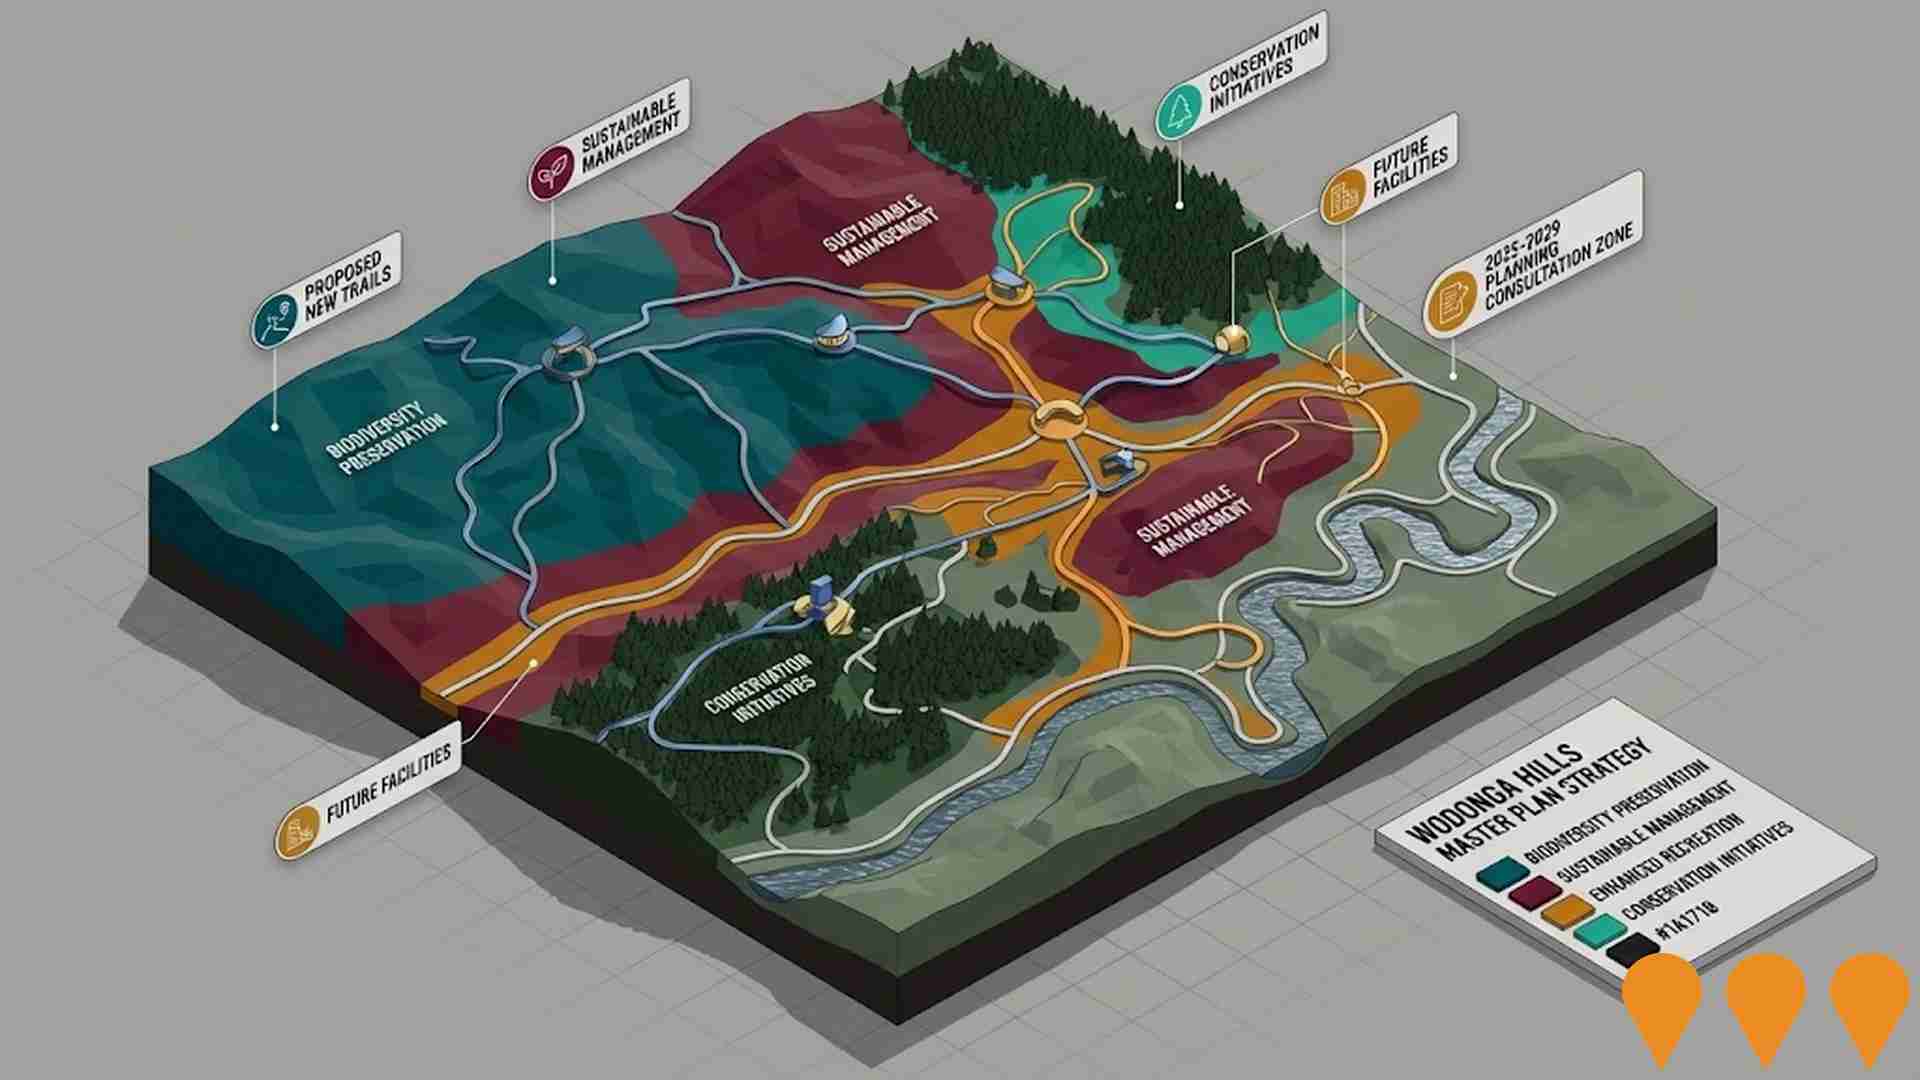
Planning for Wodonga Hills
Long-term strategy and master plans for sustainable management, biodiversity preservation, and enhanced recreation in the Wodonga Hills area. The strategy was adopted by Council in 2017 and includes 20-year implementation plans for new trails, facilities, and conservation initiatives. Currently being reviewed as part of Council's broader strategic planning consultation process for 2025-2029.
Albury Riverside Precinct
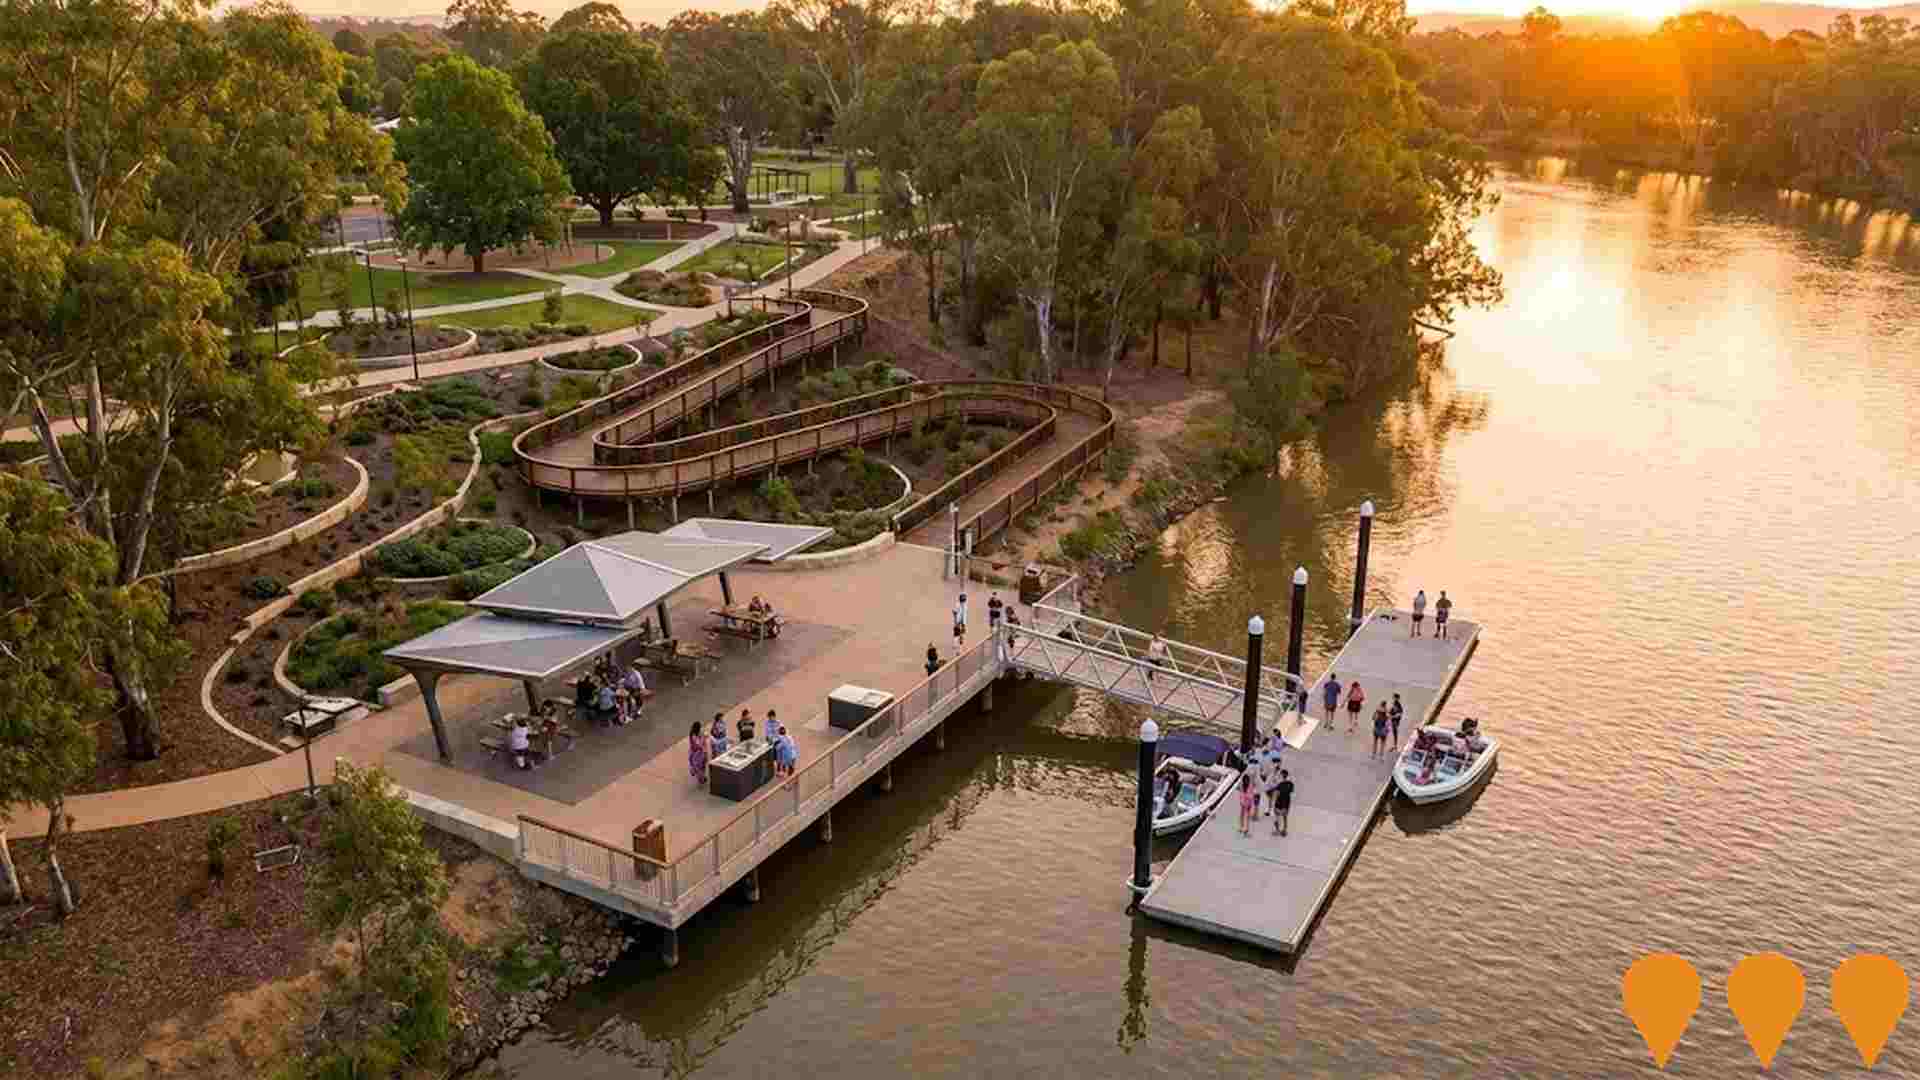
Public open space upgrade along the Murray River delivering an elevated all-abilities boardwalk to Bungambrawatha Creek, jetty and floating dock, river viewing points, BBQ and picnic facilities, shade structures, improved car parking, lighting, landscaping and new pathways linking Hovell Tree Park to the Albury Swim Centre. Project completed July 2023 with a total budget of approximately $8.7M.
Wodonga Wastewater Treatment Plant Expansion
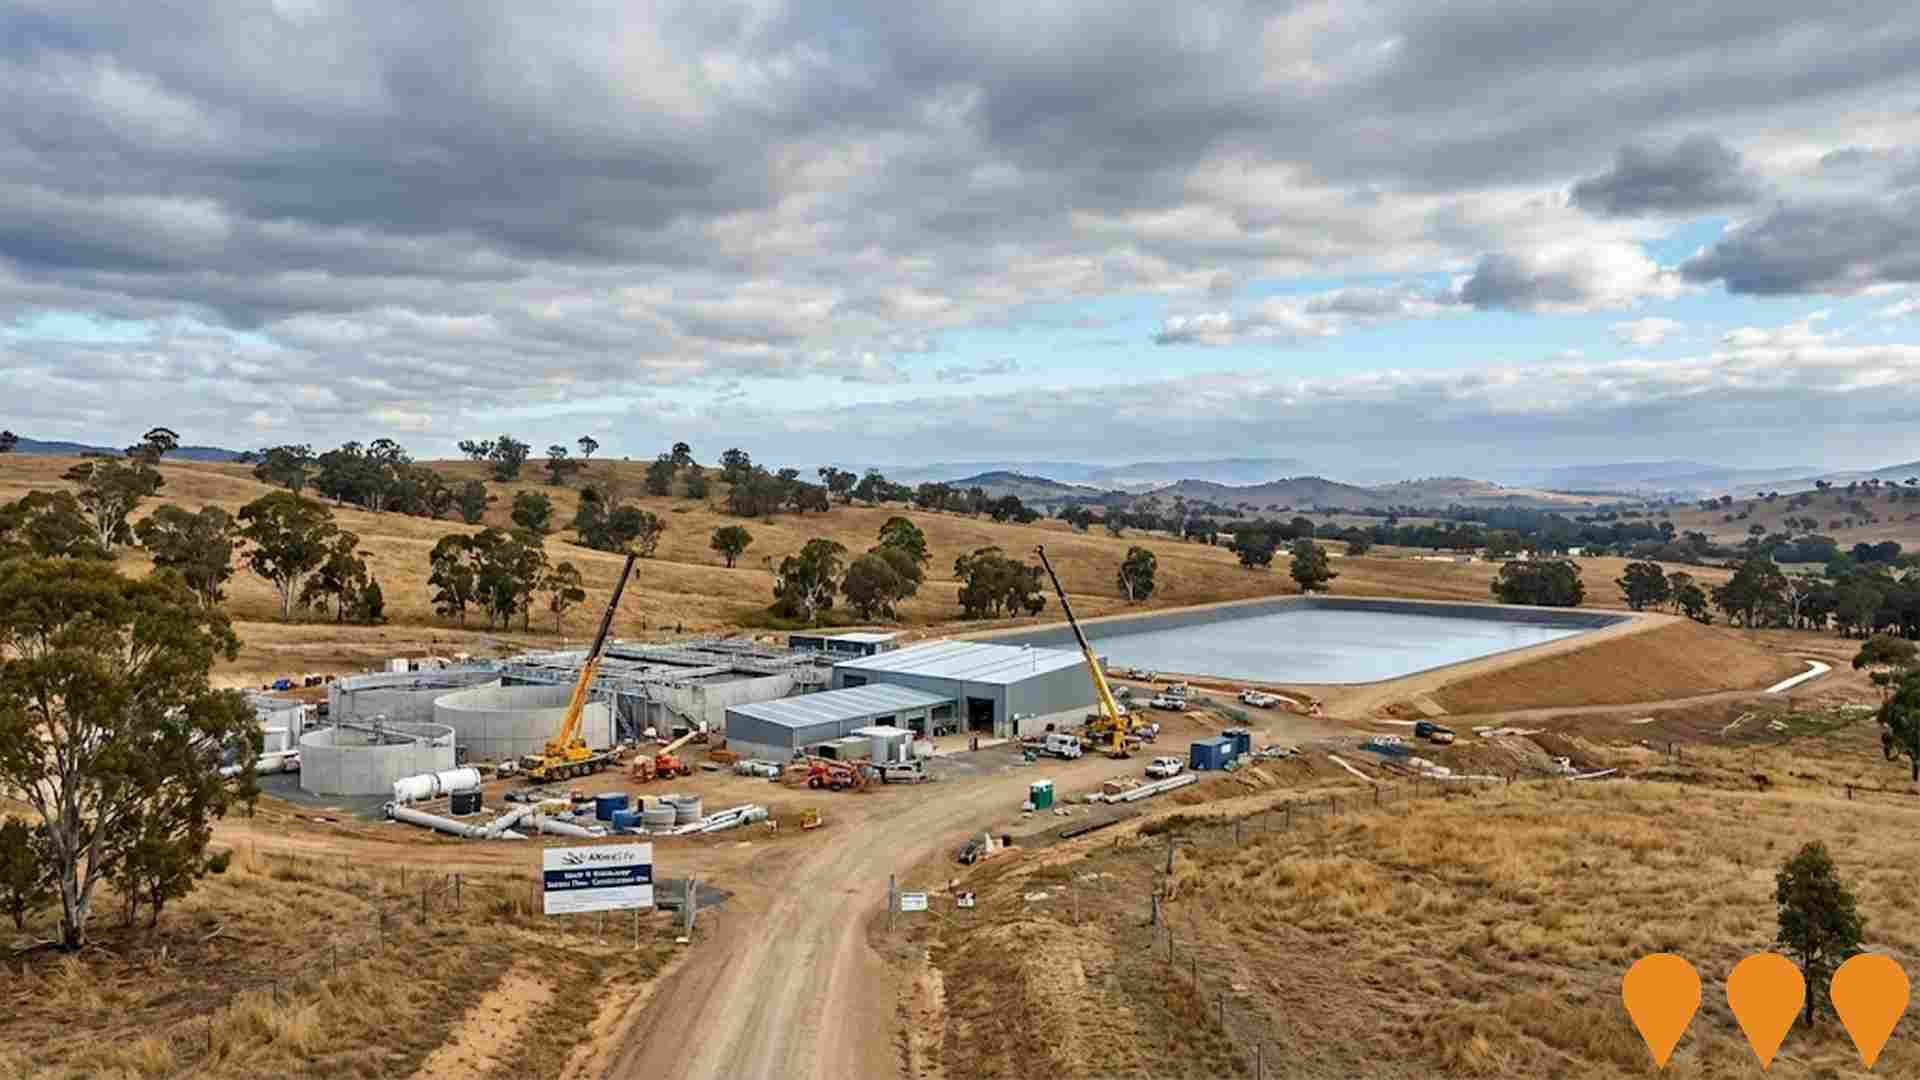
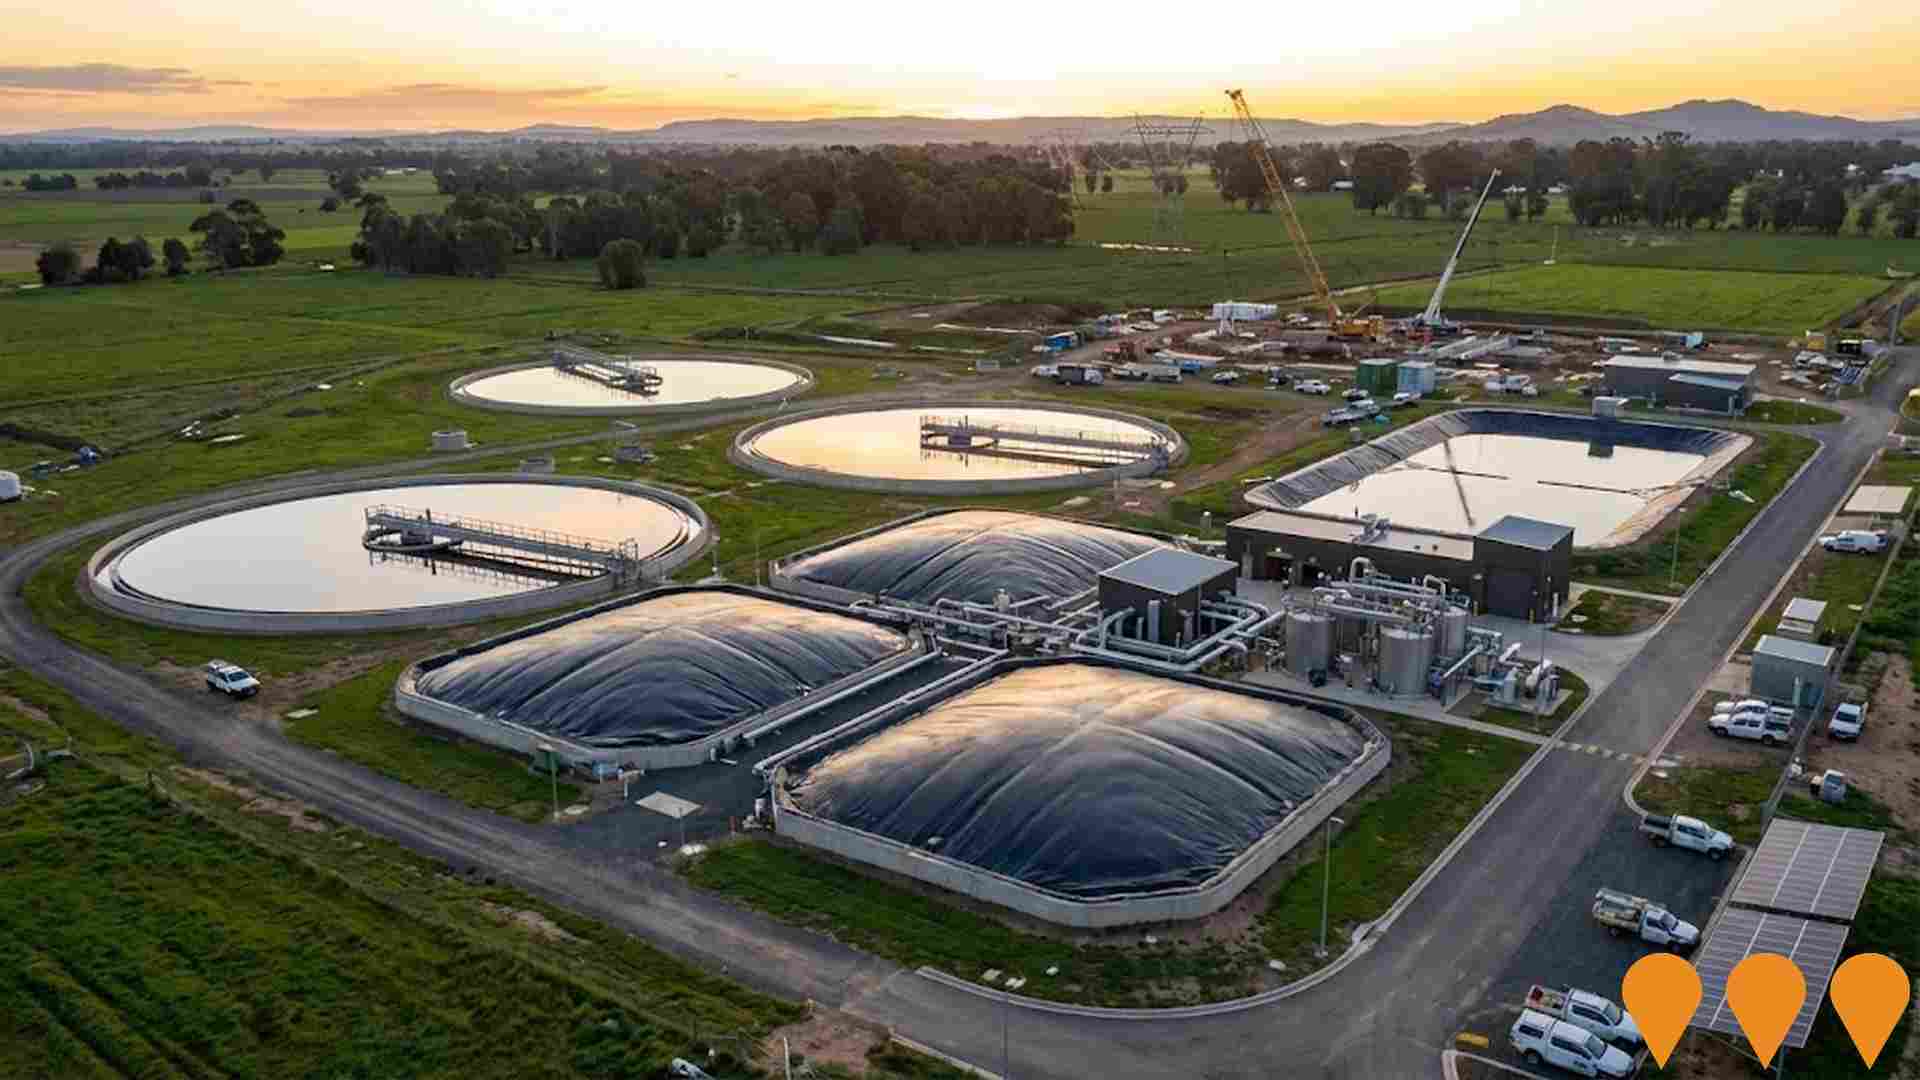
Major expansion of the wastewater treatment plant to double capacity from current levels to support Wodonga's growing population expected to reach 90,000 over 25 years. Features covered anaerobic lagoons for biogas recovery and renewable electricity generation, reducing emissions by 6,500 tonnes of CO2 annually. The upgrade enables more effective reuse of waste to generate energy that can be used on-site or fed back into the electricity grid, creating a self-sustaining facility.
Riverina Highway Sewer West Upgrade
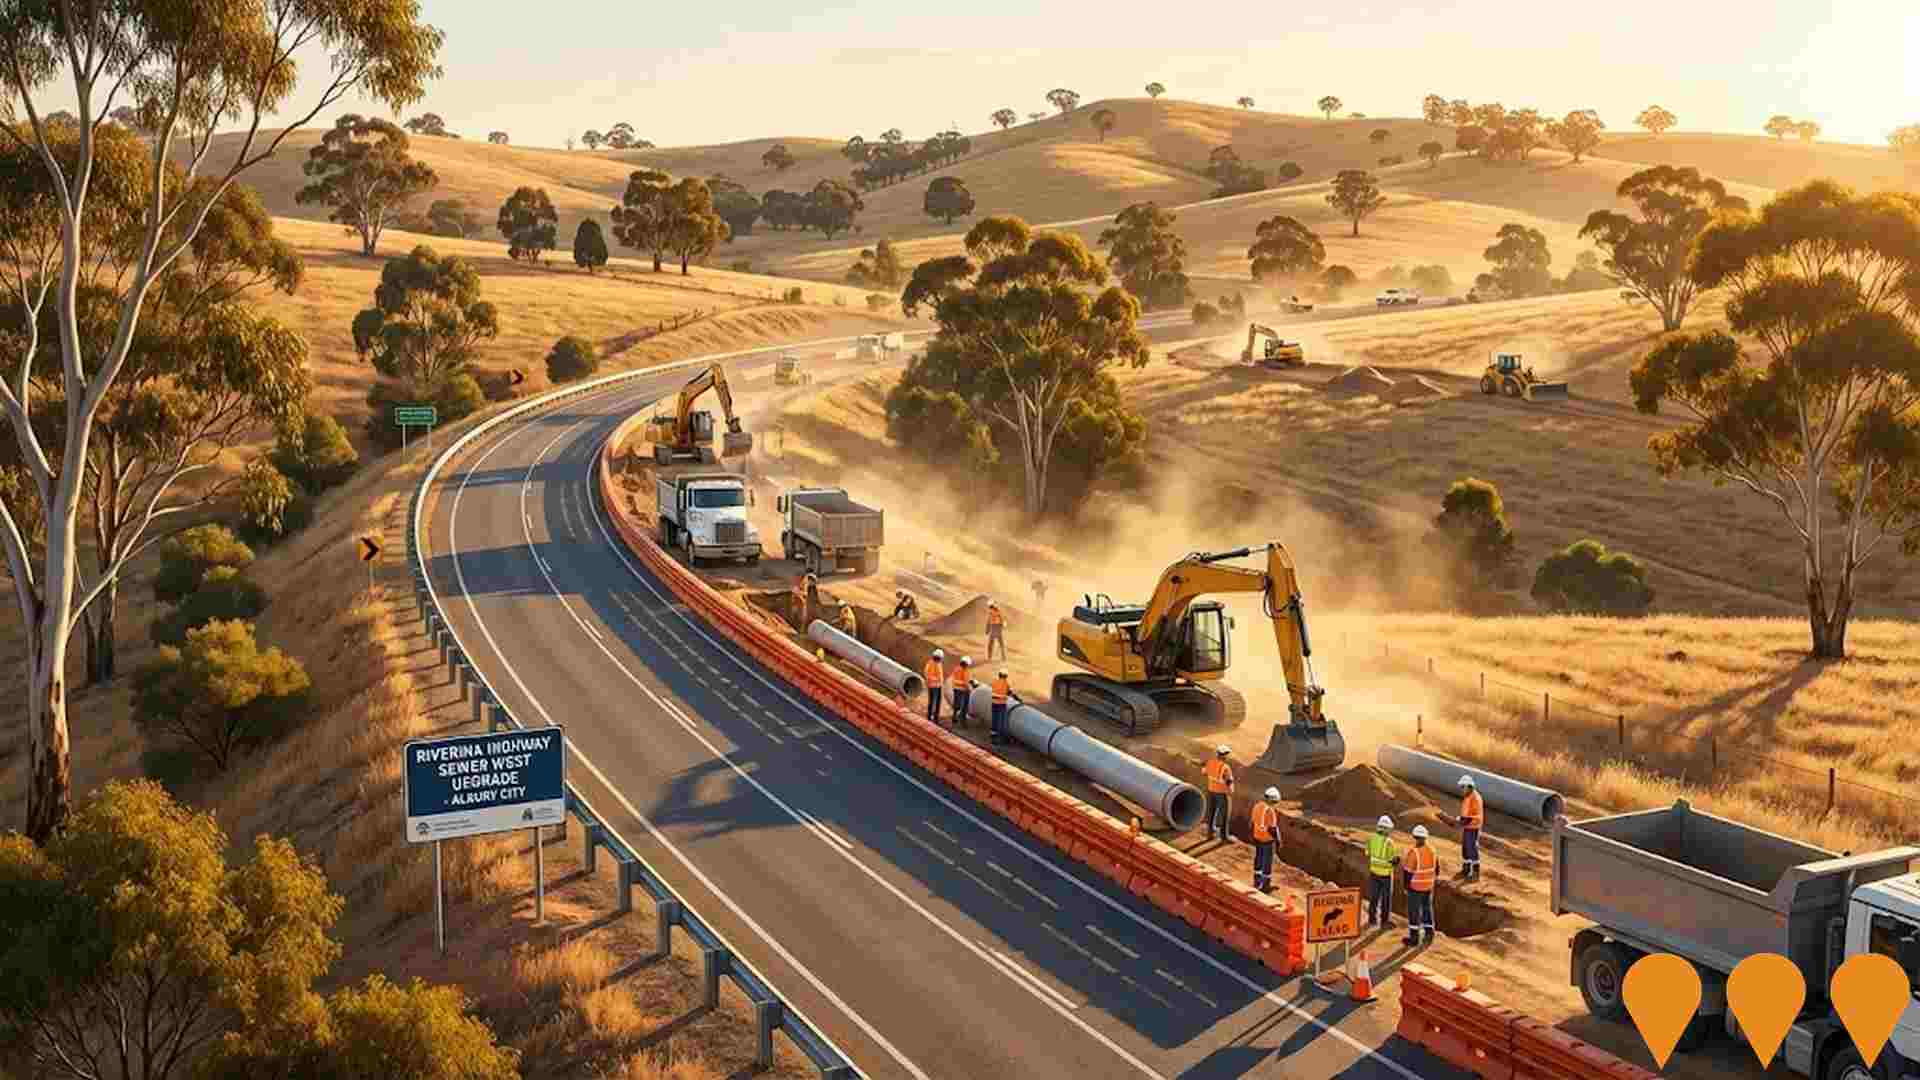
Upgrade of sewer pipelines from the Main Sewer Pump Station at Wodonga Place to the Waterview treatment plant to service city growth, including the construction of a new 5.5km sewer main. This project is part of a larger plan that will support the eventual decommissioning of the Kremur St wastewater treatment plant.
Employment
Employment drivers in West Wodonga are experiencing difficulties, placing it among the bottom 20% of areas assessed across Australia
West Wodonga has a balanced workforce with both white and blue collar jobs, with essential services well represented. The unemployment rate in September 2025 was 6.1%.
As of this date, 7,596 residents were employed while the unemployment rate was 2.3% higher than Rest of Vic.'s rate of 3.8%. Workforce participation was fairly standard at 60.9%, compared to Rest of Vic.'s 57.4%. Key industries for employment among residents were health care & social assistance, retail trade, and manufacturing. Manufacturing showed particularly strong specialization with an employment share of 1.4 times the regional level.
Conversely, agriculture, forestry & fishing had lower representation at 1.3% versus the regional average of 7.5%. The area appeared to offer limited local employment opportunities based on Census data analysis. In the 12-month period ending in September 2025, labour force decreased by 1.6% and employment declined by 3.7%, causing unemployment rate to rise by 2.0 percentage points. This contrasted with Rest of Vic., where employment contracted by 0.7%, labour force fell by 0.6%, and unemployment rose marginally. State-level data up to 25-Nov-25 showed VIC employment grew by 1.13% year-on-year, adding 41,950 jobs, with the state unemployment rate at 4.7%. National employment forecasts from Jobs and Skills Australia projected national employment growth of 6.6% over five years and 13.7% over ten years. Applying these projections to West Wodonga's employment mix suggested local employment should increase by 6.1% over five years and 13.0% over ten years, though this was a simple extrapolation for illustrative purposes and did not account for localized population projections.
Frequently Asked Questions - Employment
Income
Income levels sit below national averages according to AreaSearch assessment
West Wodonga SA2's income level is lower than average nationally according to latest ATO data aggregated by AreaSearch for financial year 2022. Its median income among taxpayers is $51,396 and average income stands at $58,580. This compares to Rest of Vic.'s figures of $48,741 and $60,693 respectively. Based on Wage Price Index growth of 12.16% since financial year 2022, current estimates would be approximately $57,646 (median) and $65,703 (average) as of September 2025. Census data reveals household, family and personal incomes all rank modestly in West Wodonga, between the 34th and 41st percentiles. Distribution data shows the $1,500 - 2,999 earnings band captures 34.2% of the community (5,397 individuals), consistent with broader trends across the surrounding region showing 30.3% in the same category. After housing, 85.6% of income remains for other expenses.
Frequently Asked Questions - Income
Housing
West Wodonga is characterized by a predominantly suburban housing profile, with a higher proportion of rental properties than the broader region
The dwelling structure in West Wodonga, as per the latest Census, consisted of 88.7% houses and 11.3% other dwellings (semi-detached, apartments, 'other' dwellings). In comparison, Non-Metro Vic. had 91.6% houses and 8.5% other dwellings. Home ownership in West Wodonga stood at 30.5%, with the rest either mortgaged (36.3%) or rented (33.2%). The median monthly mortgage repayment was $1,387, below Non-Metro Vic.'s average of $1,473 and the national average of $1,863. The median weekly rent figure was $290, compared to Non-Metro Vic.'s $280 and the national figure of $375.
Frequently Asked Questions - Housing
Household Composition
West Wodonga has a typical household mix, with a fairly typical median household size
Family households constitute 69.2% of all households, consisting of 27.3% couples with children, 27.1% couples without children, and 13.9% single parent families. Non-family households comprise the remaining 30.8%, with lone person households at 28.4% and group households making up 2.4% of the total. The median household size is 2.4 people, which aligns with the average for the Rest of Vic.
Frequently Asked Questions - Households
Local Schools & Education
West Wodonga shows below-average educational performance compared to national benchmarks, though pockets of achievement exist
The area's university qualification rate is 15.9%, significantly lower than Victoria's average of 33.4%. Bachelor degrees are the most common at 11.0%, followed by graduate diplomas (2.7%) and postgraduate qualifications (2.2%). Vocational credentials are held by 41.6% of residents aged 15 and above, with advanced diplomas at 11.3% and certificates at 30.3%. Educational participation is high, with 29.7% of residents currently enrolled in formal education.
This includes 10.8% in primary education, 8.8% in secondary education, and 2.7% pursuing tertiary education.
Frequently Asked Questions - Education
Schools Detail
Nearby Services & Amenities
Transport
Transport servicing is low compared to other areas nationally based on assessment of service frequency, route connectivity and accessibility
Analysis of West Wodonga's public transport shows 68 active stops operating within the area, all of which are bus services. These stops are served by 20 individual routes that collectively facilitate 396 weekly passenger trips. The accessibility of transport in the area is rated as good, with residents typically located 226 meters from their nearest stop.
Service frequency averages 56 trips per day across all routes, which equates to approximately 5 weekly trips per individual stop.
Frequently Asked Questions - Transport
Transport Stops Detail
Health
Health performance in West Wodonga is well below average with prevalence of common health conditions notable across both younger and older age cohorts
West Wodonga faces substantial health challenges. Common health conditions are prevalent across younger and older age cohorts.
Private health cover is relatively low at approximately 49% (around 7,748 people), compared to the national average of 55.3%. Mental health issues impact 11.4% of residents, while asthma affects 9.9%. About 61.4% claim to be completely clear of medical ailments, compared to 64.1% in Rest of Vic.. The area has 19.1% of residents aged 65 and over (3,008 people), lower than the 20.7% in Rest of Vic.. Health outcomes among seniors present challenges broadly in line with the general population's health profile.
Frequently Asked Questions - Health
Cultural Diversity
West Wodonga is considerably less culturally diverse than average when assessed alongside AreaSearch's national rankings for language and cultural background related metrics
West Wodonga's cultural diversity was found to be below average, with 91.3% of its population being citizens, 89.8% born in Australia, and 94.7% speaking English only at home. The predominant religion in West Wodonga is Christianity, comprising 50.1% of the population, compared to 48.2% across Rest of Vic. The top three ancestry groups are Australian (31.6%), English (30.3%), and Irish (8.4%).
Notably, German ancestry is overrepresented at 5.3%, compared to 4.8% regionally, Dutch at 1.5% (vs 1.6%), and Hungarian at 0.3% (vs 0.2%).
Frequently Asked Questions - Diversity
Age
West Wodonga's population aligns closely with national norms in age terms
The median age in West Wodonga is 39 years, which is significantly lower than Rest of Vic.'s average of 43 but closely aligned with Australia's median age of 38 years. Compared to Rest of Vic., West Wodonga has a higher proportion of residents aged 15-24 (13.5%) but fewer residents aged 75-84 (6.1%). According to the 2021 Census, the proportion of residents aged 15-24 increased from 12.5% to 13.5%, while the proportion of those aged 5-14 decreased from 13.9% to 12.3%. By 2041, demographic projections indicate significant shifts in West Wodonga's age structure. Notably, the 25-34 age group is expected to grow by 58%, reaching 2,990 people from 1,890. Conversely, the 15-24 and 55-64 age groups are projected to experience population declines.
