Chart Color Schemes
This analysis uses ABS Statistical Areas Level 2 (SA2) boundaries, which can materially differ from Suburbs and Localities (SAL) even when sharing similar names.
SA2 boundaries are defined by the Australian Bureau of Statistics and are designed to represent communities for statistical reporting (e.g., census and ERP).
Suburbs and Localities (SAL) represent commonly-used suburb/locality names (postal-style areas) and may use different geographic boundaries. For comprehensive analysis, consider reviewing both boundary types if available.
est. as @ -- *
ABS ERP | -- people | --
2021 Census | -- people
Sales Activity
Curious about local property values? Filter the chart to assess the volume and appreciation (including resales) trends and regional comparisons, or scroll to the map below view this information at an individual property level.
Find a Recent Sale
Sales Detail
Population
Chiltern - Indigo Valley has seen population growth performance typically on par with national averages when looking at short and medium term trends
Chiltern-Indigo Valley's population was 3,184 according to the 2021 Census. As of Nov 2025, it is around 3,283, reflecting an increase of 99 people (3.1%). This growth is inferred from ABS' June 2024 estimated resident population of 3,267 and 44 validated new addresses since the Census date. The population density is 6.4 persons per square kilometer. Since the Census, Chiltern-Indigo Valley's 3.1% growth is close to the SA3 area's 4.2%, indicating competitive growth fundamentals. Interstate migration contributed approximately 65.8% of recent population gains.
AreaSearch uses ABS/Geoscience Australia projections for each SA2 area, released in 2024 with a base year of 2022. For areas not covered by this data, AreaSearch employs VIC State Government's Regional/LGA projections from 2023, adjusted using weighted aggregation methods to SA2 levels. Growth rates by age group are applied across all areas for years 2032 to 2041. By 2041, Chiltern-Indigo Valley is forecasted to increase by 760 persons, reflecting a gain of 22.7% over the 17-year period.
Frequently Asked Questions - Population
Development
Residential development activity is lower than average in Chiltern - Indigo Valley according to AreaSearch's national comparison of local real estate markets
In Chiltern-Indigo Valley, approximately 12 new homes have been approved annually over the past five financial years, totalling 62 homes. As of FY-26, 9 approvals have been recorded. On average, 1.9 new residents arrive per year for each new home constructed between FY-21 and FY-25. The average construction value of these properties is $322,000.
This financial year has seen $10.7 million in commercial development approvals, indicating balanced commercial growth. Compared to the rest of Victoria, Chiltern-Indigo Valley has about two-thirds the rate of new dwelling approvals per person and ranks at the 54th percentile nationally. Recent building activity consists solely of detached houses, maintaining the area's low-density character and attracting space-seeking buyers.
With an estimated 490 people per dwelling approval, development remains quiet and low-key. By 2041, population forecasts project a gain of 744 residents. If current development rates persist, housing supply may not keep pace with population growth, potentially intensifying buyer competition and supporting stronger price increases.
Frequently Asked Questions - Development
Infrastructure
Chiltern - Indigo Valley has moderate levels of nearby infrastructure activity, ranking in the 42ndth percentile nationally
Changes to local infrastructure significantly influence an area's performance. AreaSearch has identified six projects that could impact the region. Key projects are Advanced Manufacturing Centre of Excellence, Wodonga Wastewater Treatment Plant Expansion, Hydrogen Park Murray Valley (HyP Murray Valley), and Wodonga Solar Farm. The following list details those most relevant.
Professional plan users can use the search below to filter and access additional projects.
INFRASTRUCTURE SEARCH
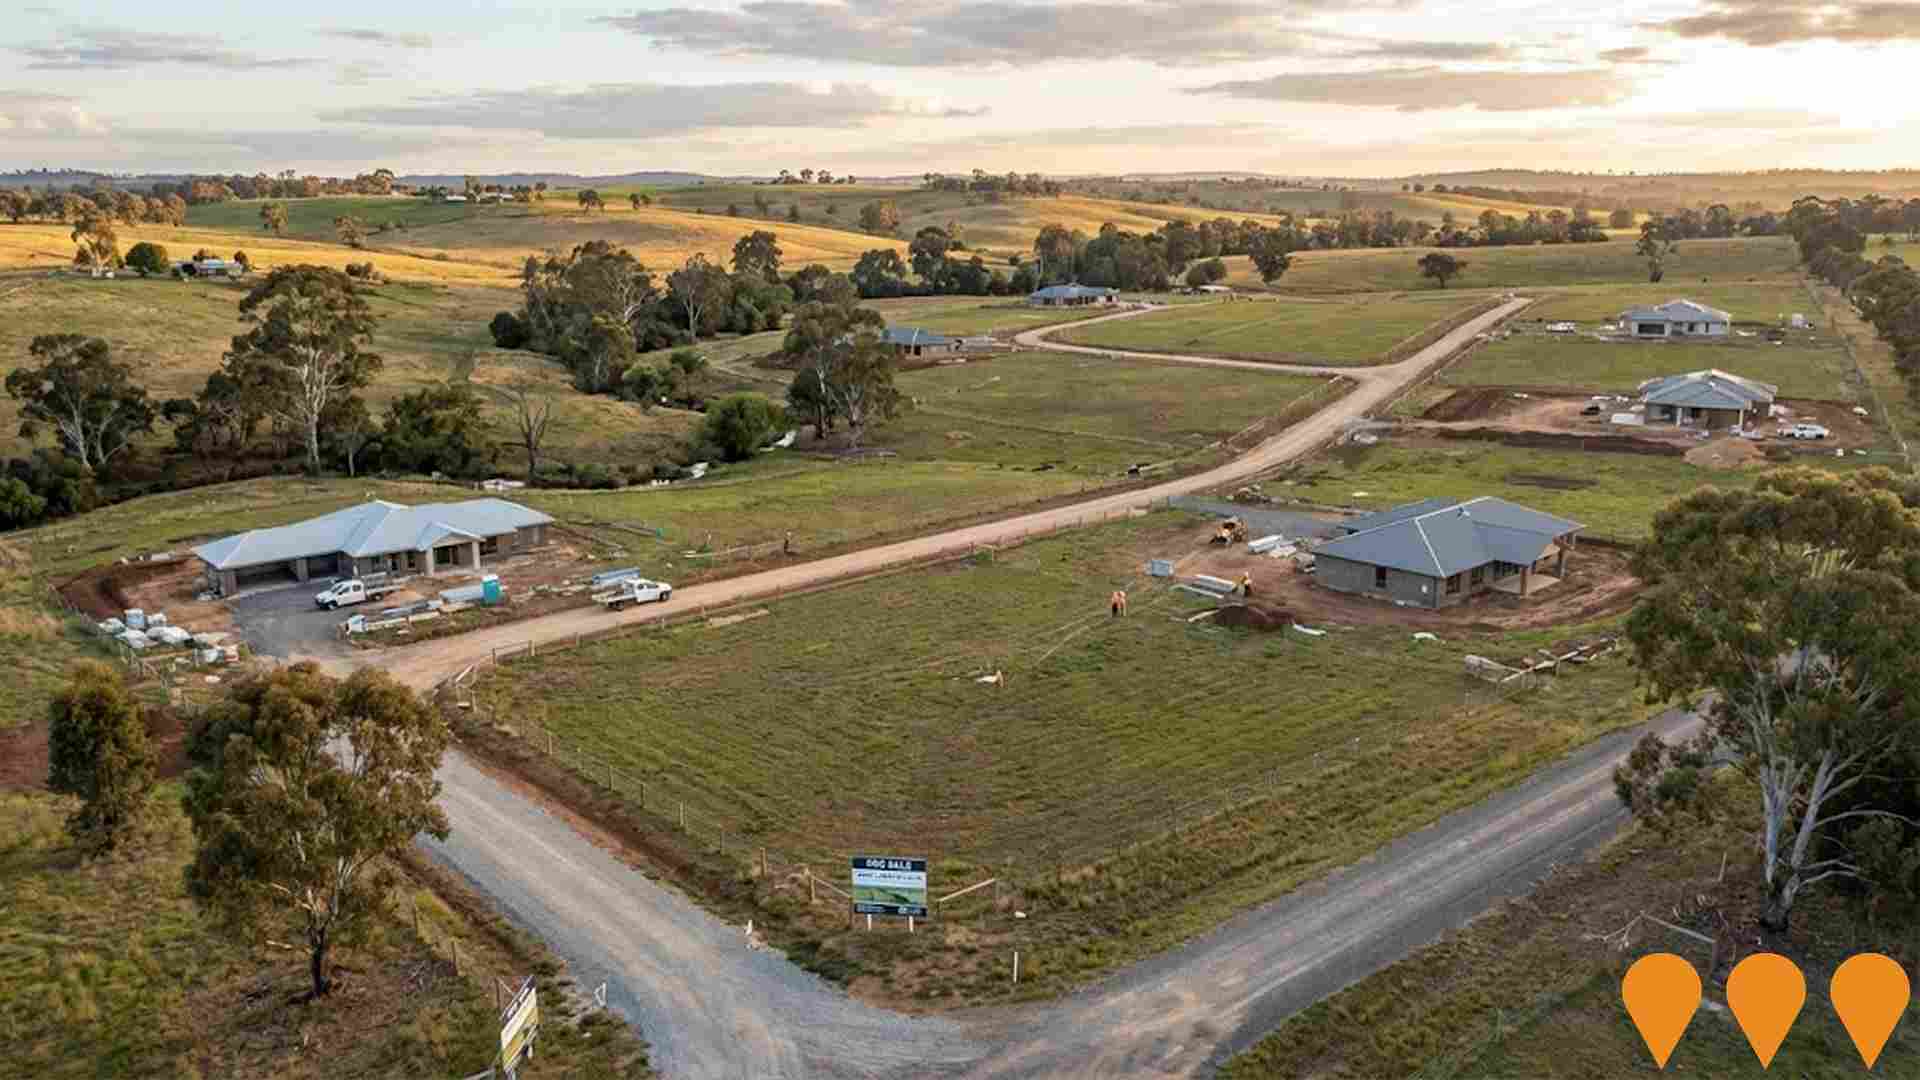
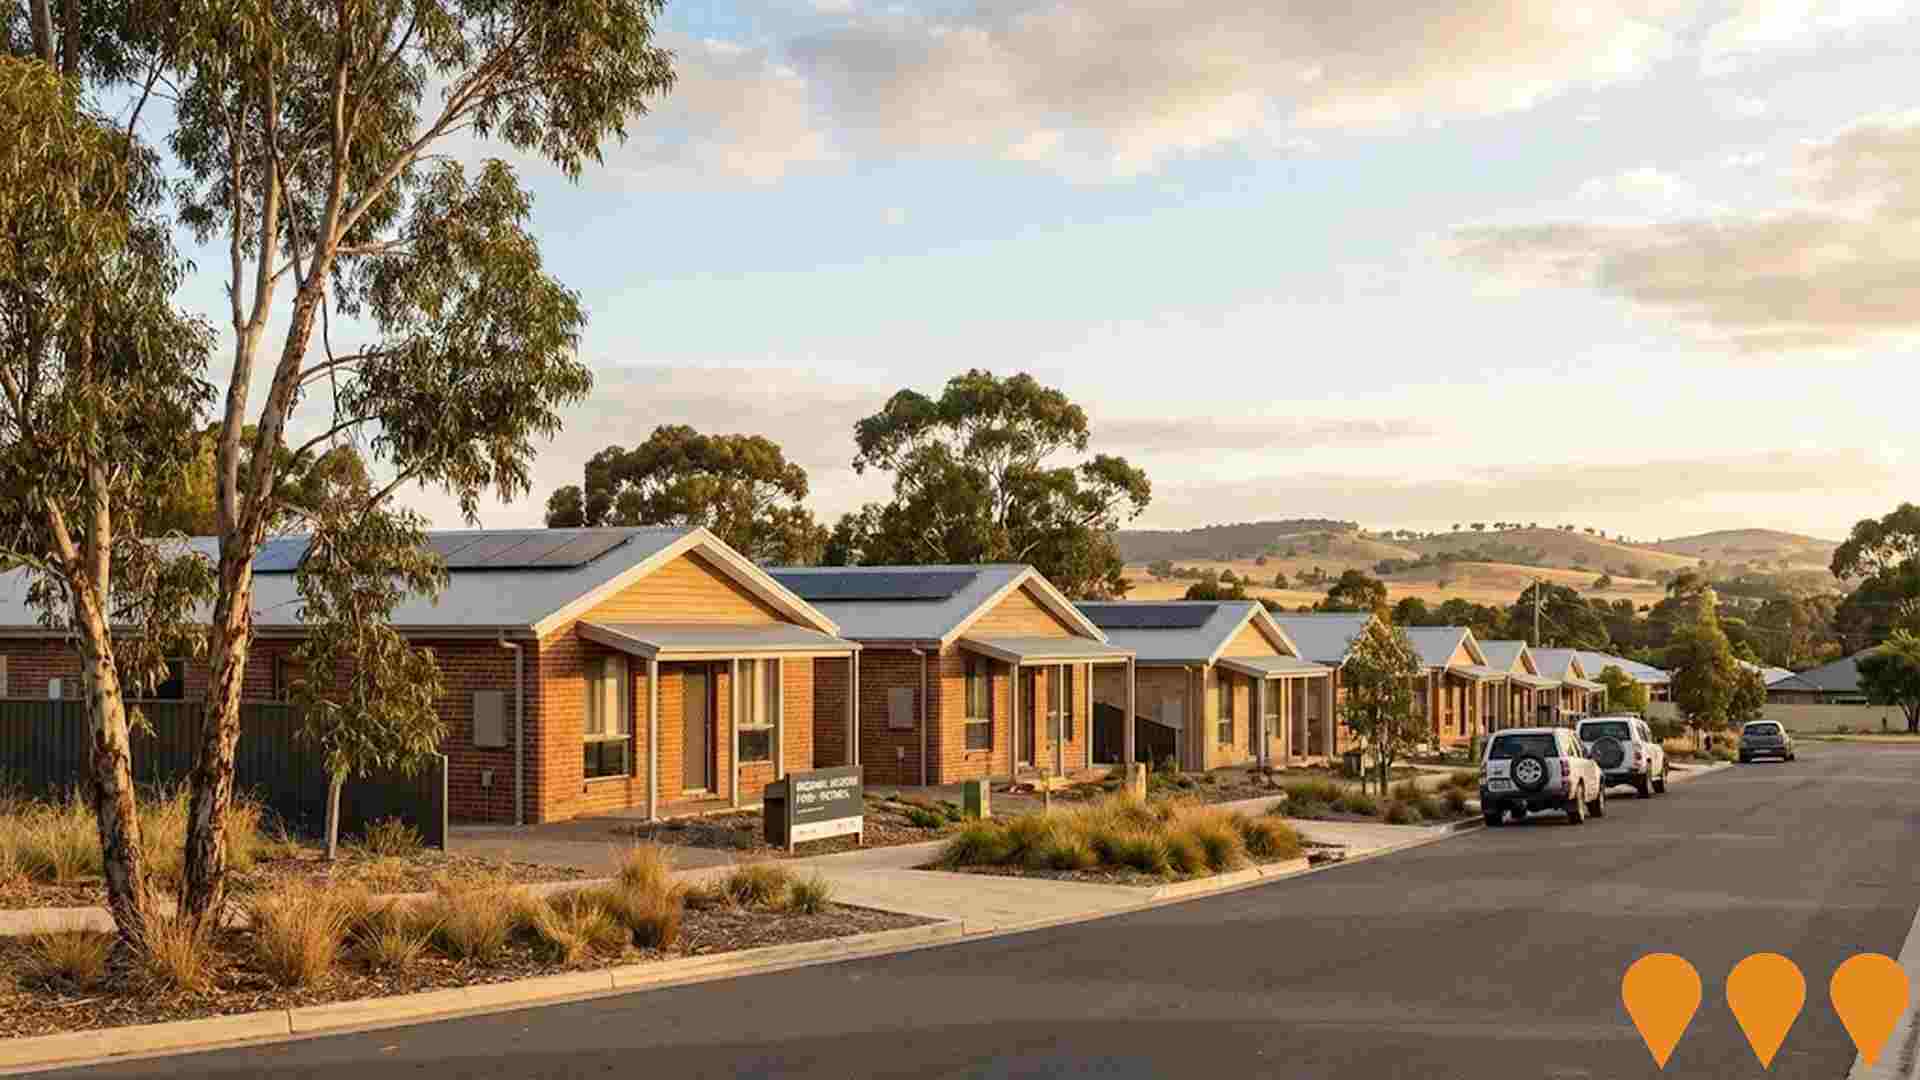
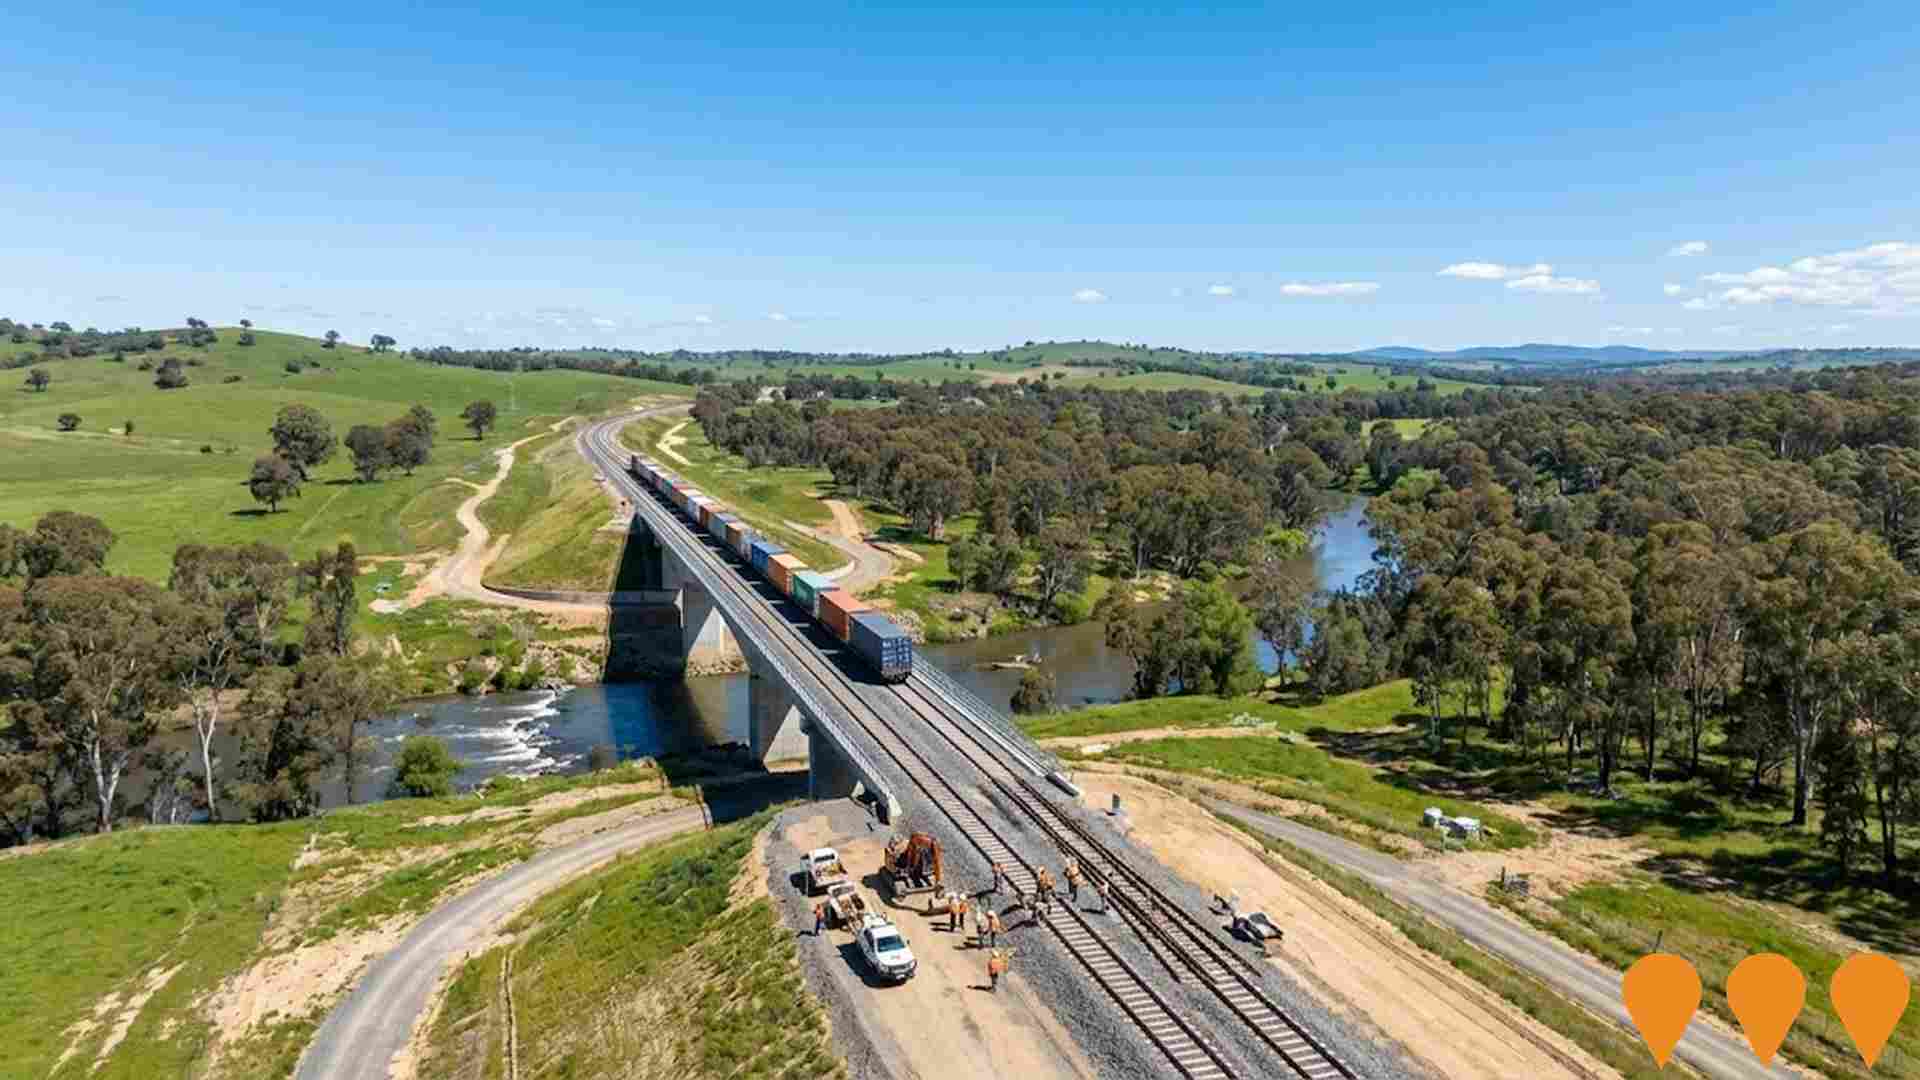
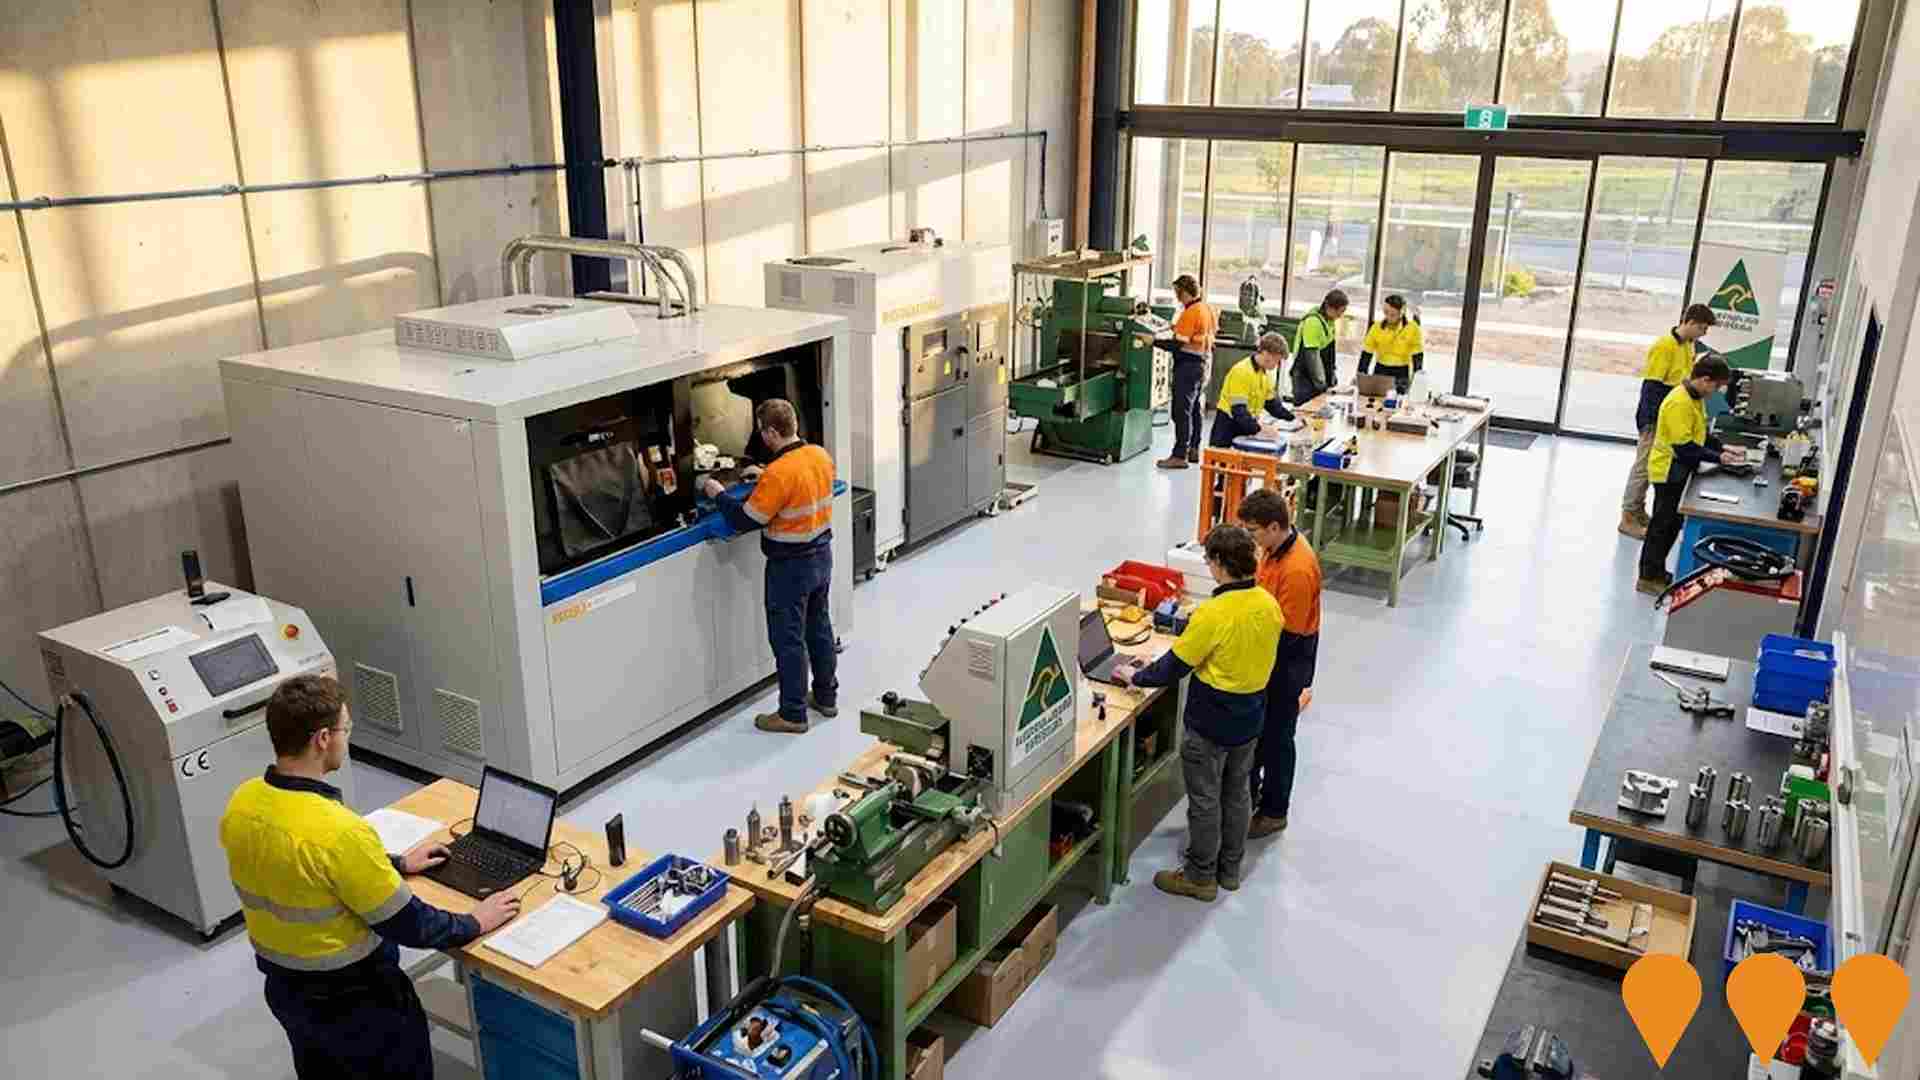
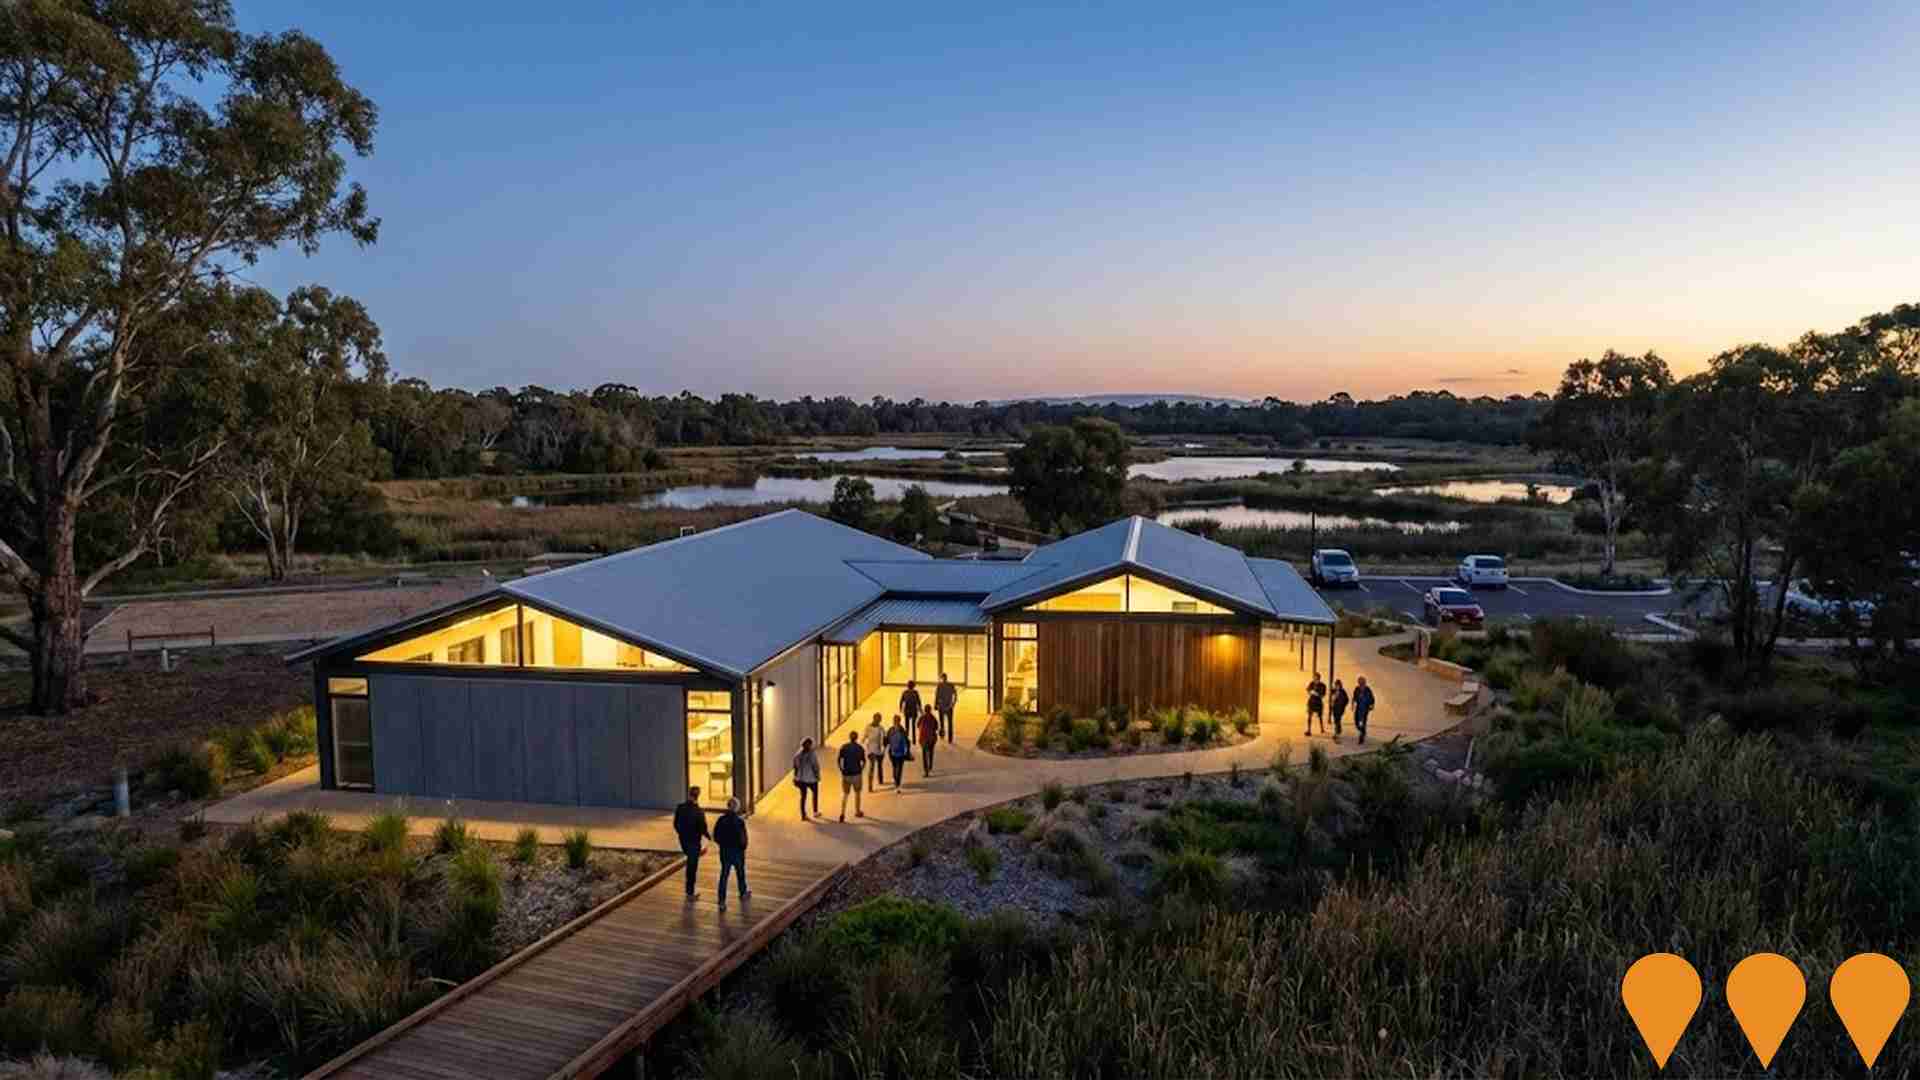
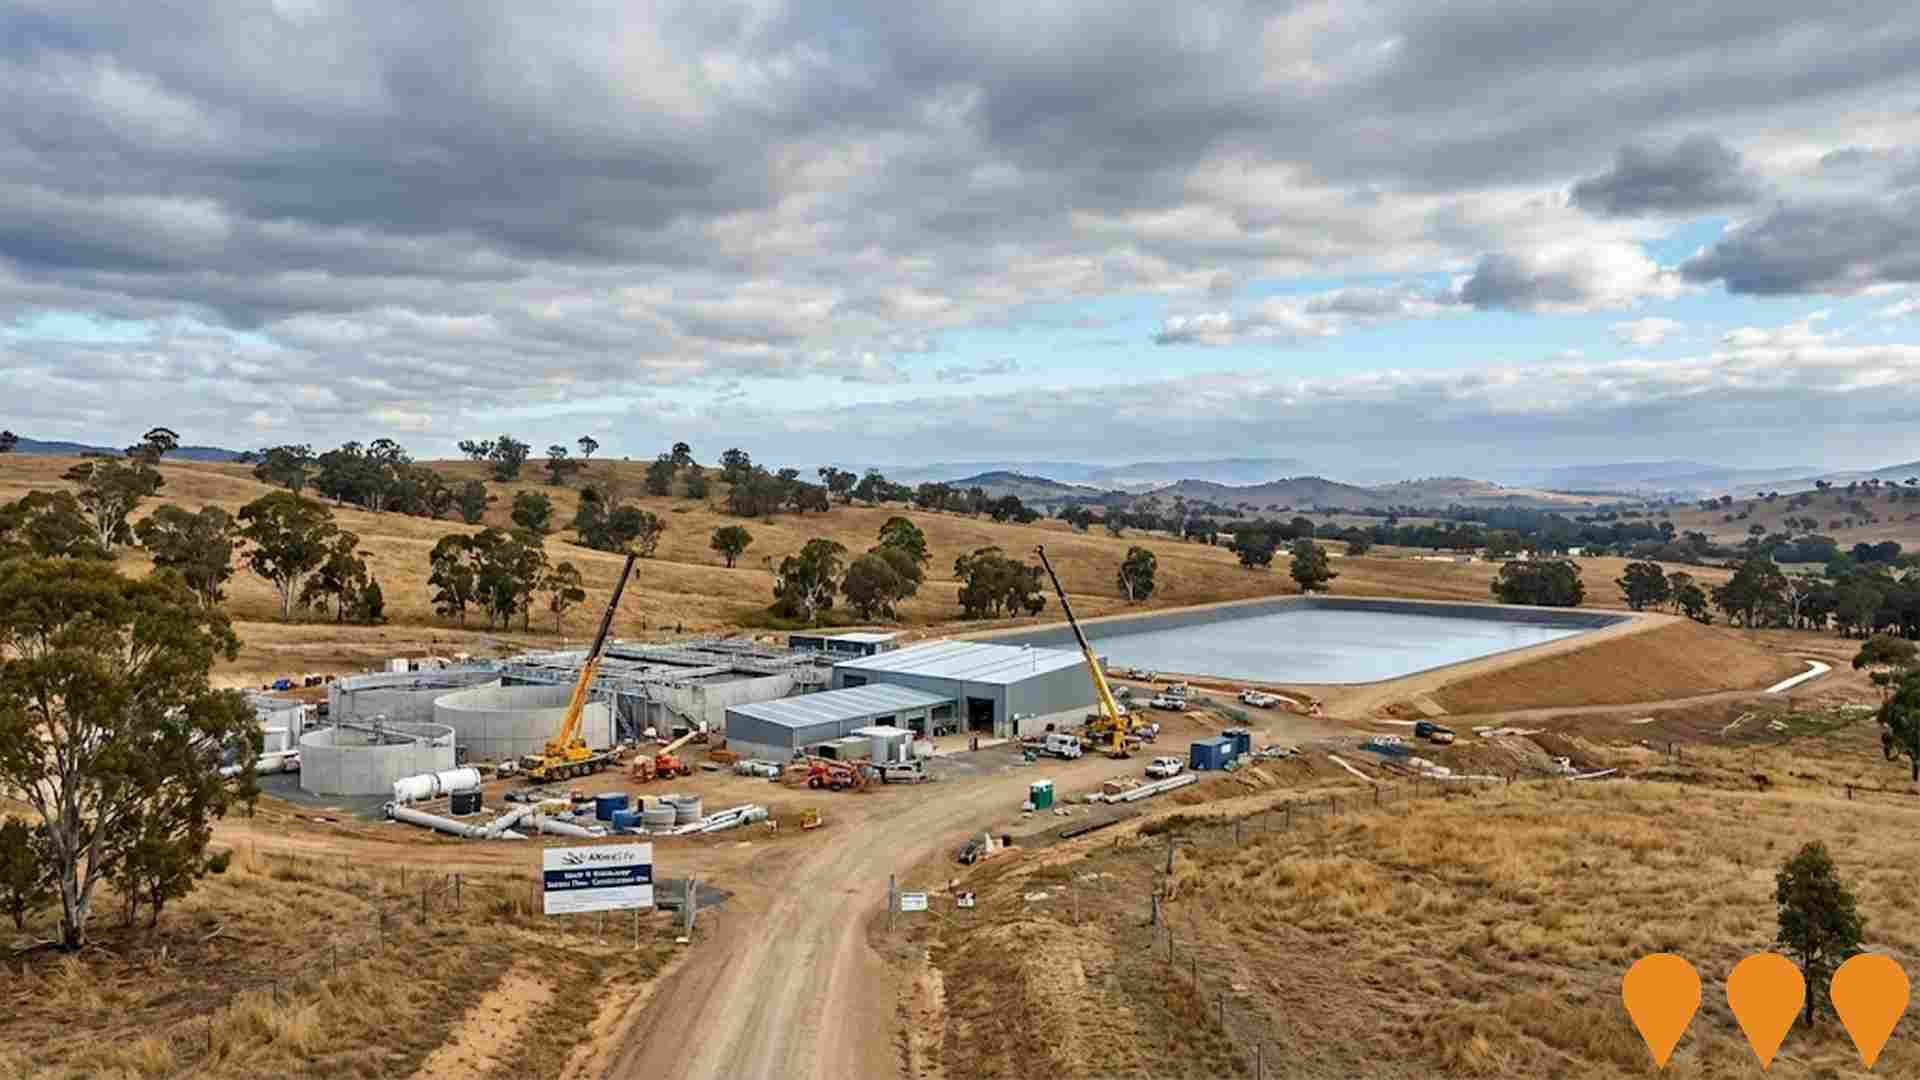
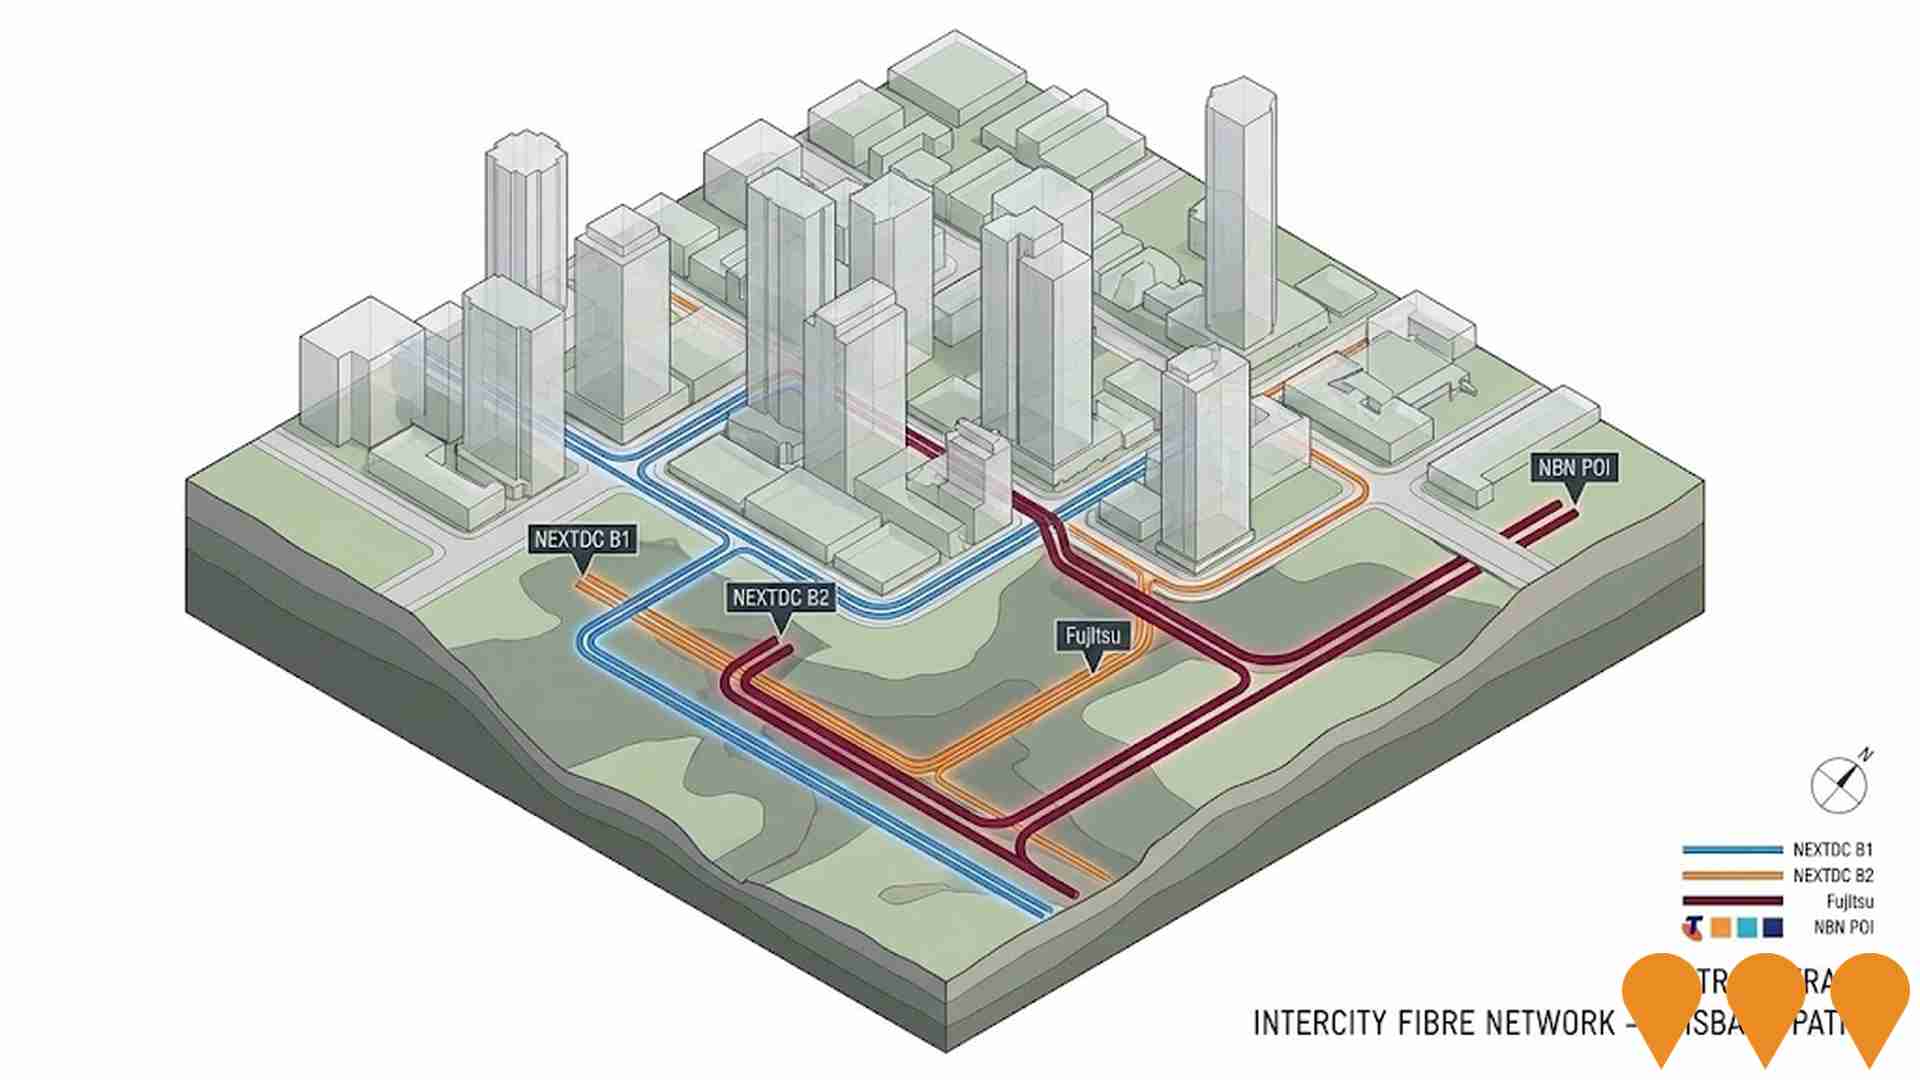
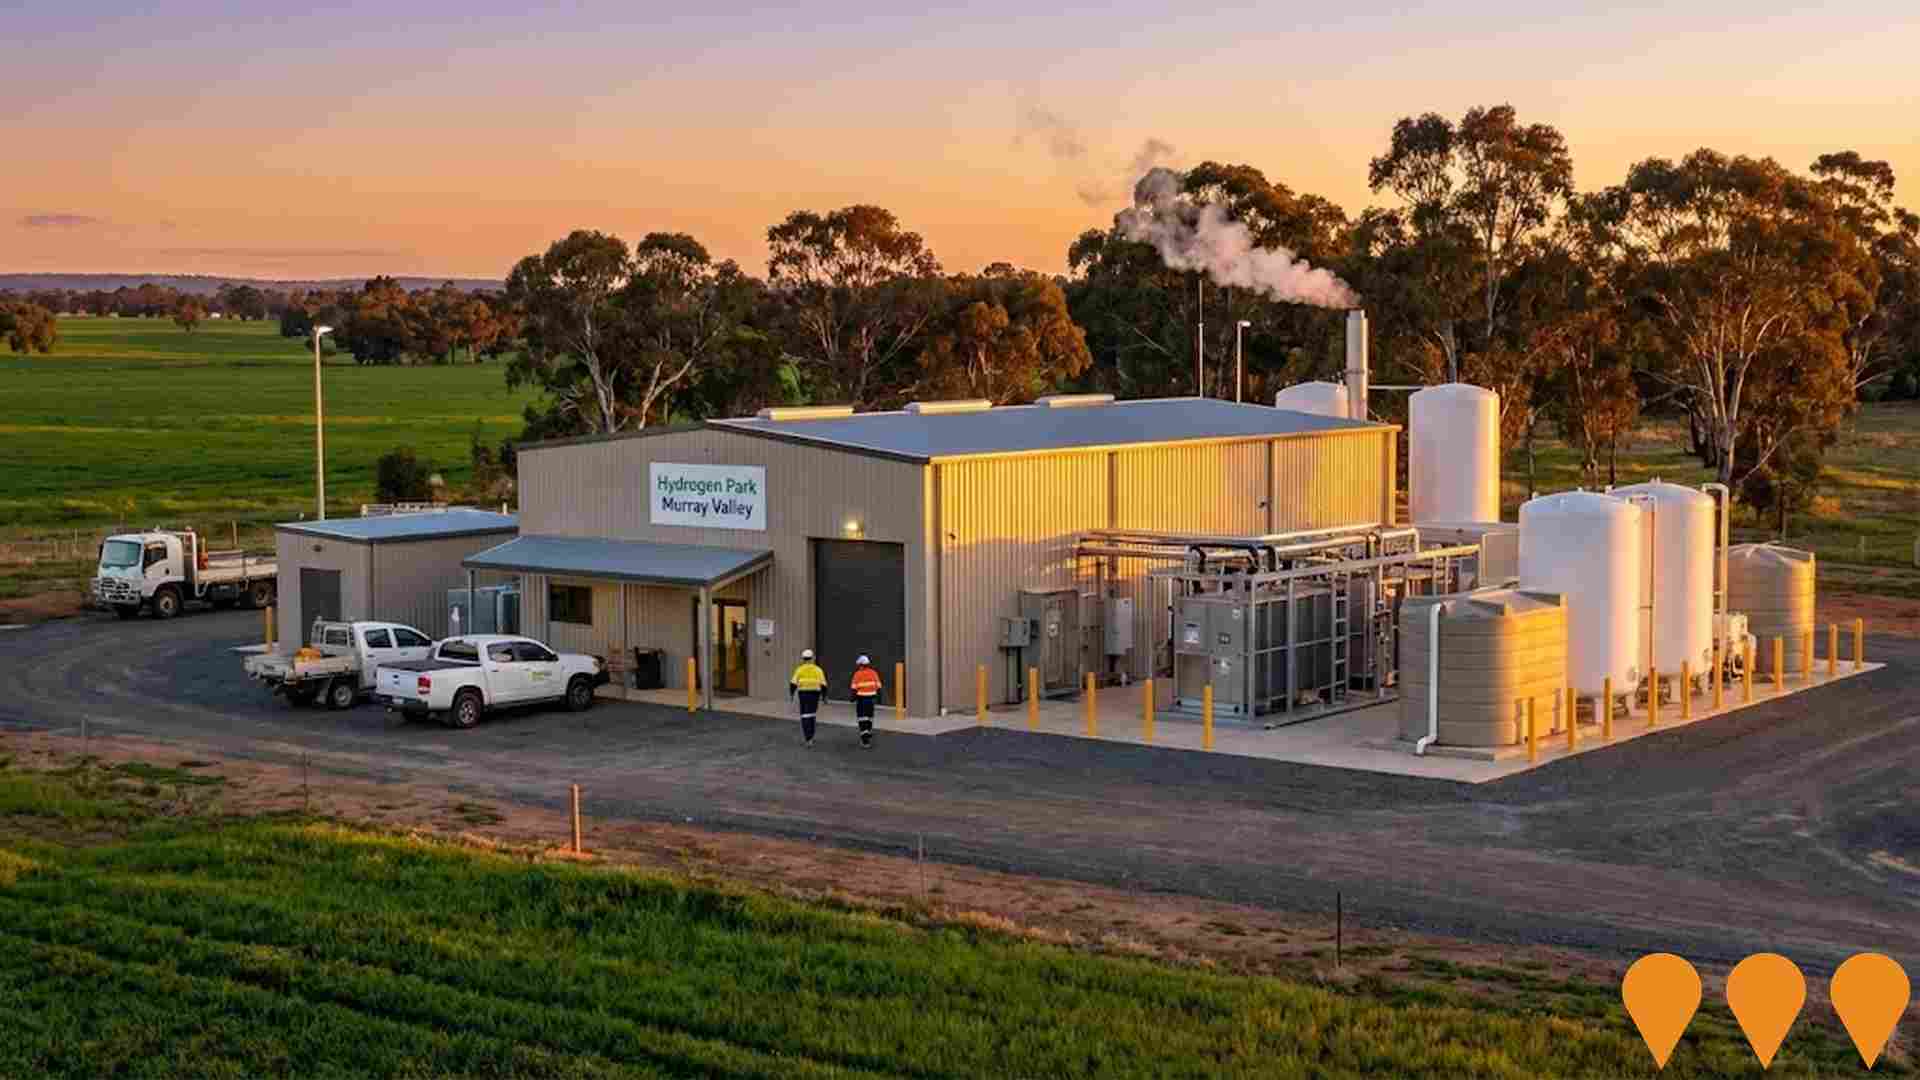
 Denotes AI-based impression for illustrative purposes only, not to be taken as definitive under any circumstances. Please follow links and conduct other investigations from the project's source for actual imagery. Developers and project owners wishing us to use original imagery please Contact Us and we will do so.
Frequently Asked Questions - Infrastructure
Hydrogen Park Murray Valley (HyP Murray Valley)
A 10 MW renewable hydrogen production facility using solar-powered electrolysis. Produces green hydrogen that is blended at up to 10% into the local Albury-Wodonga gas network, serving over 40,000 customers. Officially opened in September 2024 and now fully operational.
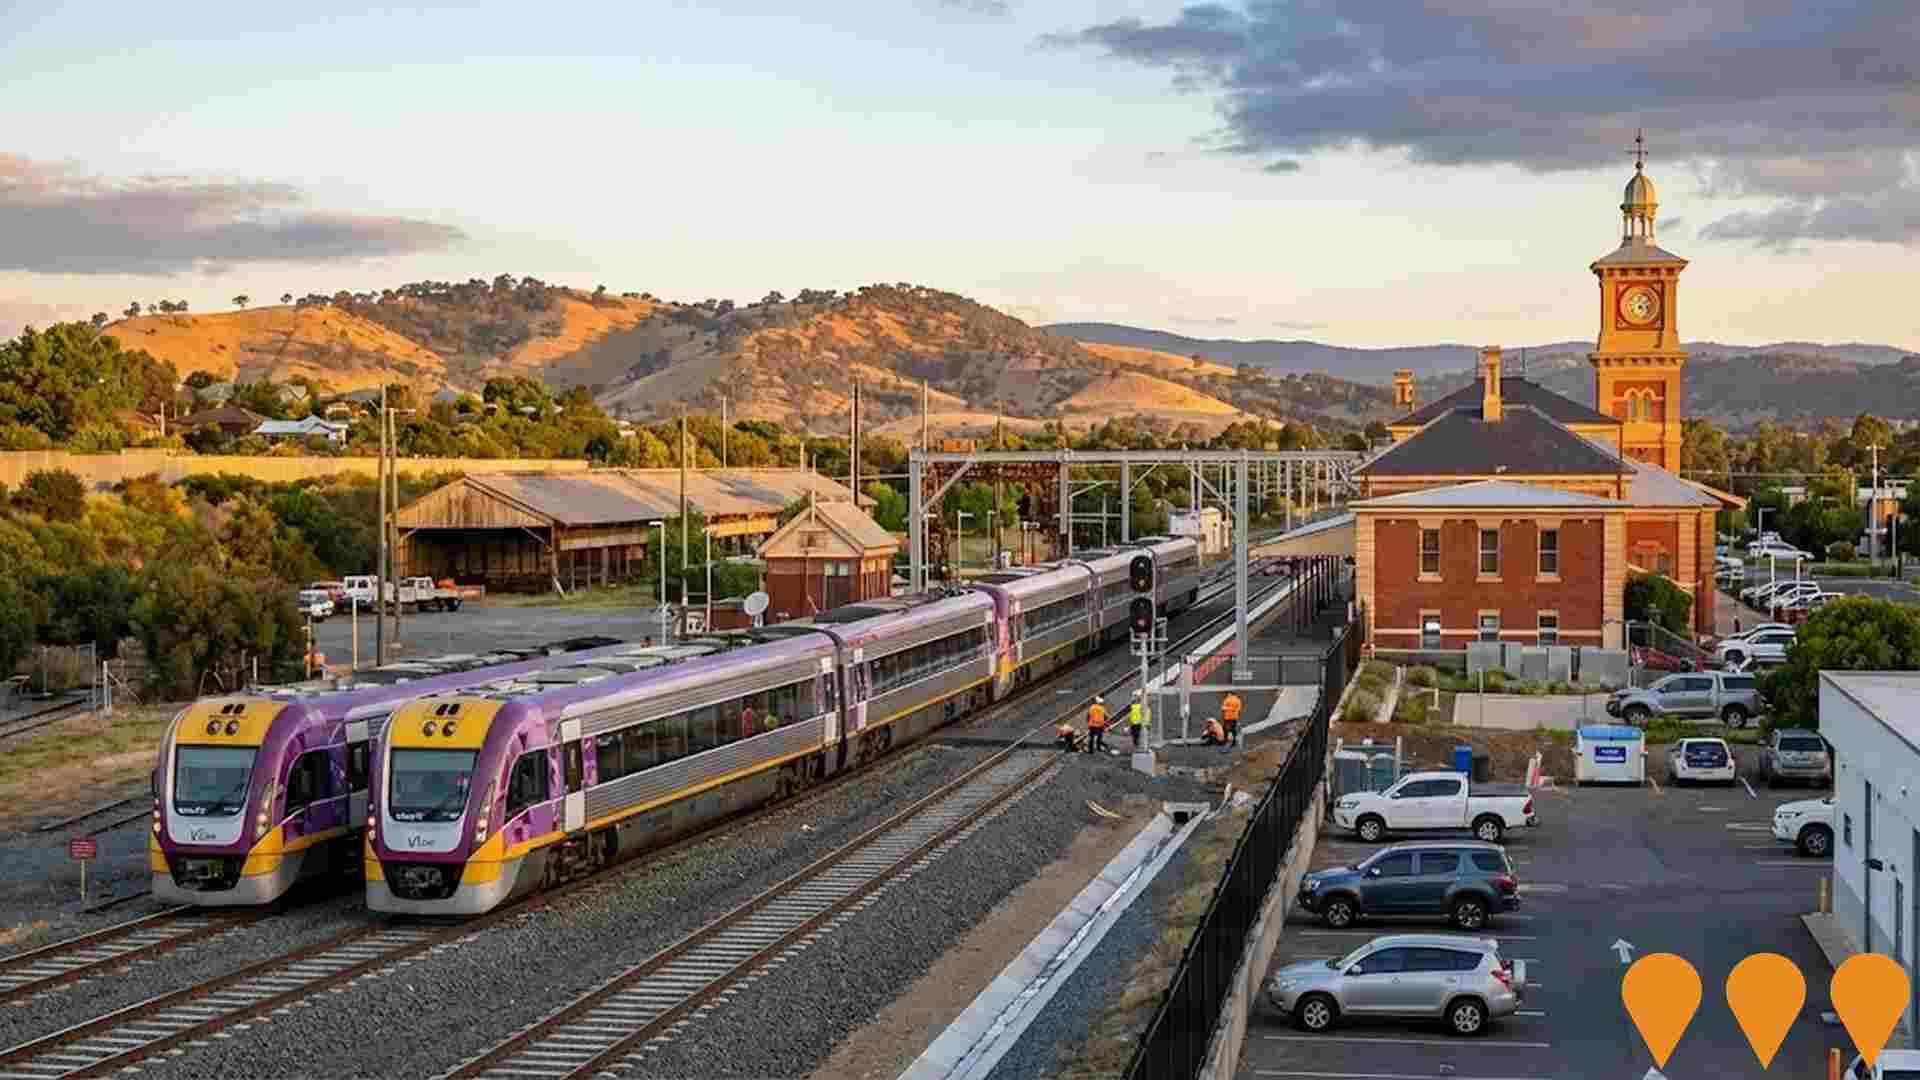
North East Rail Line Upgrade
Major upgrade to the North East Rail Line between Melbourne and Albury-Wodonga, improving freight and passenger services, including track resurfacing, mud-hole removal, drainage improvements, bridge upgrades, and signalling enhancements to allow VLocity trains and better ride quality.
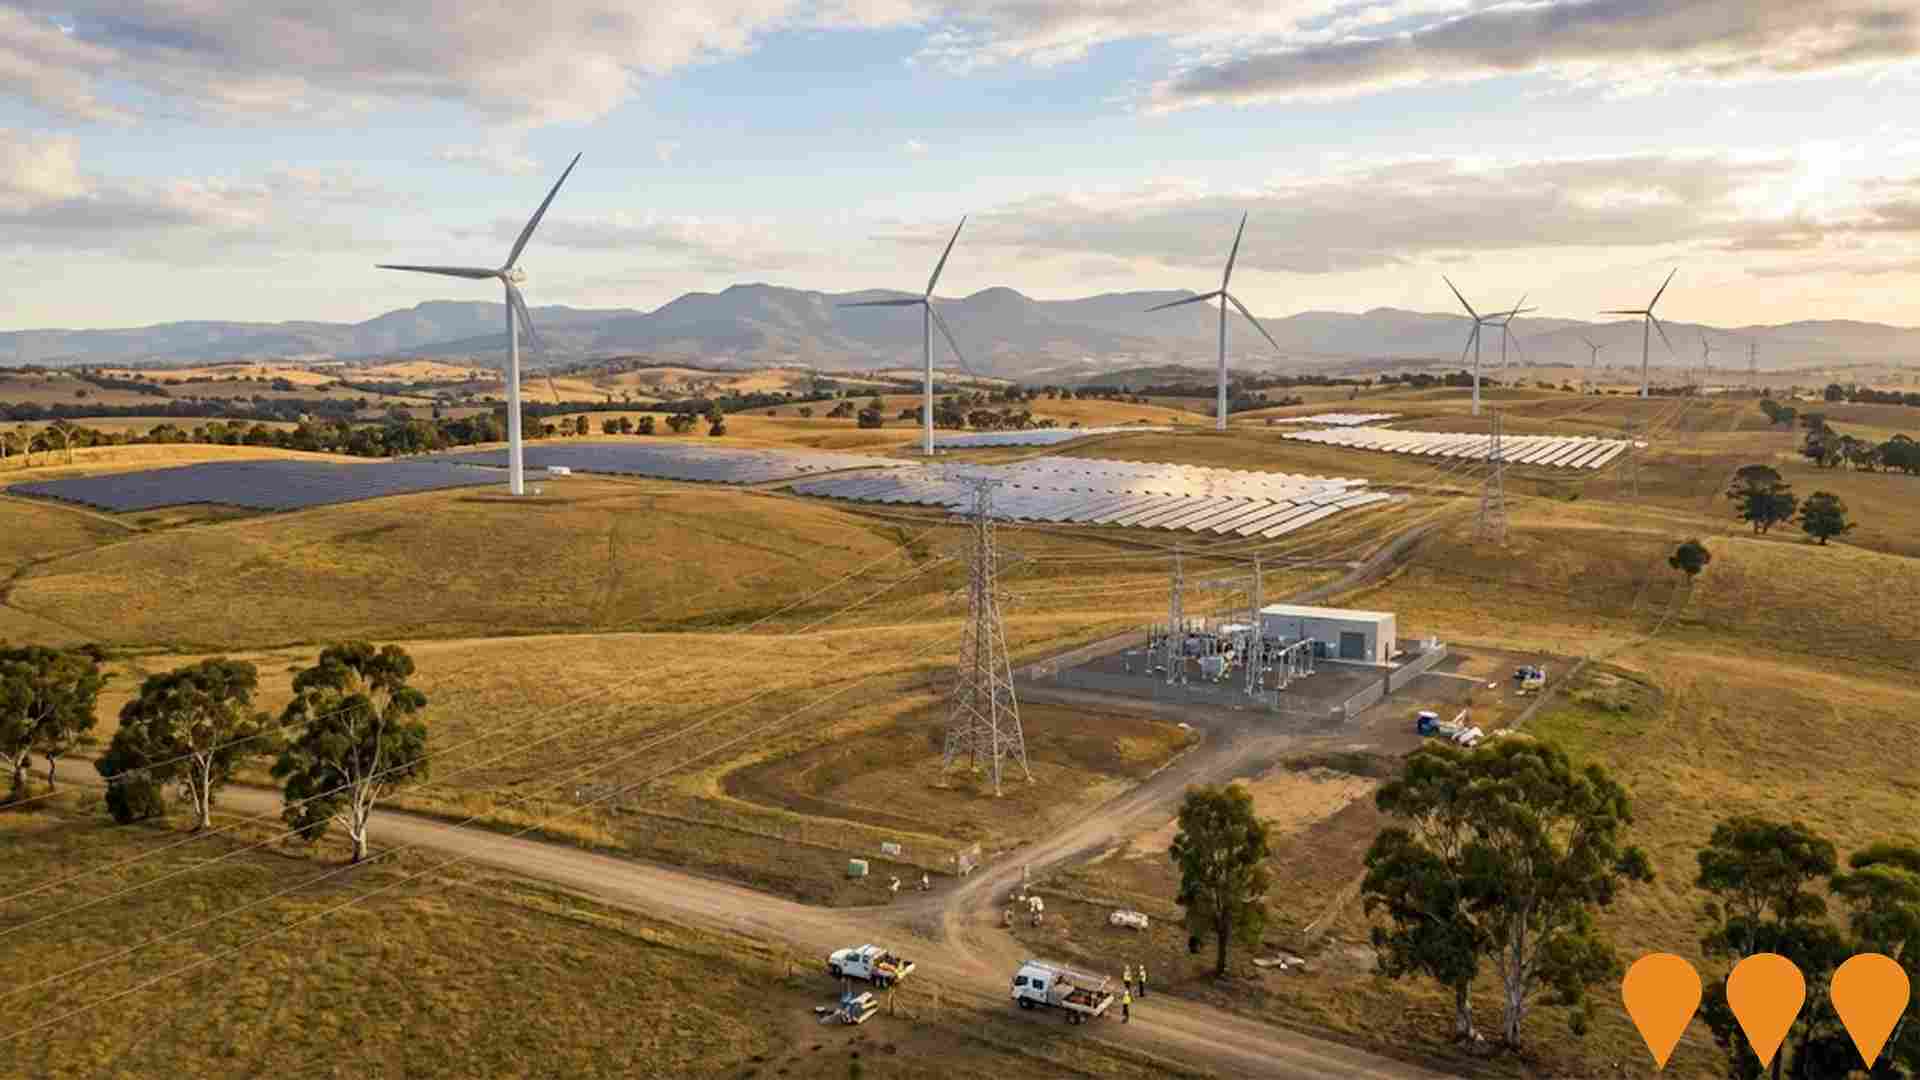
Victorian Renewable Energy Zones
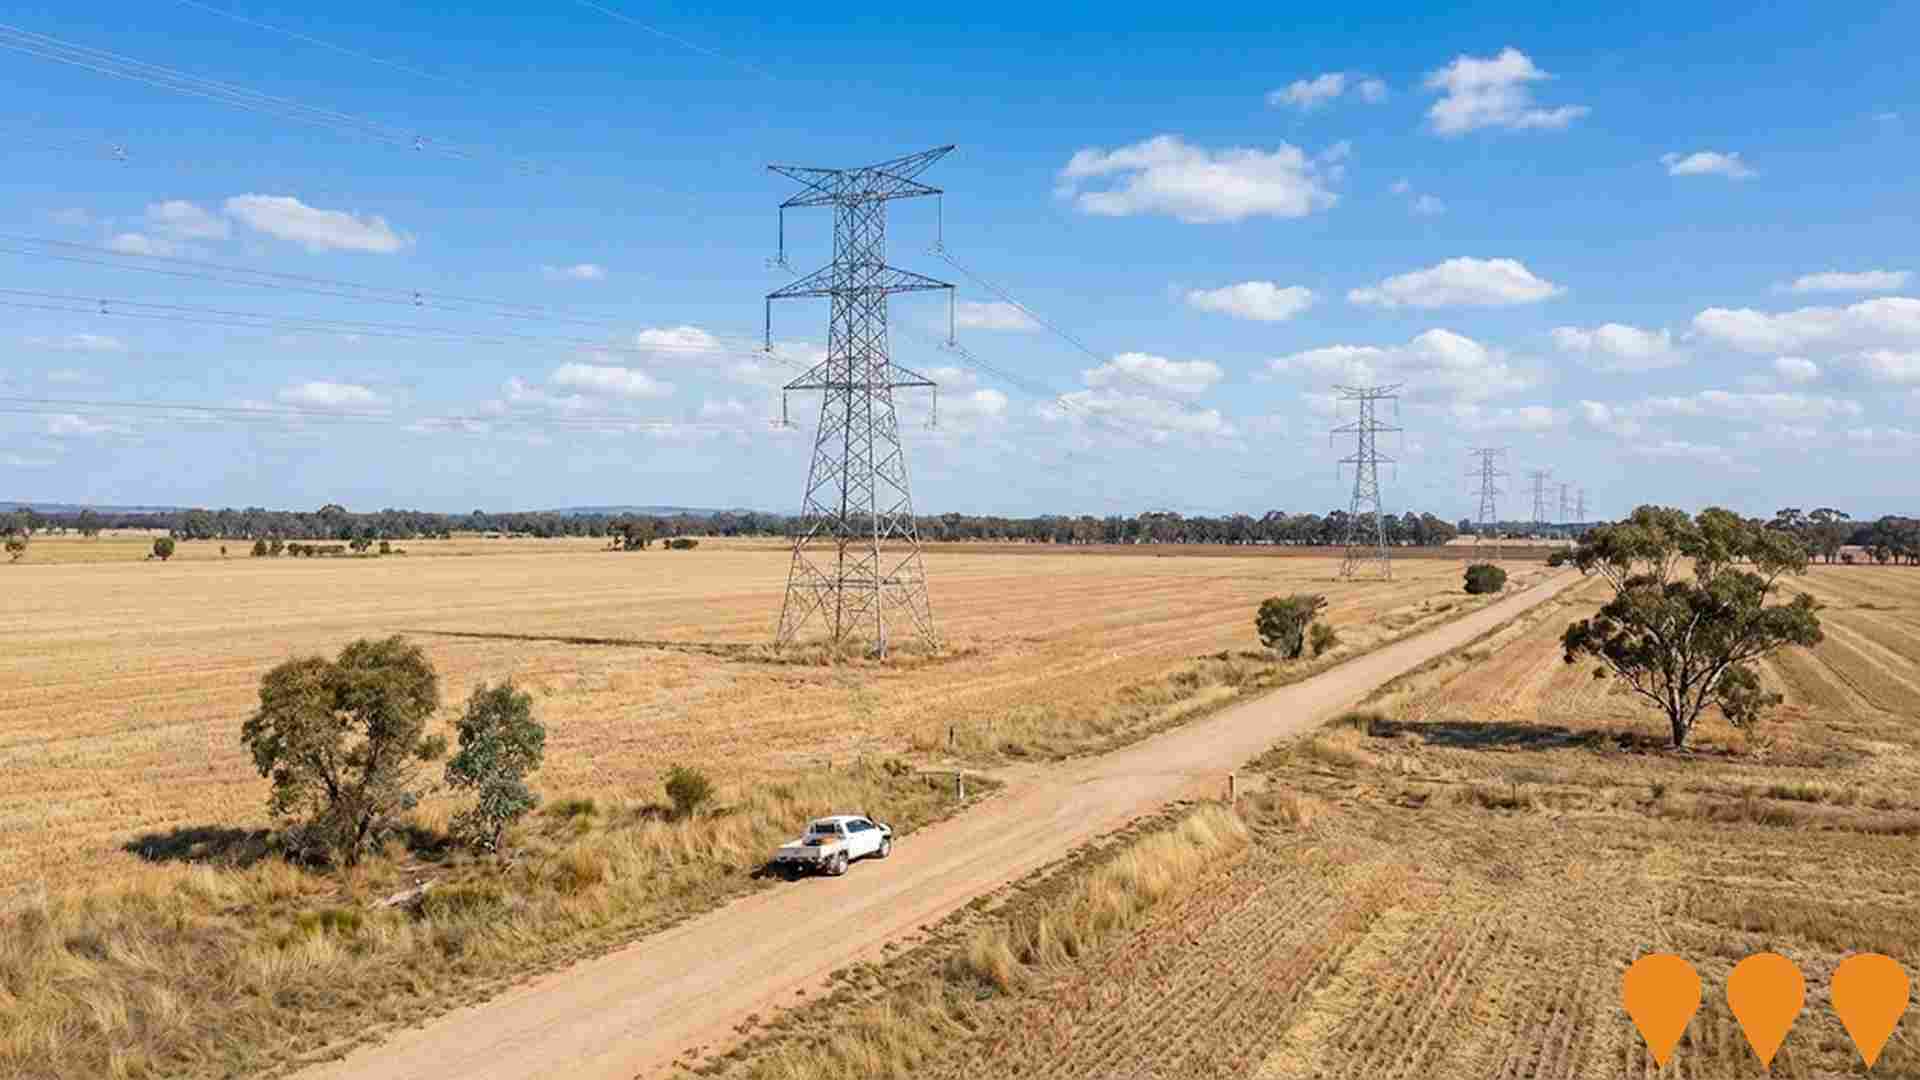
VicGrid, a Victorian Government agency, is coordinating the planning and staged declaration of six proposed onshore Renewable Energy Zones (plus a Gippsland shoreline zone to support offshore wind). The 2025 Victorian Transmission Plan identifies the indicative REZ locations, access limits and the transmission works needed to connect new wind, solar and storage while minimising impacts on communities, Traditional Owners, agriculture and the environment. Each REZ will proceed through a statutory declaration and consultation process before competitive allocation of grid access to projects.
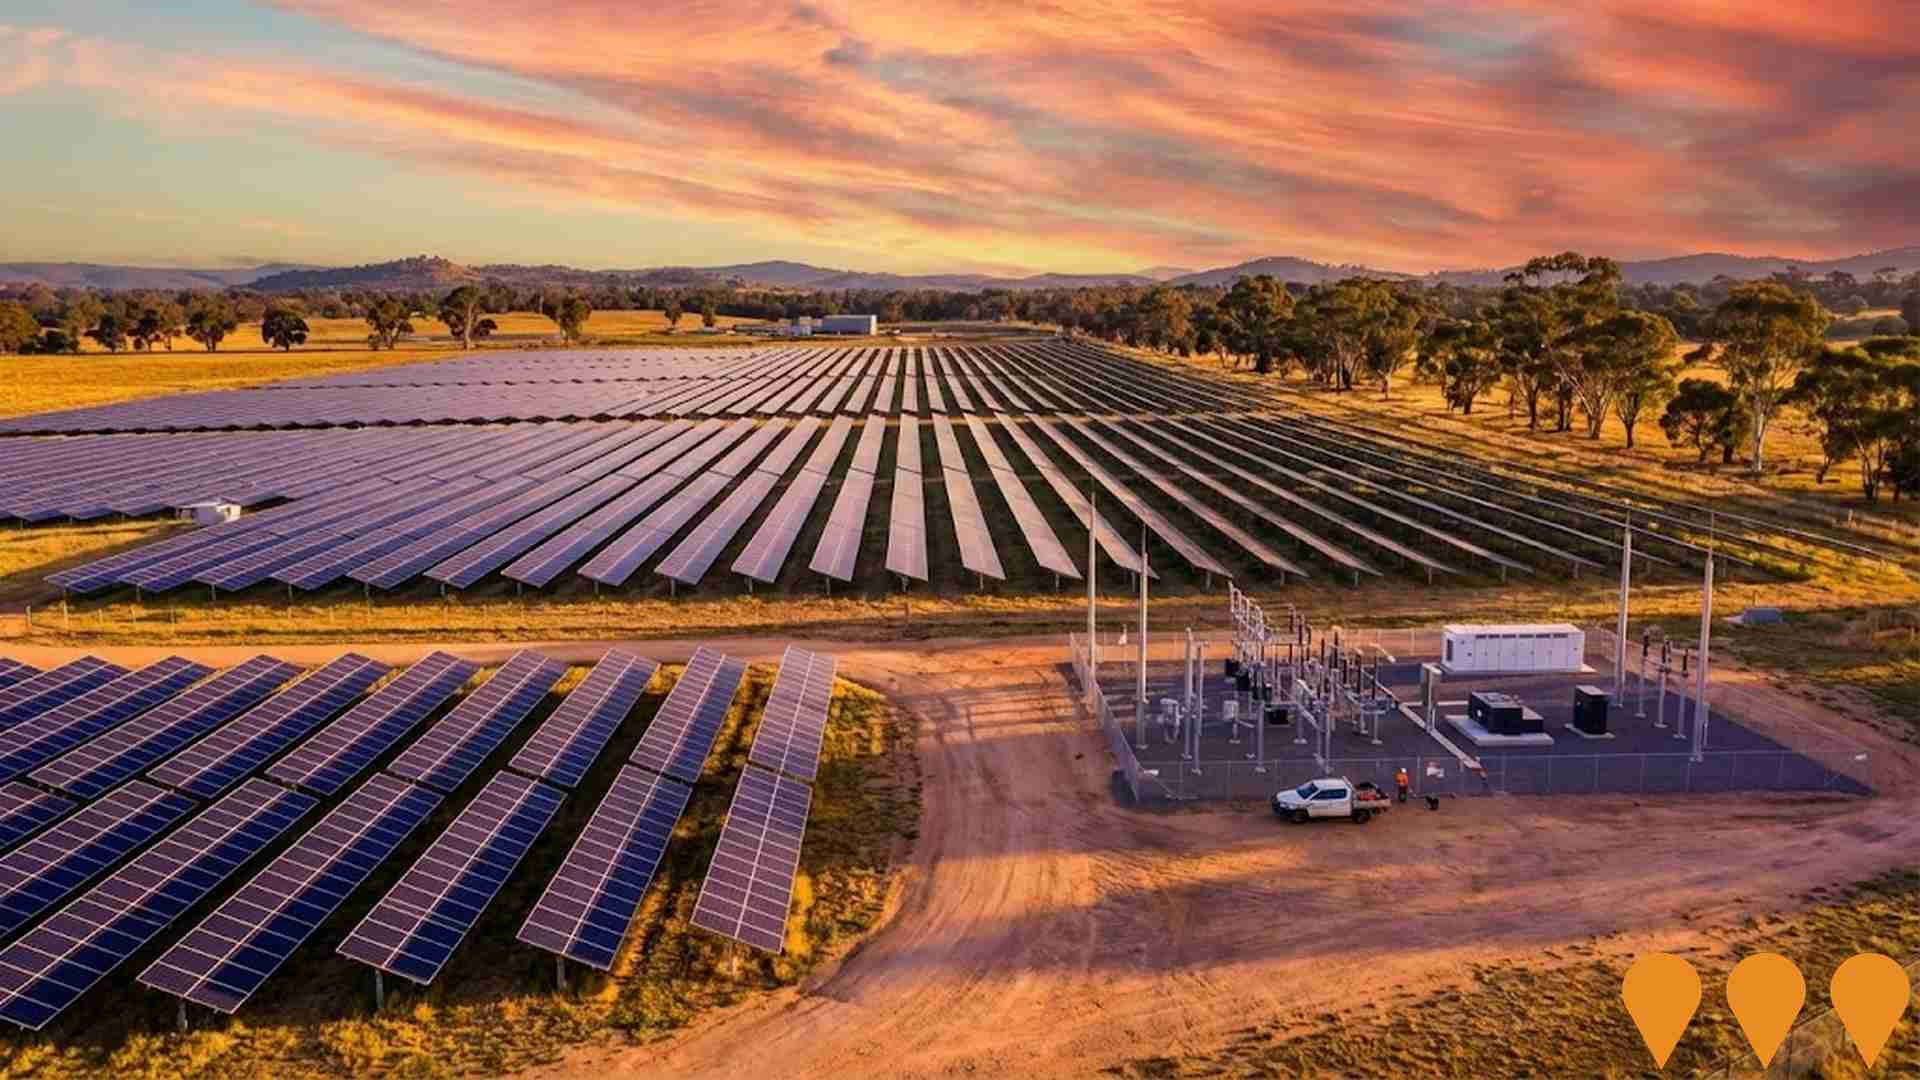
Wodonga Solar Farm
A completed 3 megawatt solar farm featuring 6,500 panels with single-axis tracking system, now powering the Wodonga Wastewater Treatment Plant with renewable energy. Operational since August 2023, the facility generates enough electricity to power the treatment plant during daylight hours with surplus energy fed back to the grid. The project reduces North East Water's carbon footprint by 6,000 tonnes of CO2 annually and contributes to the corporation's 100% renewable energy achievement.
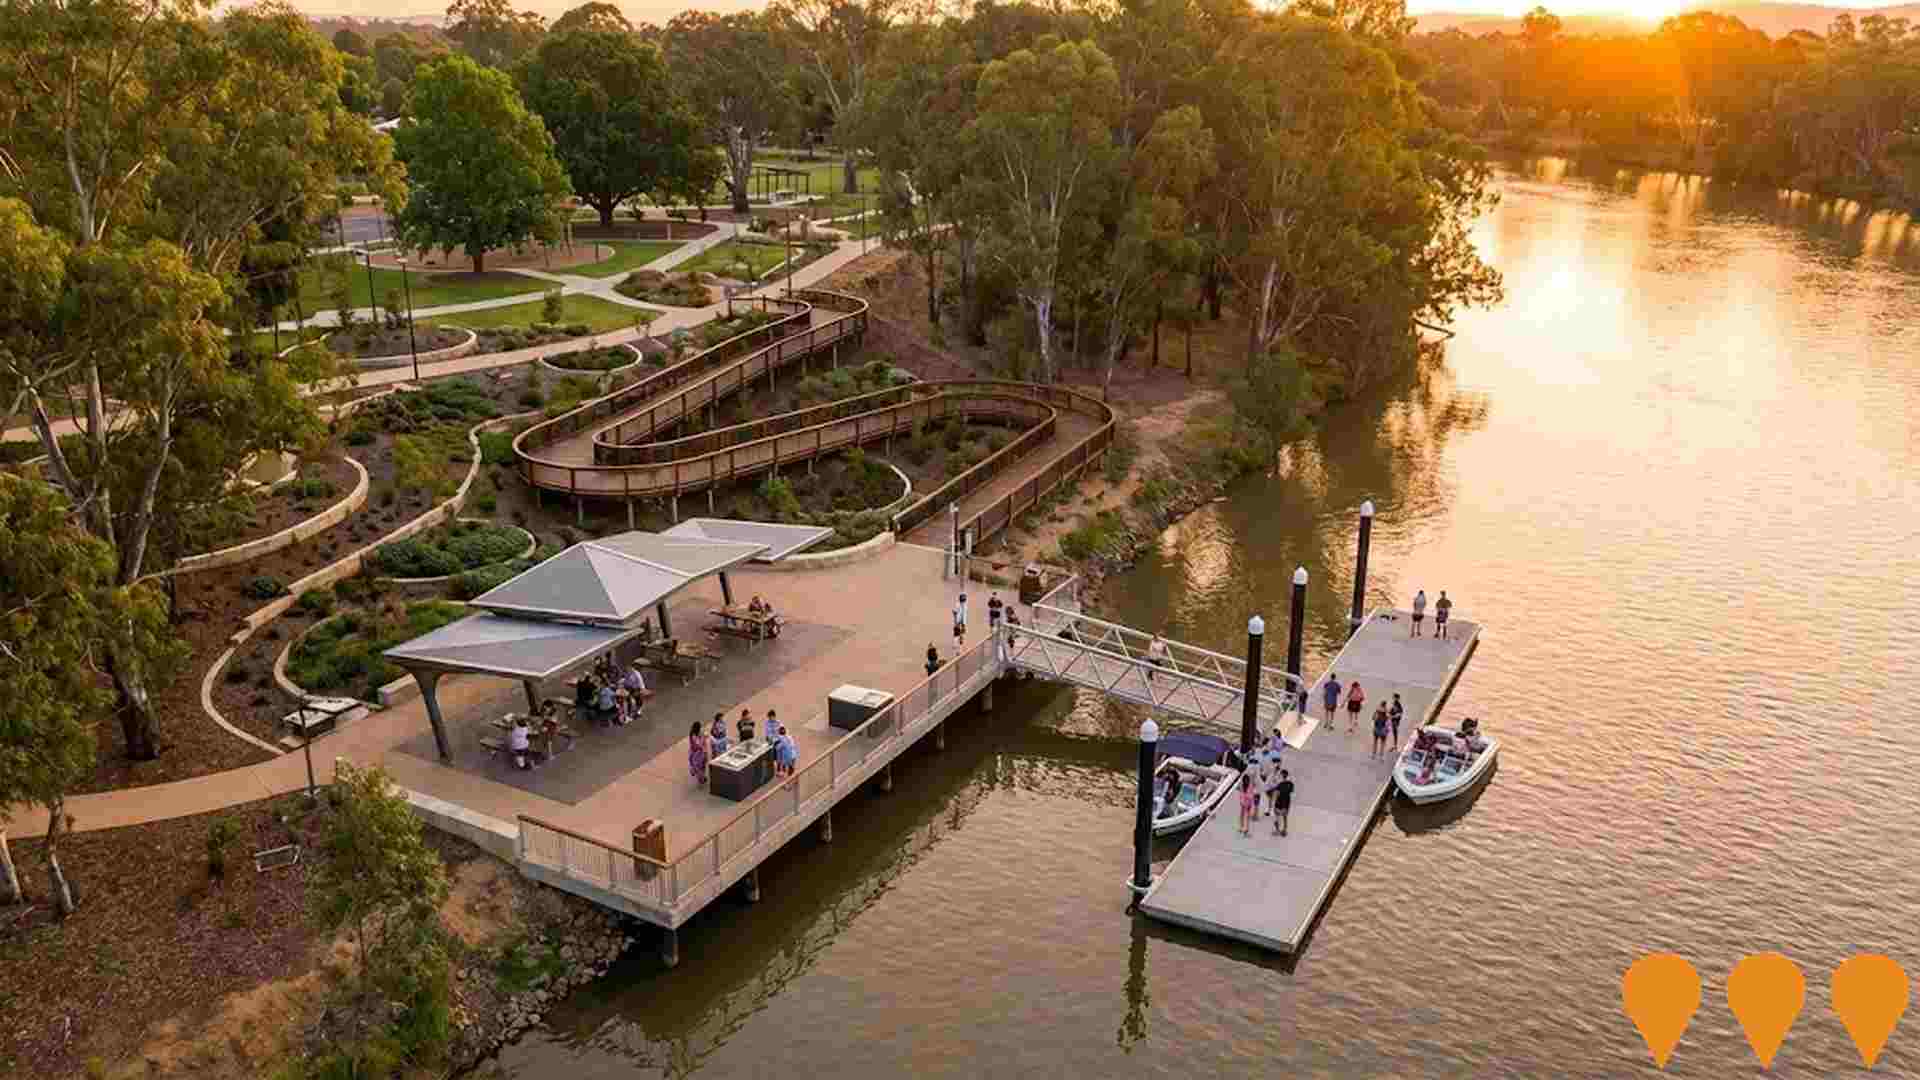
Albury Riverside Precinct
Public open space upgrade along the Murray River delivering an elevated all-abilities boardwalk to Bungambrawatha Creek, jetty and floating dock, river viewing points, BBQ and picnic facilities, shade structures, improved car parking, lighting, landscaping and new pathways linking Hovell Tree Park to the Albury Swim Centre. Project completed July 2023 with a total budget of approximately $8.7M.
VNI West (NSW section)
NSW portion of the VNI West interconnector: a proposed 500 kV double-circuit transmission line linking Transgrid's Dinawan Substation (near Coleambally) to the NSW/Victoria border north of Kerang, with associated upgrades including works on Transmission Line 51 near Wagga Wagga and expansion works at Dinawan Substation. The NSW Environmental Impact Statement (EIS) is on public exhibition in August 2025, and Transgrid has announced staged delivery with Stage 1 to Dinawan/South West REZ by early 2029 and Stage 2 to the Victorian border aligned to November 2030.
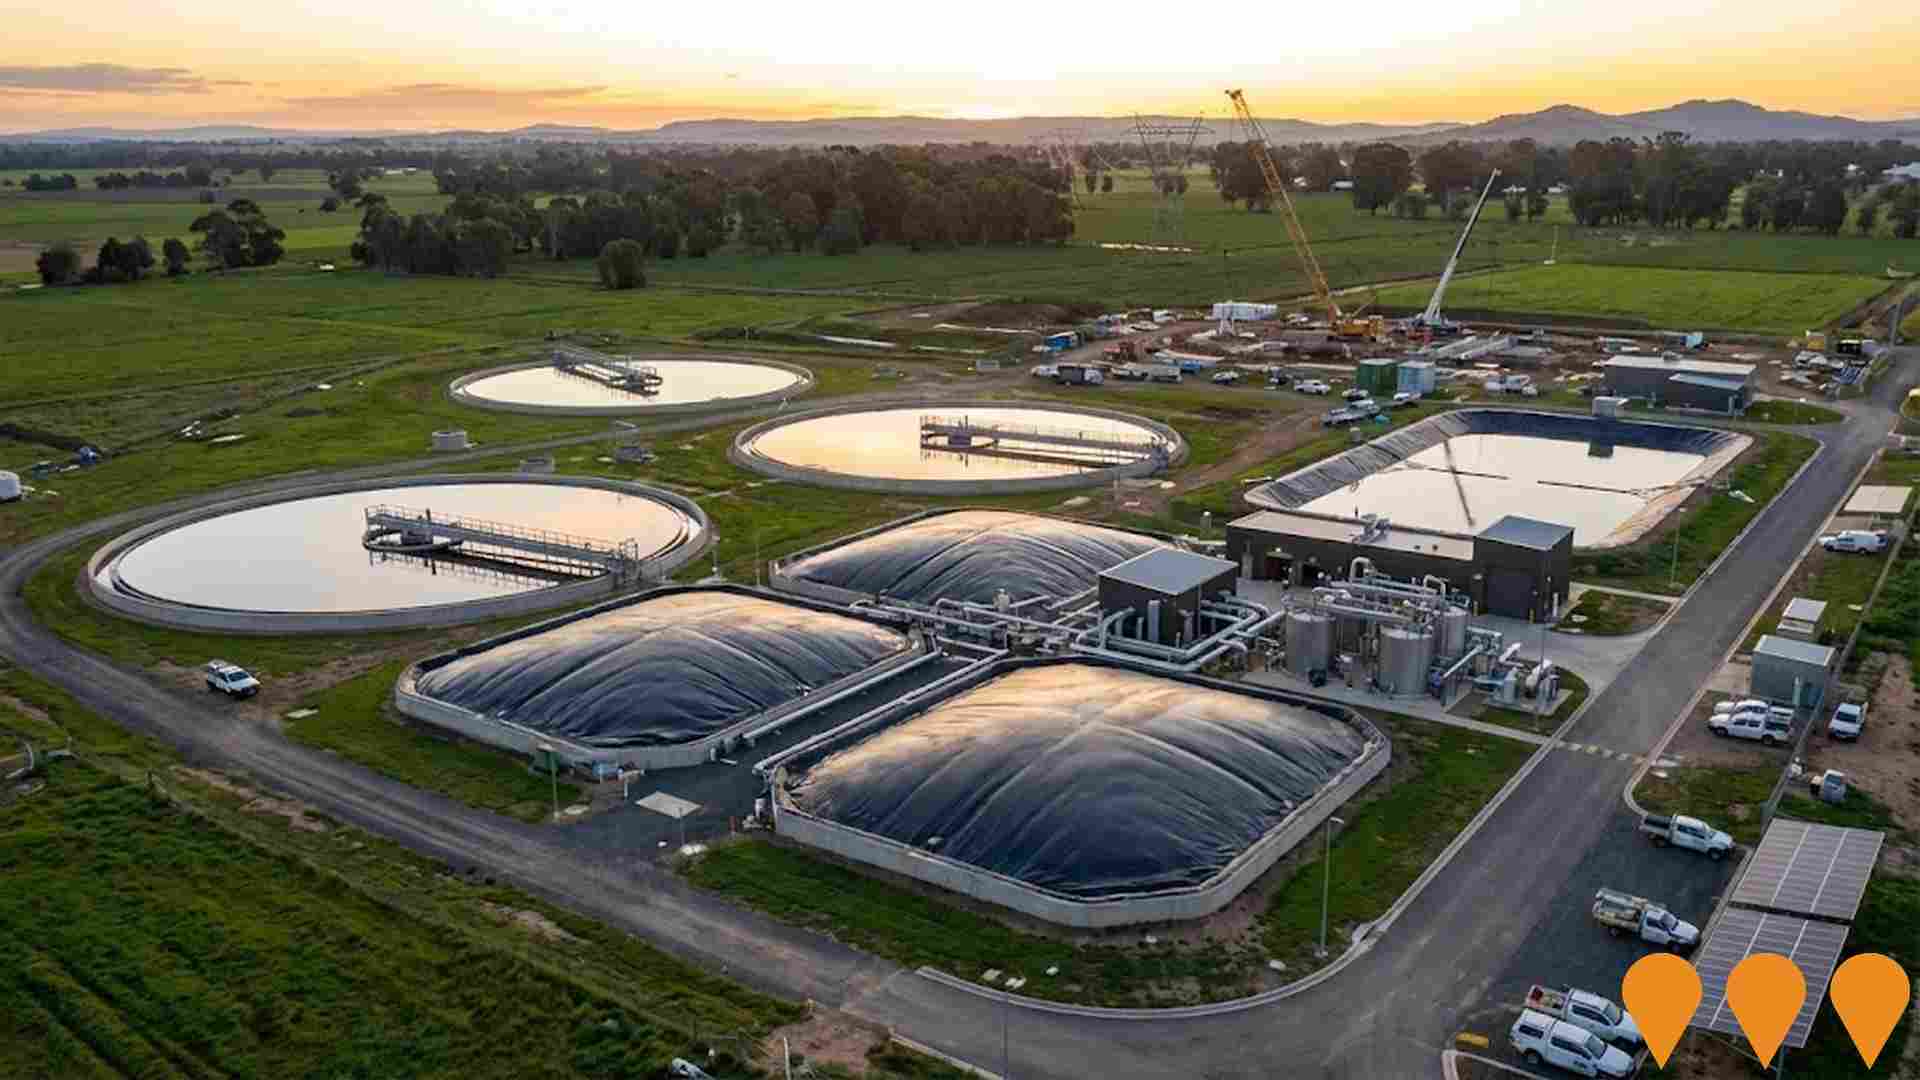
Wodonga Wastewater Treatment Plant Expansion
Major expansion of the wastewater treatment plant to double capacity from current levels to support Wodonga's growing population expected to reach 90,000 over 25 years. Features covered anaerobic lagoons for biogas recovery and renewable electricity generation, reducing emissions by 6,500 tonnes of CO2 annually. The upgrade enables more effective reuse of waste to generate energy that can be used on-site or fed back into the electricity grid, creating a self-sustaining facility.
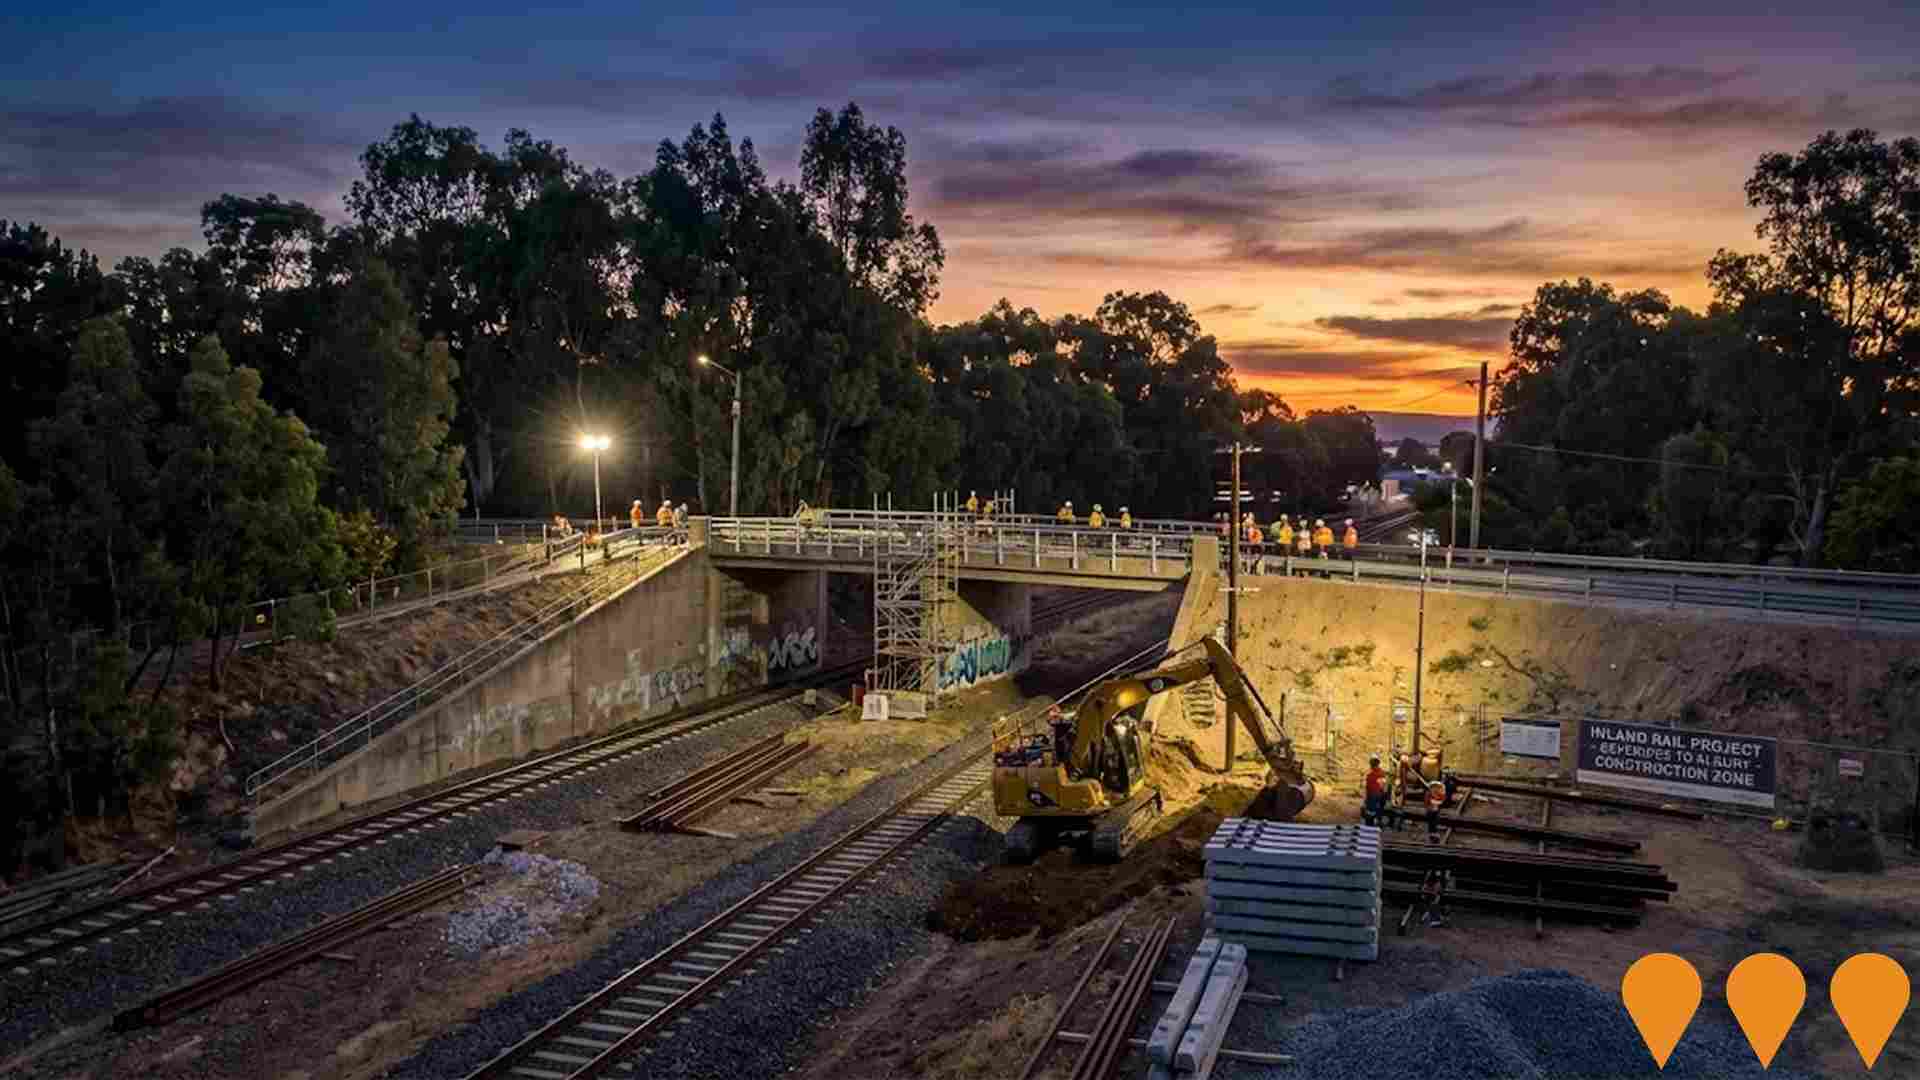
Inland Rail Beveridge to Albury
262km rail corridor upgrade enabling double-stacked freight trains between Beveridge and Albury. Two-tranche delivery with Tranche 1 under construction including bridge replacements and track modifications. John Holland contracted for Tranche 2.
Employment
AreaSearch analysis reveals Chiltern - Indigo Valley recording weaker employment conditions than most comparable areas nationwide
Chiltern-Indigo Valley has a balanced workforce with white and blue collar jobs well represented. Essential services sectors are prominent, with an unemployment rate of 4.5% as of September 2025.
There are 1,743 employed residents, which is 0.7% higher than Rest of Vic.'s rate of 3.8%. Workforce participation stands at 62.0%, slightly above Rest of Vic.'s 57.4%. Key employment industries include health care & social assistance, manufacturing, and retail trade. Manufacturing particularly stands out with employment levels at 1.6 times the regional average.
Conversely, construction employs just 7.8% of local workers, lower than Rest of Vic.'s 10.4%. The area may have limited local job opportunities based on Census data comparison. Between September 2024 and September 2025, labour force decreased by 1.5%, employment declined by 2.2%, leading to a rise in unemployment by 0.8 percentage points. In contrast, Rest of Vic. saw an employment decline of 0.7% and labour force decline of 0.6%. State-wide data up to 25-Nov-25 shows VIC employment grew by 1.13%, adding 41,950 jobs, with the state unemployment rate at 4.7%. National forecasts from Jobs and Skills Australia project national employment growth of 6.6% over five years and 13.7% over ten years. Applying these projections to Chiltern-Indigo Valley's industry mix suggests local employment could increase by 5.7% over five years and 12.6% over ten years, though this is a simple extrapolation for illustrative purposes.
Frequently Asked Questions - Employment
Income
Income levels sit below national averages according to AreaSearch assessment
The median income among taxpayers in The Chiltern - Indigo Valley SA2 was $48,880 in financial year 2022. The average income stood at $57,865 during the same period. These figures are lower than those for Rest of Vic., which had a median income of $48,741 and an average income of $60,693. By September 2025, estimates based on Wage Price Index growth suggest that the median income in The Chiltern - Indigo Valley SA2 would be approximately $54,824 and the average income around $64,901. According to the 2021 Census, household incomes ranked at the 37th percentile, family incomes at the 35th percentile, and personal incomes at the 39th percentile in The Chiltern - Indigo Valley. Income brackets showed that 36.1% of individuals earned between $1,500 and $2,999. This is consistent with broader trends across the surrounding region, where 30.3% fell into the same income category. Housing costs were manageable, with 88.2% retained by residents. However, disposable income was below average at the 40th percentile, and The Chiltern - Indigo Valley's SEIFA income ranking placed it in the 4th decile.
Frequently Asked Questions - Income
Housing
Chiltern - Indigo Valley is characterized by a predominantly suburban housing profile, with above-average rates of outright home ownership
The dwelling structure in Chiltern-Indigo Valley, as per the latest Census, consisted of 94.9% houses and 5.1% other dwellings (including semi-detached homes, apartments, and 'other' dwellings). This compares to Non-Metro Vic.'s 91.6% houses and 8.5% other dwellings. Home ownership in Chiltern-Indigo Valley stood at 43.1%, with the remaining dwellings either mortgaged (46.1%) or rented (10.8%). The median monthly mortgage repayment was $1,389, below Non-Metro Vic.'s average of $1,473 and the national average of $1,863. The median weekly rent figure was recorded at $260, compared to Non-Metro Vic.'s $280 and the national figure of $375.
Frequently Asked Questions - Housing
Household Composition
Chiltern - Indigo Valley has a typical household mix, with a fairly typical median household size
Family households constitute 71.6 percent of all households, including 28.7 percent couples with children, 34.9 percent couples without children, and 6.7 percent single parent families. Non-family households comprise the remaining 28.4 percent, with lone person households at 26.3 percent and group households at 2.5 percent of the total. The median household size is 2.4 people, which aligns with the average for the Rest of Vic.
Frequently Asked Questions - Households
Local Schools & Education
Chiltern - Indigo Valley shows below-average educational performance compared to national benchmarks, though pockets of achievement exist
The area has lower university qualification rates at 18.6%, compared to Victoria's average of 33.4%. Bachelor degrees are the most common at 12.2%, followed by graduate diplomas (3.7%) and postgraduate qualifications (2.7%). Vocational credentials are held by 43.2% of residents aged 15 and above, with advanced diplomas at 11.2% and certificates at 32.0%. Educational participation is high, with 27.2% of residents currently enrolled in formal education.
This includes 9.7% in secondary education, 9.1% in primary education, and 2.4% pursuing tertiary education.
Frequently Asked Questions - Education
Schools Detail
Nearby Services & Amenities
Transport
Transport servicing is very low compared to other areas nationally based on assessment of service frequency, route connectivity and accessibility
Chiltern-Indigo Valley's public transport analysis indicates four operational stops, offering a mix of train and bus services. These stops are served by five distinct routes, collectively facilitating 82 weekly passenger trips. Transport accessibility is rated as moderate, with residents typically residing 595 meters from the nearest stop.
Service frequency averages 11 trips per day across all routes, translating to approximately 20 weekly trips per individual stop.
Frequently Asked Questions - Transport
Transport Stops Detail
Health
Health performance in Chiltern - Indigo Valley is well below average with prevalence of common health conditions notable across both younger and older age cohorts
Chiltern-Indigo Valley faces significant health challenges, with common conditions prevalent across both younger and older age groups. Private health cover is relatively low at approximately 49% (1,605 people), compared to the national average of 55.3%.
The most frequent medical conditions are arthritis (10.8%) and mental health issues (9.6%), while 60.3% report no medical ailments, slightly lower than the Rest of Vic's 64.1%. The area has a higher proportion of residents aged 65 and over at 21.7% (712 people), compared to Rest of Vic's 20.7%. Senior health outcomes present challenges but perform better than the general population in health metrics.
Frequently Asked Questions - Health
Cultural Diversity
The latest Census data sees Chiltern - Indigo Valley placing among the least culturally diverse areas in the country when compared across a range of language and cultural background related metrics
Chiltern-Indigo Valley had a cultural diversity index below average, with 91.7% of its population being Australian citizens, 91.5% born in Australia, and 98.3% speaking English only at home. Christianity was the dominant religion, accounting for 50.4% of the population, compared to 48.2% across Rest of Vic., as of 2016. The top three ancestry groups were Australian (35.1%), English (32.6%), and Irish (9.8%).
Notably, Dutch ancestry was overrepresented at 1.7%, compared to the regional average of 1.6%. Similarly, German ancestry stood at 4.4% versus the regional average of 4.8%, and Hungarian ancestry was slightly higher at 0.3% against the regional average of 0.2%.
Frequently Asked Questions - Diversity
Age
Chiltern - Indigo Valley hosts an older demographic, ranking in the top quartile nationwide
Chiltern - Indigo Valley has a median age of 46, which is slightly higher than the Rest of Vic.'s figure of 43 and significantly higher than the national norm of 38. The 55-64 age group shows strong representation at 16.8%, compared to Rest of Vic.'s figure, whereas the 25-34 cohort is less prevalent at 9.3%. This 55-64 concentration is well above the national figure of 11.2%. Post-2021 Census data shows the 15 to 24 age group has grown from 10.2% to 12.1%, while the 45 to 54 cohort has declined from 15.2% to 13.8% and the 5 to 14 group dropped from 11.5% to 10.3%. By 2041, Chiltern - Indigo Valley is expected to see notable shifts in its age composition. Leading this demographic shift, the 35 to 44 group will grow by 46%, reaching 512 people from 349. Meanwhile, the 55 to 64 cohort grows by a modest 5% (26 people).
