Chart Color Schemes
This analysis uses ABS Statistical Areas Level 2 (SA2) boundaries, which can materially differ from Suburbs and Localities (SAL) even when sharing similar names.
SA2 boundaries are defined by the Australian Bureau of Statistics and are designed to represent communities for statistical reporting (e.g., census and ERP).
Suburbs and Localities (SAL) represent commonly-used suburb/locality names (postal-style areas) and may use different geographic boundaries. For comprehensive analysis, consider reviewing both boundary types if available.
est. as @ -- *
ABS ERP | -- people | --
2021 Census | -- people
Sales Activity
Curious about local property values? Filter the chart to assess the volume and appreciation (including resales) trends and regional comparisons, or scroll to the map below view this information at an individual property level.
Find a Recent Sale
Sales Detail
Population
Population growth drivers in Lavington are above average based on AreaSearch's ranking of recent, and medium to long-term trends
Lavington's population, as of November 2025, is approximately 15,861. This figure represents an increase of 196 people since the 2021 Census, which reported a population of 15,665. The change is inferred from ABS data showing an estimated resident population of 15,664 as of June 2024 and 195 validated new addresses added since the Census date. This results in a population density ratio of 738 persons per square kilometer, comparable to averages seen across other locations assessed by AreaSearch. Overseas migration contributed approximately 63.0% of overall population gains during recent periods.
AreaSearch uses ABS/Geoscience Australia projections for each SA2 area, released in 2024 with a base year of 2022. For areas not covered by this data, AreaSearch utilises NSW State Government's SA2 level projections, released in 2022 with a base year of 2021. Growth rates by age group from these aggregations are applied to all areas for years 2032 to 2041. Based on projected demographic shifts and latest annual ERP population numbers, the area is expected to grow by 2,425 persons to 2041, reflecting a total gain of 13.7% over the 17-year period.
Frequently Asked Questions - Population
Development
Residential development activity is lower than average in Lavington according to AreaSearch's national comparison of local real estate markets
Lavington recorded approximately 48 residential properties granted approval annually over the past five financial years, totalling 240 homes. As of FY-26, 34 approvals have been recorded. The average increase in residents per year per dwelling constructed between FY-21 and FY-25 was 1.1 people. However, this figure has eased to -0.1 people per dwelling over the past two financial years, indicating better supply availability. Development projects averaged $280,000 in construction value, aligning with broader regional development trends.
In FY-26, commercial development approvals totalled $11.1 million, reflecting moderate levels of commercial activity. Compared to the Rest of NSW, Lavington's building activity is 58.0% below the regional average per person. This constrained new construction typically reinforces demand and pricing for existing homes. The recent construction composition was 74.0% detached houses and 26.0% attached dwellings, preserving the area's low-density nature while attracting space-seeking buyers. As of FY-25, there were an estimated 457 people in the area per dwelling approval.
According to AreaSearch quarterly estimates, Lavington is projected to gain 2,174 residents by 2041. If current construction levels persist, housing supply may lag population growth, potentially intensifying buyer competition and supporting price growth.
Frequently Asked Questions - Development
Infrastructure
Lavington has emerging levels of nearby infrastructure activity, ranking in the 34thth percentile nationally
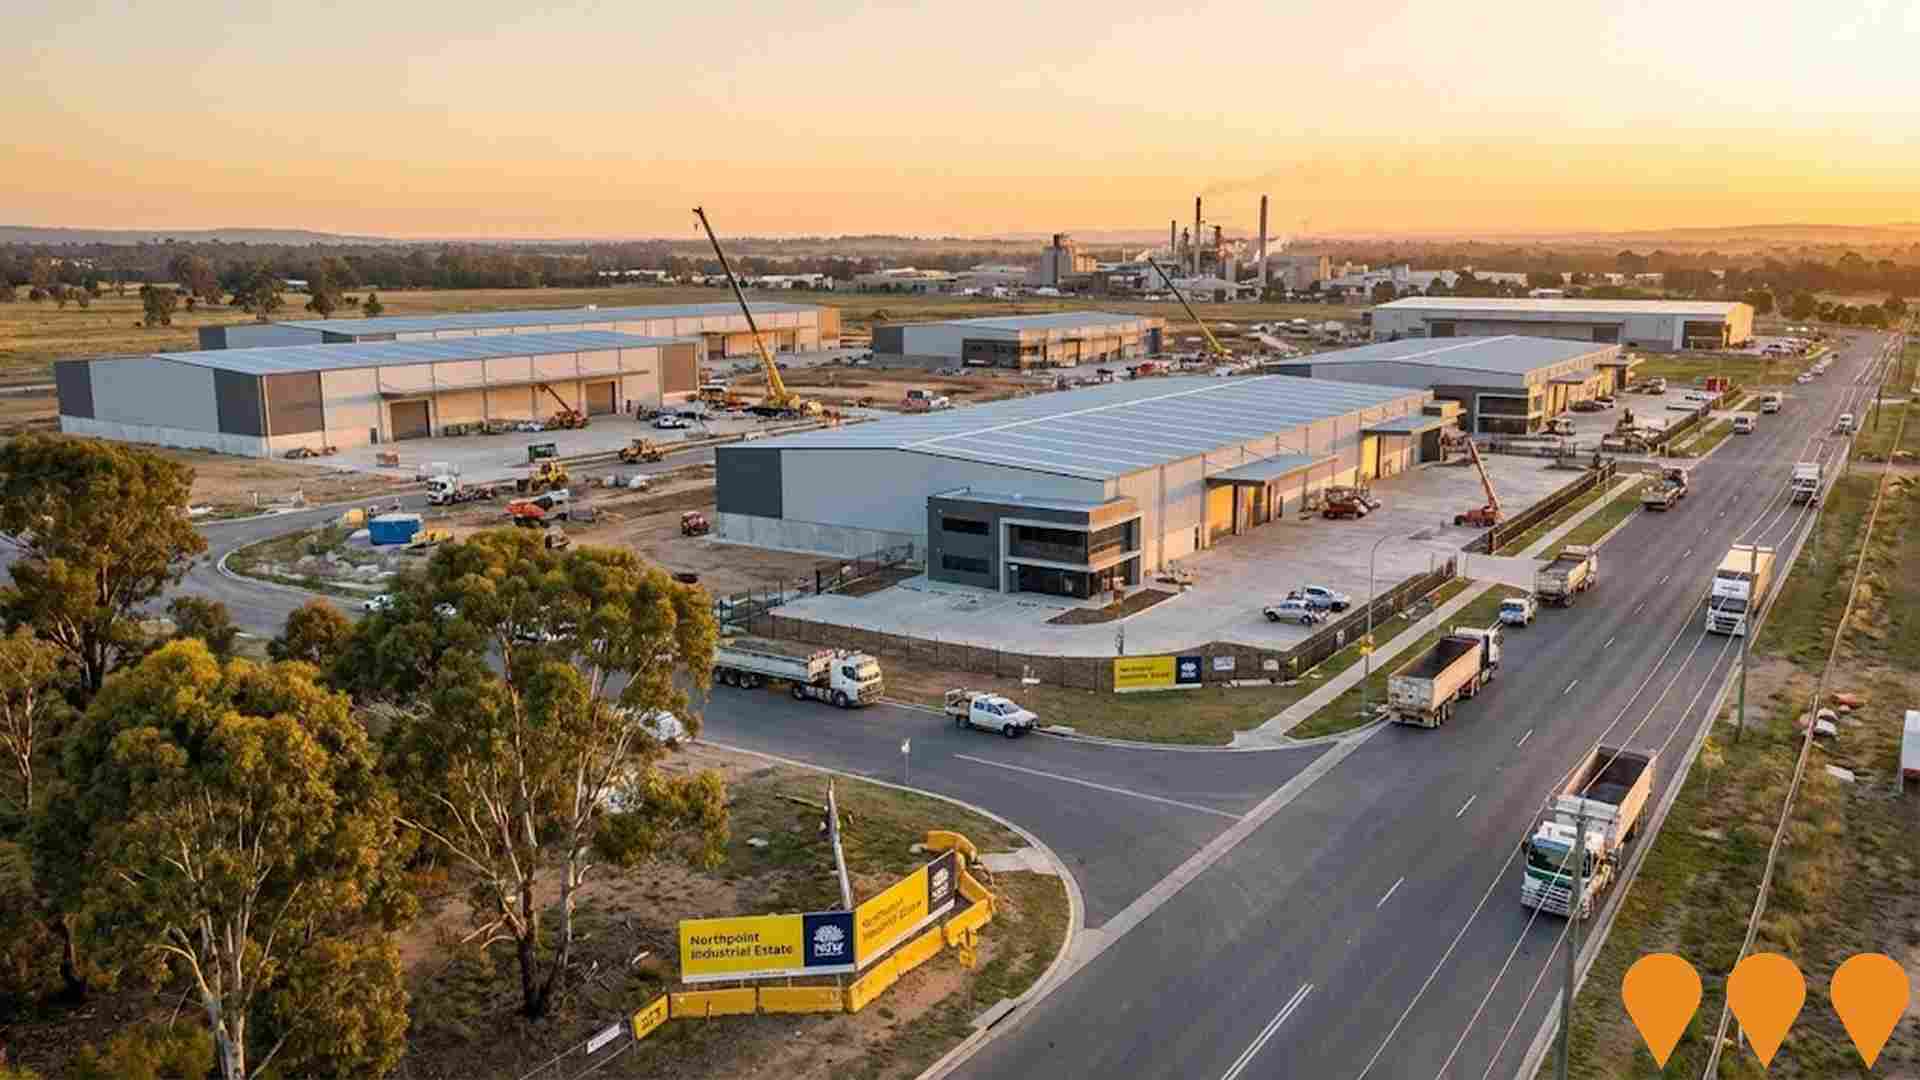
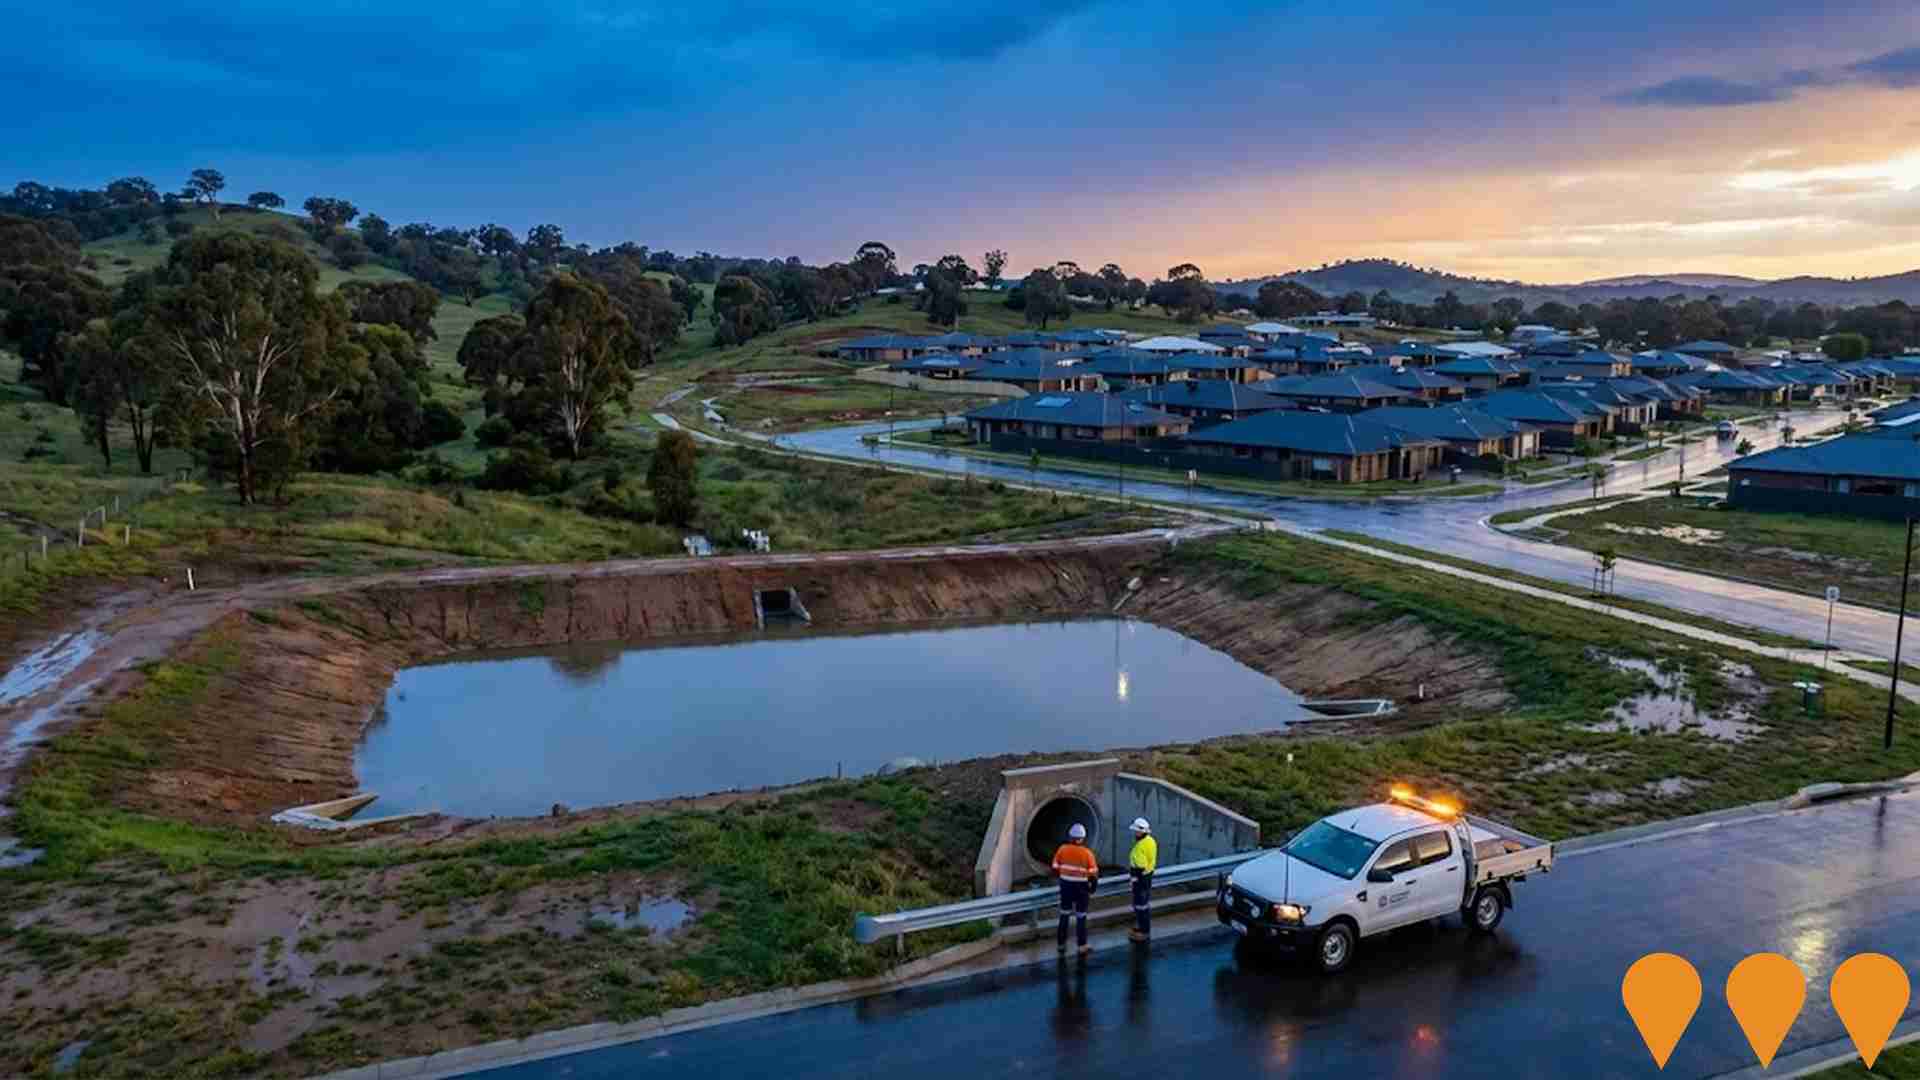
Changes to local infrastructure significantly impact an area's performance. AreaSearch has identified 26 projects that may affect this region. Notable projects include Lavington Swim Centre Redevelopment, Lavington Social Housing Project, Kerr Road Infrastructure Upgrades, and Bright Steps Academy Lavington. The following list details those most relevant.
Professional plan users can use the search below to filter and access additional projects.
INFRASTRUCTURE SEARCH
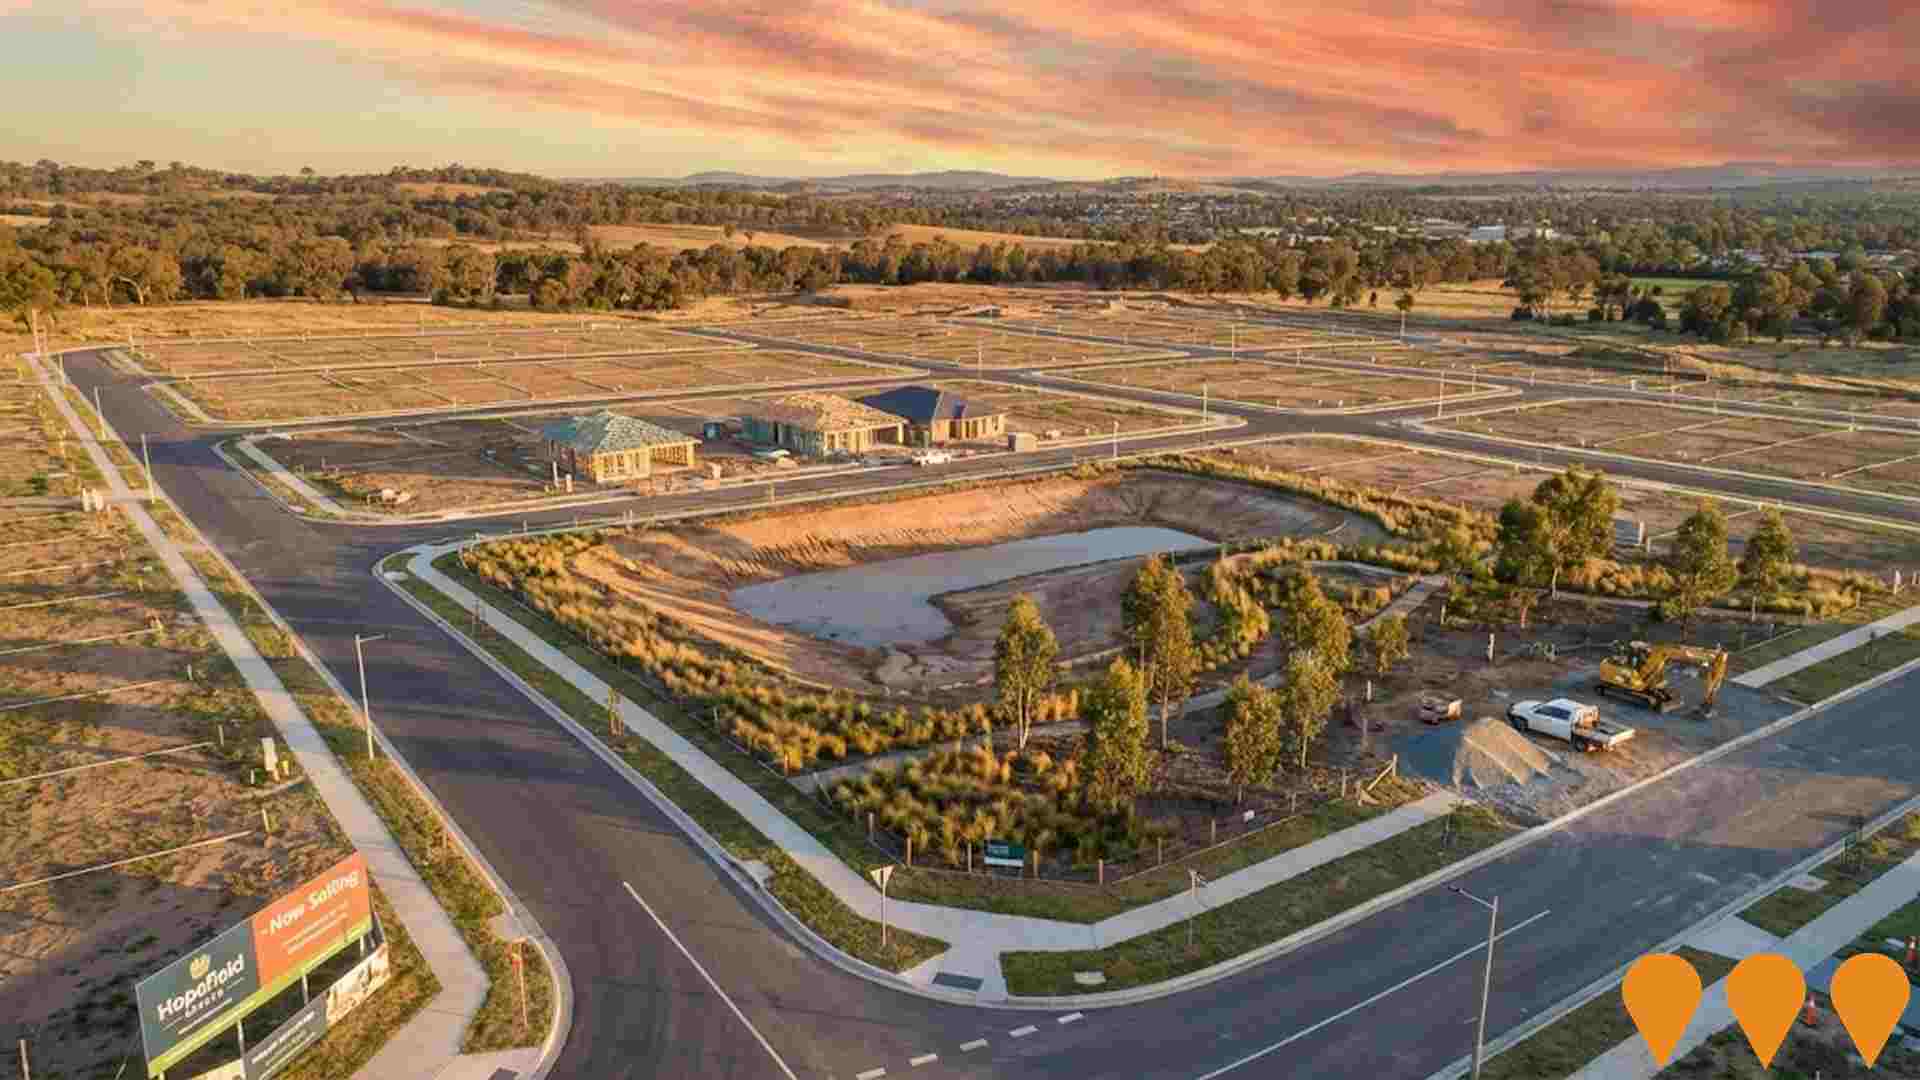
 Denotes AI-based impression for illustrative purposes only, not to be taken as definitive under any circumstances. Please follow links and conduct other investigations from the project's source for actual imagery. Developers and project owners wishing us to use original imagery please Contact Us and we will do so.
Frequently Asked Questions - Infrastructure
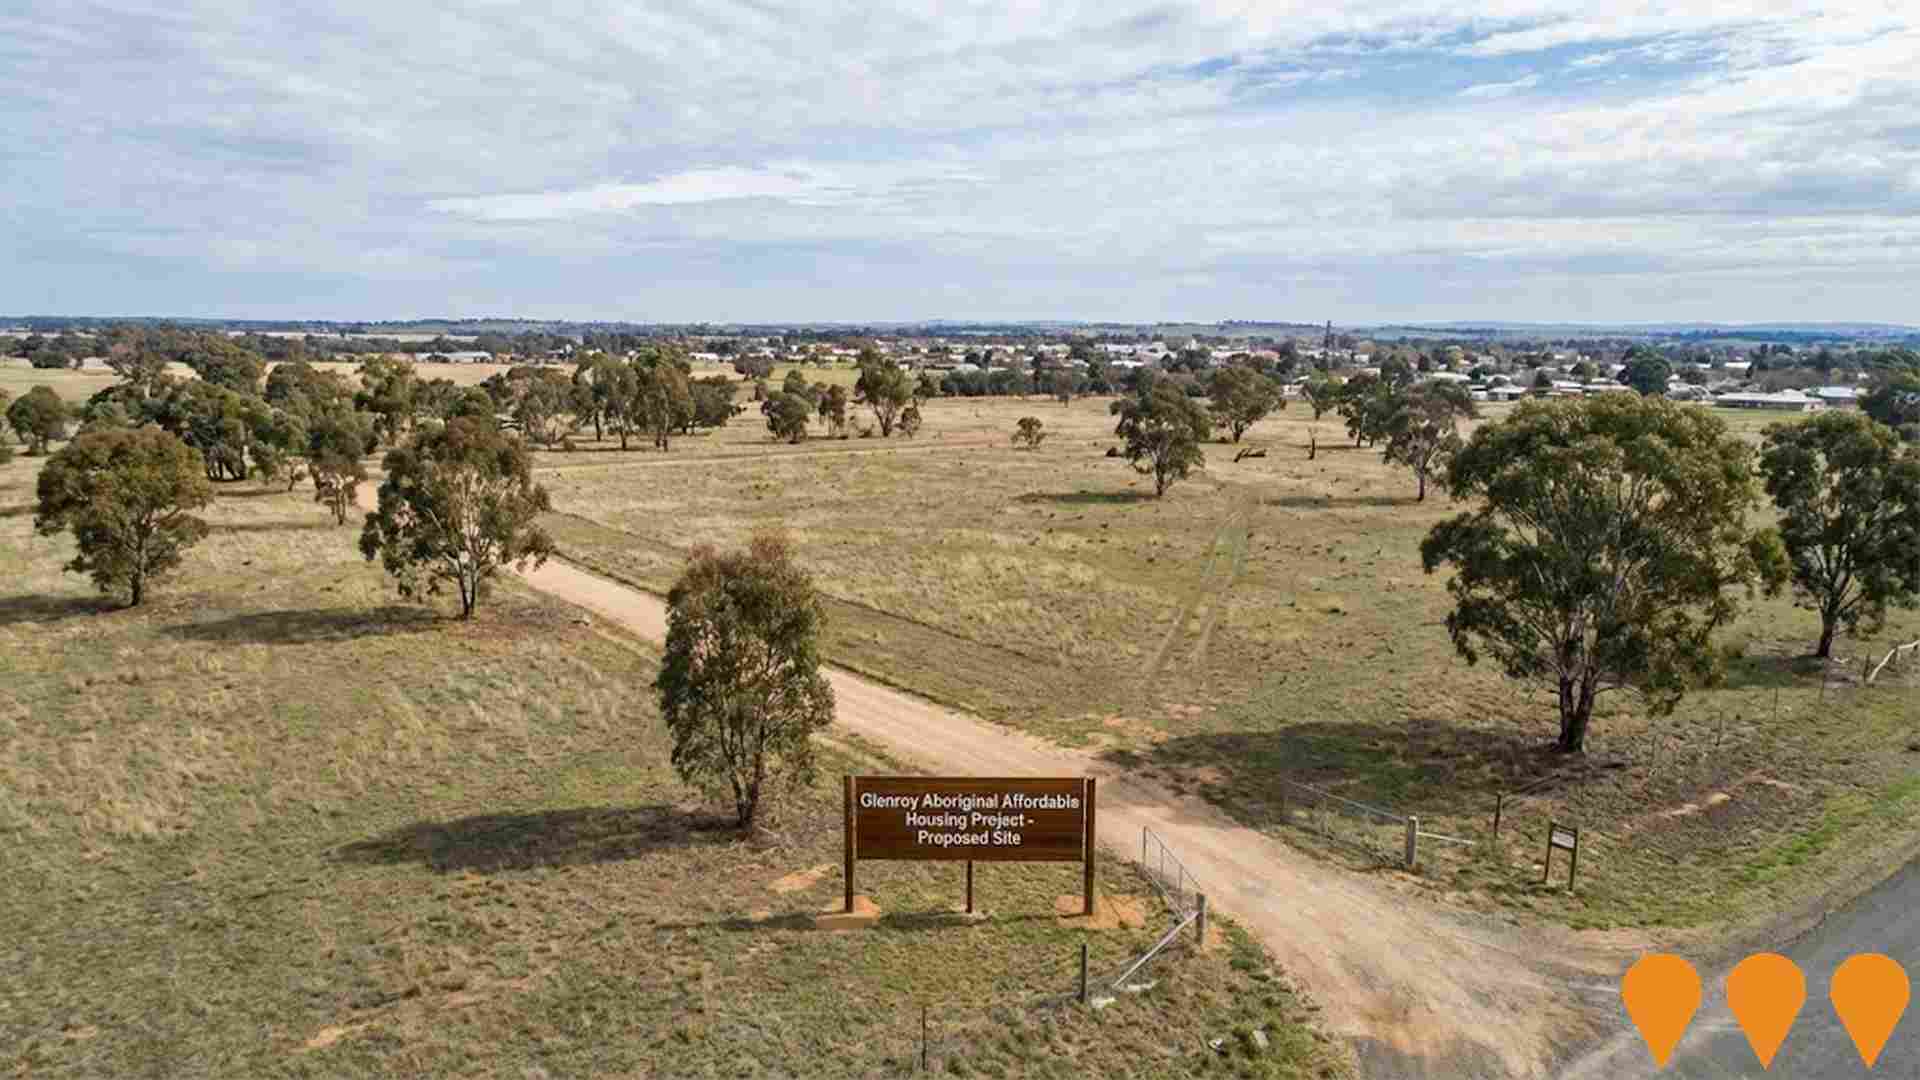
Glenroy Aboriginal Affordable Housing Project
Development of approximately 200 affordable housing units and industrial facilities on an 81,000 sqm block for the Aboriginal community, supported by a $590,000 grant. The project remains stalled due to native title issues and has not progressed past the proposed stage. There is no publicly available update suggesting the native title issues have been resolved as of October 2025. The developer continues to operate various community services.
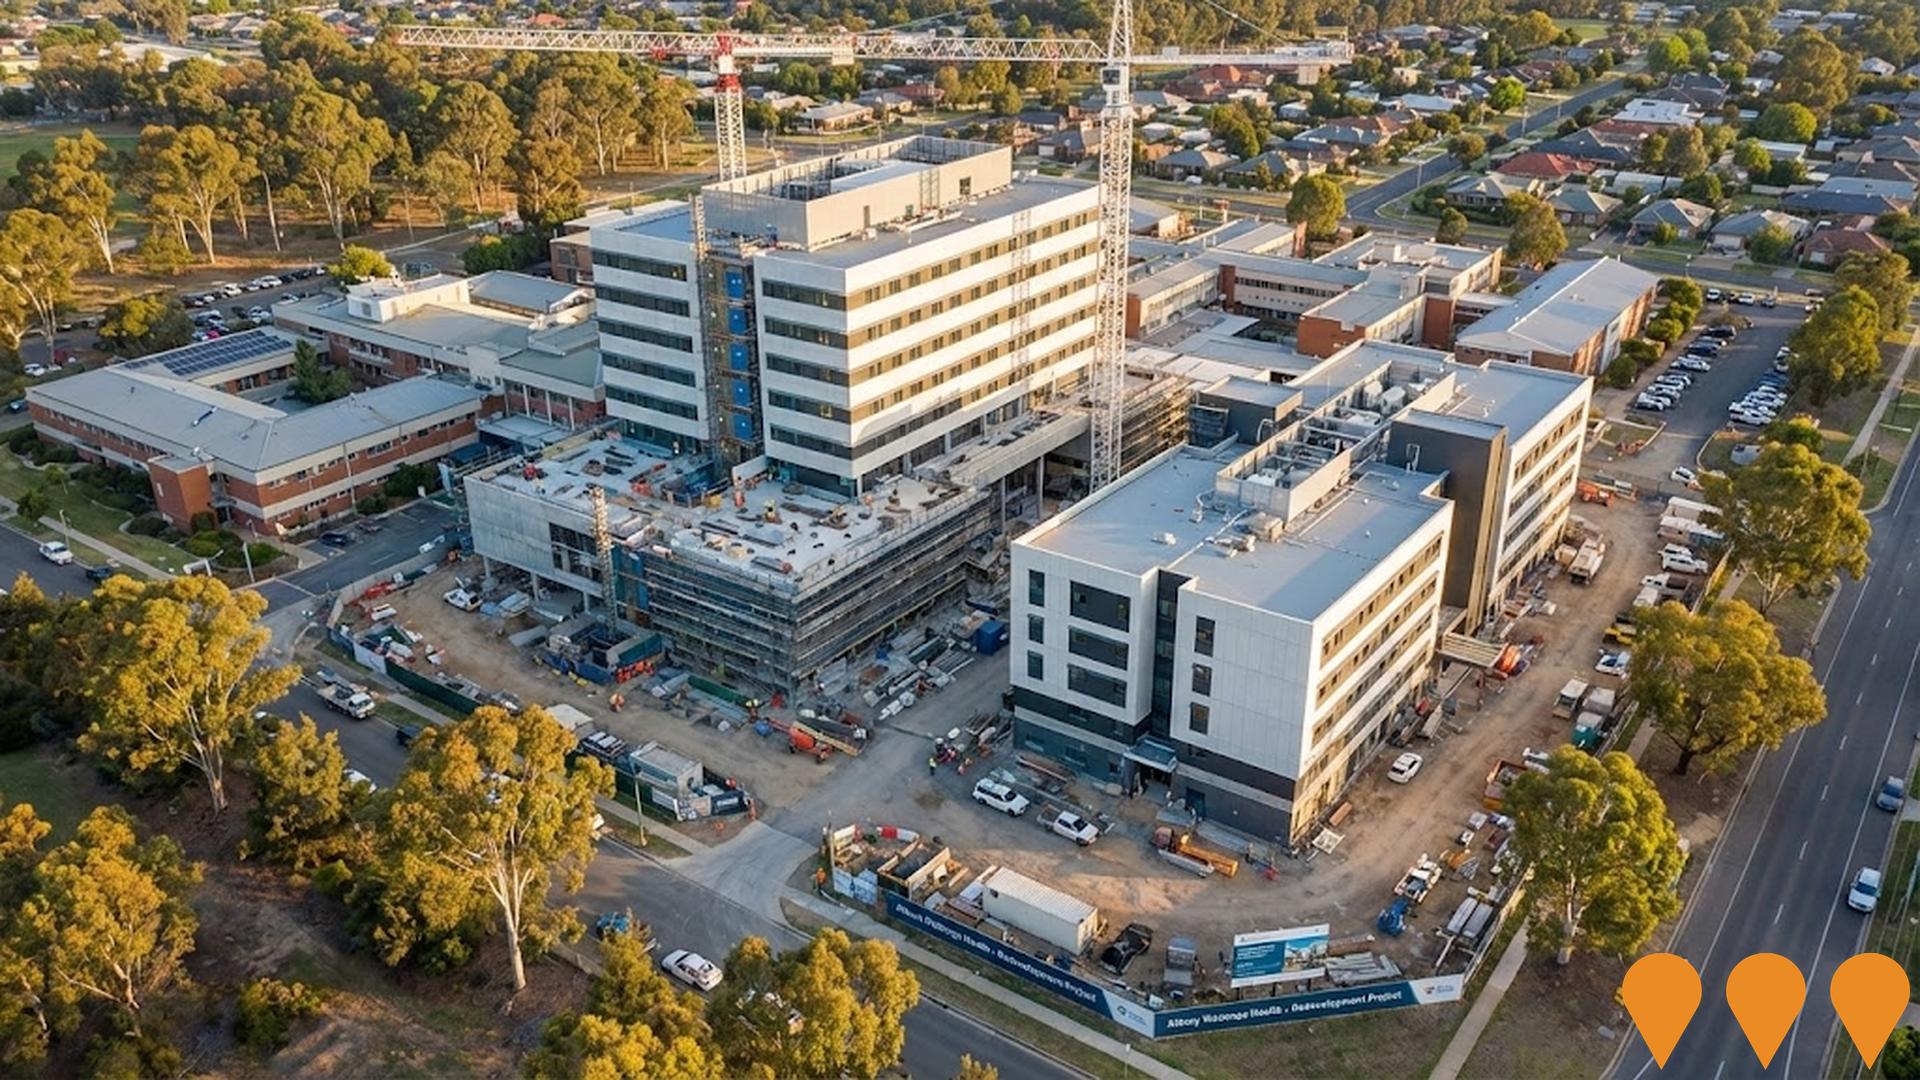
Albury Wodonga Regional Hospital Redevelopment
AUD 558 million joint NSW-Victorian-Commonwealth funded redevelopment of Albury Wodonga Health (Albury Campus). Delivering a new 7-storey Clinical Services Tower and separate Northeast Building. Key features include 80+ additional beds, expanded emergency department, new operating theatres (including hybrid theatre), expanded ICU, new 32-bed adult mental health unit, upgraded maternity and special care nursery, dedicated paediatric unit, and consolidated cancer services. Construction commenced early 2025 by Hansen Yuncken; Northeast Building due for completion 2026, main Clinical Services Tower 2028.
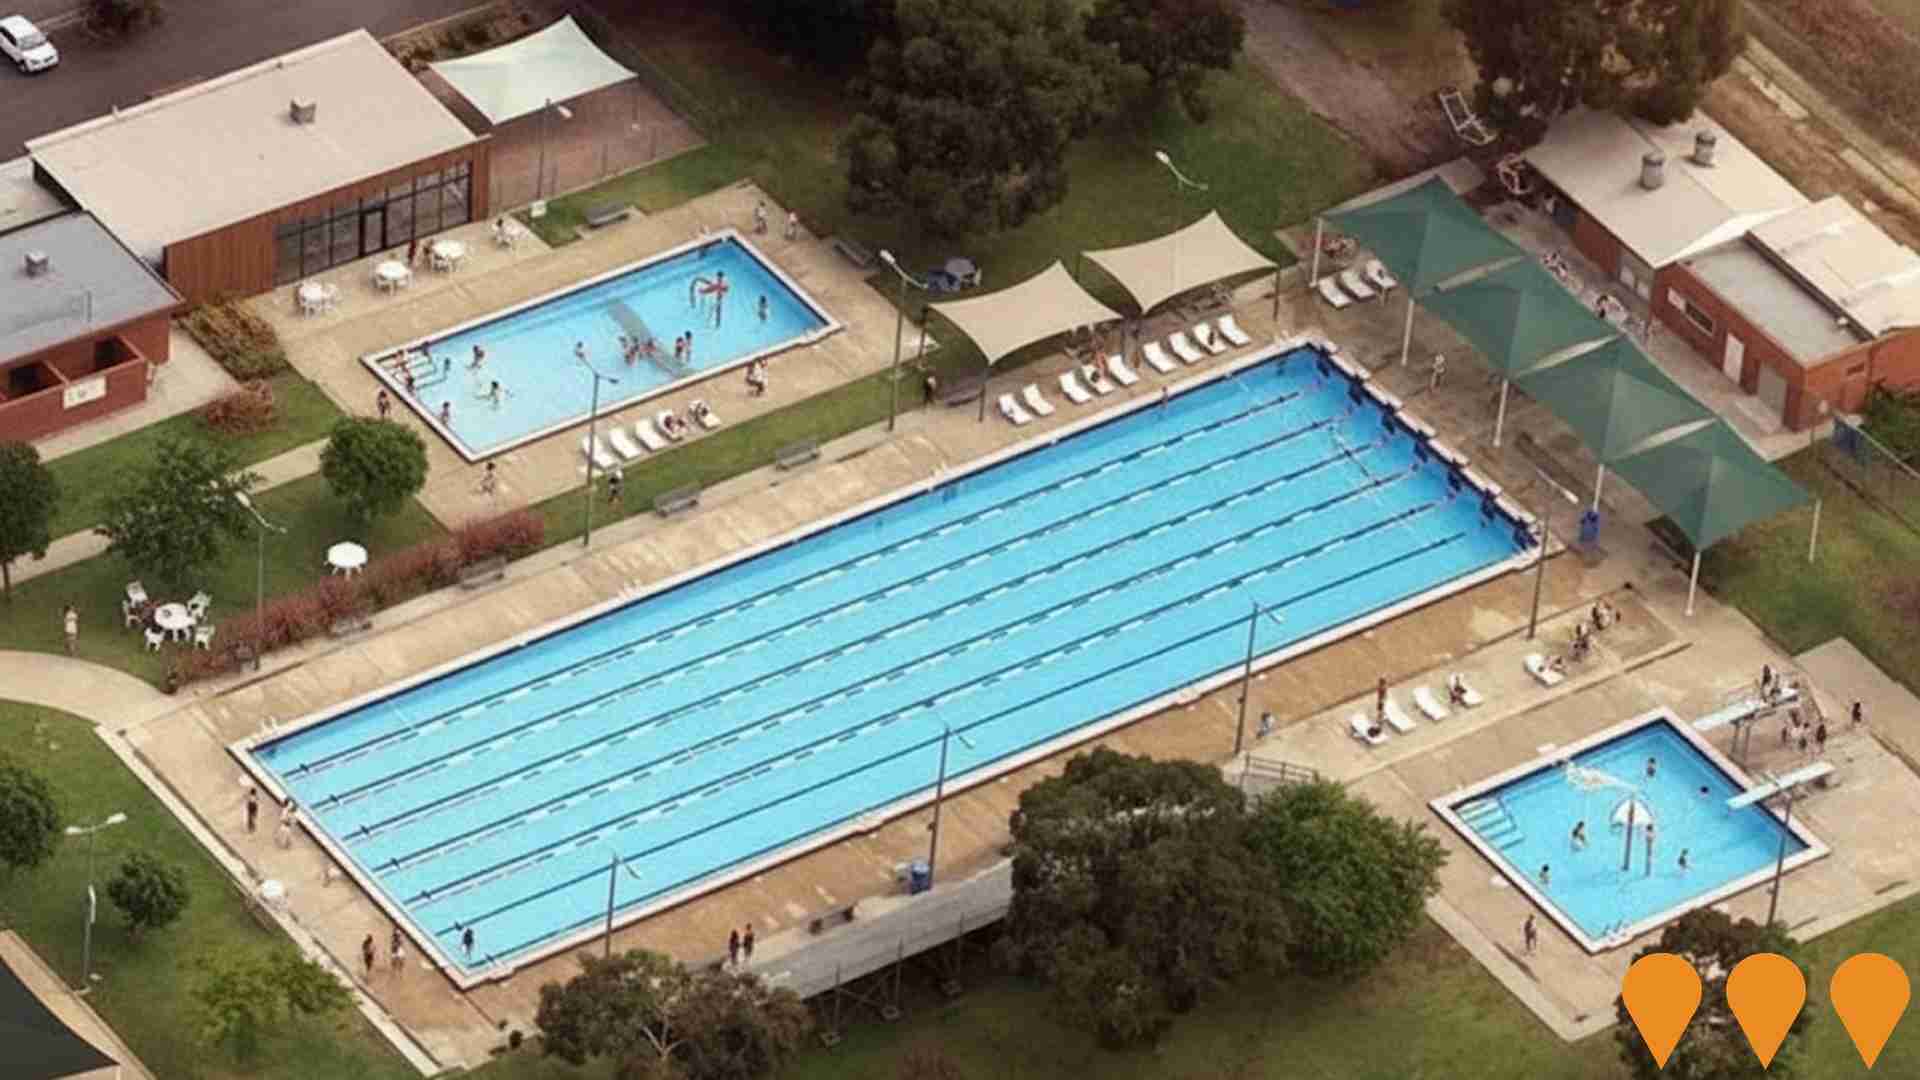
Lavington Swim Centre Redevelopment
The $45.1 million redevelopment (Stage 3) of the Lavington Swim Centre includes a 10-lane 50-metre competition pool, a dedicated 35-metre x 25-metre water polo pool with uniform 2-metre depth, a 25-metre x 15-metre utility pool for lap swimming and remedial use, a splash pad for interactive water play, a new pool building with administration, kiosk, change rooms, amenities, and a Changing Places facility, a flexible multi-purpose social room, and shaded arbour structures with seating, BBQ, and picnic areas. The project replaces the 1967 facility at the end of its service life, aiming to provide modern, inclusive, and accessible aquatic facilities. Stage 3 was endorsed by Council in May 2025 following community consultation, with detailed design underway with Canvas Projects and construction planned to commence in 2027.
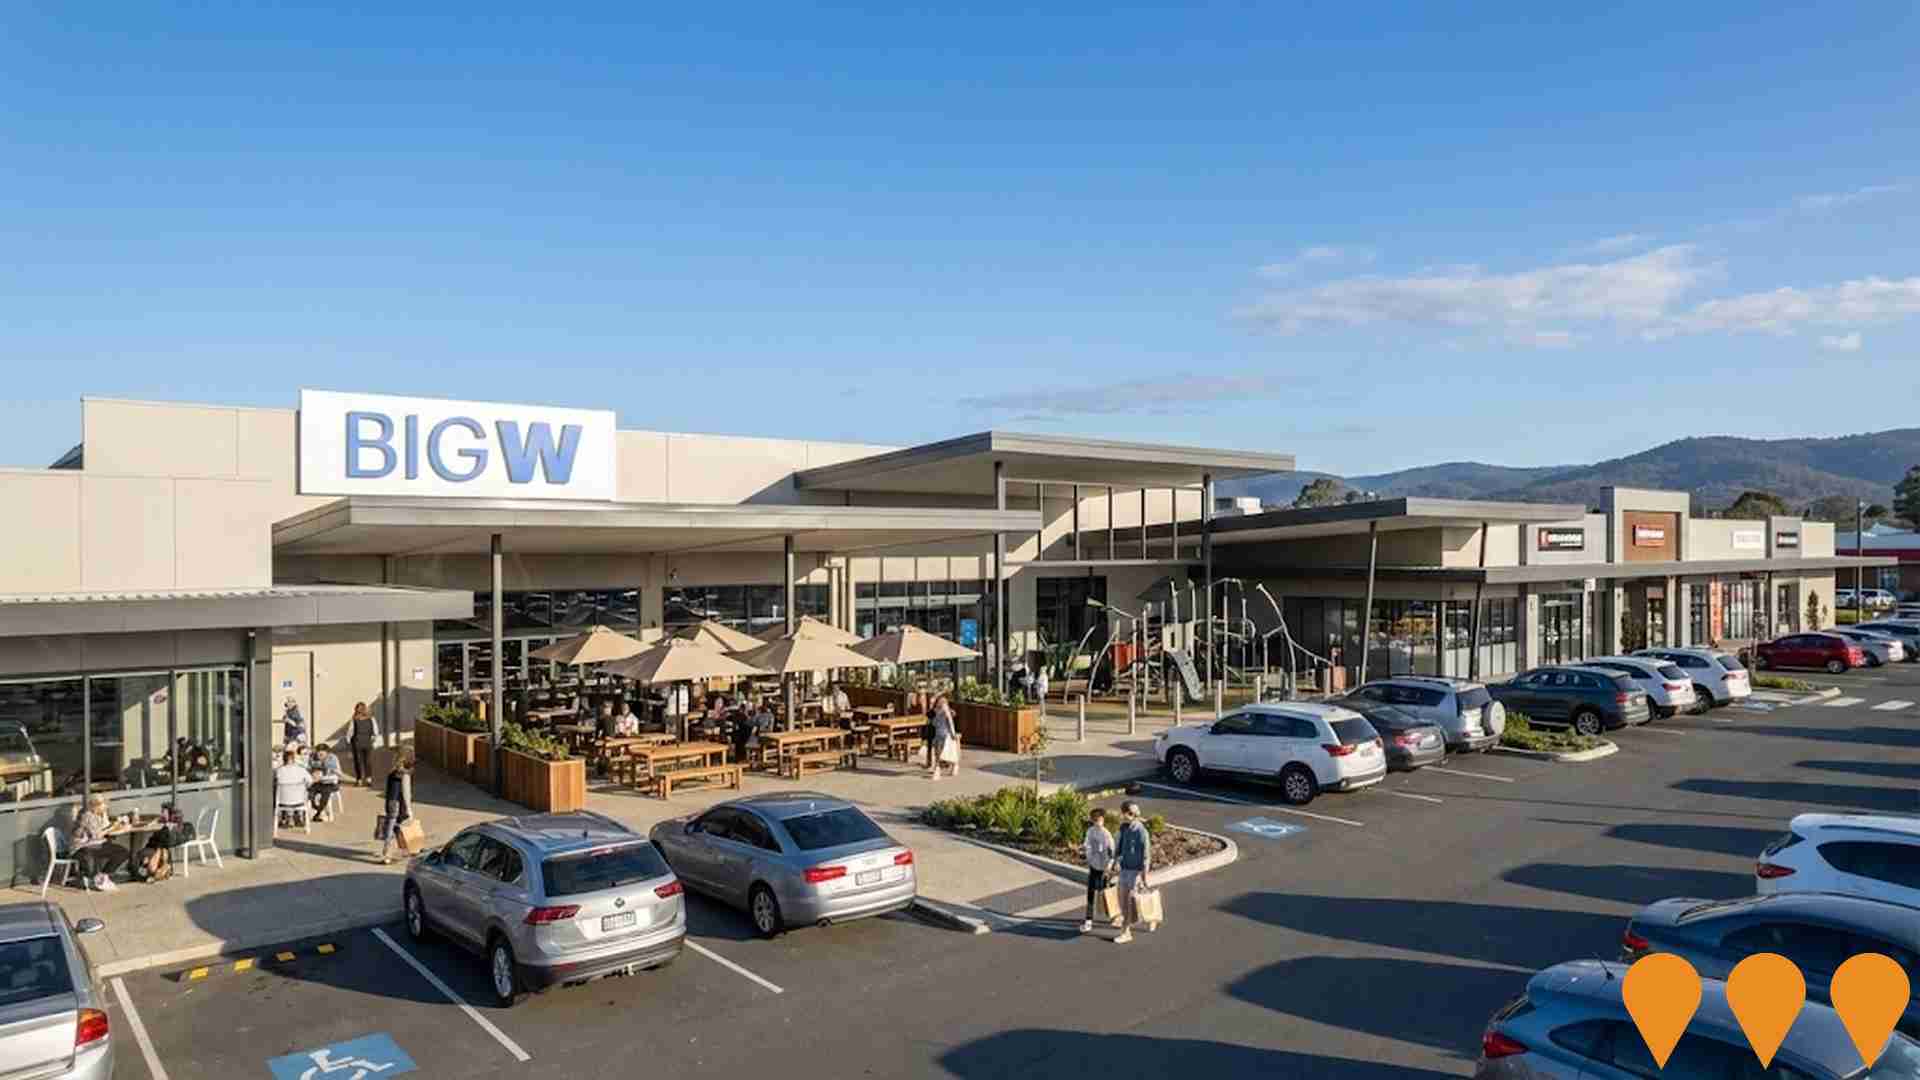
Lavington Square Shopping Centre Upgrades
The Reimagining Lavington project involves upgrading the Lavington Square Shopping Centre with a new food court, refreshed fresh food precinct, new play area, upgraded lighting, modern aesthetics, interactive play zones, refreshed car parks, improved wayfinding, and remodelled amenities to enhance the customer experience and serve the growing community.
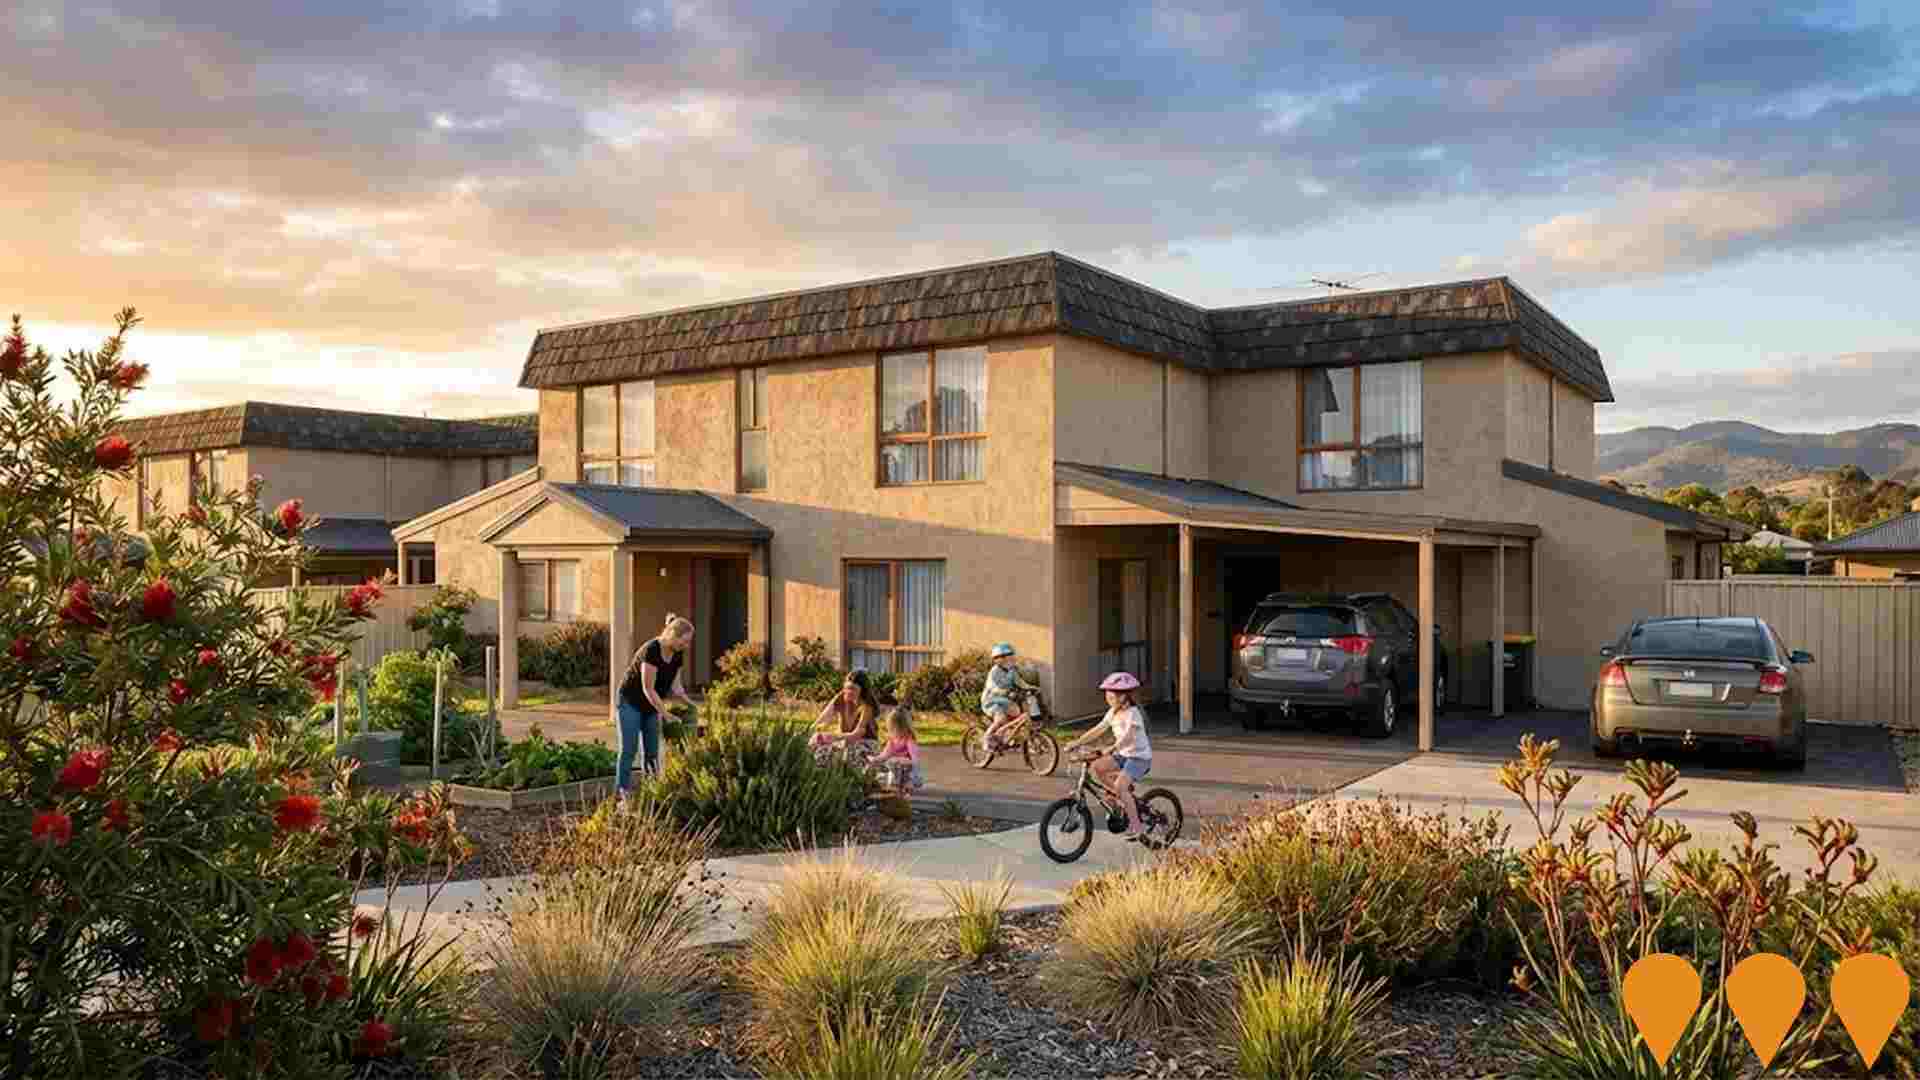
Lavington Social Housing Project
A $5 million Social Housing Accelerator Fund development delivering 10 new three-bedroom homes specifically designed for women-led families, particularly those escaping domestic and family violence. At least 10% of homes are allocated to Aboriginal women, with tenants selected from the social housing register. The development features gender-responsive design principles focused on safety, security, and family-friendly layouts.
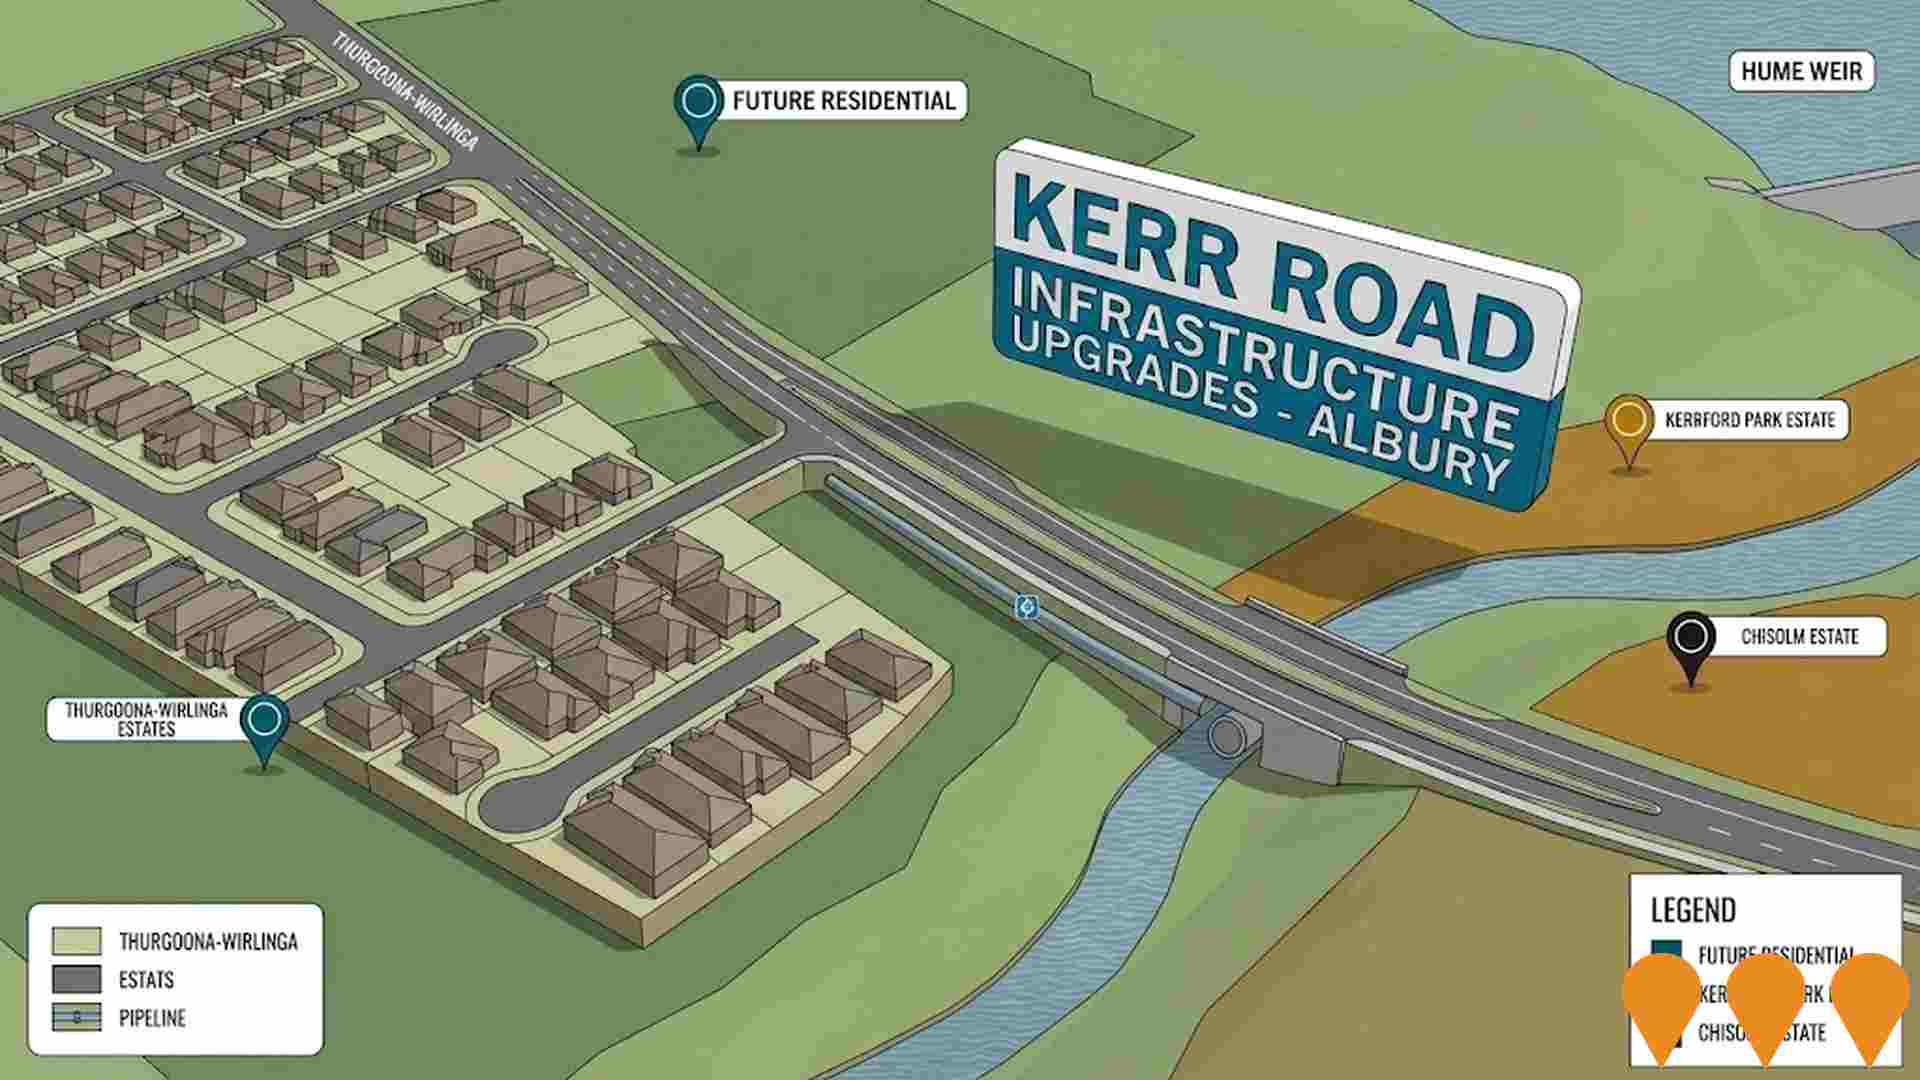
Kerr Road Infrastructure Upgrades
Installation of essential services infrastructure and road upgrades along Kerr Road. The project includes a new sewer pipeline followed by a new water main, and road upgrades from Thurgoona Drive to the creek crossing near Brooklyn Fields. This infrastructure supports the growth of the Thurgoona-Wirlinga area, connecting with the wider Thurgoona Link Road project.
Bright Steps Academy Lavington
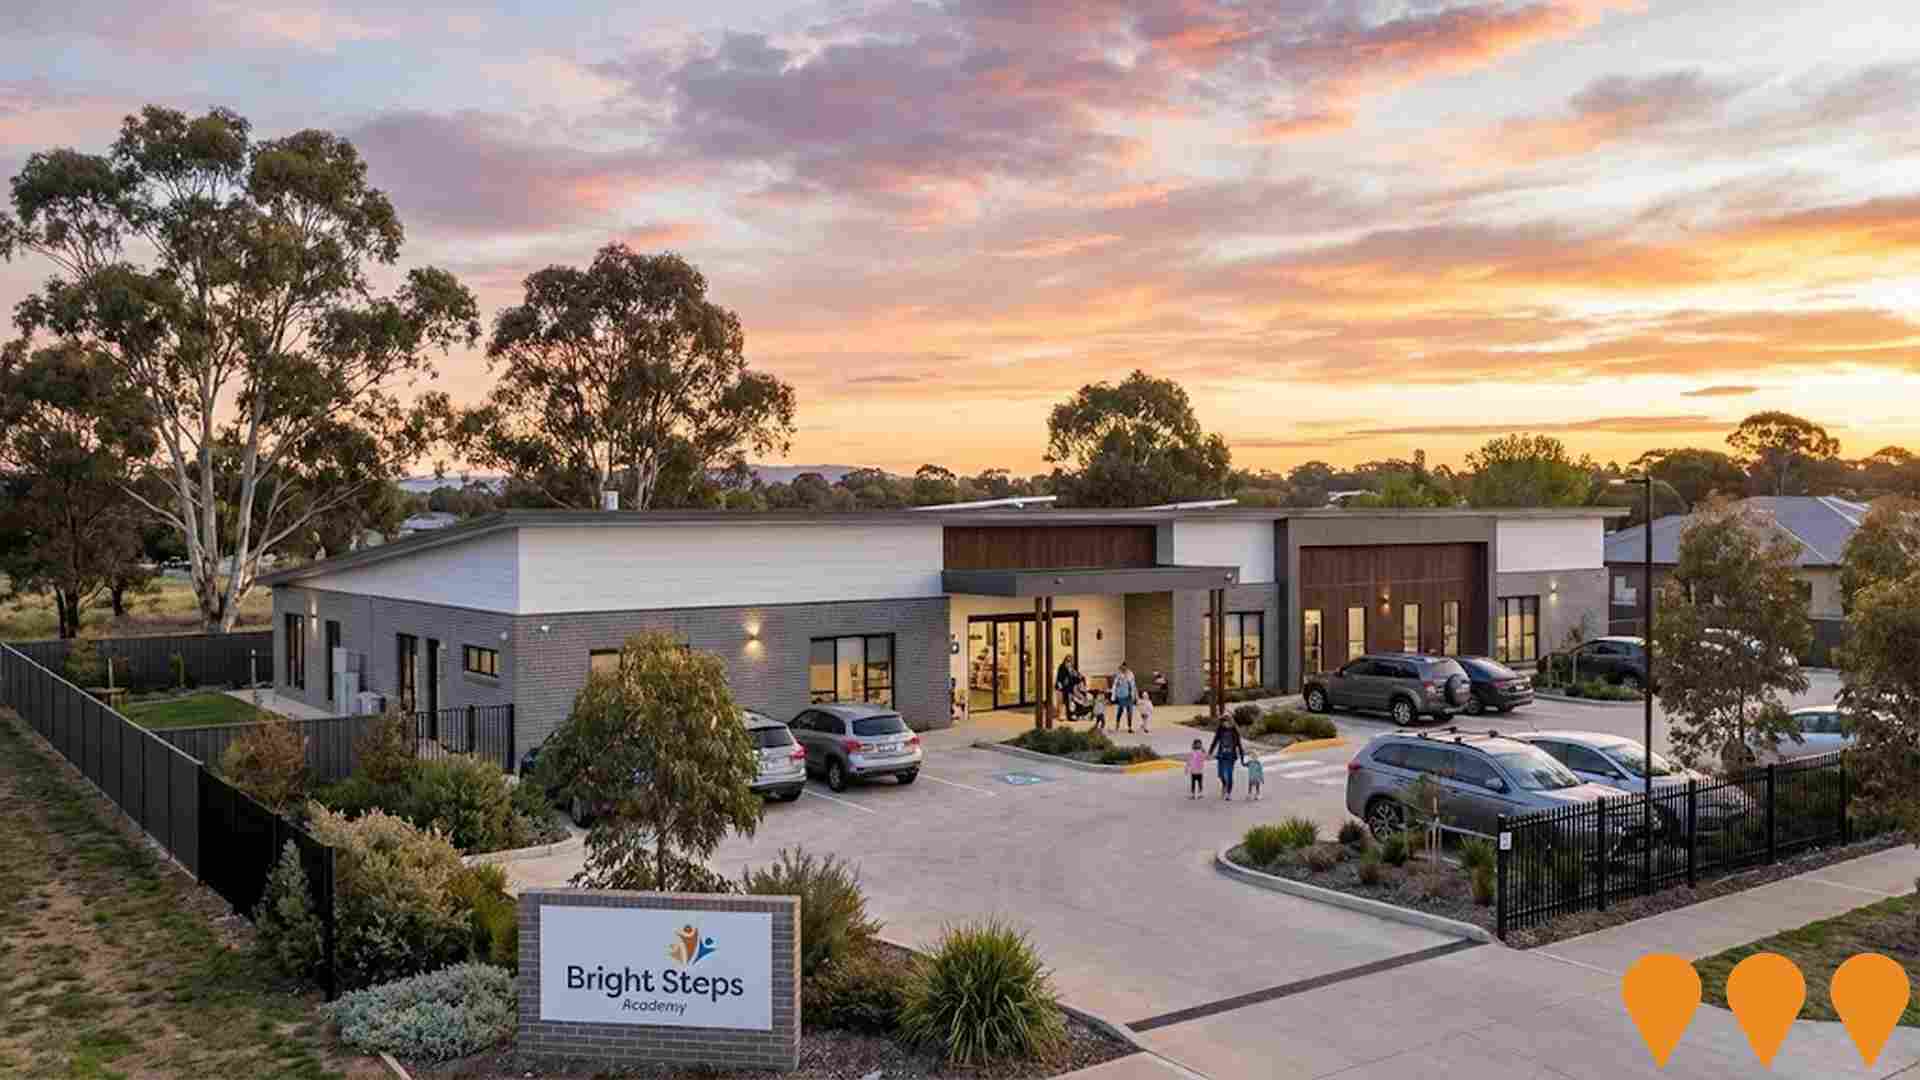
DA approved 136-place childcare centre with Agreement for Lease (AFL) to Bright Steps Academy. Single-level development with at-grade parking for 35 vehicles on 3,617 sqm R1 zoned site. Features 20-year lease plus options with established operator across multiple states.
River Gum
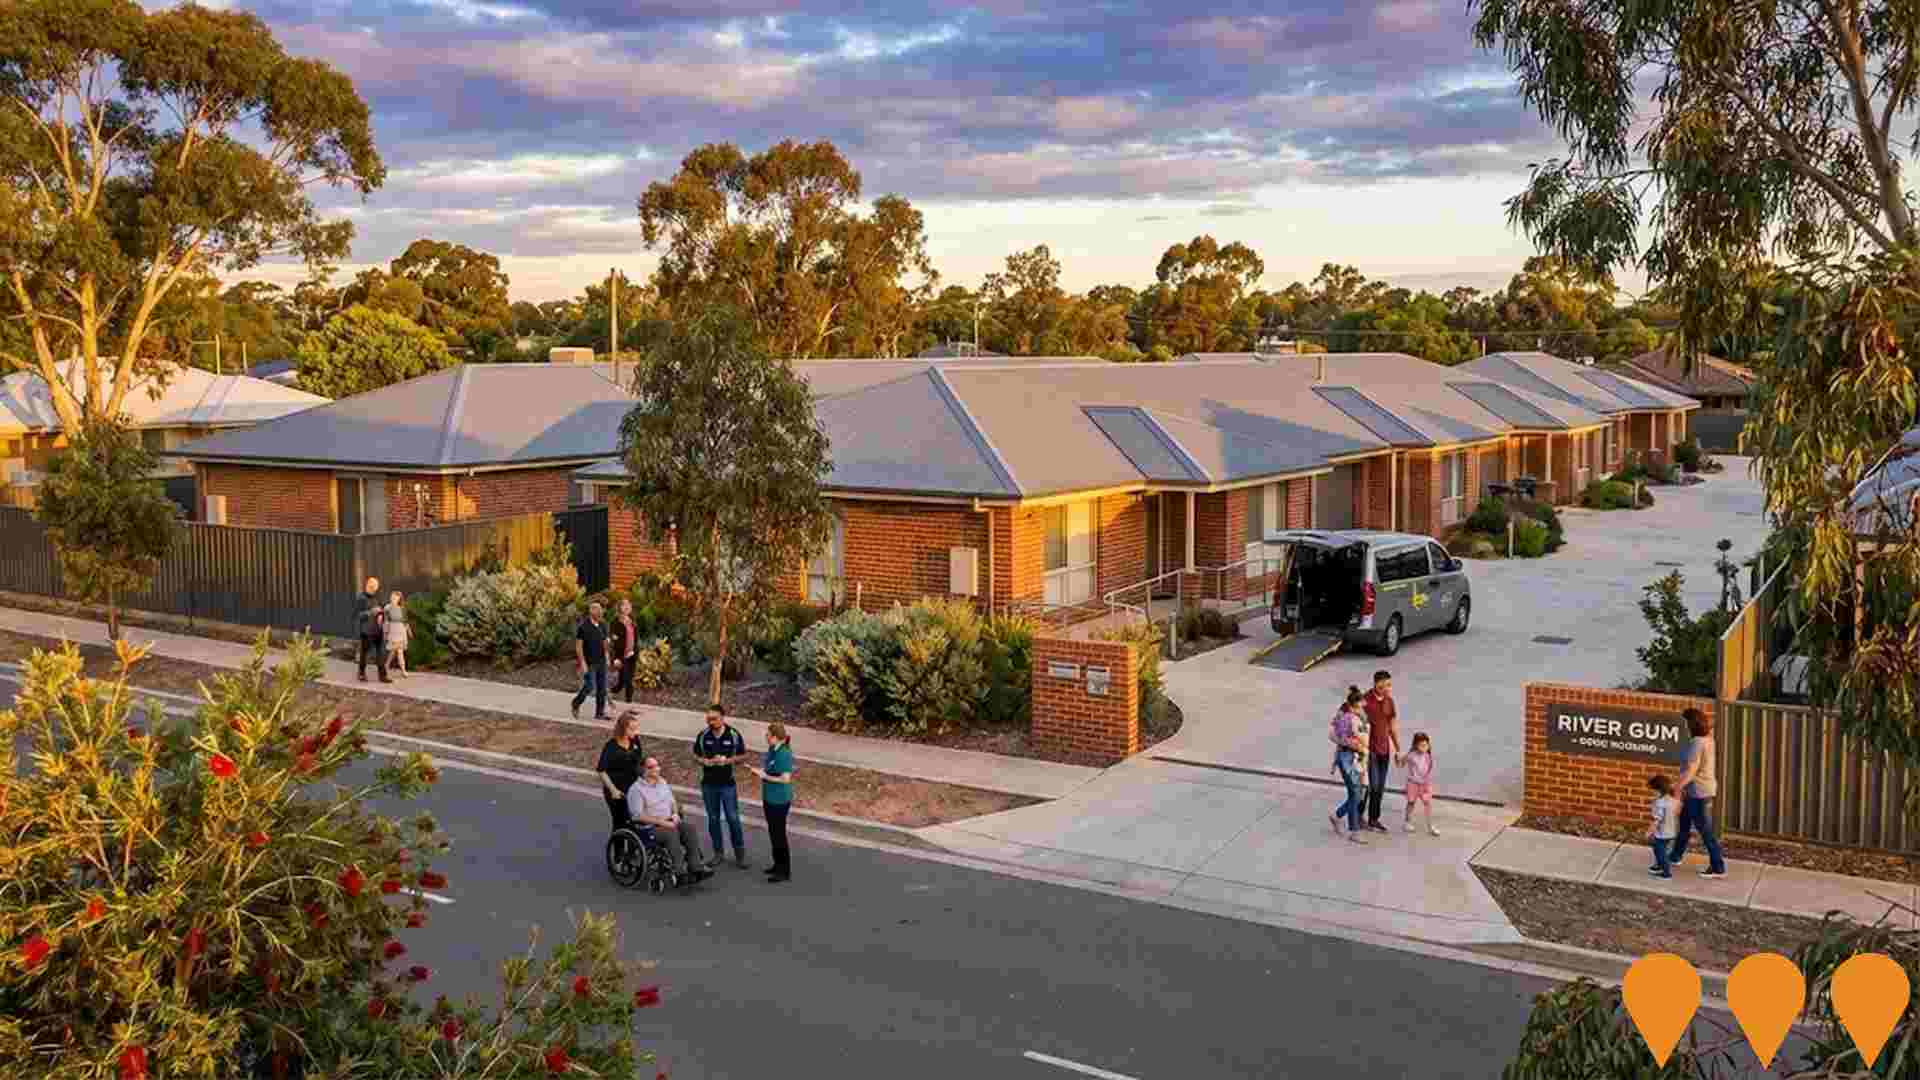
Specialist Disability Accommodation featuring three one-bedroom villas designed for Robust and High Physical Support participants and an adjoining two-bedroom house for Improved Liveability participants. Features customized design elements including wide doorways, adjustable benches, private ensuite bathrooms with underfloor heating, assistive technology, and enhanced physical access provisions. The project represents Good Housing's first development outside Greater Sydney.
Employment
Employment conditions in Lavington face significant challenges, ranking among the bottom 10% of areas assessed nationally
Lavington's workforce is balanced across white and blue-collar jobs with a 7.1% unemployment rate, showing stability over the past year. As of September 2025, 7,923 residents are employed while the unemployment rate is 3.3% higher than Rest of NSW's 3.8%.
Workforce participation is similar to Rest of NSW at 56.4%. Key industries include health care & social assistance, retail trade, and construction. Manufacturing stands out with employment levels at 1.7 times the regional average. Agriculture, forestry & fishing has limited presence at 1.3% compared to 5.3% regionally.
The area offers limited local employment opportunities. Over a 12-month period ending September 2025, Lavington's labour force increased by 1.1%, but employment declined by 0.5%, raising the unemployment rate by 1.5 percentage points. Rest of NSW saw an employment decline of 0.5% and a labour force decline of 0.1%, with unemployment rising by 0.4 percentage points during the same period. State-level data to 25-Nov-25 shows NSW employment contracted by 0.03% (losing 2,260 jobs), with an unemployment rate of 3.9%. National employment forecasts from May-25 project a 6.6% increase over five years and 13.7% over ten years. Applying these projections to Lavington's employment mix suggests local employment should increase by 6.1% over five years and 13.1% over ten years, based on simple weighting extrapolation for illustrative purposes only.
Frequently Asked Questions - Employment
Income
The area's income levels rank in the lower 15% nationally based on AreaSearch comparative data
The median income among taxpayers in Lavington SA2 was $47,725 and the average income stood at $52,752 according to ATO data aggregated by AreaSearch for financial year 2022. This compares to figures for Rest of NSW's of $49,459 and $62,998 respectively. Based on Wage Price Index growth of 12.61% since financial year 2022, current estimates would be approximately $53,743 (median) and $59,404 (average) as of September 2025. According to the Census conducted in August 2021, household incomes in Lavington fell between the 9th and 18th percentiles nationally. Income distribution showed that the $1,500 - $2,999 earnings band captured 28.7% of the community (4,552 individuals), similar to metropolitan regions where this cohort represented 29.9%. Housing affordability pressures were severe in Lavington, with only 83.6% of income remaining after housing costs, ranking at the 10th percentile nationally.
Frequently Asked Questions - Income
Housing
Lavington is characterized by a predominantly suburban housing profile, with a higher proportion of rental properties than the broader region
In Lavington, as per the latest Census evaluation, 77.9% of dwellings were houses, with the remaining 22.2% comprising semi-detached homes, apartments, and other types. This distribution differed slightly from Non-Metro NSW's 83.2% houses and 16.8% other dwellings. Home ownership in Lavington stood at 31.2%, with mortgaged properties at 29.2% and rented ones at 39.7%. The median monthly mortgage repayment was $1,300, lower than Non-Metro NSW's average of $1,430. The median weekly rent in Lavington was $250, compared to Non-Metro NSW's $265. Nationally, Lavington's mortgage repayments were significantly lower than the Australian average of $1,863, and rents were substantially below the national figure of $375.
Frequently Asked Questions - Housing
Household Composition
Lavington features high concentrations of lone person households, with a lower-than-average median household size
Family households constitute 60.3% of all households, including 21.0% couples with children, 23.9% couples without children, and 14.3% single parent families. Non-family households comprise the remaining 39.7%, with lone person households at 35.9% and group households making up 3.8%. The median household size is 2.2 people, which is smaller than the Rest of NSW average of 2.4.
Frequently Asked Questions - Households
Local Schools & Education
Lavington faces educational challenges, with performance metrics placing it in the bottom quartile of areas assessed nationally
The area's university qualification rate is 13.5%, significantly lower than the NSW average of 32.2%. This disparity presents both a challenge and an opportunity for targeted educational initiatives. Bachelor degrees are most common at 9.4%, followed by postgraduate qualifications (2.7%) and graduate diplomas (1.4%). Vocational credentials are prominent, with 41.5% of residents aged 15+ holding them - advanced diplomas at 9.7% and certificates at 31.8%.
Educational participation is high, with 28.6% of residents currently enrolled in formal education. This includes 9.8% in primary education, 7.6% in secondary education, and 2.9% pursuing tertiary education.
Frequently Asked Questions - Education
Schools Detail
Nearby Services & Amenities
Transport
Transport servicing is moderate compared to other areas nationally based on assessment of service frequency, route connectivity and accessibility
Lavington's public transport analysis shows 228 active stops in operation, all of which are bus services. These stops are covered by 50 unique routes that together facilitate 1,424 weekly passenger trips. The accessibility of transport is rated as excellent, with residents on average located just 138 meters from their nearest stop.
On a daily basis, service frequency averages at 203 trips across all routes, translating to approximately 6 weekly trips per individual stop.
Frequently Asked Questions - Transport
Transport Stops Detail
Health
Health performance in Lavington is well below average with prevalence of common health conditions notable across both younger and older age cohorts
Lavington faces significant health challenges, as indicated by data showing high prevalence of common health conditions across both younger and older age groups. Private health cover is low, at approximately 47% (around 7,407 people), compared to 50.9% in the rest of NSW and a national average of 55.3%. Mental health issues and arthritis are the most prevalent conditions, affecting 11.4% and 9.9% of residents respectively.
However, 60.4% of residents report no medical ailments, compared to 64.2% in the rest of NSW. Lavington has a higher proportion of seniors aged 65 and over, at 21.7% (3,437 people), than the rest of NSW at 20.1%. Health outcomes among seniors present challenges broadly in line with the general population's health profile.
Frequently Asked Questions - Health
Cultural Diversity
Lavington ranks below the Australian average when compared to other local markets across a number of language and cultural background related metrics
Lavington's cultural diversity was found to be below average, with 86.0% of its population being citizens born in Australia who spoke English only at home as of the latest data from 20XX. Christianity was the predominant religion, comprising 49.7% of Lavington's population. Notably, the 'Other' religious category comprised 2.6%, compared to the regional average of 1.4%.
In terms of ancestry, Australian (28.9%), English (28.6%), and Irish (8.5%) were the top three represented groups in Lavington as of the latest data from 20XX. There were notable divergences in certain ethnic groups: German was overrepresented at 5.7% compared to the regional average of 5.9%, Australian Aboriginal at 3.4% (vs 2.7%), and Filipino at 1.3% (vs 0.7%).
Frequently Asked Questions - Diversity
Age
Lavington's population is slightly older than the national pattern
The median age in Lavington is 40 years, which is slightly below Rest of NSW's average of 43 but above Australia's median of 38. The 25-34 age group makes up 15.2% of Lavington's population, compared to the Rest of NSW average, while the 55-64 age group constitutes 11.2%. Between the 2021 Census and now, the 25-34 age group has increased from 13.5% to 15.2%, whereas the 65-74 age group has decreased from 12.1% to 11.5%. By 2041, population forecasts indicate significant demographic changes in Lavington. The 25-34 age cohort is projected to grow by 880 people (36%), reaching 3,298 from the current 2,417. Conversely, the 55-64 and 65-74 cohorts are expected to decrease in population.

