Chart Color Schemes
This analysis uses Suburbs and Localities (SAL) boundaries, which can materially differ from Statistical Areas (SA2) even when sharing the same name.
SAL boundaries are defined by Australia Post and the Australian Bureau of Statistics to represent commonly-known suburb names used in postal addresses.
Statistical Areas (SA2) are designed for census data collection and may combine multiple suburbs or use different geographic boundaries. For comprehensive analysis, consider reviewing both boundary types if available.
est. as @ -- *
2021 Census | -- people







The median house price in Buronga is $625k, with units at $368k. House values have moved 2.6% a year compounded over five years.
Curious about local property values? Filter the chart to assess the volume and appreciation (including resales) trends and regional comparisons, or scroll to the map below view this information at an individual property level.
Find a Recent Sale

Sales Detail
Buronga has an estimated 1,562 residents, up from 1,252 at the 2021 Census — a change of 310 people, or 24.8%. Growth has averaged 3.0% a year over five years, faster than 93% of areas nationally. Interstate and internal migration accounts for 61.0% of that increase. That puts 101 residents on each square kilometre. Population is estimated from ABS Estimated Resident Population releases and GNAF address data, re-based from the 2021 Census and updated annually.
Detail
Based on analysis of ABS population updates for the broader area, and new addresses validated by AreaSearch, the suburb of Buronga's population is estimated at around 1,562 as of Feb 2026. This reflects an increase of 310 people (24.8%) since the 2021 Census, which reported a population of 1,252 people. The change is inferred from the resident population of 1,461 estimated by AreaSearch following examination of the latest ERP data release by the ABS in June 2024 and an additional 41 validated new addresses since the Census date. This level of population equates to a density ratio of 101 persons per square kilometer.
Buronga's growth rate exceeded that of the SA3 area (5.9%) and the Rest of NSW, marking it as a growth leader in the region. Population growth was primarily driven by interstate migration contributing approximately 61.0% of overall population gains during recent periods. AreaSearch is adopting ABS/Geoscience Australia projections for each SA2 area, released in 2024 with 2022 as the base year. For areas not covered by this data, AreaSearch utilises NSW State Government's SA2 level projections released in 2022 with 2021 as the base year. Growth rates by age group from these aggregations are applied to all areas for years 2032 to 2041. Anticipating future population dynamics, lower quartile growth of national regional areas is anticipated, with the suburb expected to grow by 46 persons to 2041 based on aggregated SA2-level projections, reflecting a decline of 3.5% in total over the 17 years.
Frequently Asked Questions - Population
109 new dwellings have been approved in Buronga over the past five years, an average of 21 a year. That places the area in the 51st percentile for residential development activity nationally, about 13 approvals per 1,000 residents a year. Approvals are currently running at an annualised 20, broadly in line with that longer-run average. Figures come from ABS building approvals aggregated to this Suburb (SAL) boundary and are updated monthly as the ABS releases them.
Detail
AreaSearch analysis of ABS building approval numbers in Buronga shows approximately 21 new homes approved annually over the past five financial years, totalling an estimated 109 homes. As of FY-26, 12 approvals have been recorded. On average, around 0.7 new residents per year are associated with each new home built between FY-21 and FY-25. This suggests that supply is meeting or exceeding demand, offering greater buyer choice and supporting potential population growth above projections. The average expected construction cost of new dwellings is $631,000, indicating a focus on the premium segment with upmarket properties.
In FY-26, $4.2 million in commercial approvals have been registered, suggesting limited commercial development focus. Compared to Rest of NSW, Buronga records 298.0% more development activity per person, creating greater choice for buyers but with building activity slowing in recent years. This level is significantly higher than the national average, indicating strong developer confidence in the location. All new construction in Buronga has been detached houses, preserving the area's low density nature and attracting space-seeking buyers. With approximately 104 people per approval, Buronga reflects a developing area. However, population projections indicate stability or decline, which should reduce housing demand pressures and benefit potential buyers.
Frequently Asked Questions - Development
Development applications around Buronga
Loading development applications…
| Lodged | Address | Description | Type | Distance | Status |
|---|
SOURCE: Planning portals and council registers, compiled by AreaSearch. Distance & bearing measured from the suburb midpoint.
AreaSearch tracks 68 current infrastructure and development projects close to Buronga, worth an estimated $6.84 billion. 16 are already under construction and 22 are due for completion within three years. The pipeline spans residential development, communities, precincts & urban renewal and energy. Records are compiled from Infrastructure Australia, state agencies, council planning portals and public announcements, reviewed and updated daily, then ranked by proximity, construction stage, completion horizon and project scale.
Detail
Changes to local infrastructure significantly impact an area's performance. AreaSearch has identified eight projects that could affect this region. Notable initiatives include Nichols Point Integrated Early Years Centre, Mildura Riverfront Redevelopment - Stage 2, Mildura CBD Revitalisation Project, and Mildura Passenger Rail Return. The following list details those most likely to be relevant.
Professional plan users can use the search below to filter and access additional projects.
INFRASTRUCTURE SEARCH
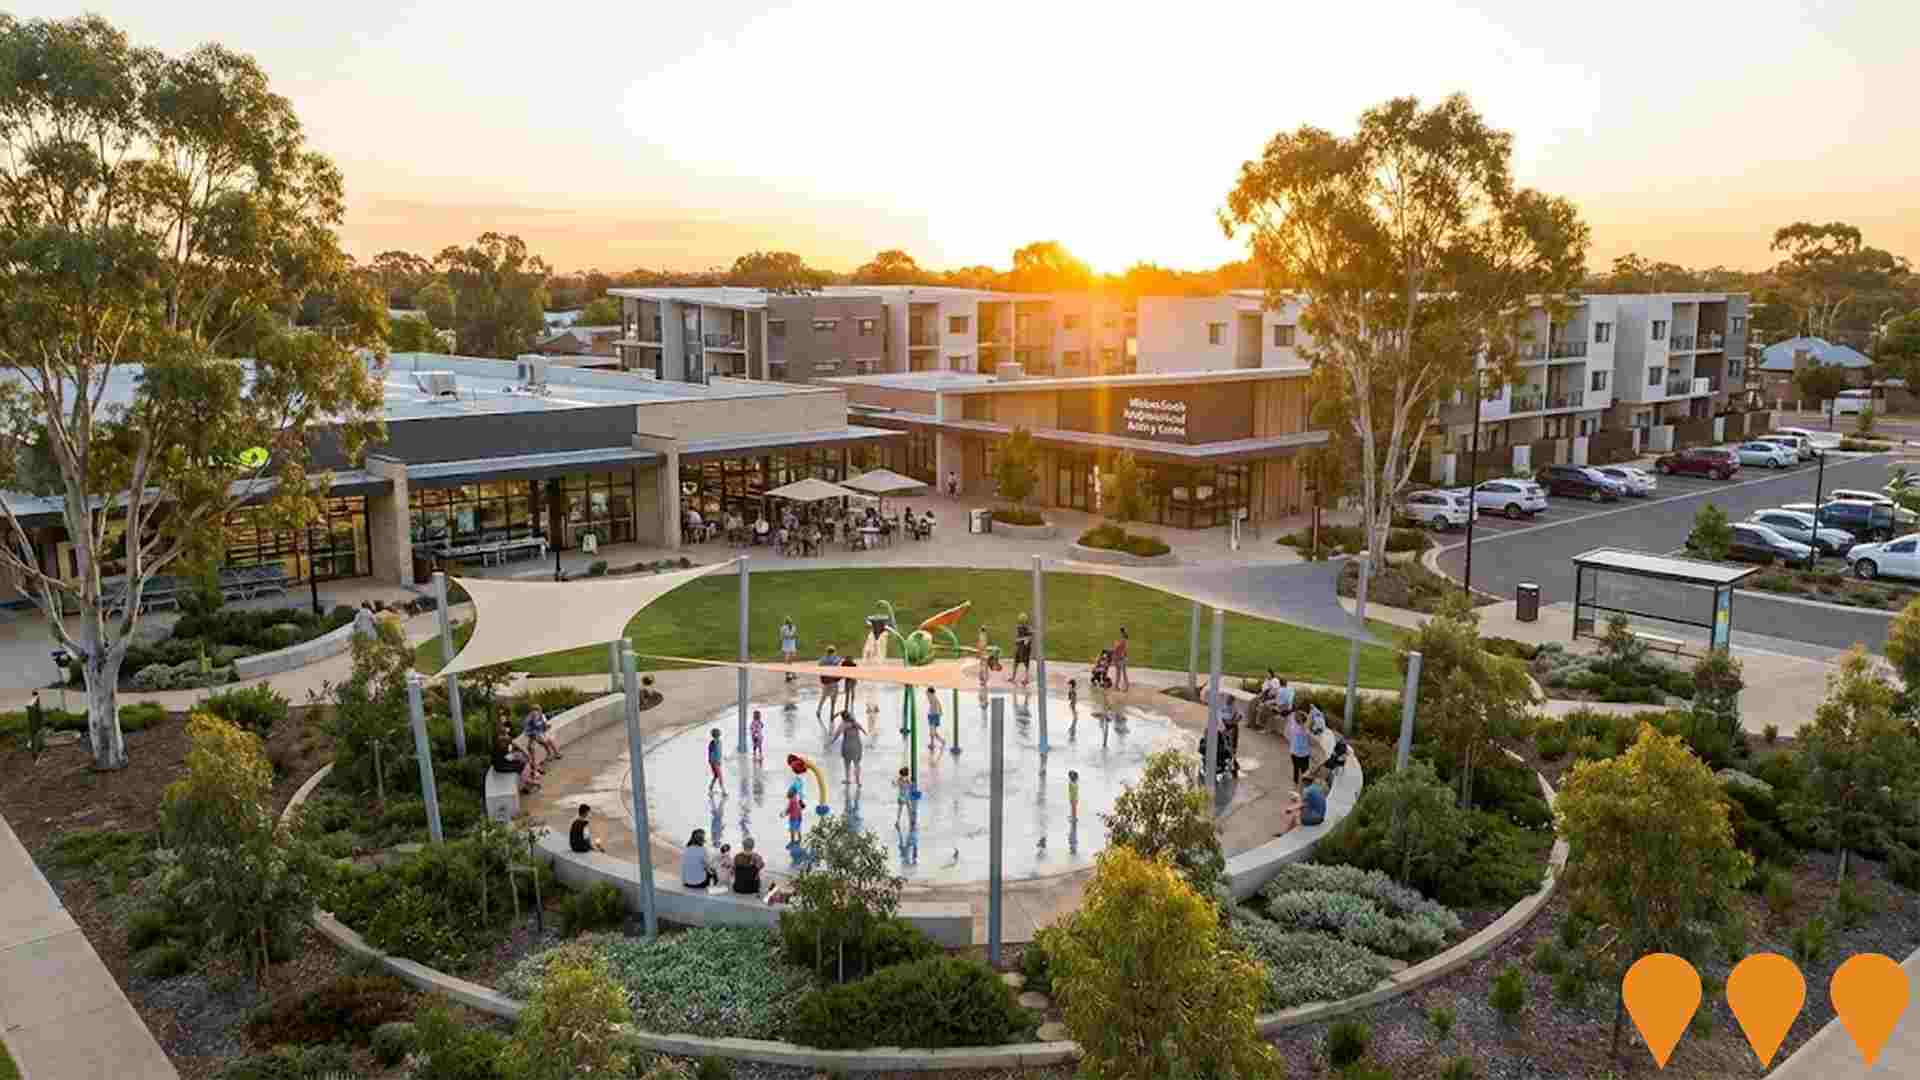
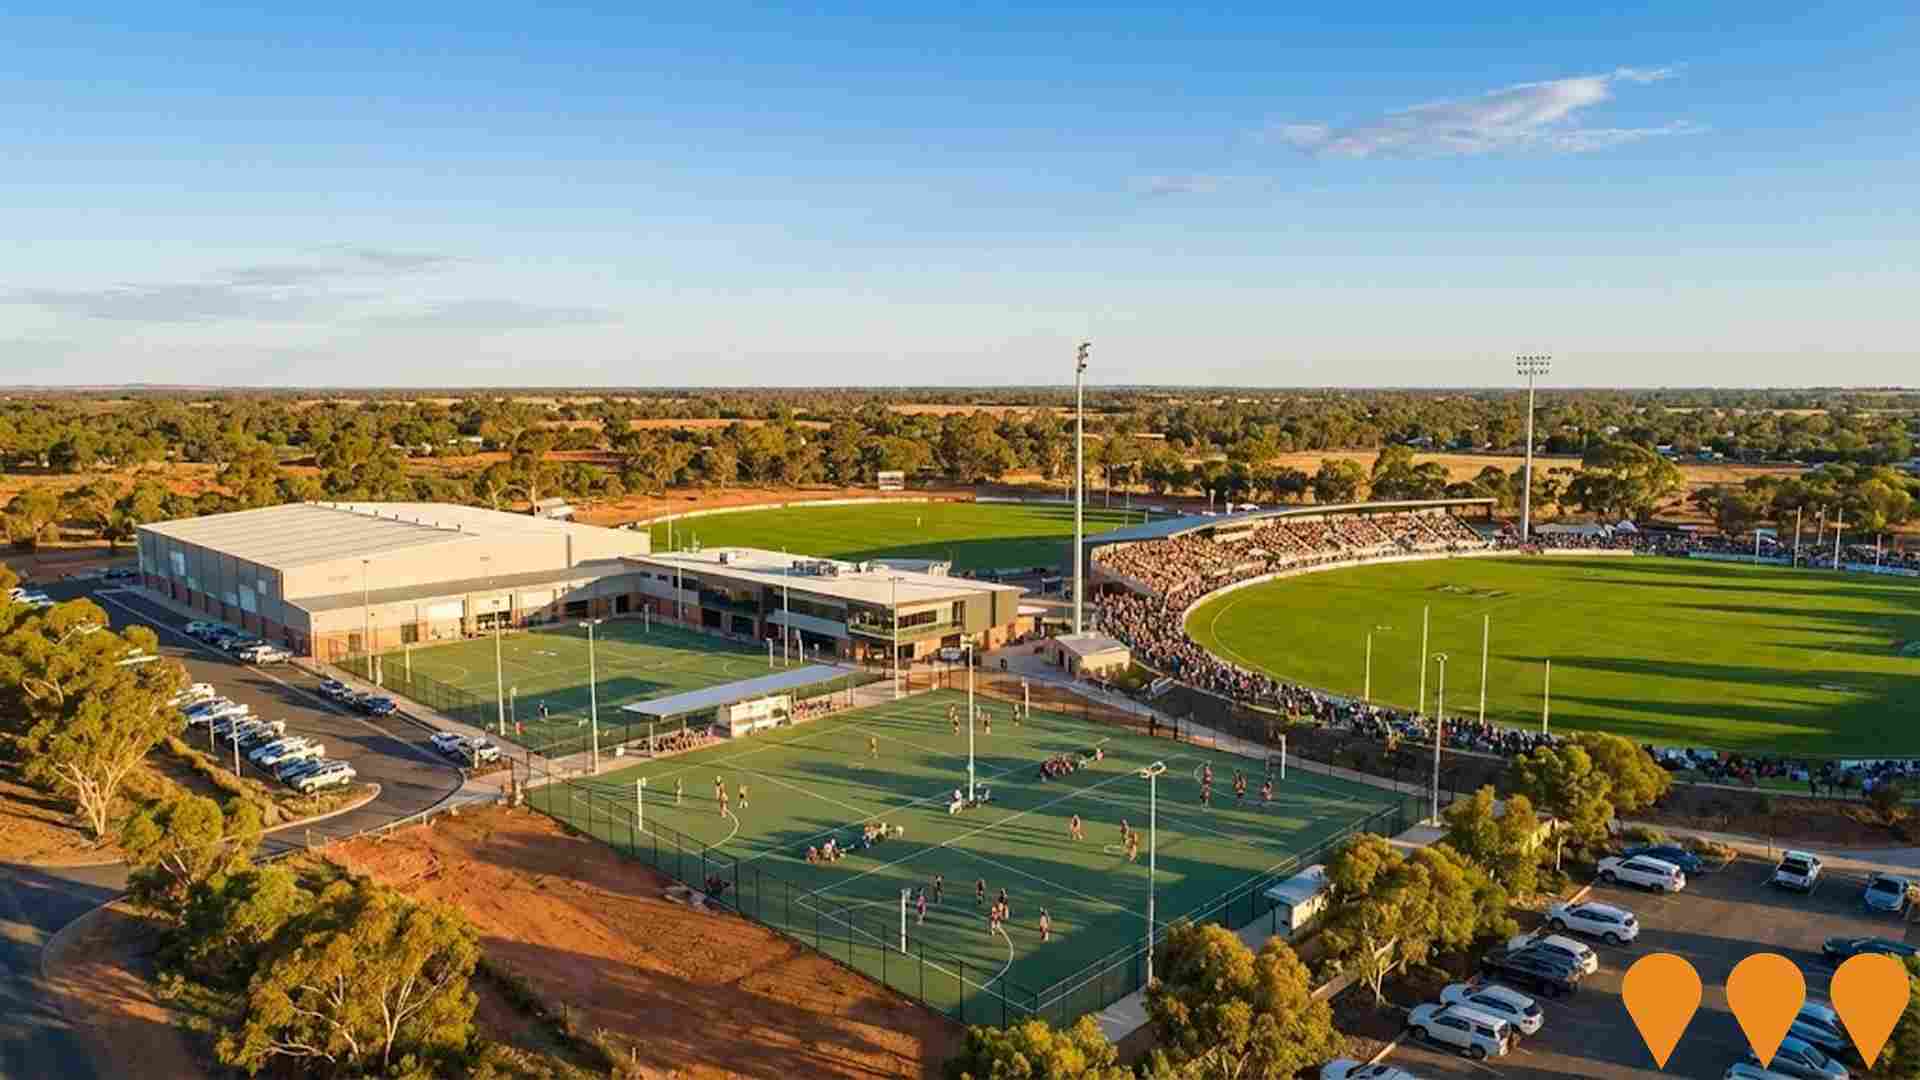
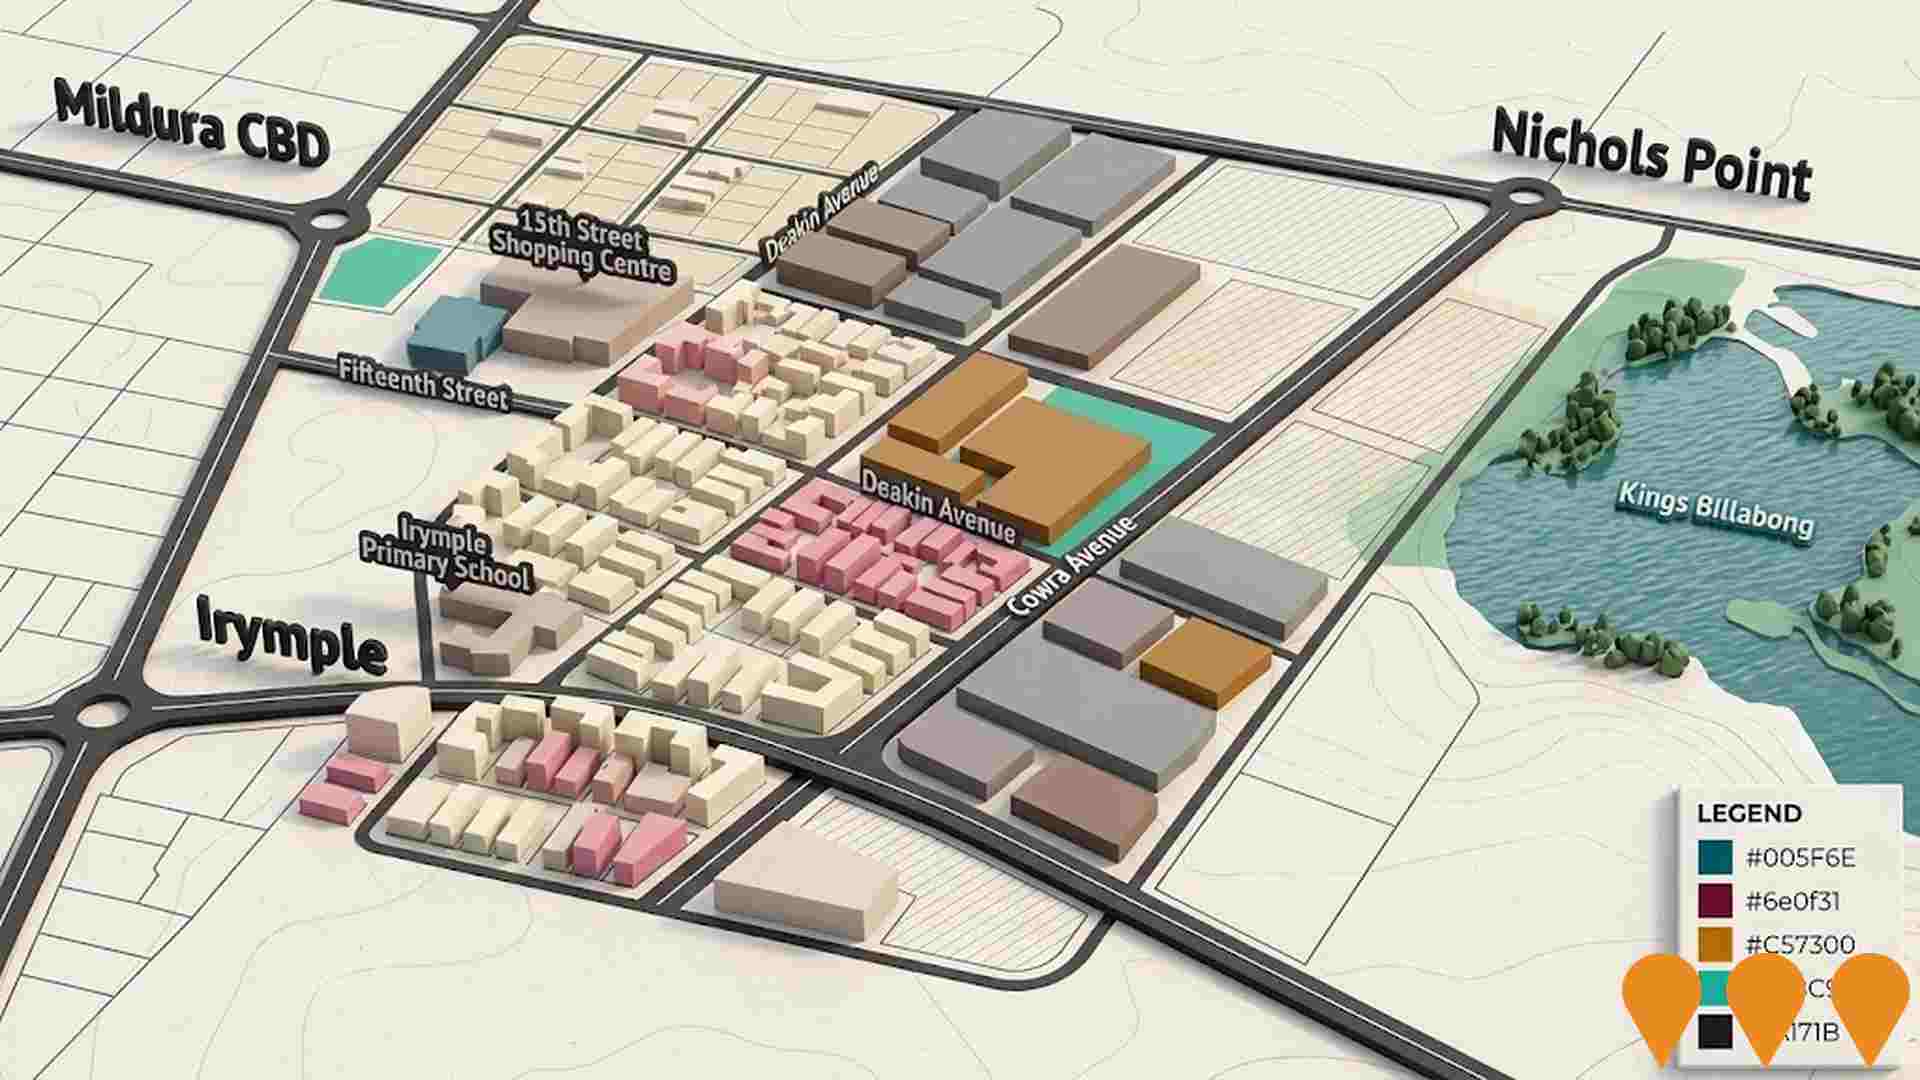
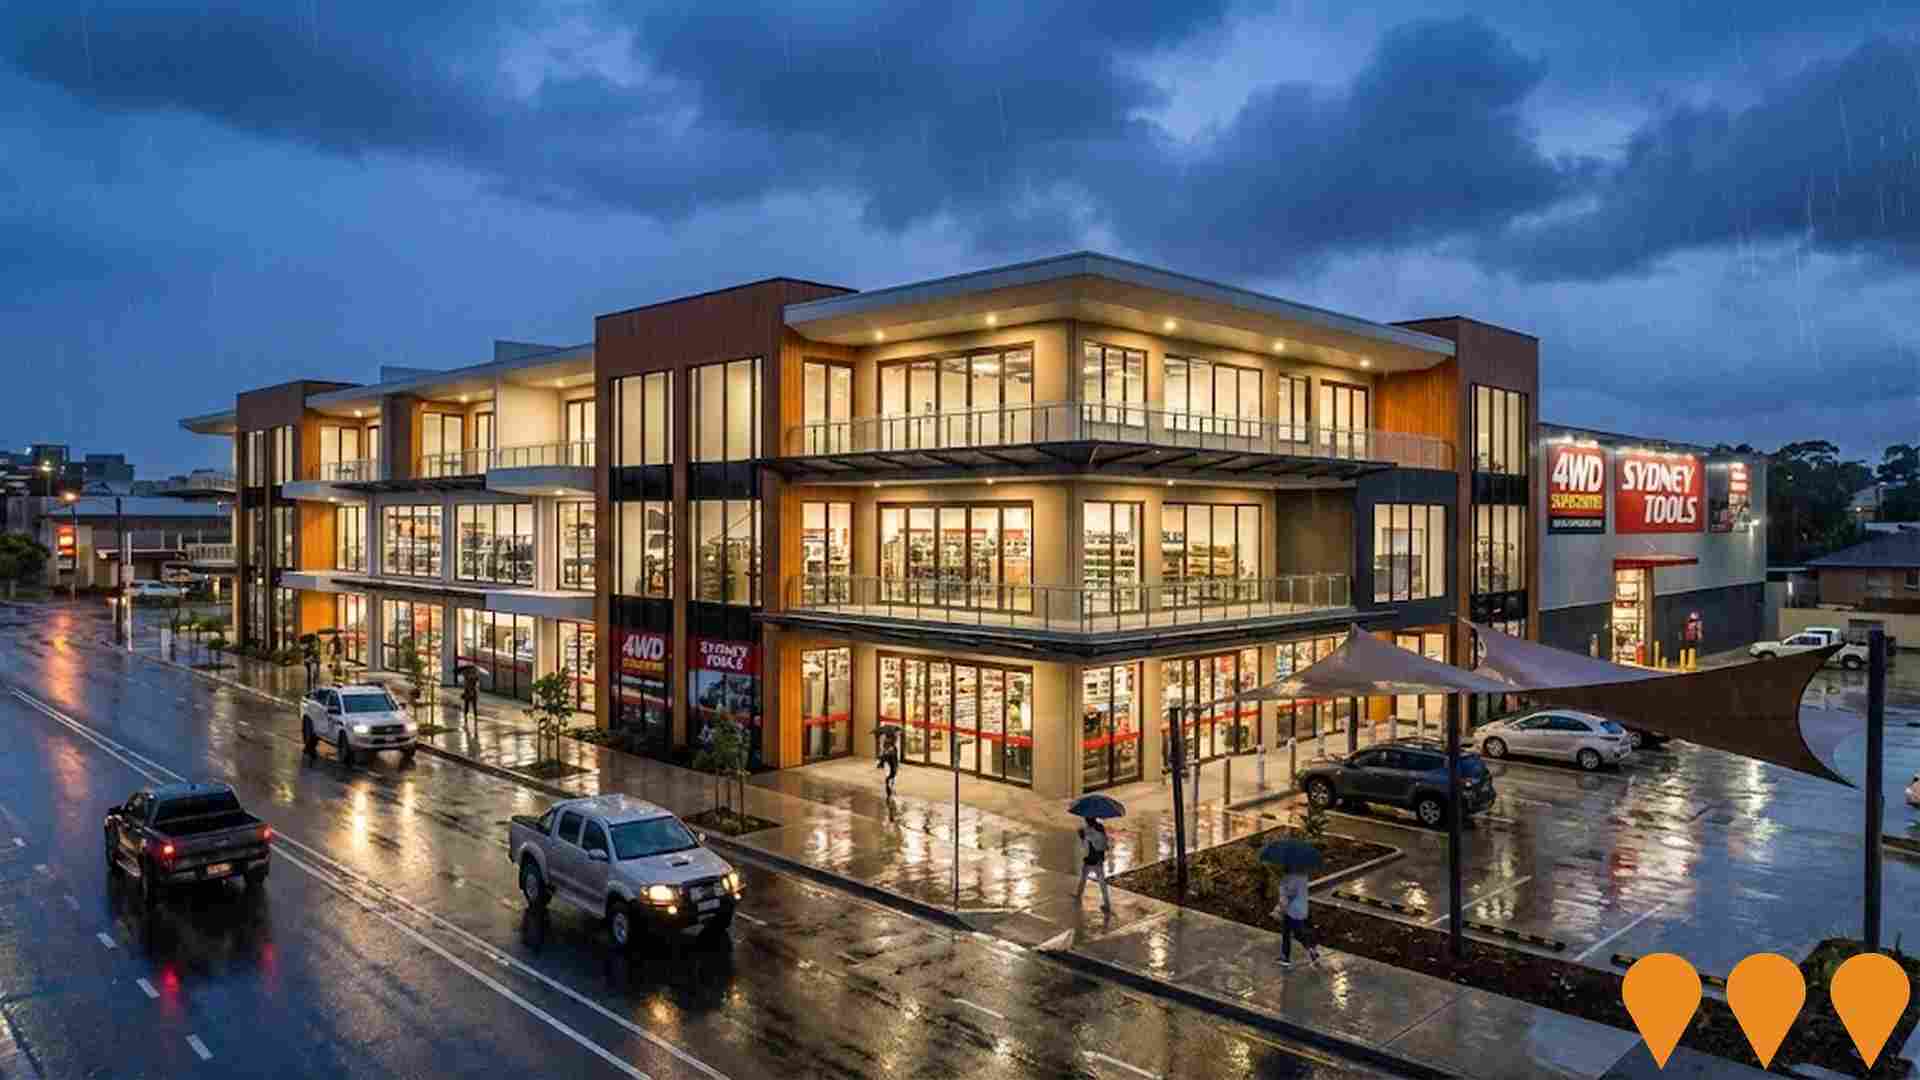
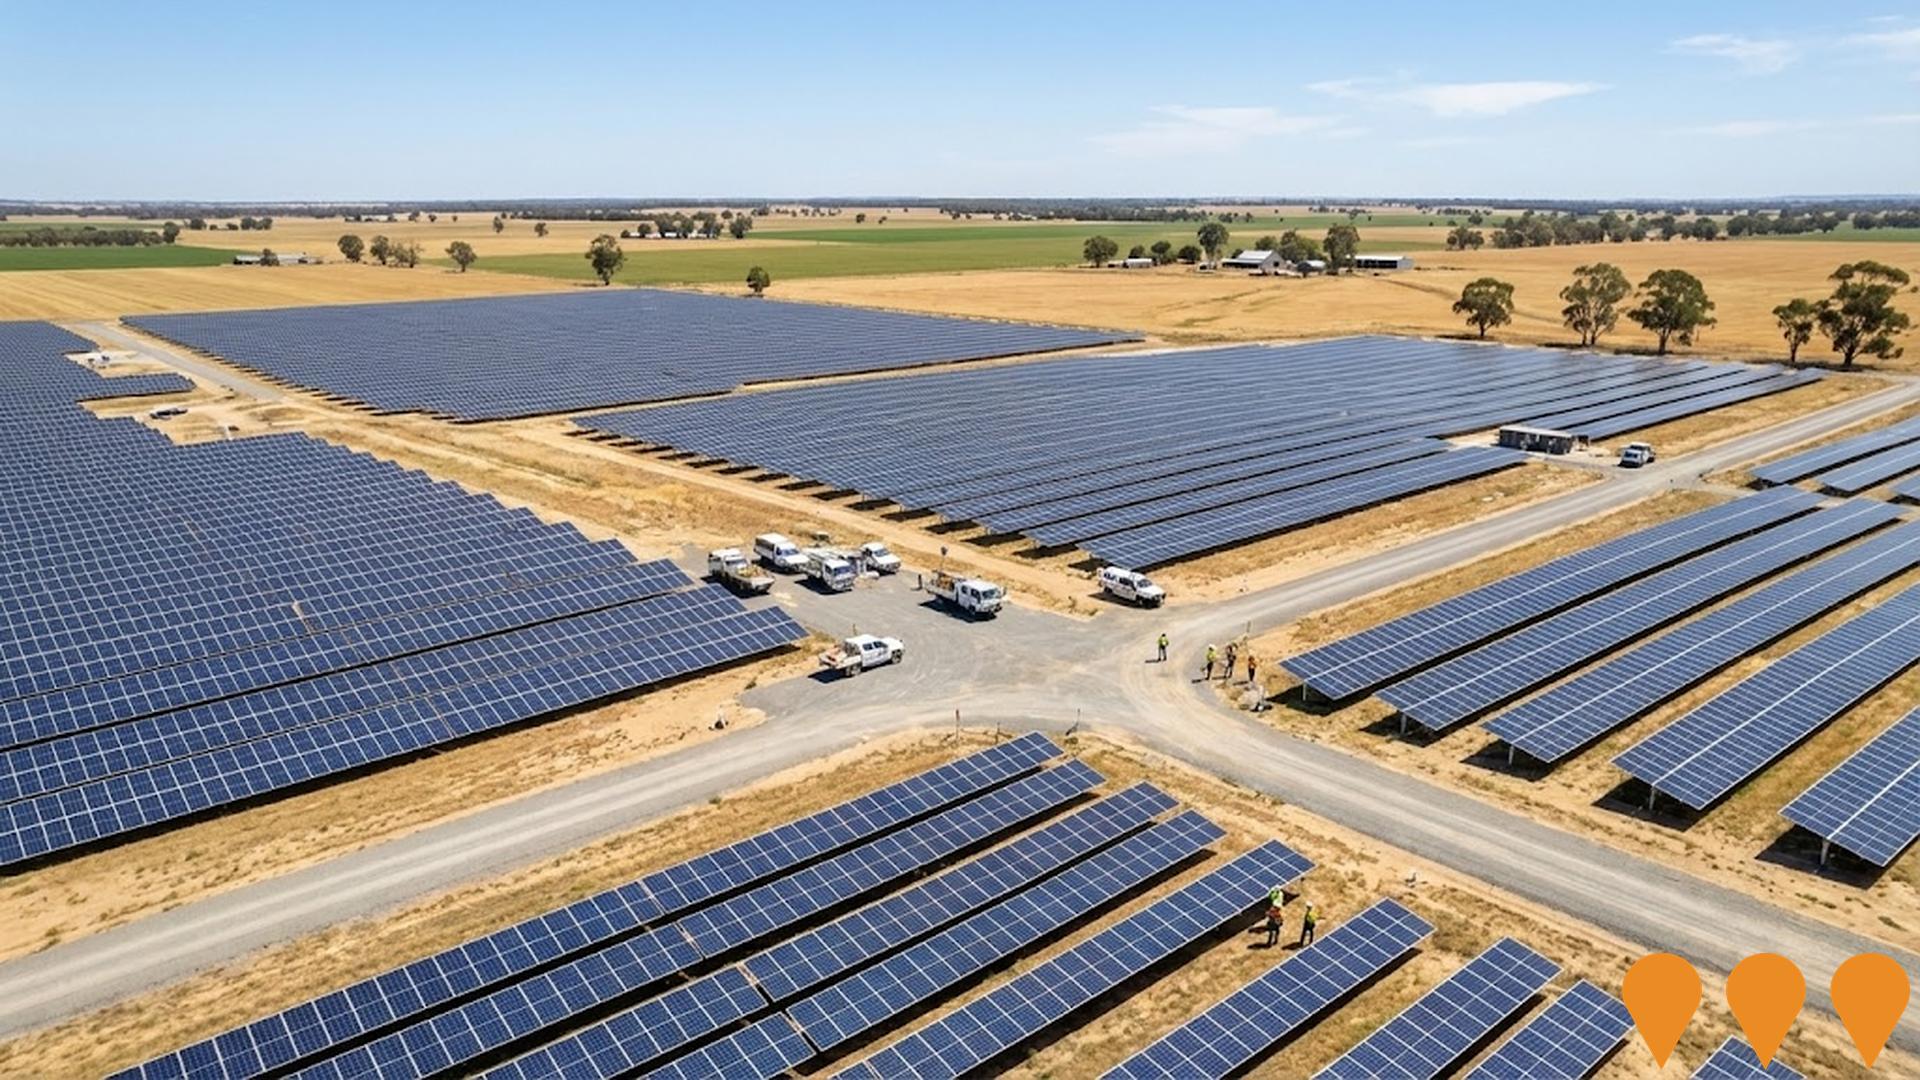
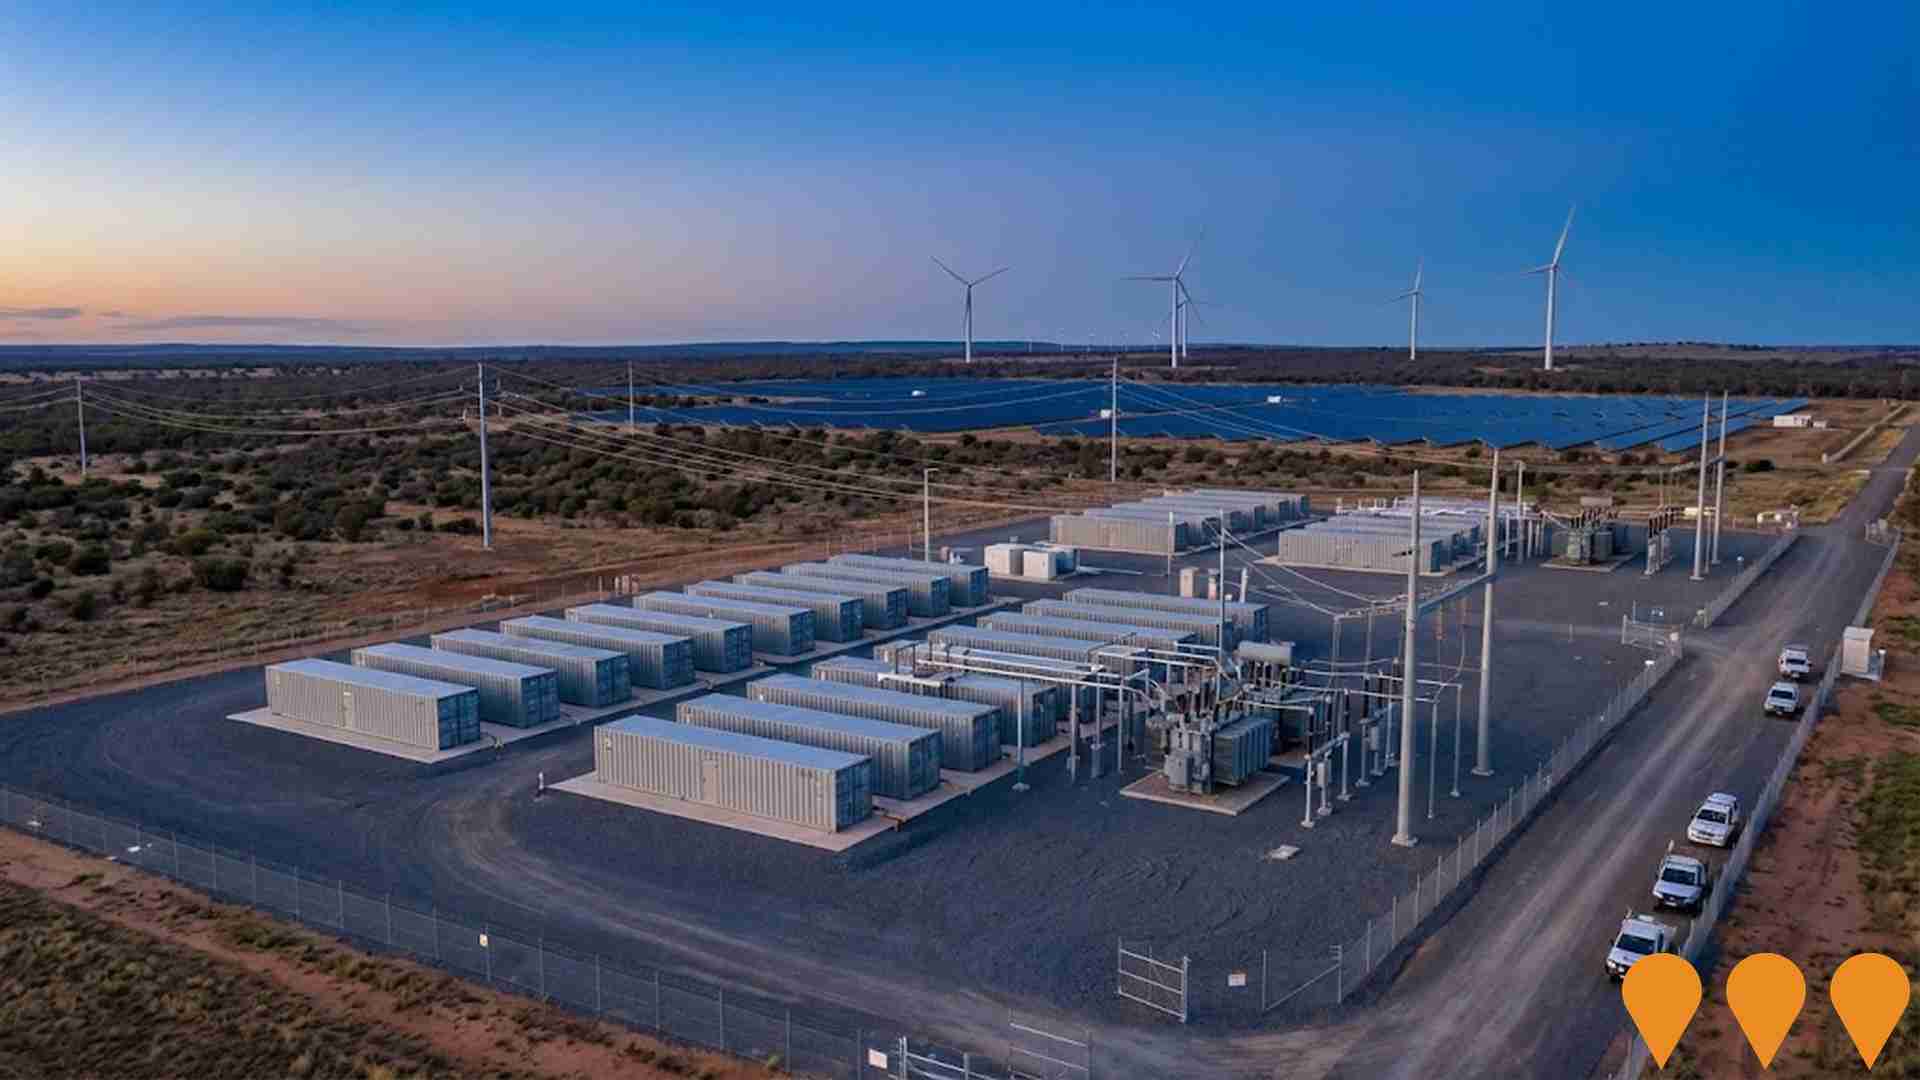
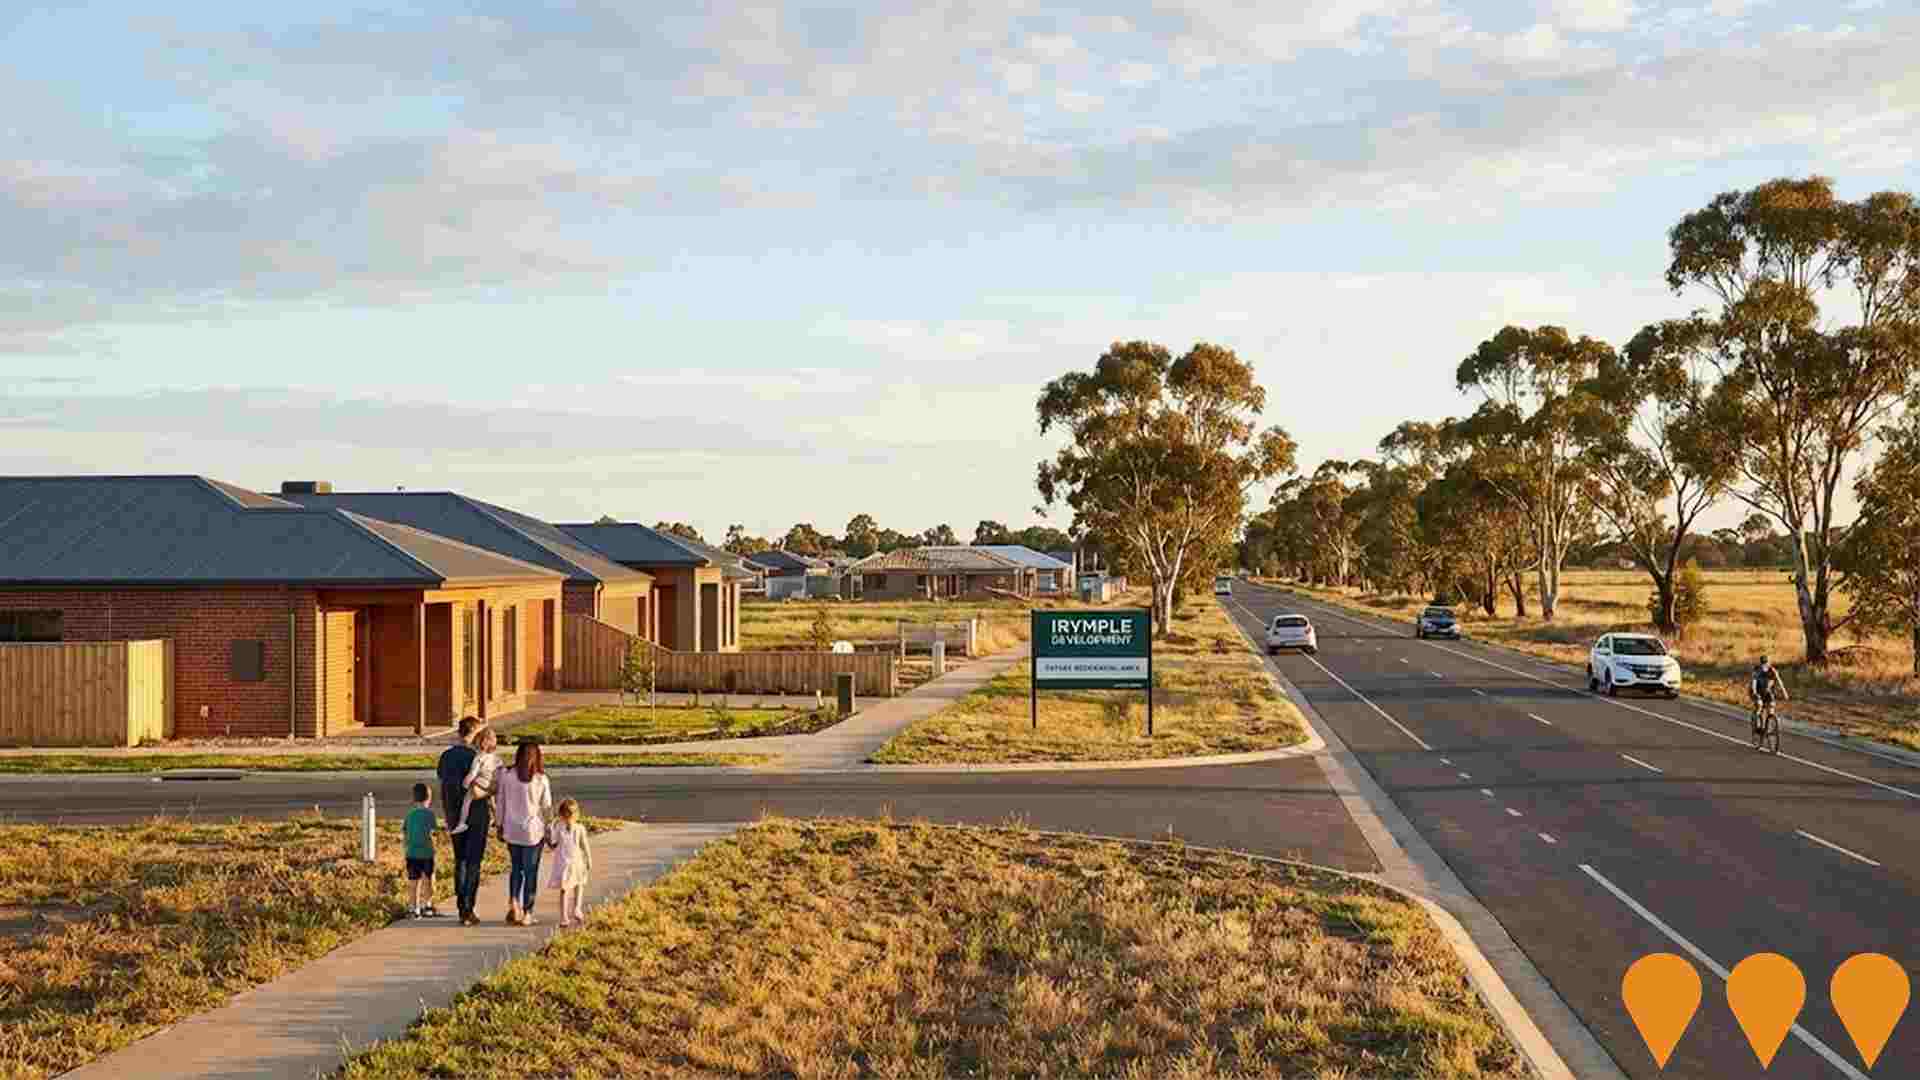
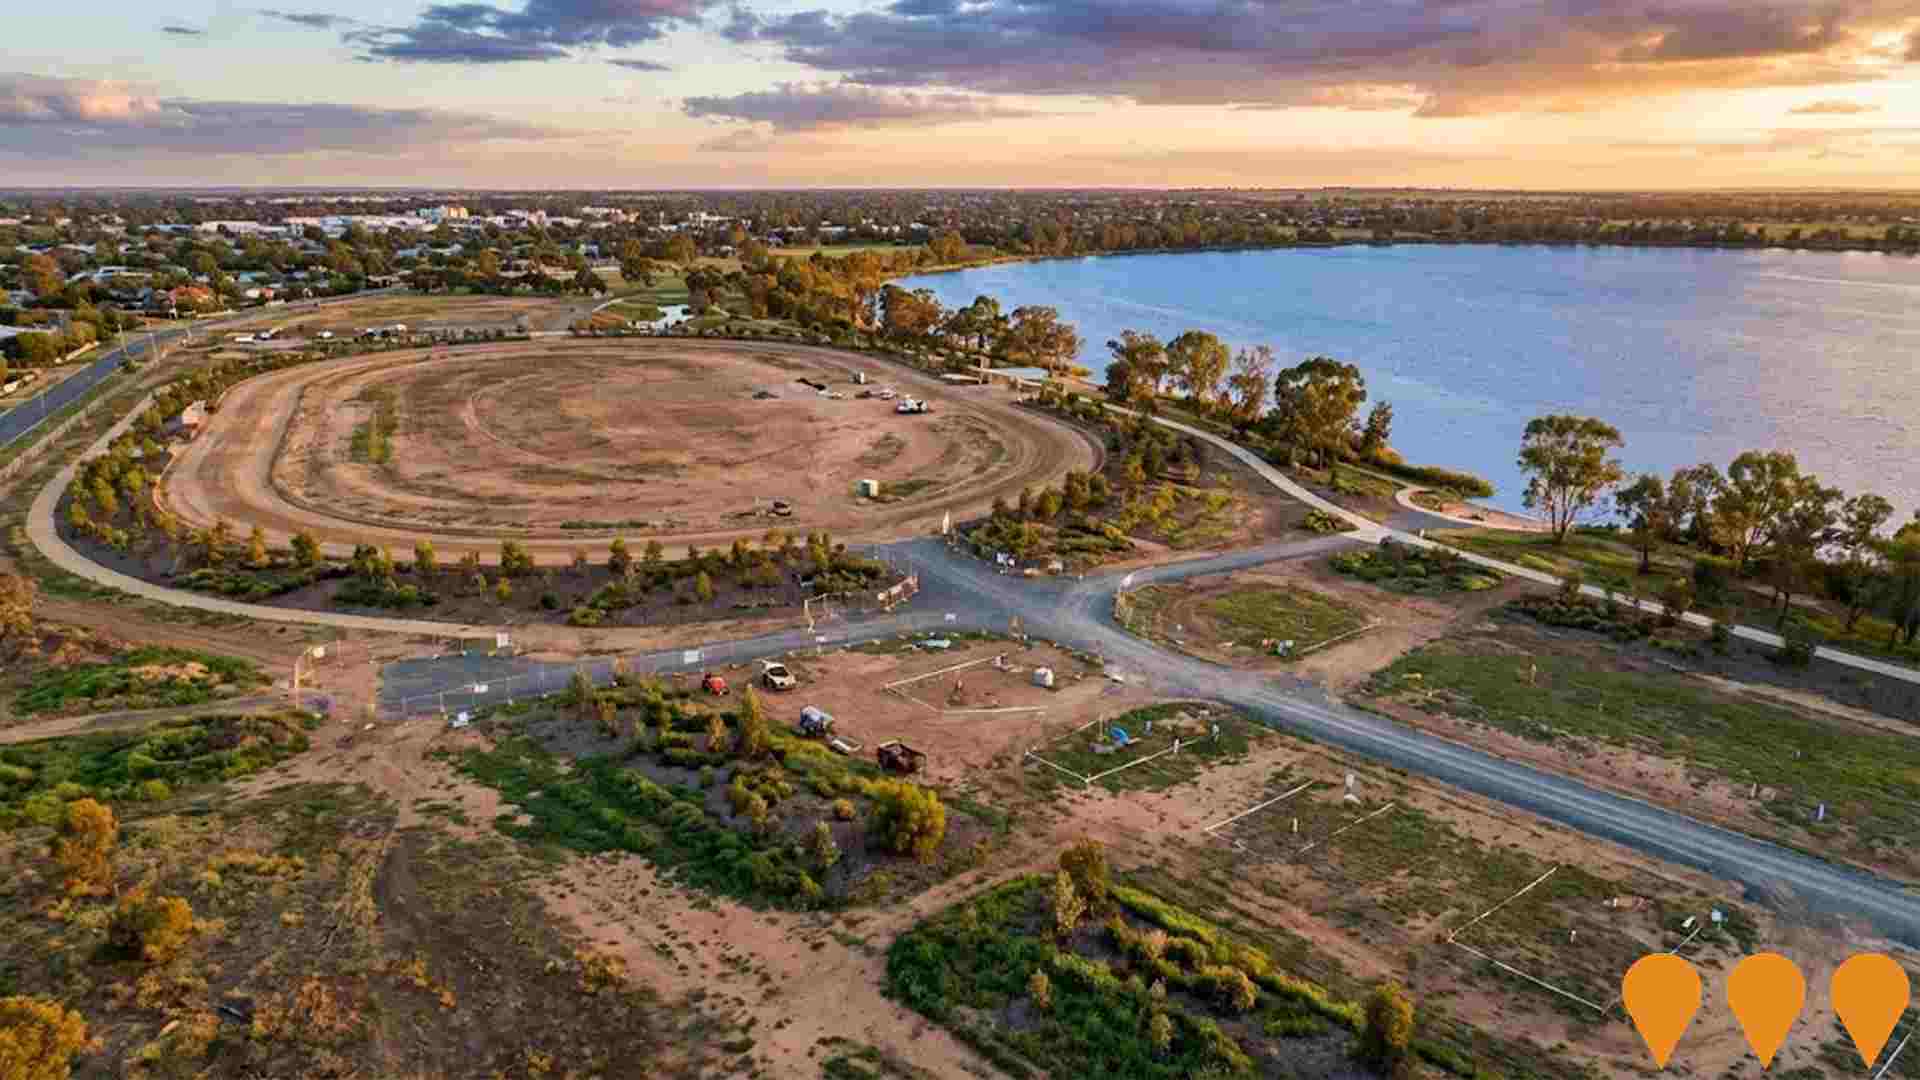
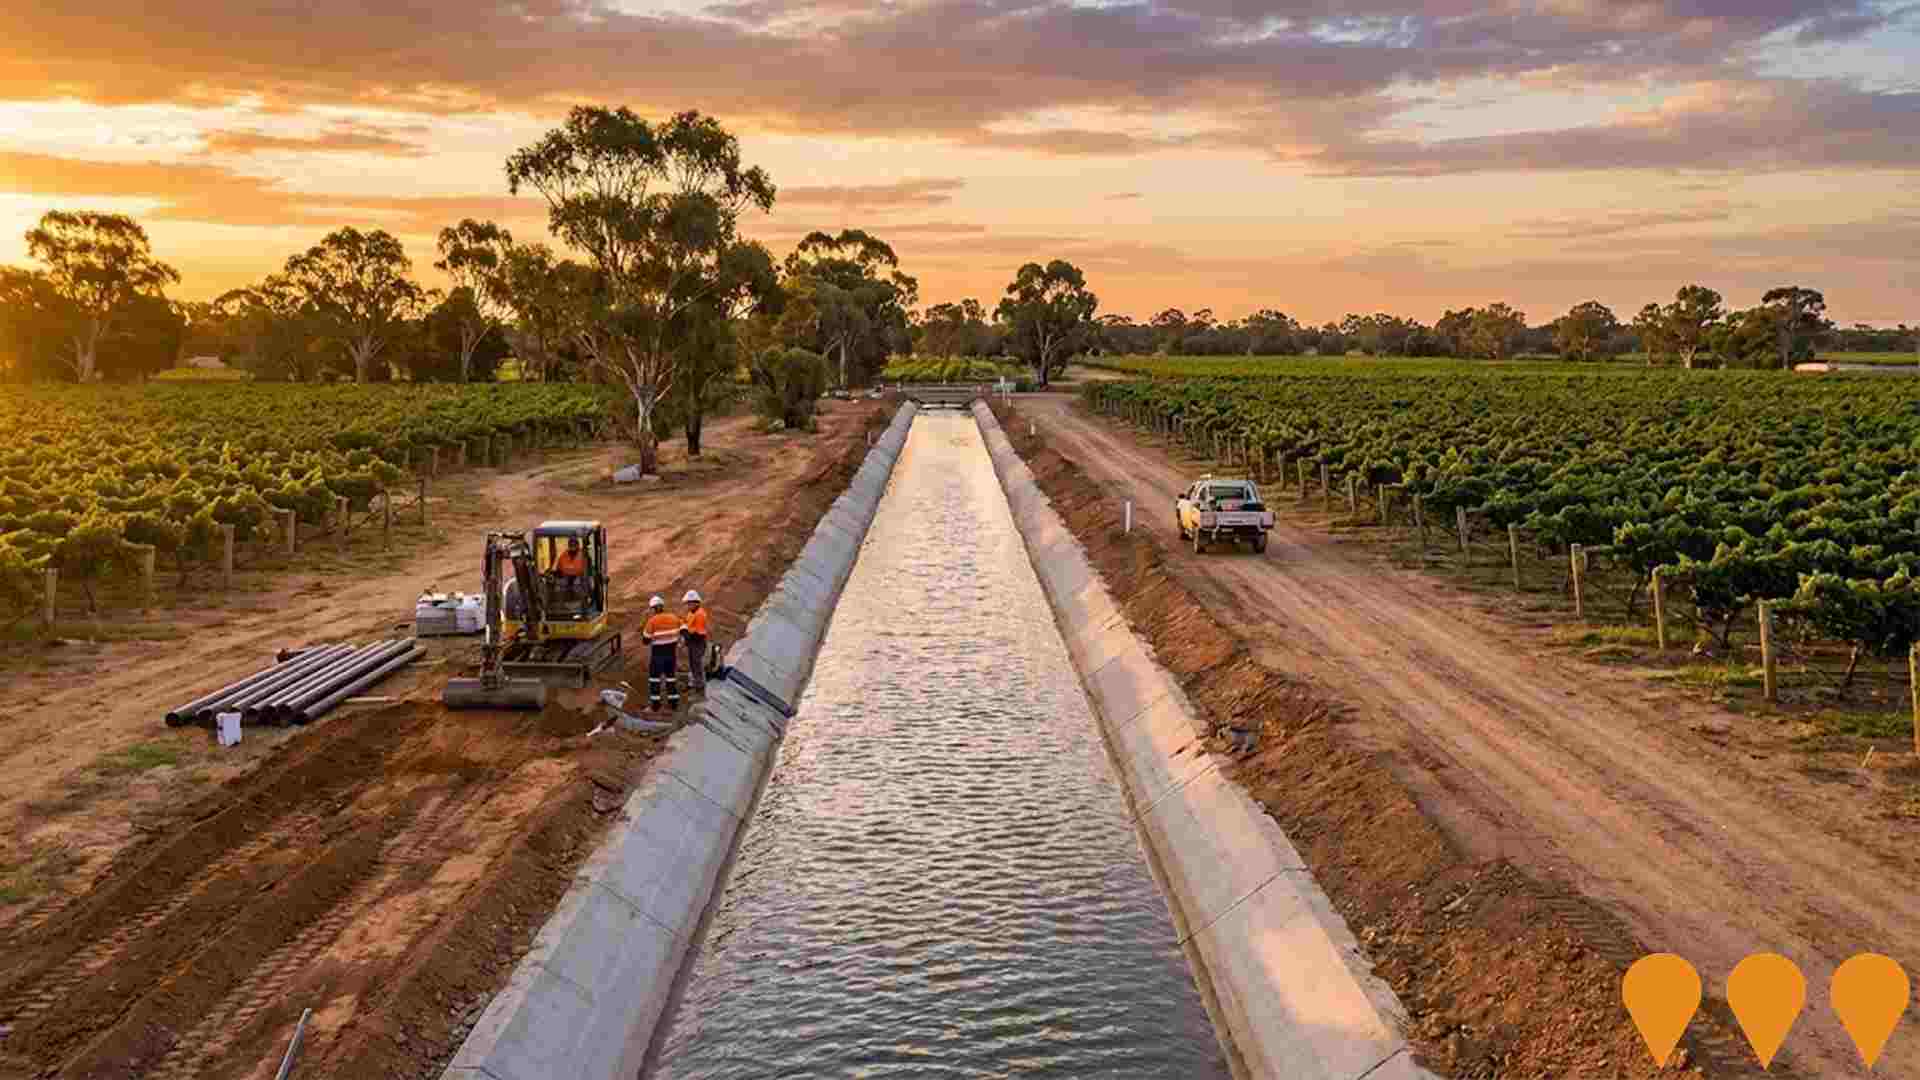
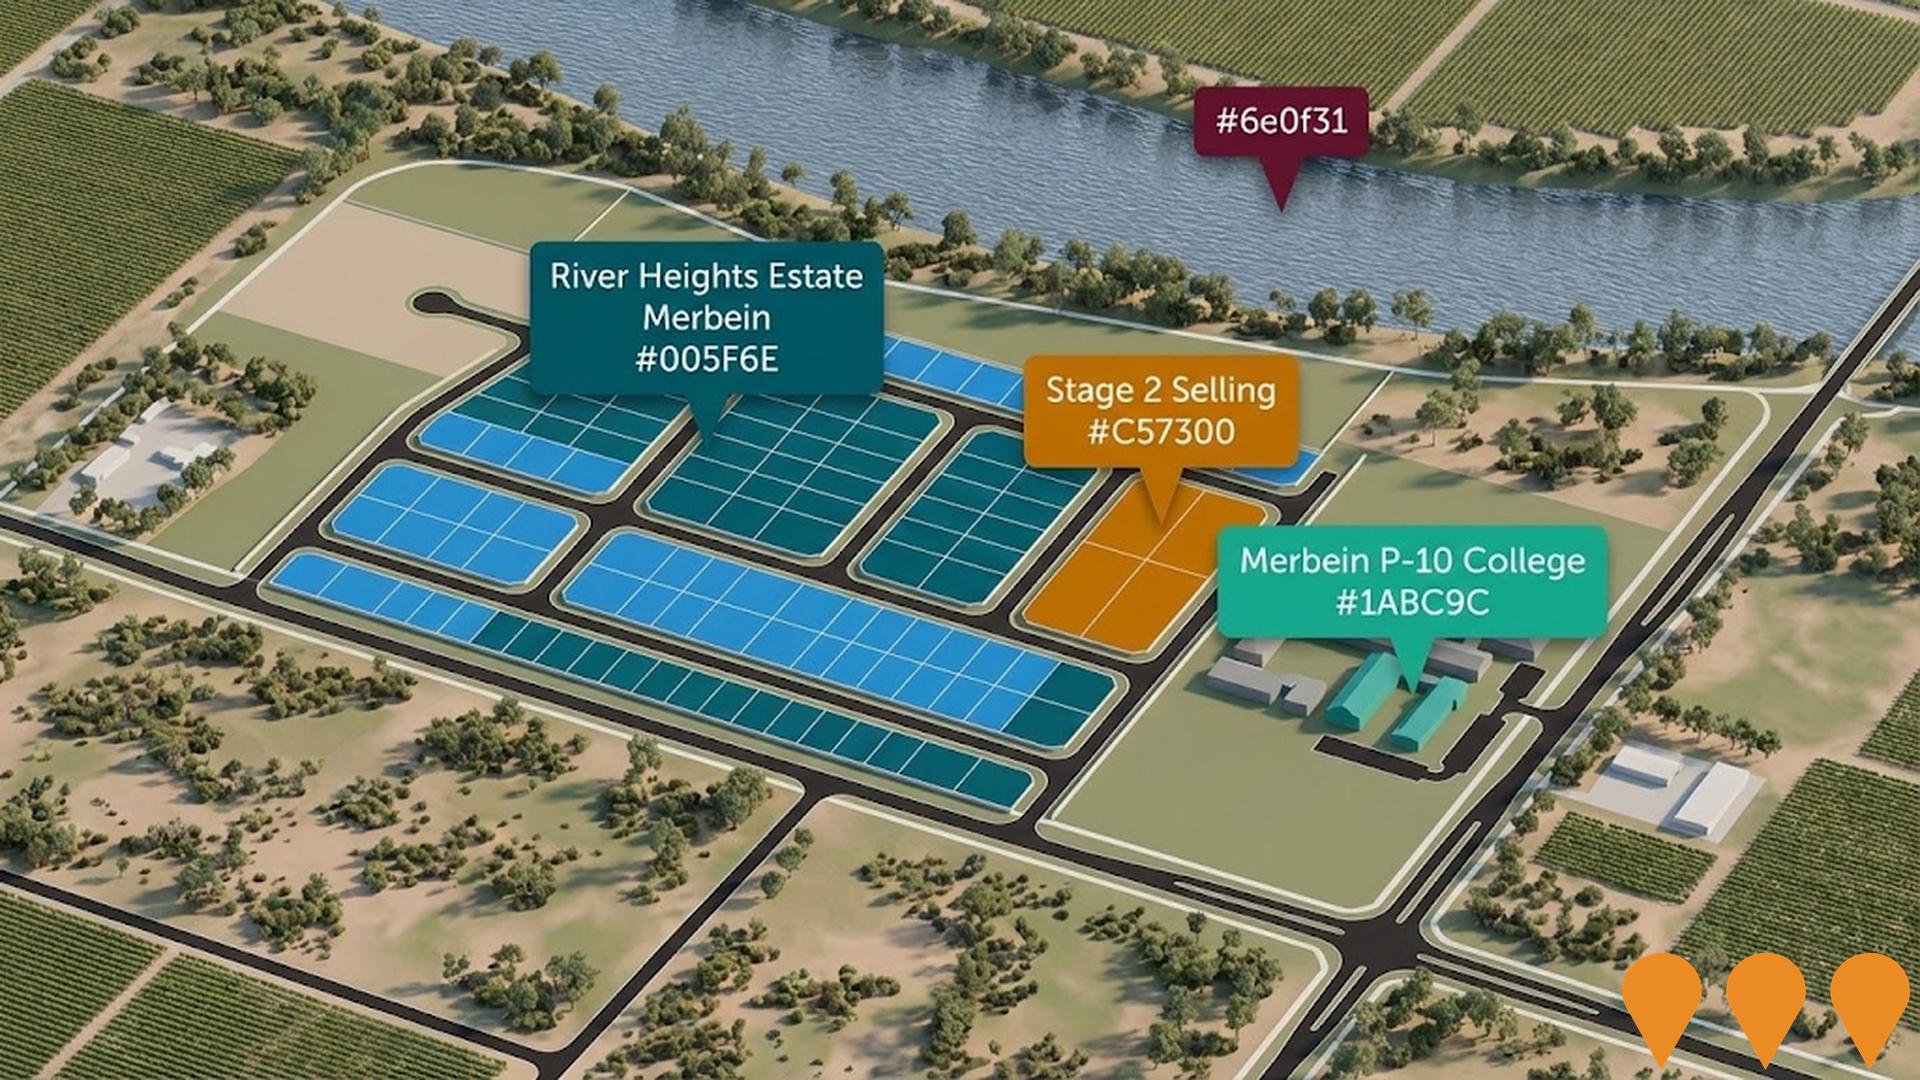
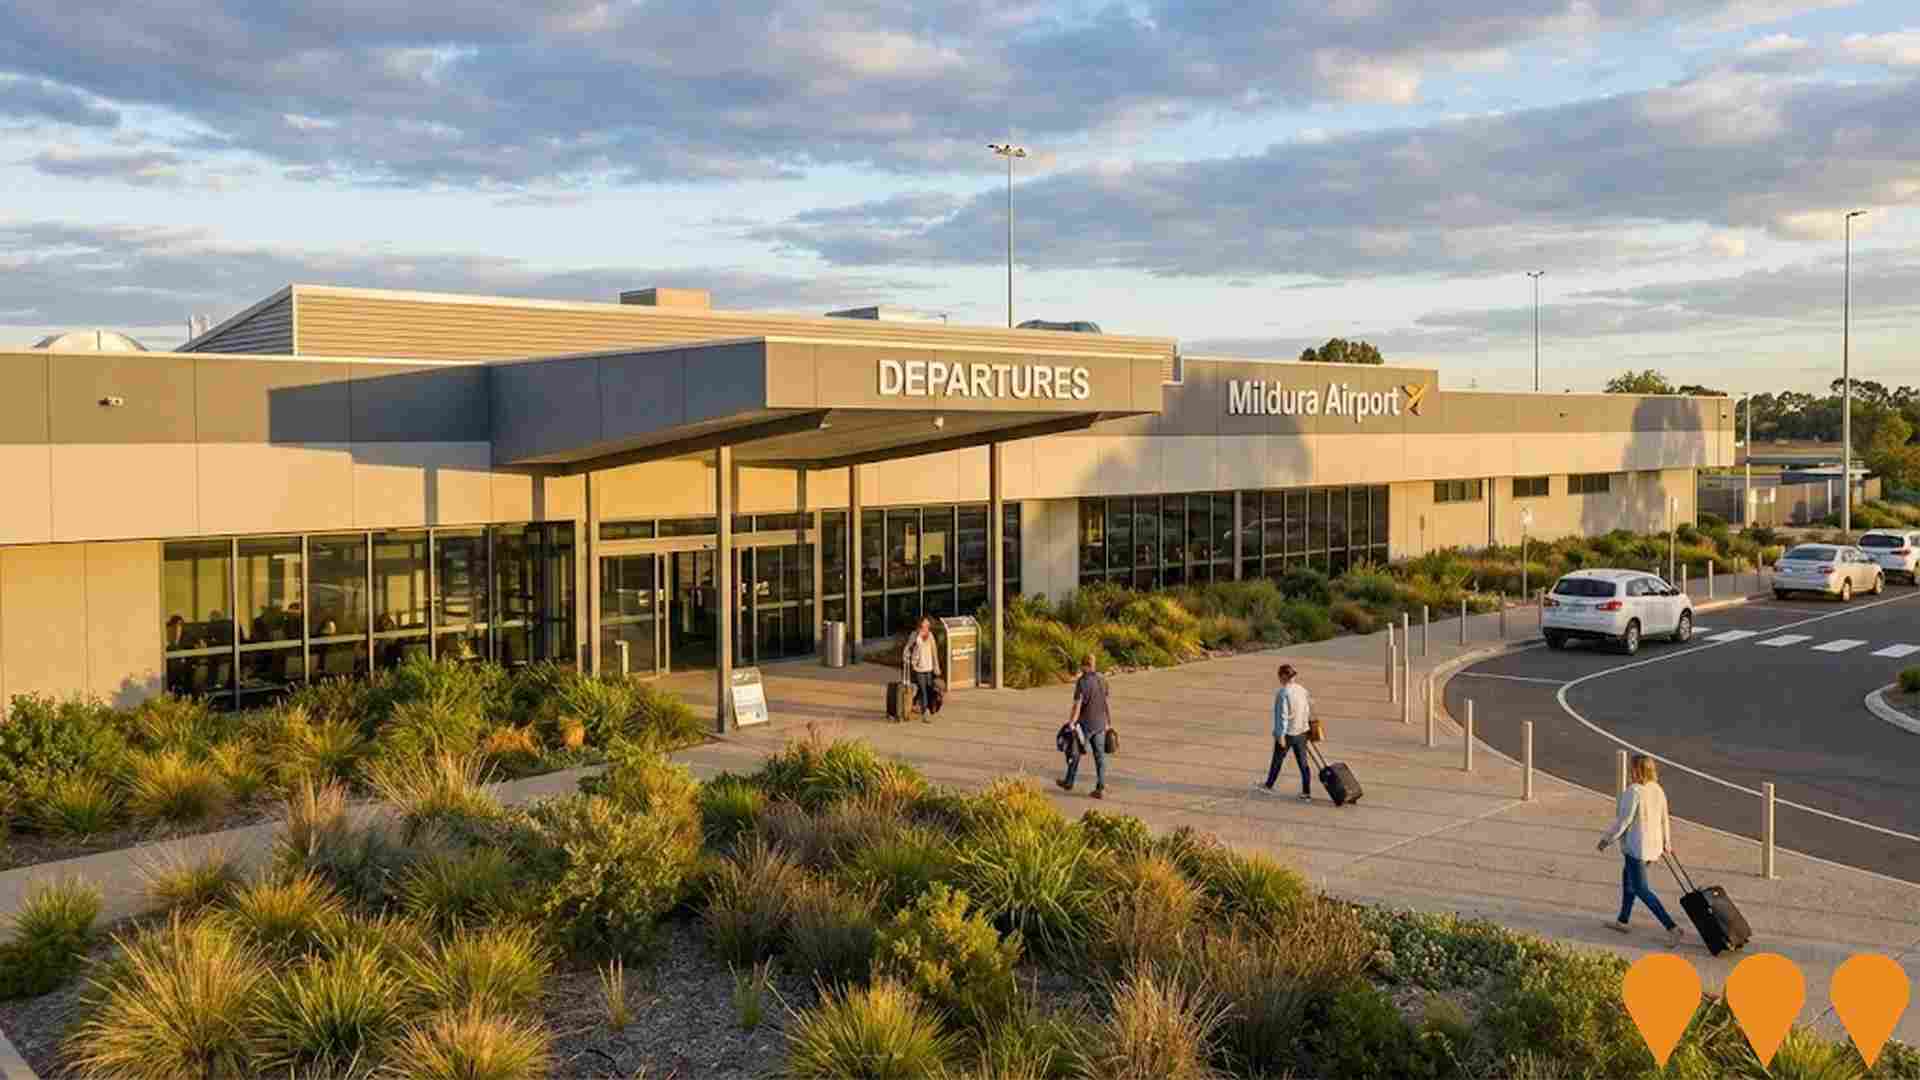
 Denotes AI-based impression for illustrative purposes only, not to be taken as definitive under any circumstances. Please follow links and conduct other investigations from the project's source for actual imagery. Developers and project owners wishing us to use original imagery please Contact Us and we will do so.
Frequently Asked Questions - Infrastructure
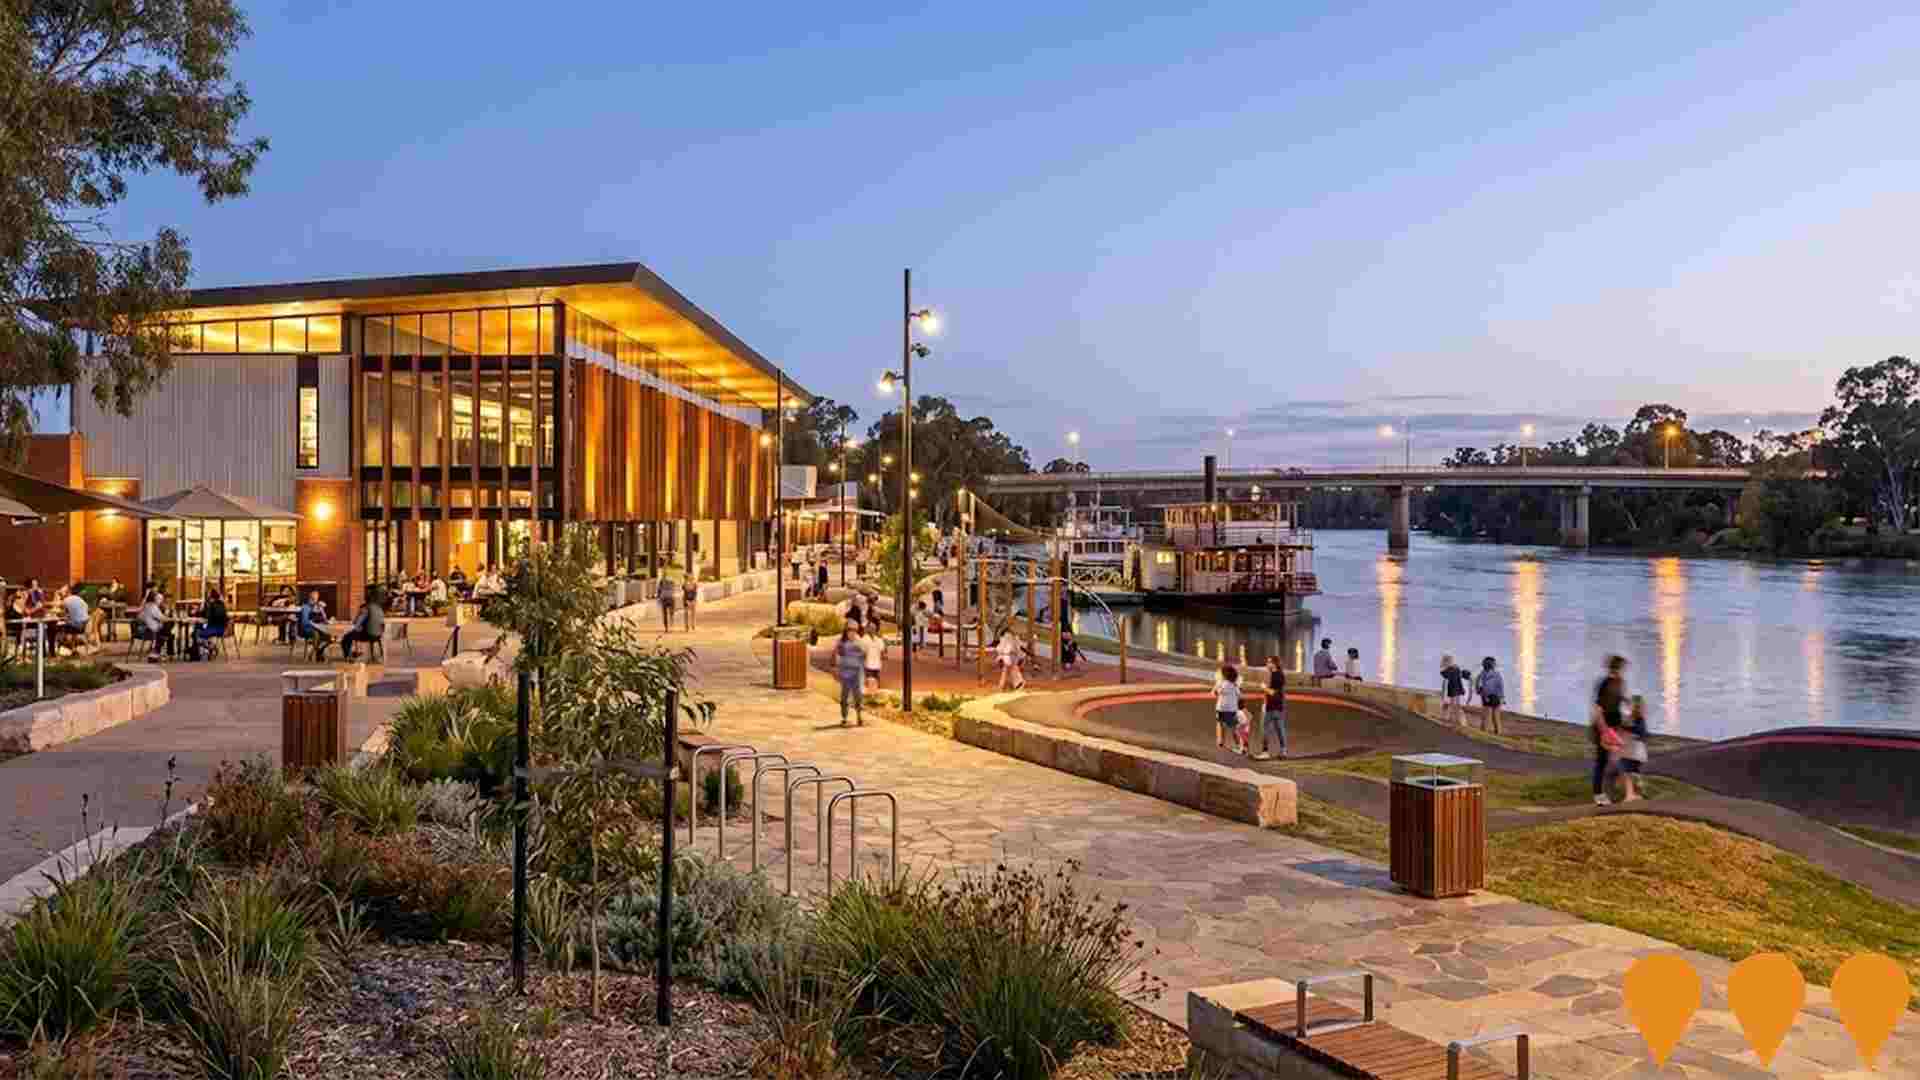
Mildura Riverfront Redevelopment - Stage 2
The Mildura Riverfront Redevelopment Stage 2 focuses on the revitalisation of the Powerhouse Precinct. This major project involves the transformation of the historic Powerhouse building into a multi-use cultural and commercial hub, the creation of a new bespoke playground, a bitumen pump track, and extensive landscaping. The goal is to strengthen the connection between the Mildura CBD and the riverfront, enhancing the area as a key tourism and community destination.
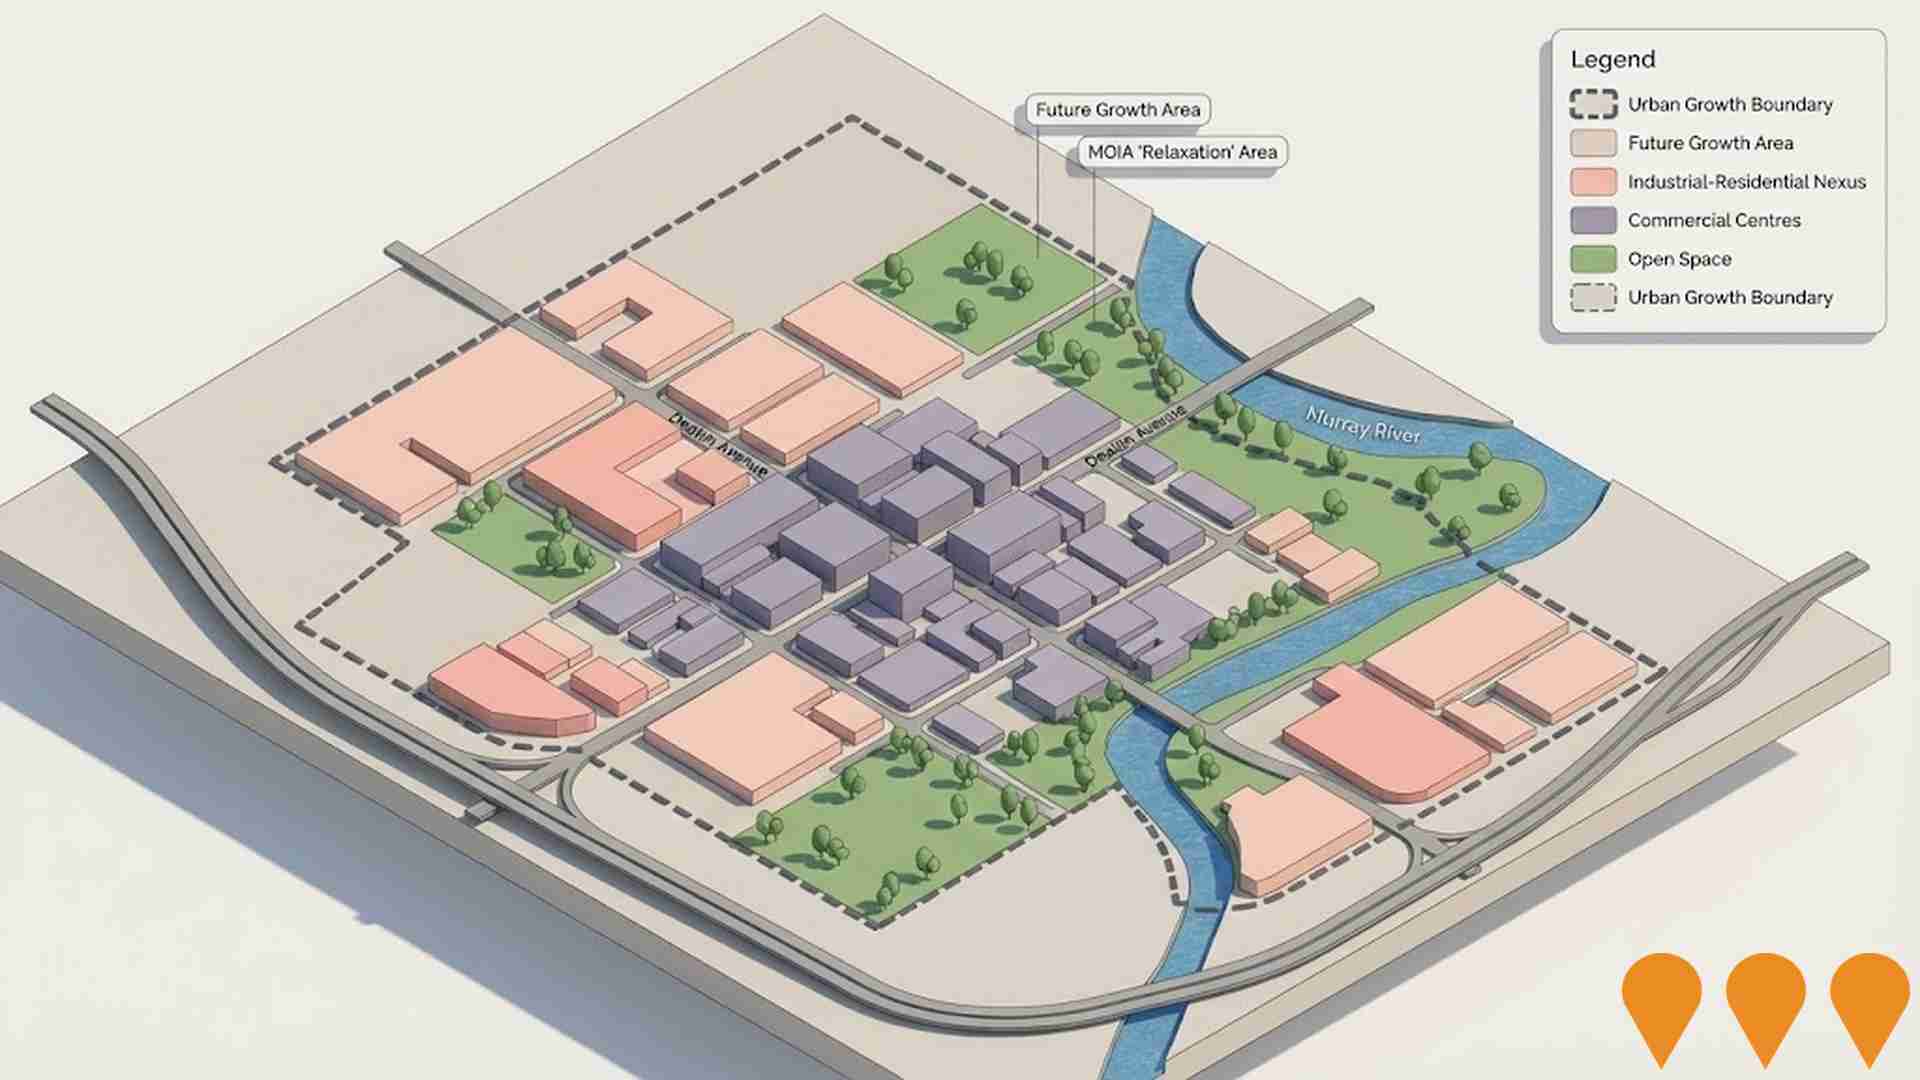
Mildura CBD Revitalisation Project
Comprehensive multi-stage project to revitalise and transform Mildura's Central Business District. Key components include the Feast Street Upgrade with shared street design and dining arbour structures, Langtree Mall placemaking initiatives with grassed areas, lighting and misters, economic feasibility studies, connectivity improvements, and public realm enhancements. The project aims to deliver economic revitalisation, improve access and connectivity, and create a more vibrant, people-oriented centre for community life supported by sustainable economic growth.
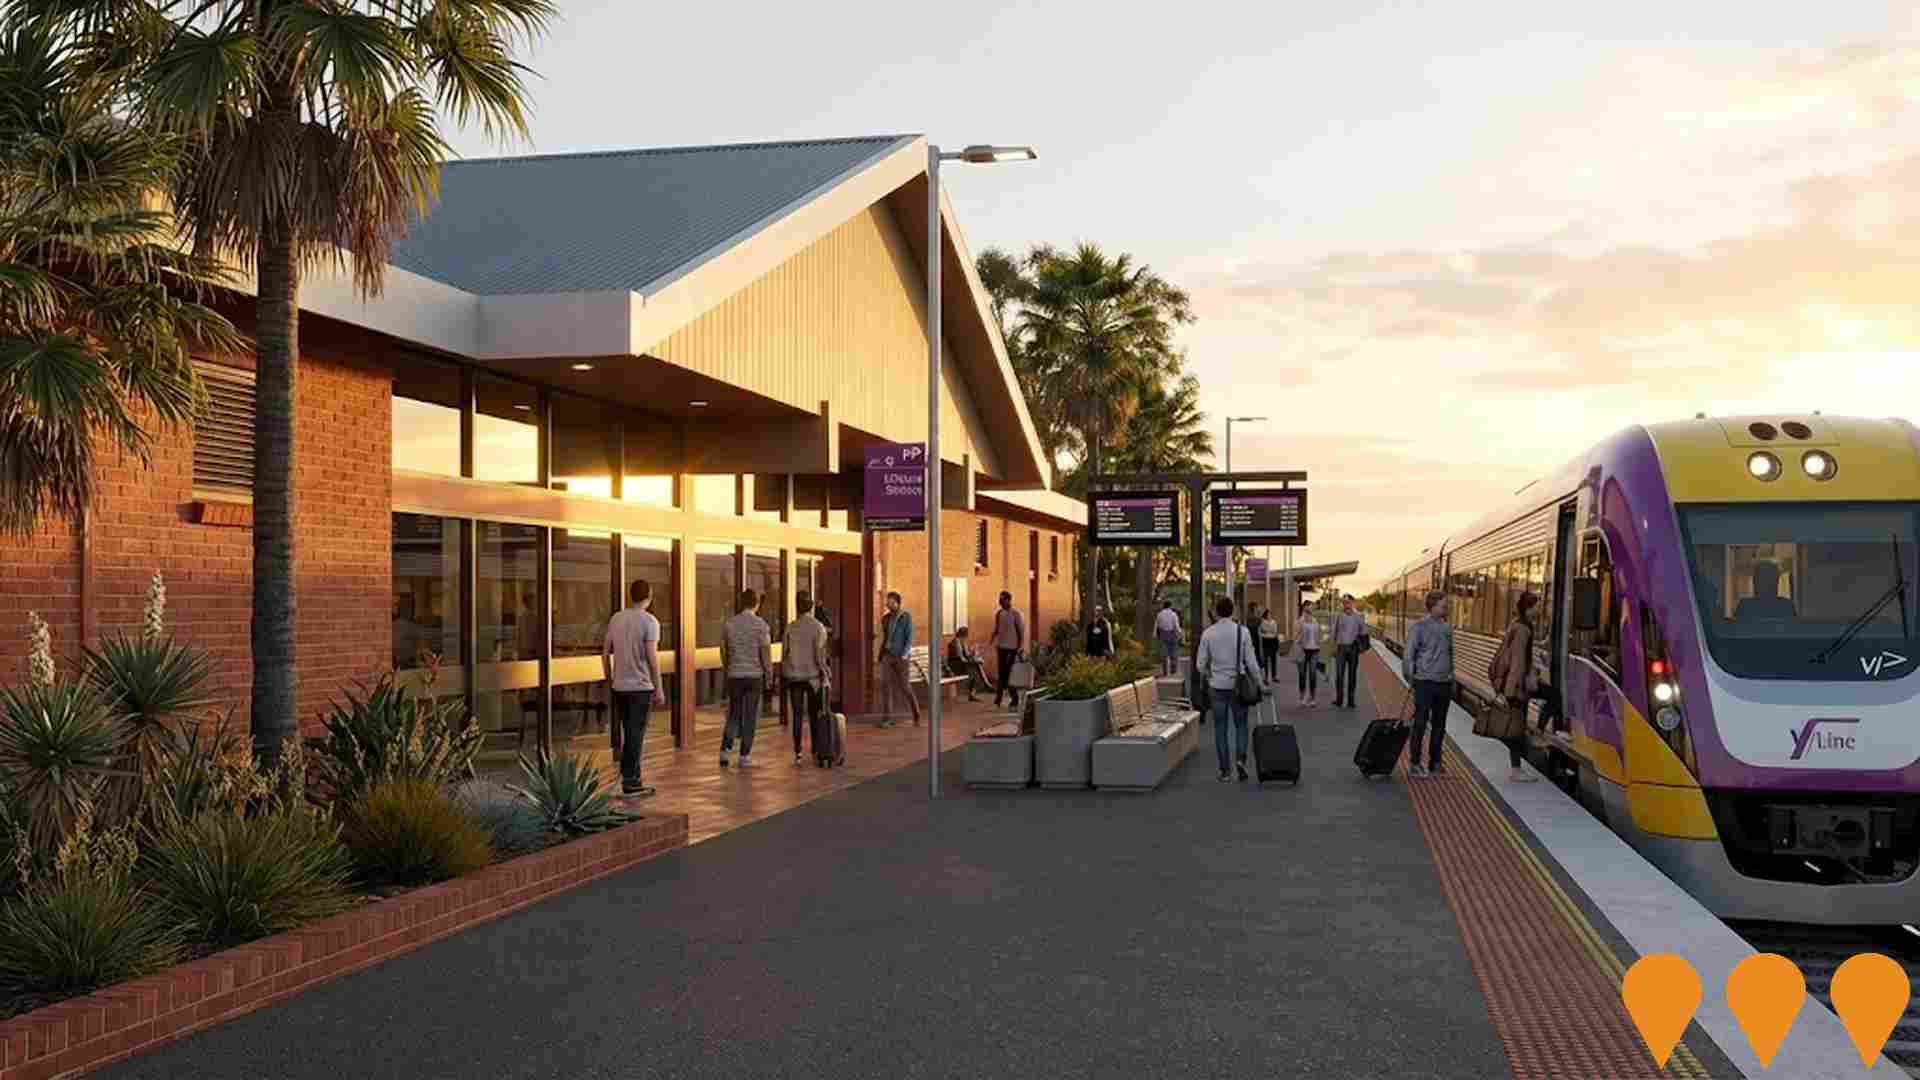
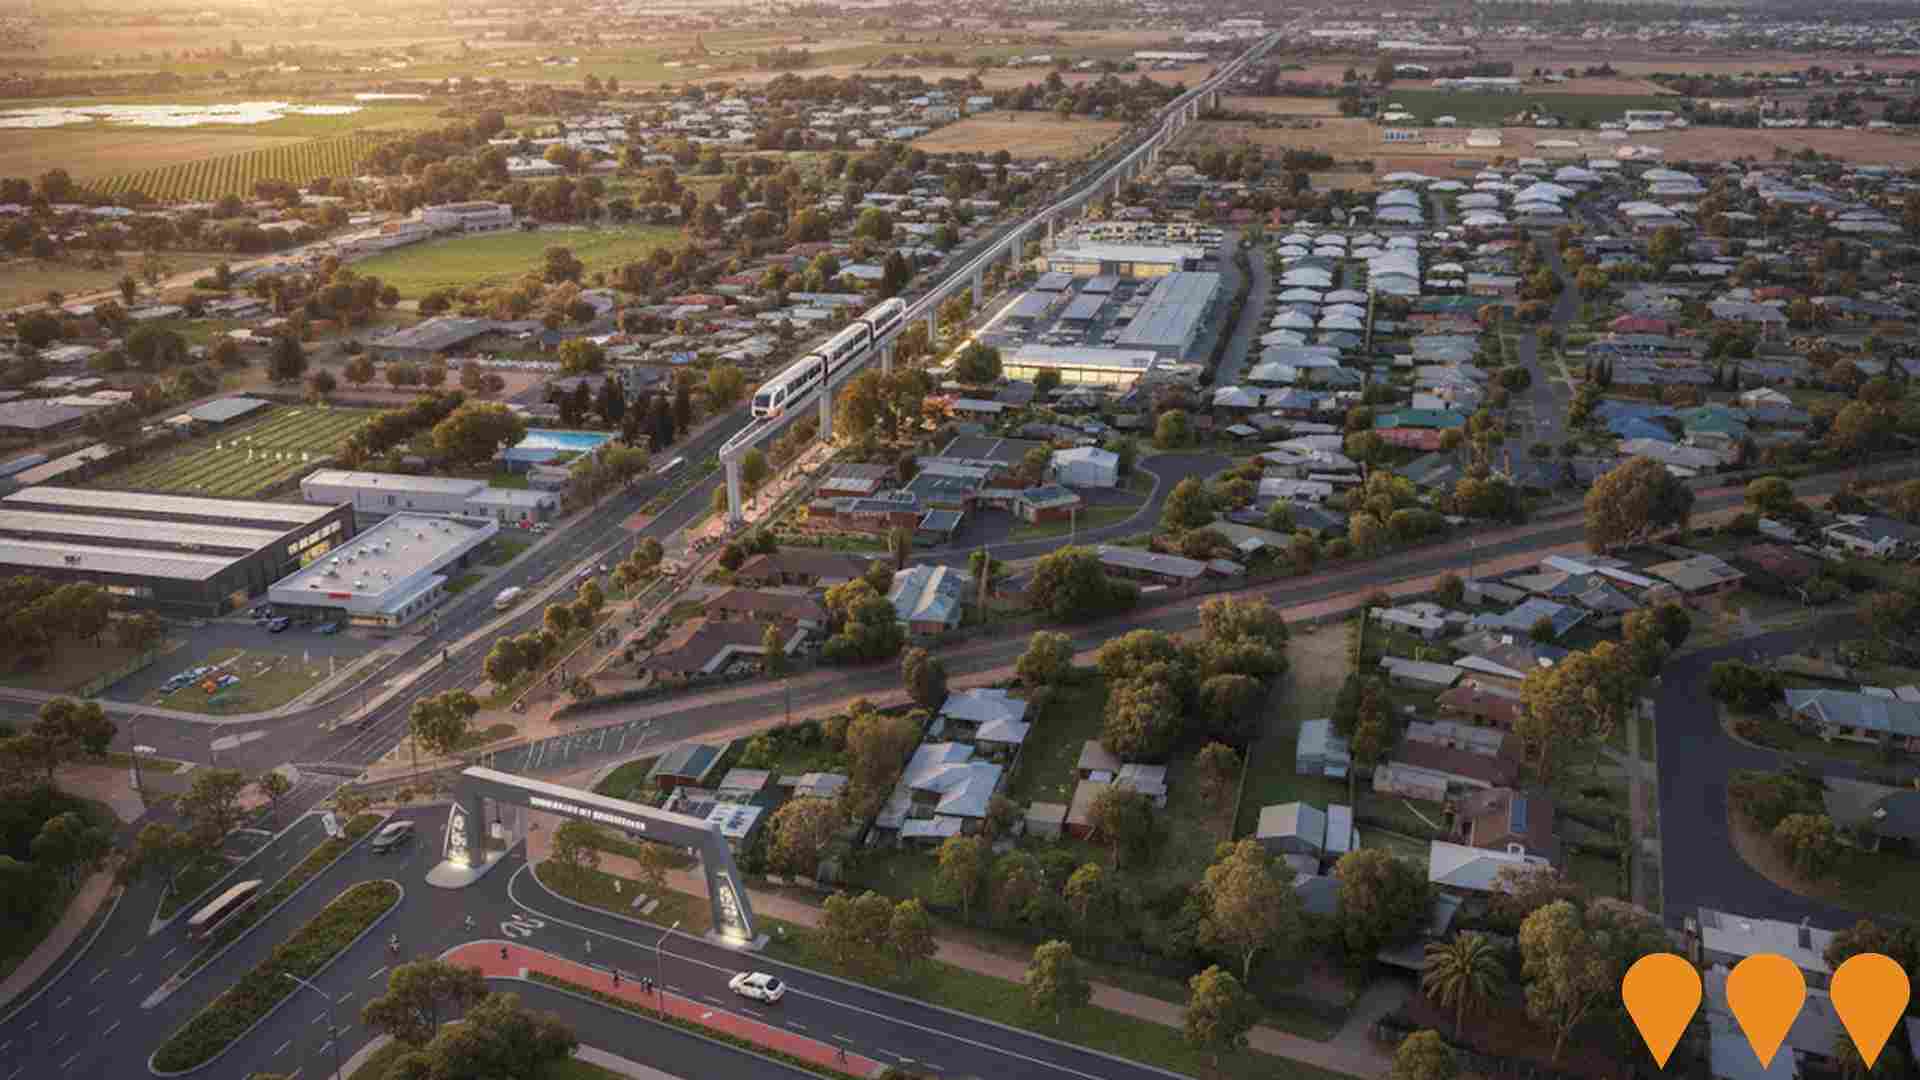
Mildura Passenger Rail Return
Long-running advocacy and planning initiative to reinstate passenger rail services between Mildura and Melbourne, restoring a connection that ended in 1993. Mildura remains the largest Victorian regional centre without a passenger rail link. The current focus, as of 2026, has shifted to a staged 'Rails to Recovery' concept circulated by the Rail Revival Alliance Victoria, proposing a standard-gauge locomotive-hauled shuttle between Mildura and Maryborough, connecting with the existing V/Line VLocity service to Melbourne via Ballarat.Two active Victorian Parliament petitions are pushing for the trial: a Legislative Assembly e-petition closing 10 May 2026 and Legislative Council Petition #730 closing 28 February 2026. Mildura MP Jade Benham has renewed parliamentary calls and is meeting rail stakeholders to identify practical pathways. Mildura Rural City Council continues to advocate for the project under its Mildura Future Ready strategy. Significant infrastructure considerations remain, including upgrades at around 145 level crossings, rolling stock provisioning, and operating model. The Victorian Government has not committed funding for delivery as of early 2026.
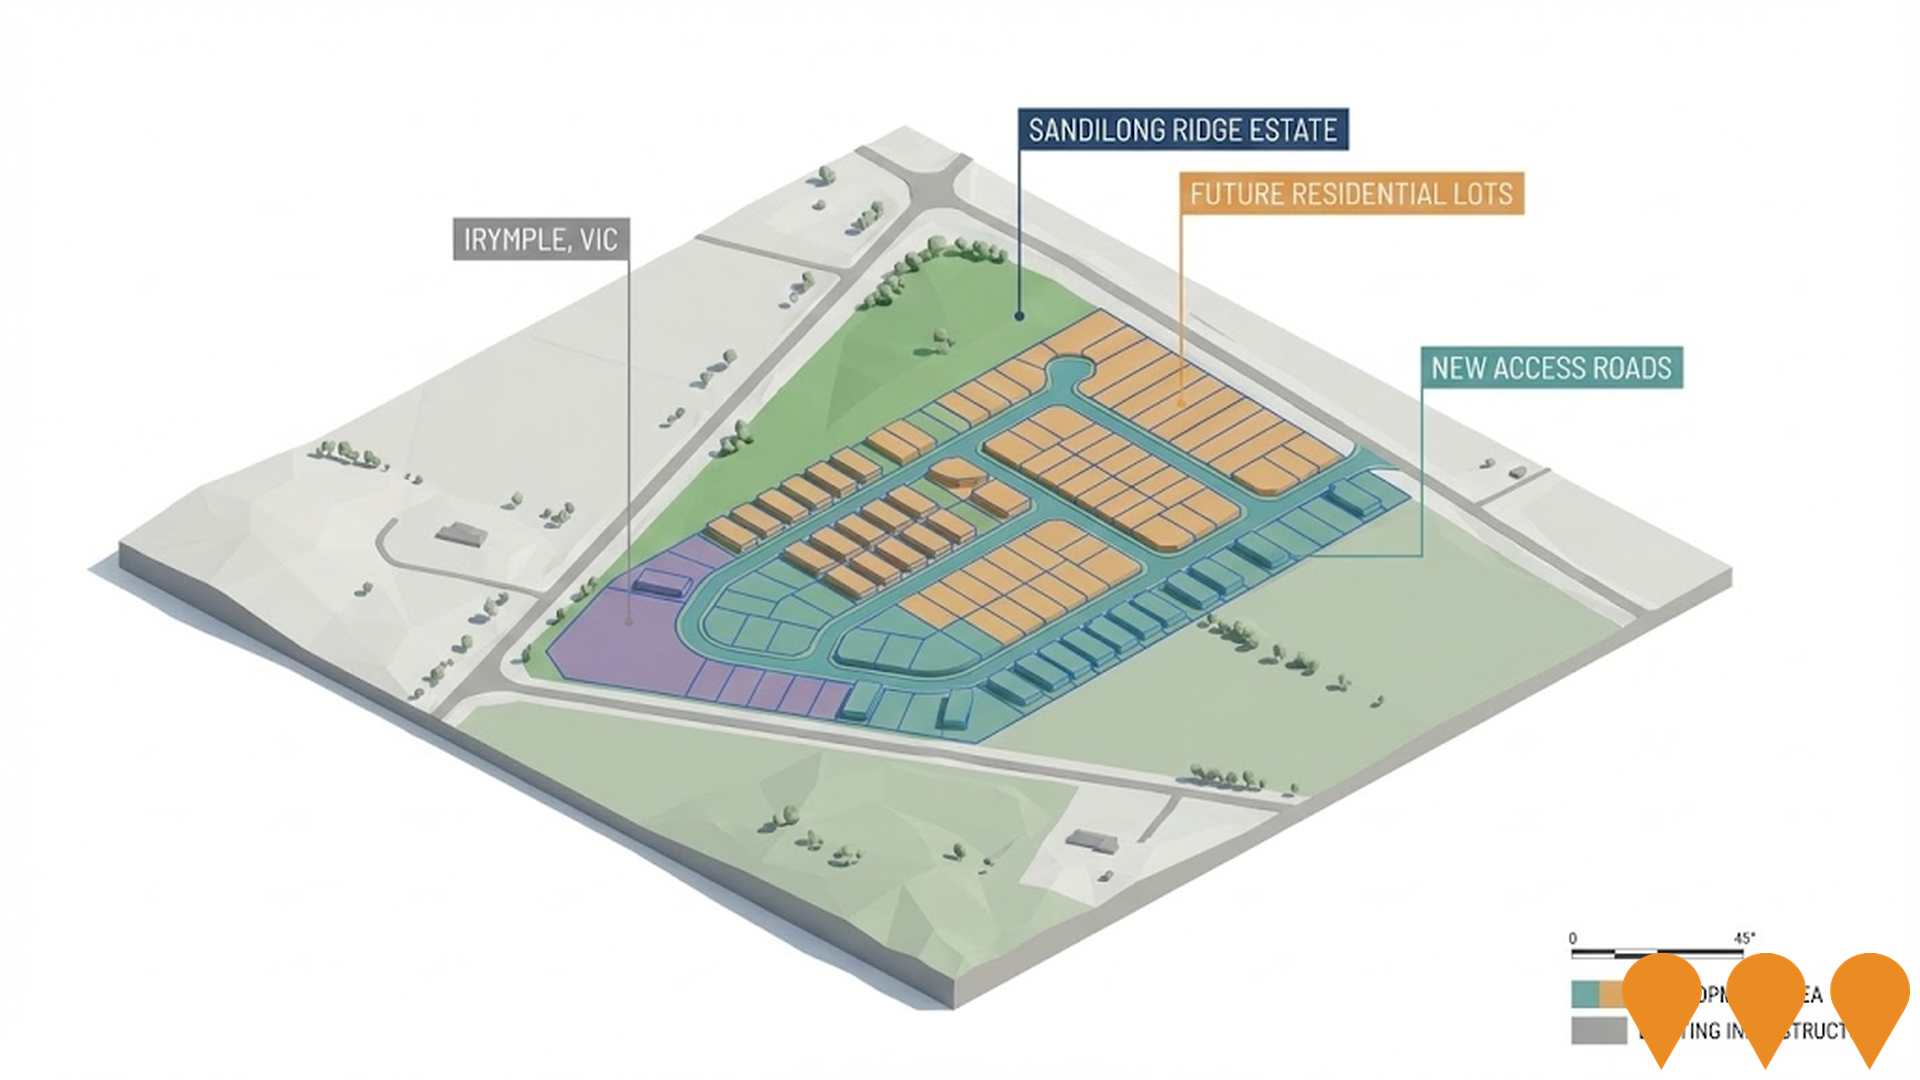
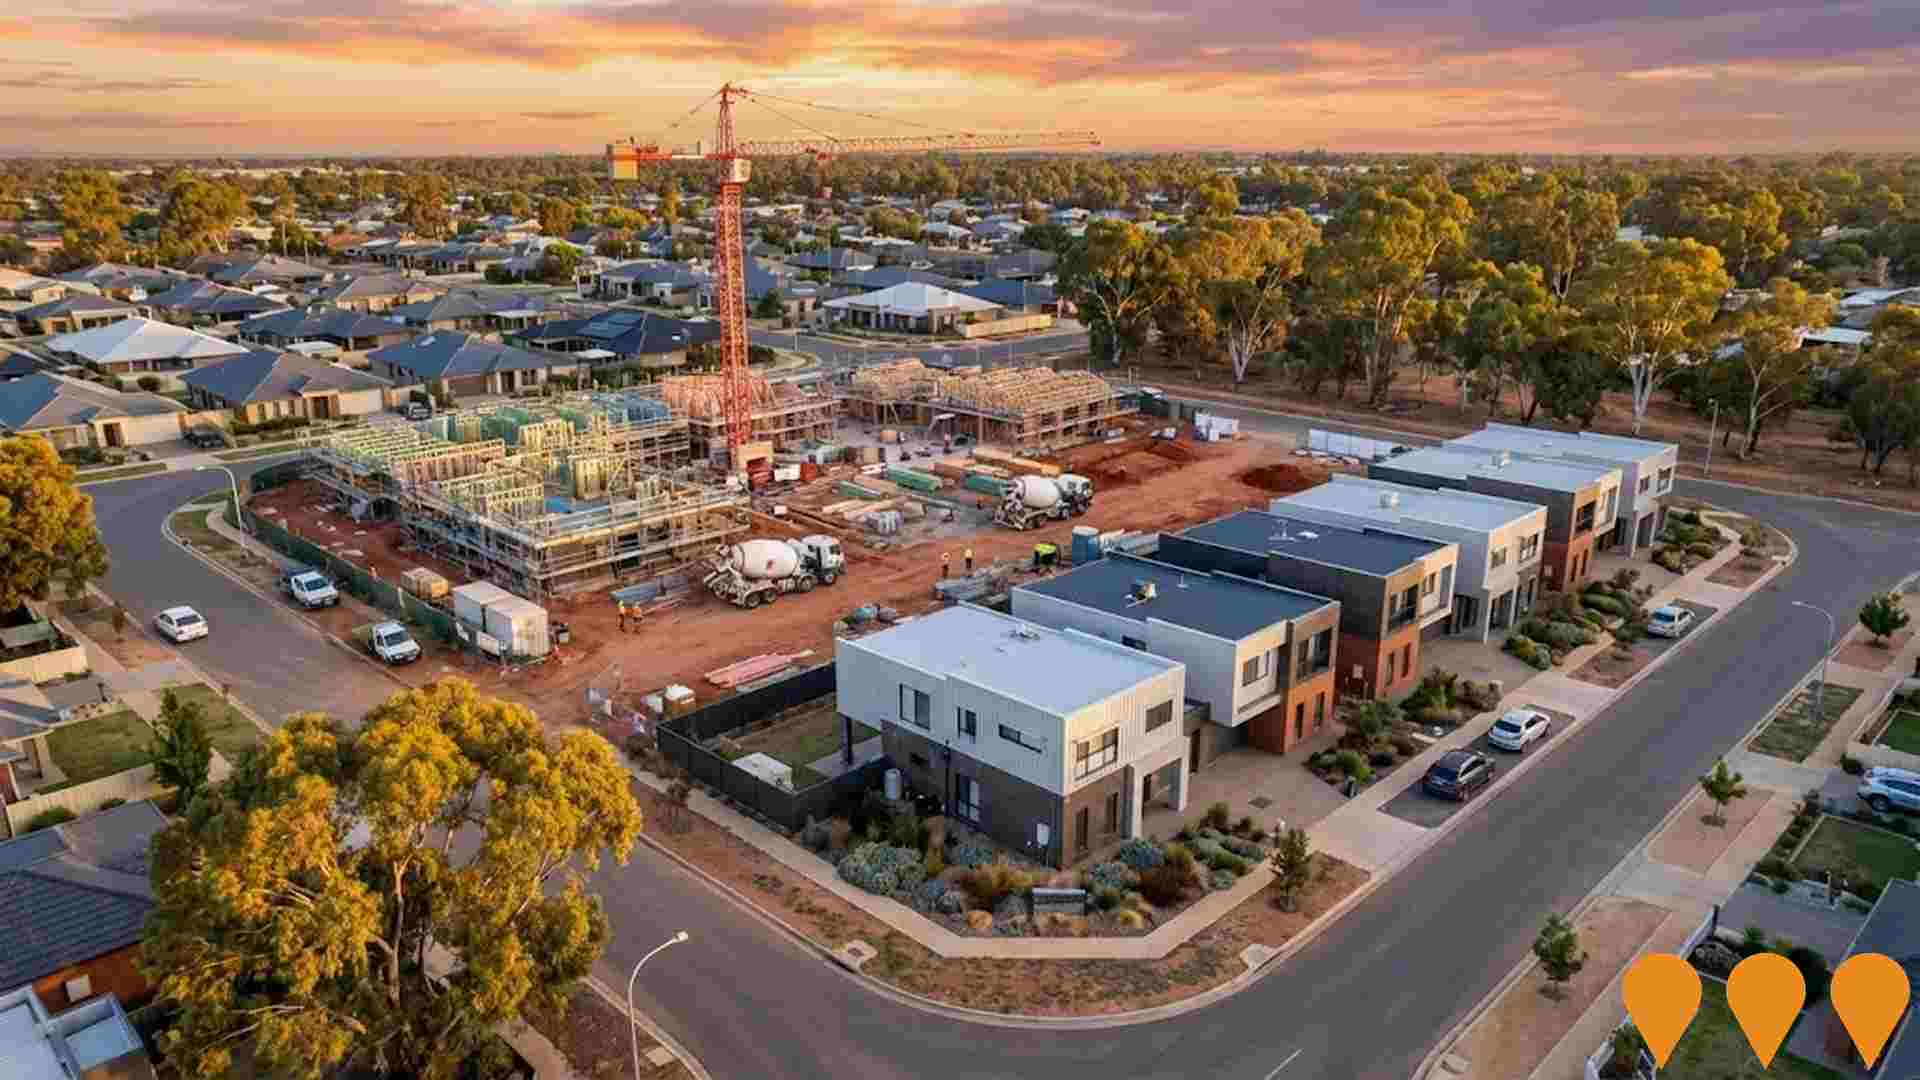
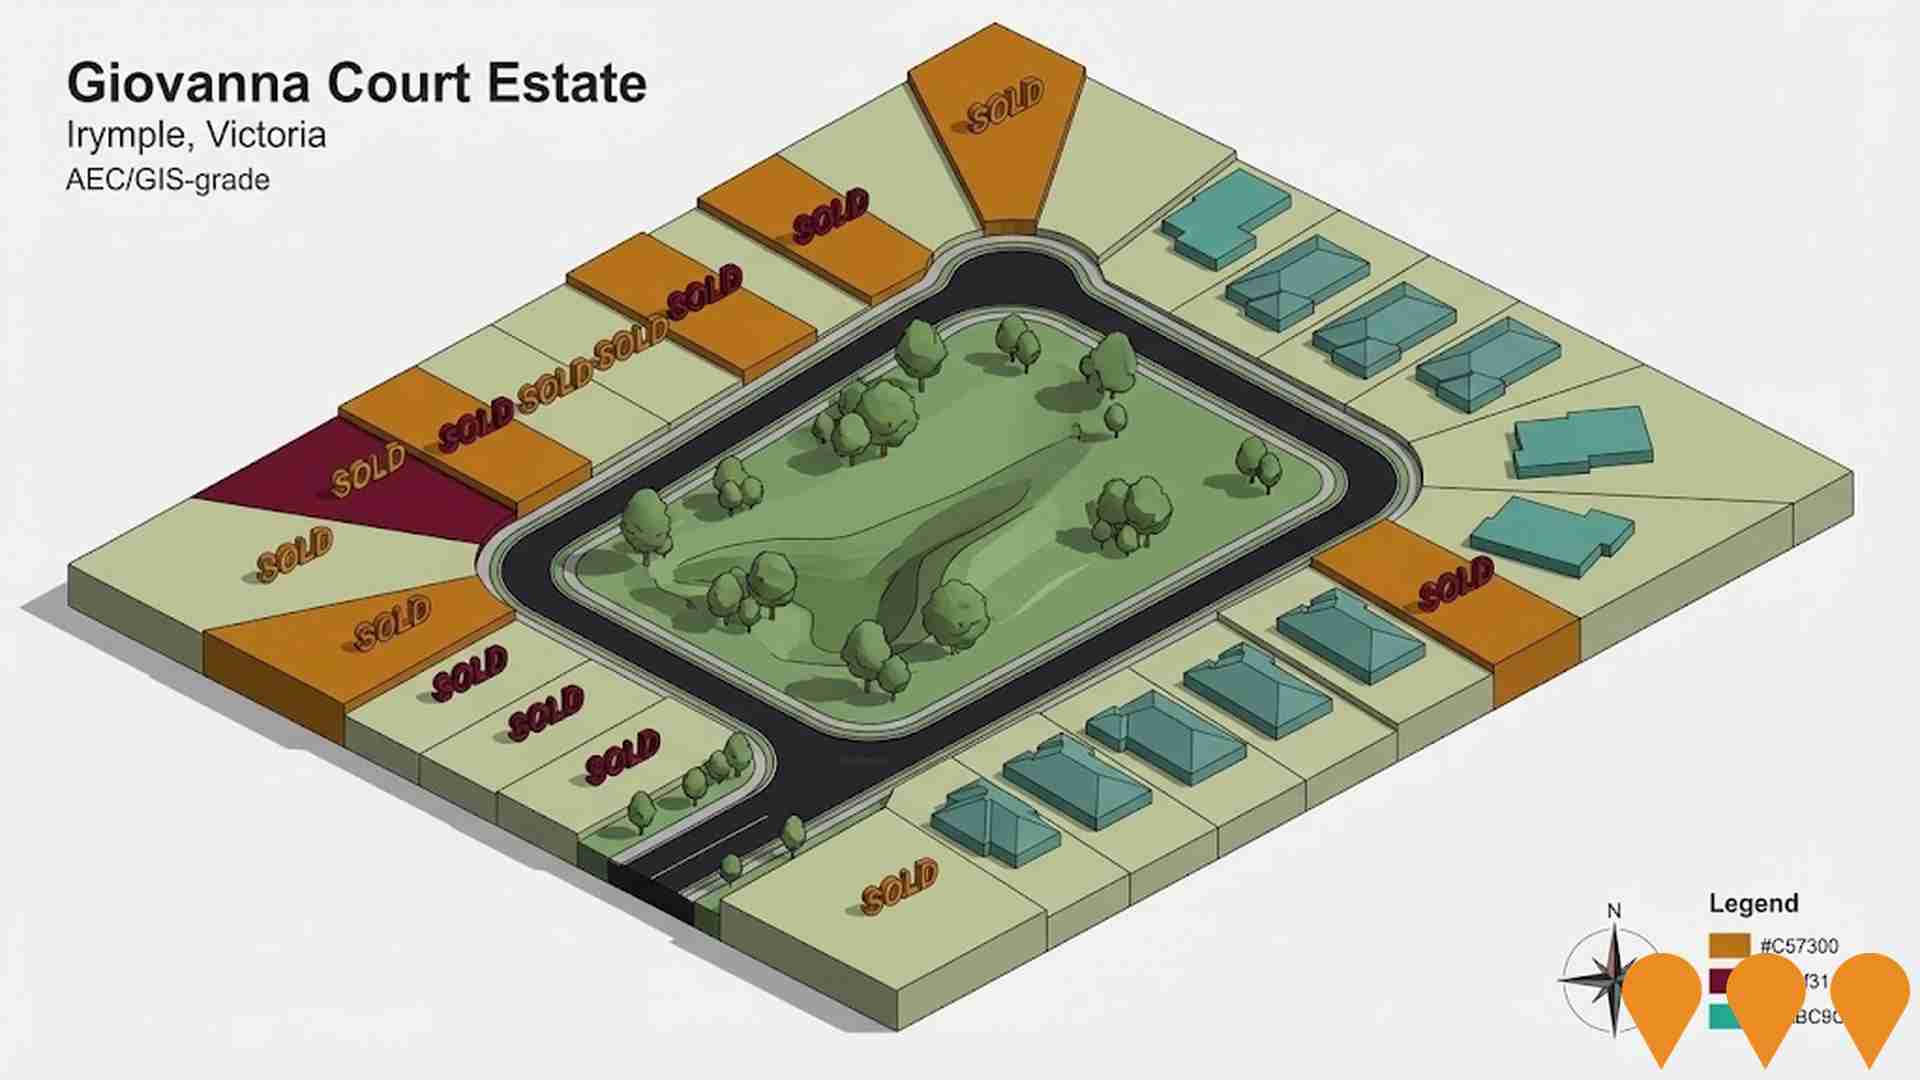
Sandilong Ridge Estate
Sandilong Ridge Estate is a residential land subdivision by Fisher Developments at Irymple, delivering 67 residential lots across approximately 7.5 hectares. The estate is being marketed with house and land packages and remains an active current project within the developer's portfolio.
Big Housing Build - Social Housing Projects
Part of Victoria's Big Housing Build program, delivering new social housing units in Mildura to provide secure, affordable accommodation for vulnerable community members and reduce housing waiting lists. Includes partnerships with MASP and CatholicCare Victoria to build modern, climate-appropriate homes.
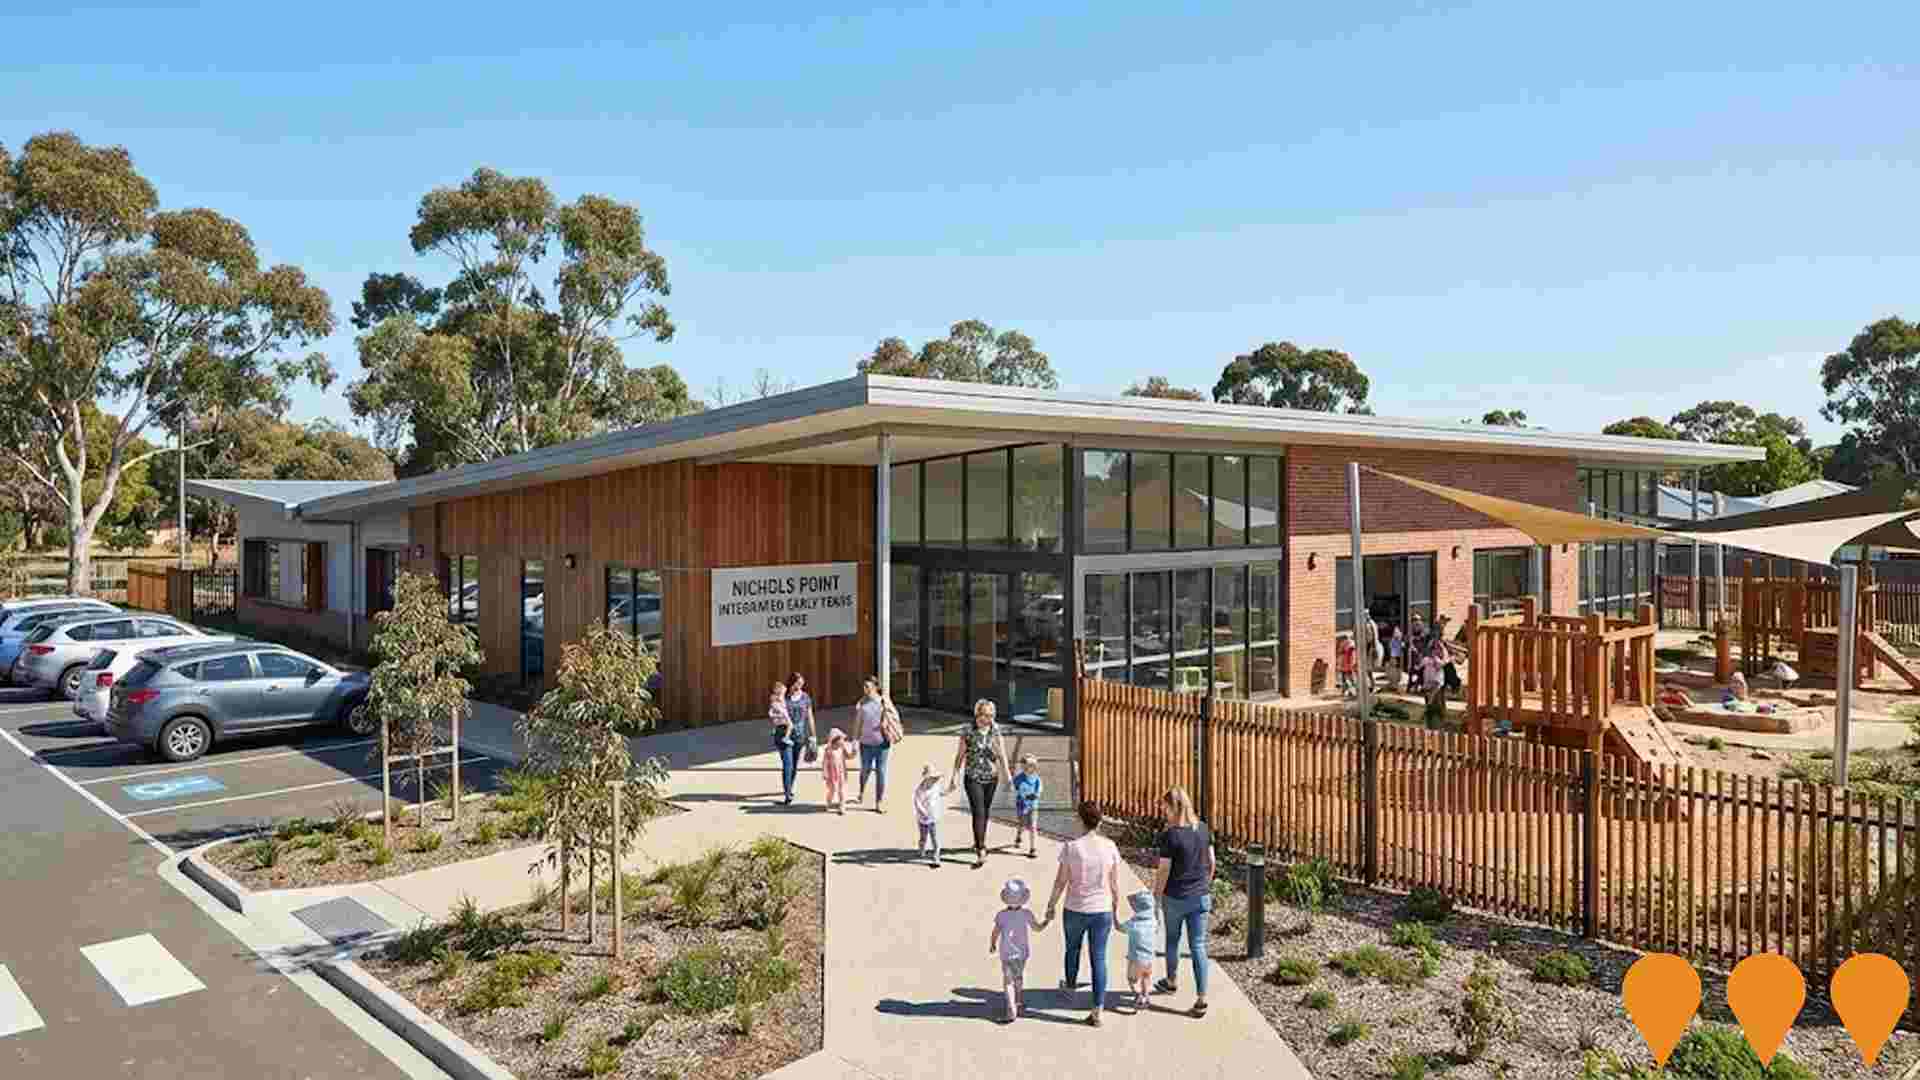
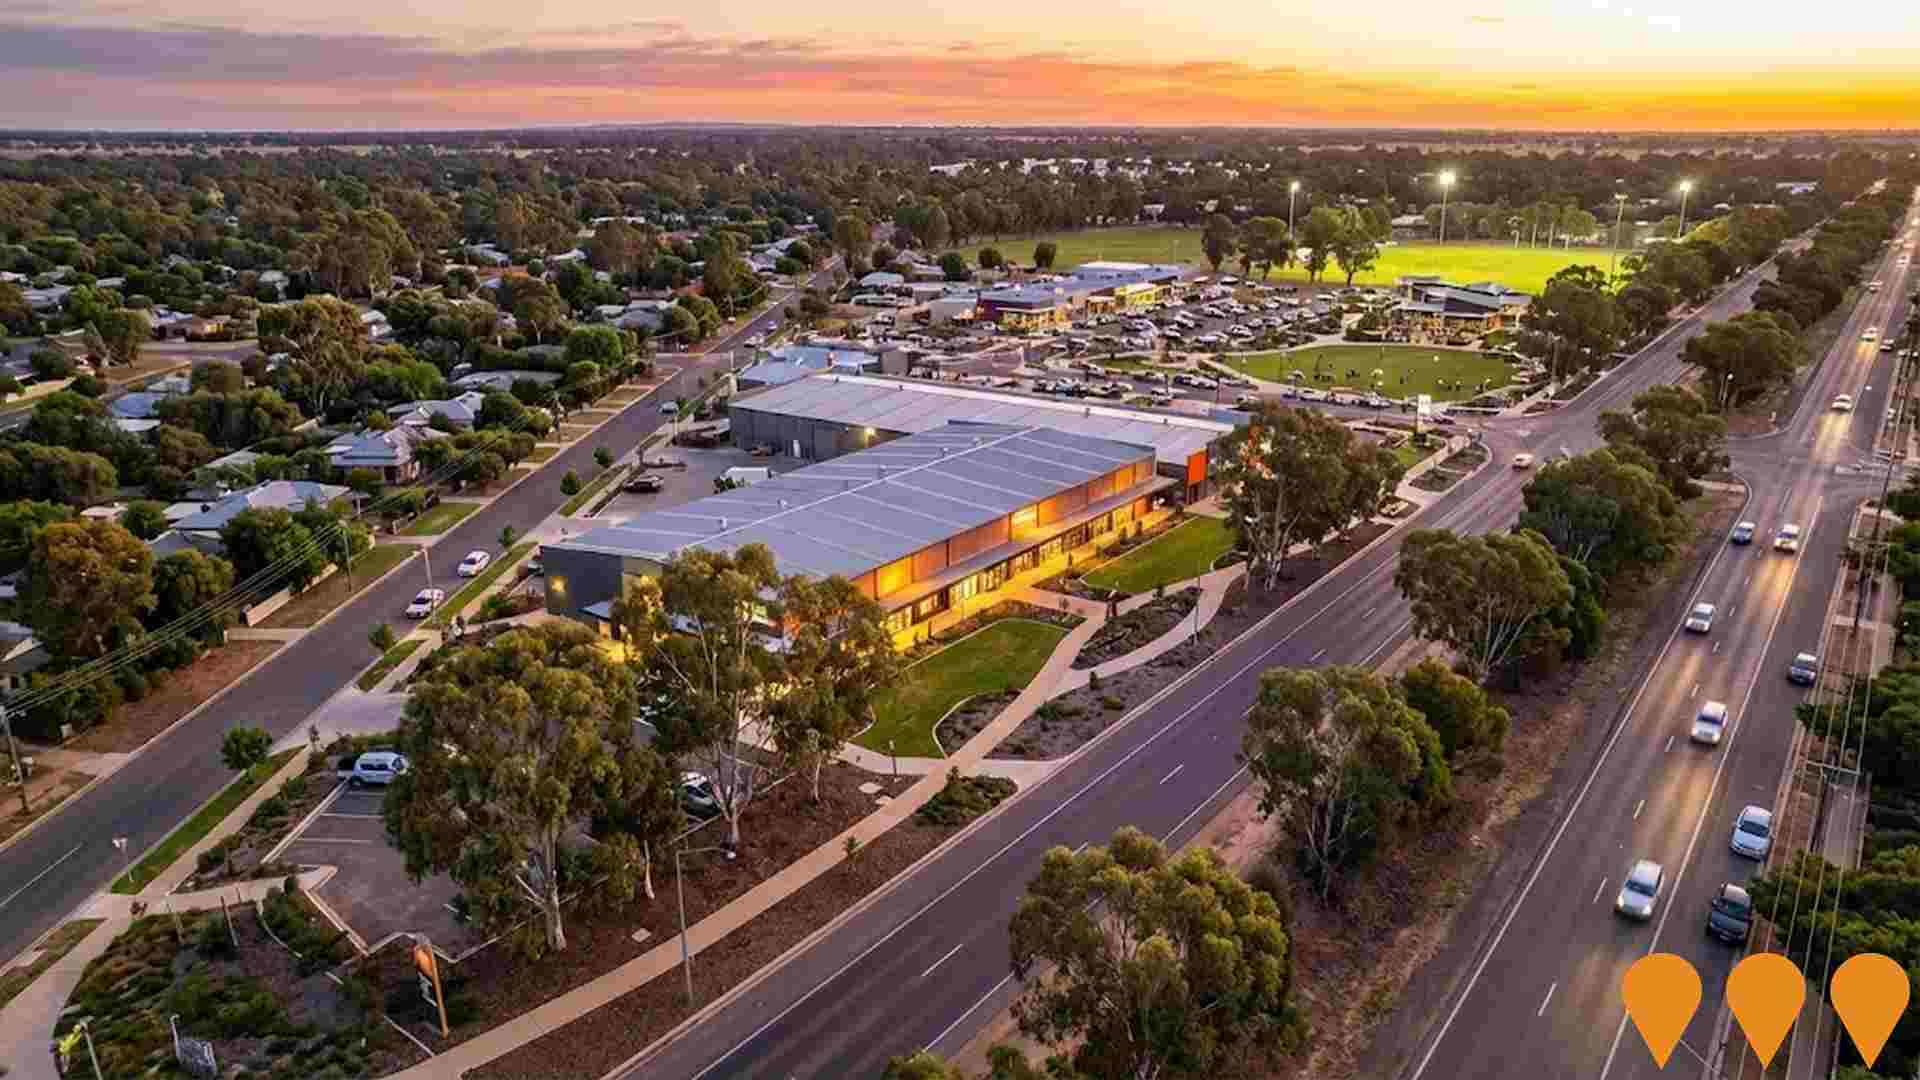
Nichols Point Early Years Hub
The Nichols Point Early Years Hub (formerly branded the Nichols Point Integrated Early Years Centre) is a purpose-built early childhood education and community facility being delivered by Mildura Rural City Council on the former Nichols Point Primary School site at the corner of Koorlong Avenue and Fifth Street. A new building adjacent to the retained heritage school building will house four kindergarten rooms with capacity for 132 kindergarten places, a parent lounge, a breastfeeding room, staff amenities and a consultation room.The existing old school building is being refurbished to provide two consultation rooms, a community meeting room and a community activity space, supporting maternal and child health, allied health and community programs. Associated works include a two-stage car park, stormwater and sewer connections for the adjacent Nichols Point Hall, landscaping to the kindergarten and public open space, and a new public toilet. The project is fully funded by an 8.95 million dollar grant from the Victorian Government Building Blocks Capacity Building Grant program and responds to kindergarten demand generated by the Best Start, Best Life reforms in one of Sunraysia's fastest growing residential areas. As at the April 2026 works update the project was reported on track at approximately 30 per cent complete, with roof sheeting 95 per cent installed, building wrap complete, services rough-in underway and stormwater drainage finished. Construction is being carried out by local contractor King Construction Group. Practical completion is scheduled for December 2026, with the kindergarten program to commence in 2027. A community working group is being formed through Council's Your Say platform to co-design the shared community spaces.
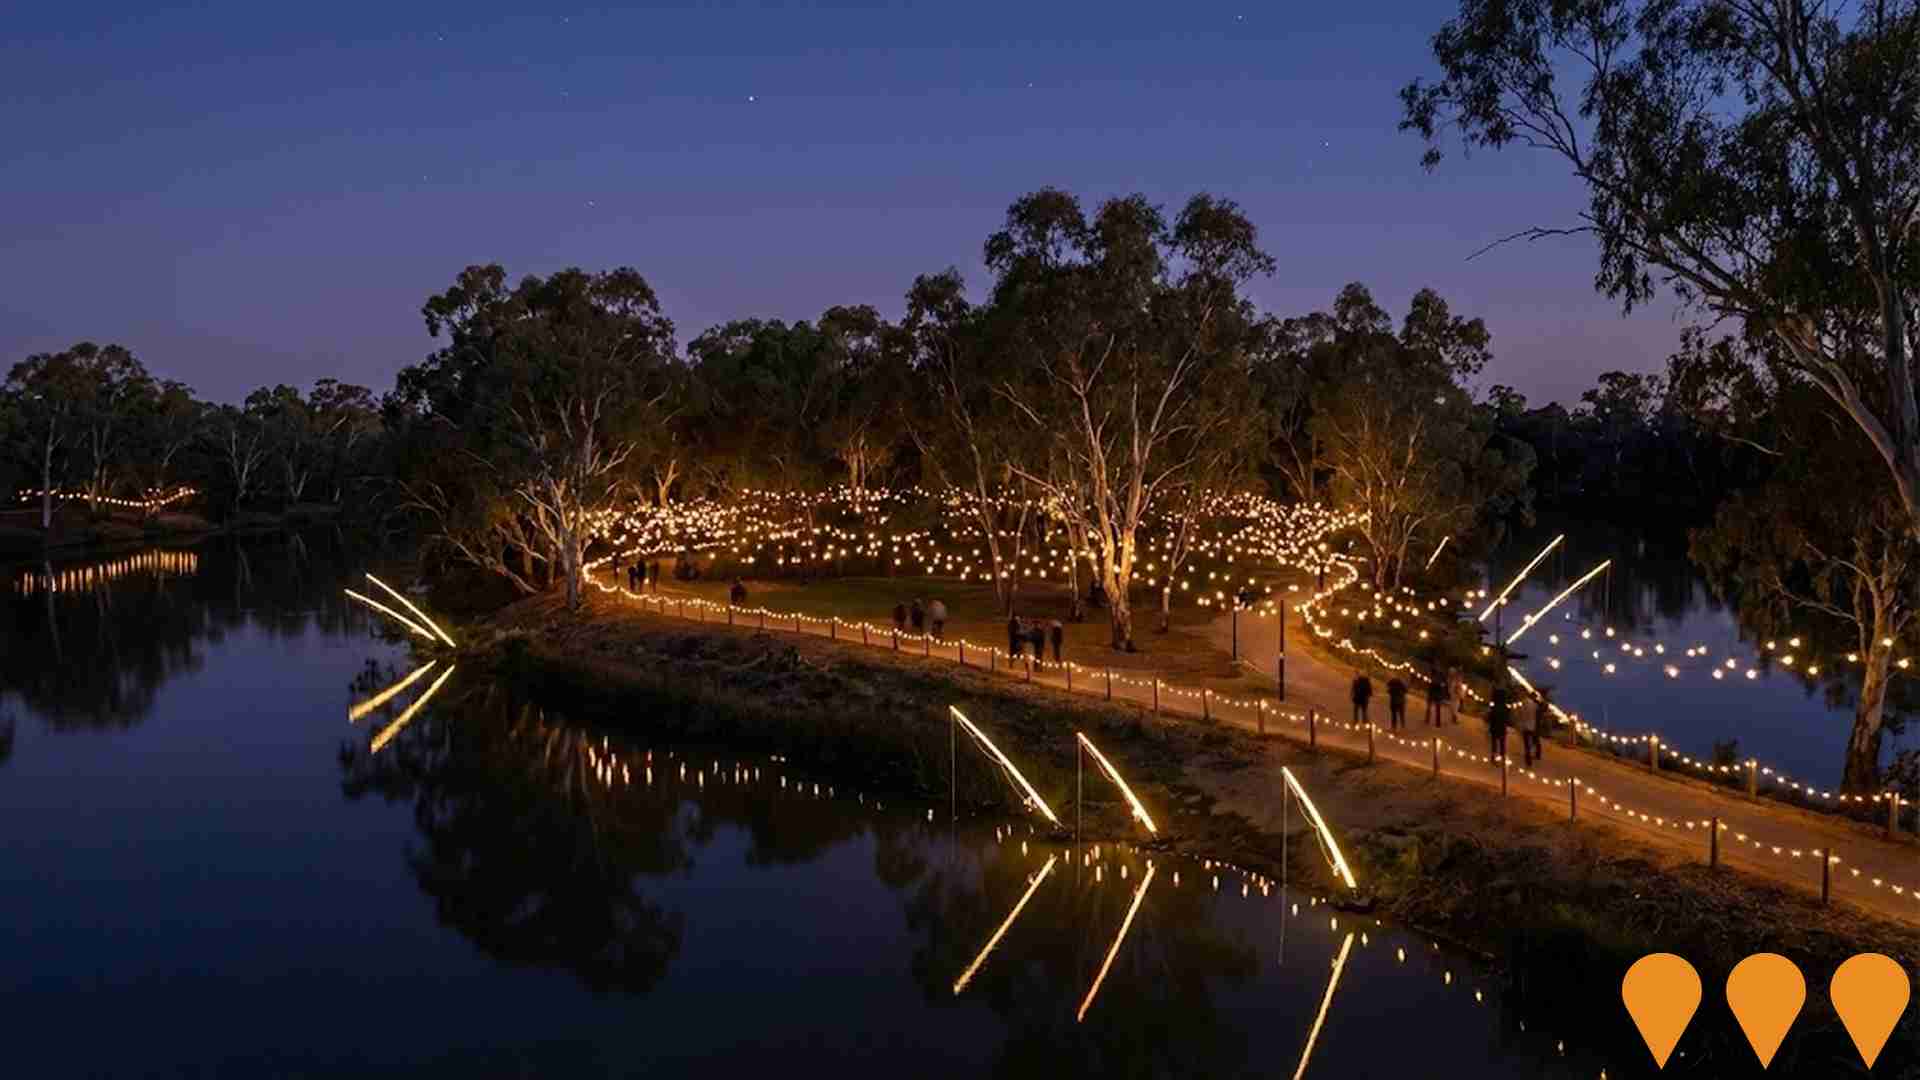
Trail of Lights
A collaborative art installation by internationally renowned artist Bruce Munro featuring 12,500 illuminated firefly lights and 22 Gone Fishing sculptures on Lock Island. This transcendent experience merges art with the natural environment of the Murray River, creating a space for contemplation and reflection. Operating Friday, Saturday and Sunday evenings, the installation attracts visitors to experience this otherworldly lightscape after sunset.
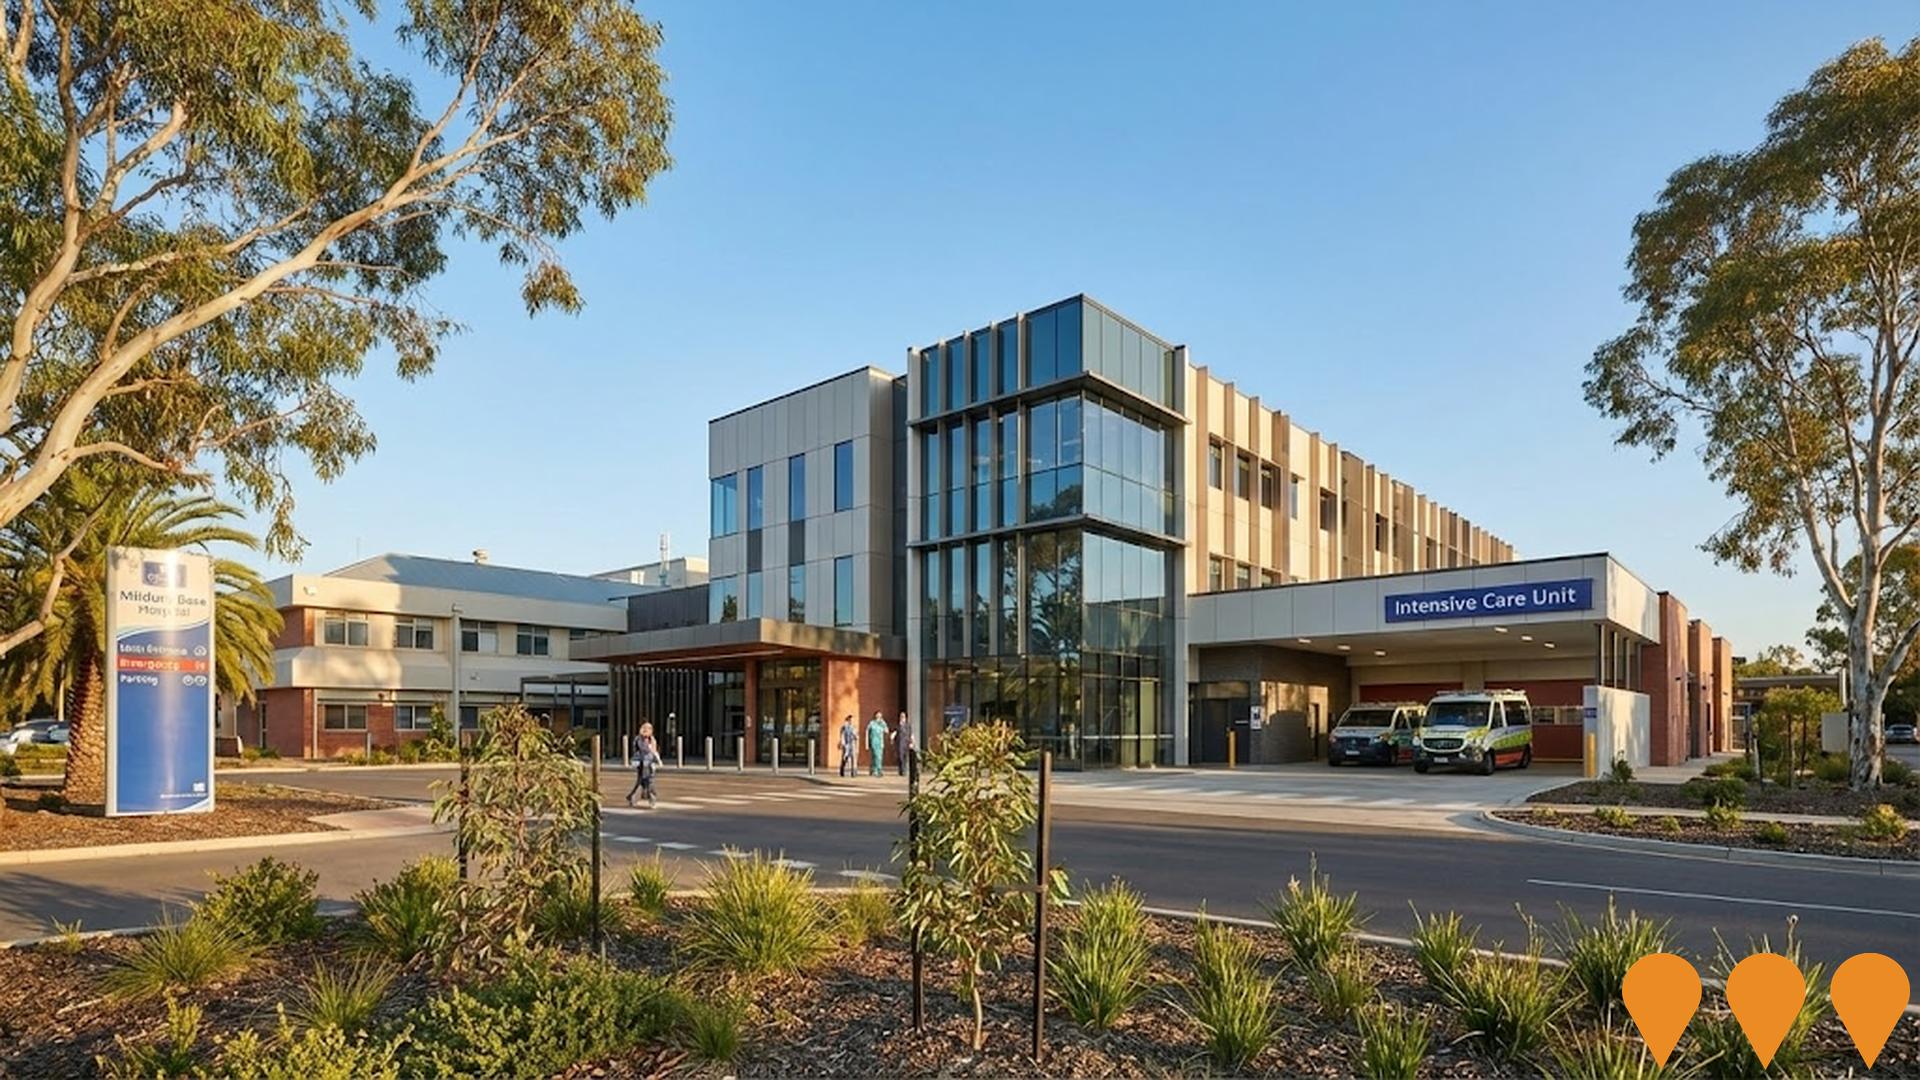
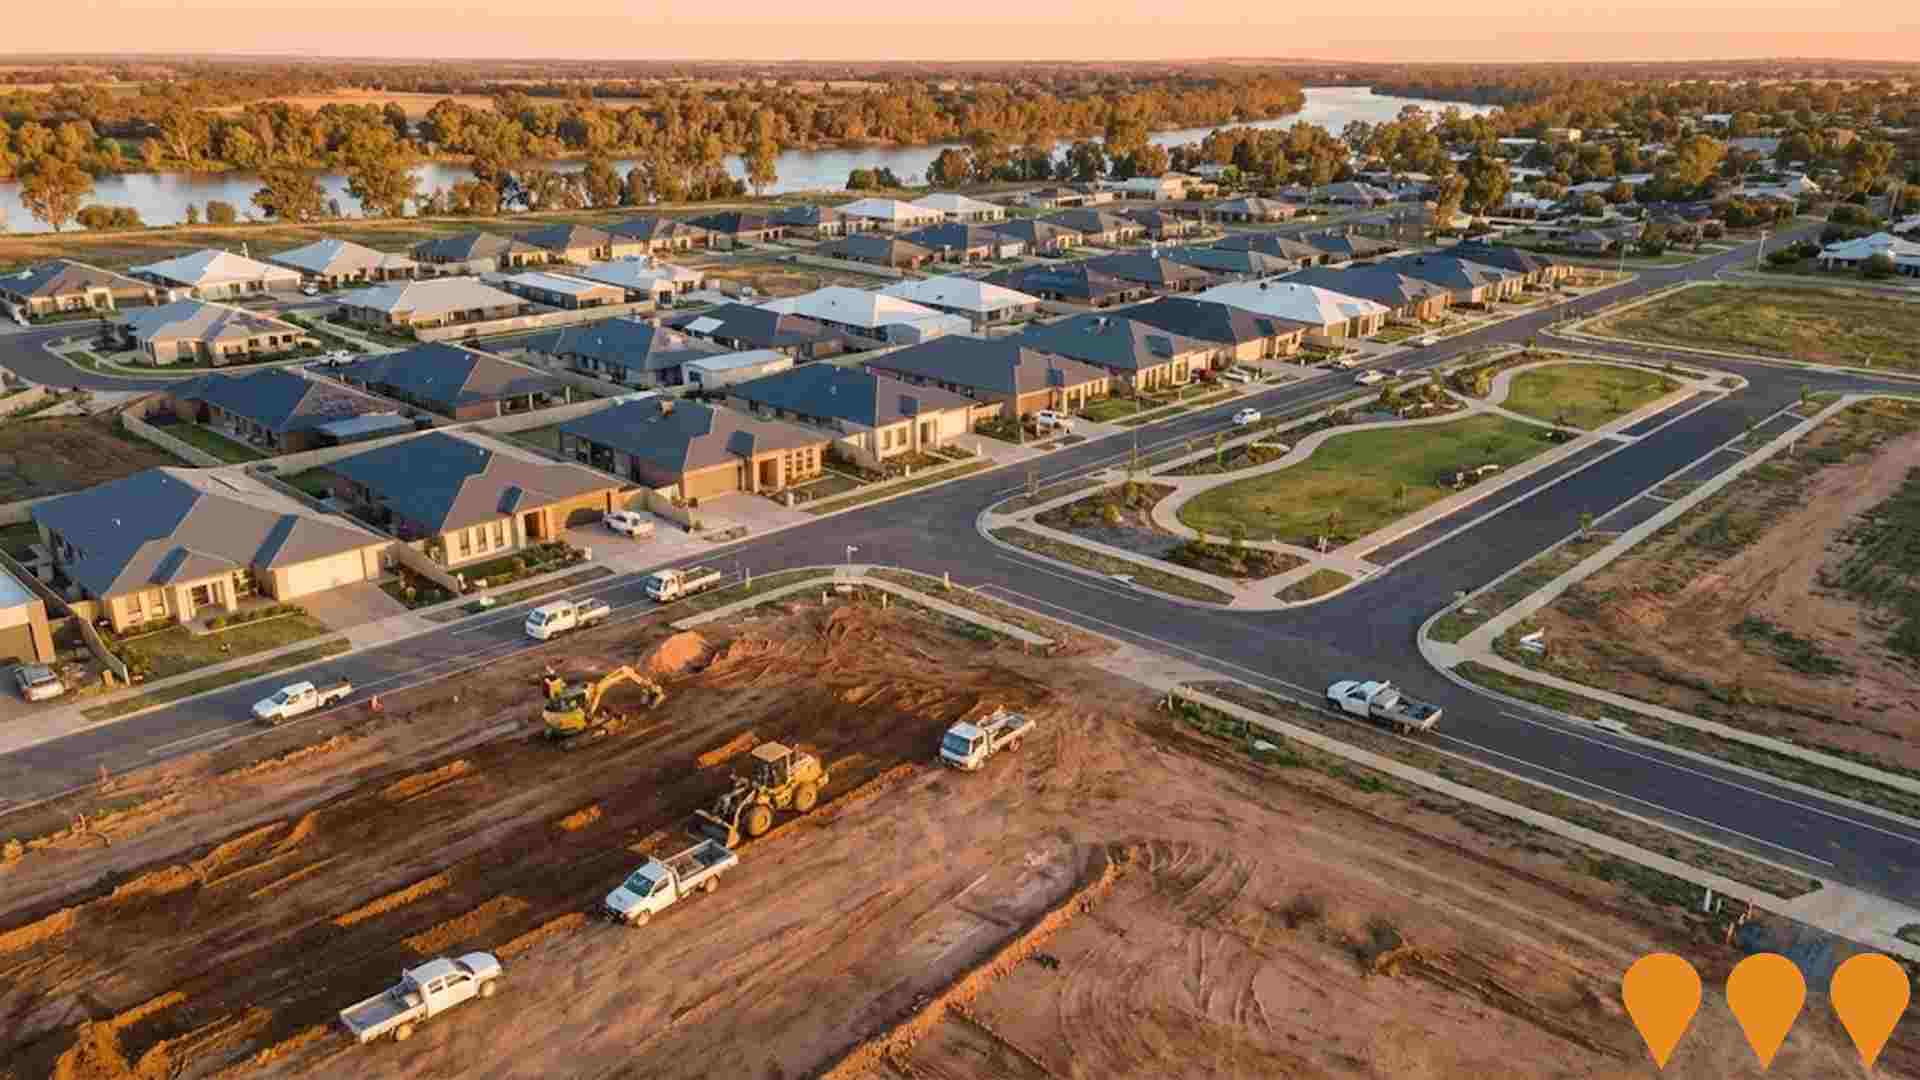
Limpidi Estate
A six-stage house and land estate in Mildura developed by Fisher Developments. Stage 6 is the final stage, with lots ranging from approximately 555m2 to 917m2 now on the market. Titles were expected imminently as of early 2025, with all services connected. The estate is located close to the 15th Street Shopping Precinct and other local amenities.

730 residents of Buronga are employed, from a labour force of 778. Unemployment sits at 6.2%, with participation at 67.7%. Weighted for its industry mix, the area's sectors are forecast to grow about 5.8% nationally over five years. That reflects industry composition only and makes no allowance for local population growth, so in an area growing as fast as this one it understates the likely rise in local jobs. The working-day population is estimated at 1,254, about 80% of the resident population, so more people leave the area for work than travel in. Unemployment and labour force come from ABS Small Area Labour Markets, updated quarterly; the industry and occupation profile is from the 2021 Census.
Detail
Buronga has a skilled workforce with diverse sector representation and an unemployment rate of 6.2%, according to AreaSearch's aggregation of statistical area data. As of December 2025730 residents are employed, with an unemployment rate of 8.1% (2.2% above Regional NSW's rate of 3.9%). Workforce participation in Buronga is high at 67.7%, compared to Regional NSW's 61.3%. Census responses show that only 7.9% of residents work from home, although Covid-19 lockdown impacts should be considered. The key industries for employment among residents are retail trade, health care & social assistance, and education & training.
Buronga has a particular employment specialization in wholesale trade, with an employment share 3.5 times the regional level. However, health care & social assistance is under-represented, with only 11.9% of Buronga's workforce compared to 16.9% in Regional NSW. The area appears to offer limited local employment opportunities, as indicated by the count of Census working population versus resident population. Over the 12 months to December 2025, labour force levels decreased by 1.8%, and employment decreased by 2.9%, causing the unemployment rate to rise by 1.2 percentage points. In contrast, Regional NSW experienced an employment decline of 1.2% and a labour force decline of 0.8%, with a 0.4 percentage point rise in unemployment. Jobs and Skills Australia's national employment forecasts from May-25 offer further insight into potential future demand within Buronga. These projections estimate that national employment will expand by 6.6% over five years and 13.7% over ten years, but growth rates differ significantly between industry sectors. Applying these industry-specific projections to Buronga's employment mix suggests local employment should increase by 5.8% over five years and 12.3% over ten years (note that this is a simple weighting extrapolation for illustrative purposes and does not take into account localised population projections).
Frequently Asked Questions - Employment
Median household income in Buronga is $1,381 a week (about $72,000 a year), with median personal income at $772 a week. ATO records put median taxable income at $50,194 a year against an average of $61,492. Household income is from the 2021 Census; taxable income is from ATO Taxation Statistics for the latest financial year available, indexed forward using the ABS Wage Price Index.
Detail
According to AreaSearch's aggregation of latest postcode level ATO data released in financial year 2023, Buronga had a median income among taxpayers of $50,194 and an average income of $61,492. These figures are lower than the national averages of $52,390 and $65,215 for Regional NSW respectively. Based on Wage Price Index growth of 8.86% since financial year 2023, current estimates project median income to be approximately $54,641 and average income to be around $66,940 by September 2025. Census 2021 data indicates personal income ranks at the 43rd percentile with a weekly earning of $772, while household income sits at the 27th percentile.
Income analysis reveals that the largest segment comprises 30.3% of residents earning between $1,500 and $2,999 weekly (473 residents), which is consistent with the regional pattern where this cohort also represents 29.9%. Housing costs are manageable with 87.4% retained, but disposable income ranks below average at the 31st percentile.
Frequently Asked Questions - Income
Buronga had 436 occupied dwellings at the 2021 Census, 87% detached houses and 2% apartments. 42% are owned with a mortgage, 24% rented and 34% owned outright. At that Census the median rent was $203 a week and the median mortgage repayment $1,300 a month. Rent absorbs 14.7% of household income here and mortgage repayments 21.7%. Dwelling stock, tenure and housing costs are 2021 Census measures — the only source that counts dwellings at this boundary size.
Detail
Buronga's dwelling structures, as per the latest Census, consisted of 87.4% houses and 12.7% other dwellings. In Regional NSW, this was 82.6% houses and 17.4% other dwellings. Home ownership in Buronga stood at 34.1%, with mortgaged dwellings at 41.8% and rented ones at 24.0%. The median monthly mortgage repayment was $1,300, below Regional NSW's average of $1,733. Median weekly rent in Buronga was $203, compared to Regional NSW's $330. Nationally, Buronga's mortgage repayments were lower at $1,300 versus the Australian average of $1,863, and rents were substantially below the national figure of $375.
Frequently Asked Questions - Housing
Buronga counted 436 households at the 2021 Census, an estimated 544 today, averaging 2.6 people each. 30% are couples with children, against 30% couples without children. 25% of households are people living alone, and families average 1.9 children. Household and family composition is measured only by the Census, so these are 2021 figures.
Detail
Family households account for 73.9% of all households, including 29.9% couples with children, 29.7% couples without children, and 13.4% single parent families. Non-family households make up the remaining 26.1%, with lone person households at 24.7% and group households comprising 1.6%. The median household size is 2.6 people, larger than the Regional NSW average of 2.4.
Frequently Asked Questions - Households
17.1% of adults in Buronga hold a university qualification, including 13.2% with a bachelor degree and 2.1% with postgraduate qualifications, lower than 76% of areas nationally. A further 29.3% hold a vocational qualification. 1 school serves the area, with 72 enrolment places and an average ICSEA of 873 against a national benchmark of 1,000. Qualifications come from the 2021 Census; school enrolments, ICSEA and results come from ACARA's current release.
Detail
The area's university qualification rate is 17.1%, significantly lower than the NSW average of 32.2%. Bachelor degrees are most common among residents with higher education qualifications at 13.2%, followed by postgraduate qualifications (2.1%) and graduate diplomas (1.8%). Vocational credentials are prevalent, with 41.9% of residents aged 15+ holding them, including advanced diplomas (12.6%) and certificates (29.3%). Educational participation is high, with 33.1% of residents currently enrolled in formal education. This includes primary education (13.0%), secondary education (9.8%), and tertiary education (2.5%).
Frequently Asked Questions - Education
Schools Detail
Public transport in Buronga reaches 12 stops on 12 routes, timetabled for about 120 services a week. The typical home sits about 410 m from its nearest stop. Households keep an average of 1.6 vehicles. Stop and service counts are built from operators' published GTFS timetables and refresh with each timetable release; vehicle ownership is from the 2021 Census.
Detail
Buronga has 12 operational public transport stops, all of which are bus stops. These stops are served by 12 different routes that together facilitate 117 weekly passenger trips. The accessibility of these transport options is moderate, with residents on average located 411 meters from the nearest stop. As a predominantly residential area, most commuting in Buronga is outward-bound, with cars being the primary mode of transportation at 94%. On average, there are 1.6 vehicles per dwelling. According to the 2021 Census, only 7.9% of residents work from home, which may be influenced by COVID-19 conditions.
The service frequency averages 16 trips per day across all routes, resulting in approximately 9 weekly trips per individual stop.
Frequently Asked Questions - Transport
Transport Stops Detail
67.2% of residents in Buronga report no long-term health condition. 4.5% need daily assistance with core activities, and 51.3% hold private health cover. The standardised death rate runs at 5.1 per 1,000 residents. Health conditions, assistance needs and insurance are 2021 Census measures; the death rate comes from current ABS releases.
Detail
Health data for Buronga shows positive outcomes overall. Mortality rates and health conditions align with national benchmarks. Common health issues affect both young and old age groups similarly. Private health cover is relatively low at 51% (~800 people). The most common medical conditions are asthma (10.6%) and mental health issues (9%). 67.2% of residents report no medical ailments, compared to 63.3% in Regional NSW. Working-age population health outcomes are typical. Buronga has 16.0% seniors (249 people), lower than Regional NSW's 23.4%. Senior health outcomes rank higher than the general population nationally.
Frequently Asked Questions - Health
Buronga is largely Australian-born, at 89.2% of residents, with 8.4% speaking a language other than English at home. The largest reported ancestries are Australian (30.9%) and English (28.3%). 5.8% of residents identify as Aboriginal and/or Torres Strait Islander. Ancestry, language and country of birth are counted only by the Census, so these are 2021 figures.
Detail
Buronga's cultural diversity was found to be below average, with 85.2% of its population being citizens born in Australia speaking English only at home as their first language. The majority religion in Buronga is Christianity, which accounts for 51.4% of the population compared to 55.9% across Regional NSW. The top three ancestry groups are Australian (30.9%), English (28.3%), and Scottish (8.1%). Notably, Hungarian (0.4%) and Australian Aboriginal (5.8%) populations in Buronga exceed their regional counterparts of 0.2% and 4.6%, respectively, while Croatian representation is also higher at 0.9%.
Frequently Asked Questions - Diversity
The median resident of Buronga is 38. 24.6% of residents are aged 15 to 34. Age cohorts are not raw Census counts: the Census split is re-based to the latest ABS population estimates and state projections.
Detail
Buronga's median age is 38, which is lower than Regional NSW's figure of 43 but matches the national norm of 38. The 5-14 age group makes up 15.3% of Buronga's population compared to Regional NSW. The 65-74 cohort constitutes 8.3%. Post-2021 Census, the 75-84 age group increased from 5.2% to 6.9%, and the 35-44 cohort rose from 13.4% to 14.5%. Conversely, the 45-54 cohort decreased from 13.1% to 11.9%. By 2041, Buronga's age profile is projected to change significantly. The 85+ group will grow by 68%, reaching 21 from 12.
Those aged 65 and above are expected to account for 85% of the population growth. Meanwhile, the 25-34 and 45-54 cohorts are projected to experience population declines.
Frequently Asked Questions - Age
Data & MethodBoundaries, Sources & Method for Buronga
9 of 14 data sections on this page were updated within the last 12 months — the newest current to Sep 2026.
Everything is aggregated to the Suburb (SAL) boundary shown above, on a 2021 Census baseline. Only 3 sections — housing, households and cultural diversity — still wait on the 2026 Census.
The ledger — source, cycle and currency by section
| Section | Source & update cycle | Currency |
|---|---|---|
| Updated within the last 12 months 9 sections | ||
| Population | ABS, GNAF, Geoscience Australia Annual (ABS ERP) | Aug 2026 last month headline measures · 2021 Census baseline |
| Re-based to the ABS Estimated Resident Population (June 2024 release) and updated with new dwellings from GNAF address data. Current to Aug 2026, with the 2021 Census supplying the small-area baseline. | ||
| Age profile | ABS, Geoscience Australia, State governments Annual | Aug 2026 last month headline measures · 2021 Census baseline |
| Age cohorts are re-based to the latest ABS population estimates and state projections, current to Aug 2026. Each cohort is held as a Census baseline and a current estimate. | ||
| Development & approvals | ABS, GNAF Monthly (ABS approvals) | Aug 2026 last month headline measures · Jul 2026 baseline |
| Property sales & rents | Valuer General, Rental Board, ABS Weekly sales, quarterly rents | Sep 2026 this month all 21 measures |
| Sales from the state Valuer General register, refreshed weekly, and rents from quarterly rental bond lodgements. Both are read live each time this page loads, current to Sep 2026. | ||
| Infrastructure projects | Infrastructure Australia, Local governments Daily | May 2026 4 months ago all 2 projects tracked here |
| Project pipeline maintained continuously from Infrastructure Australia, state agencies, local government and public announcements. Records are added and revised daily; this area was last updated May 2026. | ||
| Employment | ABS, DEWR, JSA Quarterly (ABS SALM) | Mar 2026 6 months ago headline measures · 2021 Census baseline |
| Unemployment and labour force from ABS Small Area Labour Markets, current to Mar 2026. The growth outlook applies Department of Employment (now Jobs and Skills Australia) forecasts for all 19 industry divisions to the local industry mix, so it measures sector composition rather than local expansion and makes no allowance for population growth. Job demand comes from the same agency via its Internet Vacancy Index; industry and occupation structure from the 2021 Census. | ||
| Education | ABS, ACARA Annual (ACARA) | Aug 2026 last month headline measures · 2021 Census baseline |
| Transport | ABS, State Transport Departments Each timetable release | Jul 2026 2 months ago headline measures · 2021 Census baseline |
| Services & amenities | Provider directories, ACECQA Continuous | Jul 2026 2 months ago all 14 measures |
| Annual and financial-year sources 2 sections | ||
| Income | ABS, ATO Annual (ATO) | FY 2023 3 years ago headline measures · 2021 Census baseline |
| ATO taxable income statistics for FY 2023, indexed forward using the Wage Price Index. Census household income provides the distribution detail. | ||
| Health | ABS, ATO Annual | 2024 2 years ago headline measures · 2021 Census baseline |
| Census-measured — next update: 2026 Census 3 sections No more current small-area source exists for these, so they are labelled as Census-measured rather than implied to be current. | ||
| Housing | ABS 5-yearly (Census) | 2021 Census next update 2026 all 30 measures |
| Households | ABS 5-yearly (Census) | 2021 Census next update 2026 all 18 measures |
| Cultural diversity | ABS, Geoscience Australia 5-yearly (Census) | 2021 Census next update 2026 all 44 measures |
"Currency" is the most recent release feeding that section. Where the Census supplies the structural baseline underneath a current headline figure, the row says so.
How the numbers are built
Population
The Census provides the small-area baseline, aggregated from mesh blocks to this boundary. It is then re-based to the ABS Estimated Resident Population (June 2024 release), and new dwellings built since Census night are counted from address data — 41 validated new addresses here. The headline figure is therefore a current estimate for Feb 2026, not a 2021 count (1,252 at the 2021 Census → 1,562 now). Annual growth rates are compound (CAGR), not simple averages.
Age profile
Cohort shares are not raw Census counts. Every cohort is held as a pair — the Census baseline and a current estimate — and the split is re-based using ERP and state population projections, current to Feb 2026. Median age is the Census median plus modelled change since. Charts that show both are labelled "2021 Census vs Current Estimate".
Property sales
Sourced from the state valuation authority's sales register — current, not Census, and refreshed weekly. Medians are calculated from settled transactions in the period shown; periods with very low transaction counts are flagged or suppressed, because a handful of sales can move a median substantially.
Rents
Derived from state rental bond lodgement data, by dwelling type and bedroom count. Bonds are lodged at the start of a new tenancy, so this reflects new lettings, not the whole rented stock.
Development & infrastructure
Building approvals come from current ABS releases; development applications are collected from council and state planning portals; the infrastructure pipeline is compiled from Infrastructure Australia and local government sources. Applications are matched to this boundary by address or coordinates, so very recent lodgements may not yet appear.
Employment & income
Industry and occupation structure comes from the Census, but the headline labour-market indicators do not. Unemployment and labour force are derived from ABS Small Area Labour Markets (quarterly). The employment outlook applies Department of Employment forecasts for all 19 industry divisions to this area's own industry mix (the agency is now Jobs and Skills Australia), as does the Internet Vacancy Index used for job demand. Because it is weighted on industry composition alone, that outlook carries no allowance for local population growth — in fast-growing areas the real rise in local jobs will typically be higher. Income combines Census household income with ATO taxable-income statistics for FY 2023, indexed forward using the Wage Price Index.
Education, transport & amenities
School enrolments, ICSEA and performance come from ACARA's current release, not the Census. Public transport stops and service frequency are derived from GTFS timetable feeds published by state transport departments. Services and amenities are proximity and count scores built from provider directories, refreshed on their own cycle. The Census contributes only the travel-to-work and qualification measures.
Rankings and benchmarks. Where we rank this area, the comparison set is every area of the same boundary type — suburbs against suburbs, SA2s against SA2s. Benchmarks compare this area against its greater capital city region and the national figure for the same measure and period.
Limits worth knowing. Small areas carry larger error margins, and the ABS introduces small random adjustments to Census counts to protect confidentiality — so totals may not sum exactly. Estimates re-based from regional data describe the area's expected trajectory, not a direct count of it. Figures are indicative for research and are not financial, planning or valuation advice.
Cross-check us. The Census baseline for this boundary is at ABS 2021 Census QuickStats (SAL10693). QuickStats reports 2021 only — the figures on this page are more current wherever the ledger shows a later date.