Chart Color Schemes
This analysis uses ABS Statistical Areas Level 2 (SA2) boundaries, which can materially differ from Suburbs and Localities (SAL) even when sharing similar names.
SA2 boundaries are defined by the Australian Bureau of Statistics and are designed to represent communities for statistical reporting (e.g., census and ERP).
Suburbs and Localities (SAL) represent commonly-used suburb/locality names (postal-style areas) and may use different geographic boundaries. For comprehensive analysis, consider reviewing both boundary types if available.
est. as @ -- *
ABS ERP | -- people | --
2021 Census | -- people
Sales Activity
Curious about local property values? Filter the chart to assess the volume and appreciation (including resales) trends and regional comparisons, or scroll to the map below view this information at an individual property level.
Find a Recent Sale
Sales Detail
Population
Mildura Surrounds is positioned among the lower quartile of areas assessed nationally for population growth based on AreaSearch's assessment of recent, and medium term trends
Mildura Surrounds' population was approximately 3,817 as of November 2025. Between the 2021 Census and this date, the population increased by 91 people to reach a growth rate of 2.4%. This increase is inferred from ABS data showing an estimated resident population of 3,801 in June 2024 and validated new addresses since the Census date. The population density was around 0.20 persons per square kilometer at this time. Mildura Surrounds' growth rate exceeded that of its SA4 region (1%), indicating it as a growth leader. Overseas migration primarily drove this growth.
AreaSearch uses ABS/Geoscience Australia projections for each SA2 area, released in 2024 with a base year of 2022. For areas not covered by this data, AreaSearch employs VIC State Government's Regional/LGA projections from 2023, adjusted using weighted aggregation methods to SA2 levels. Growth rates by age group are applied across all areas for years 2032 to 2041. Future projections anticipate above median growth for national non-metropolitan areas, with Mildura Surrounds expected to gain 615 persons by 2041, reflecting a total increase of 15.7% over the 17-year period based on latest annual ERP population numbers.
Frequently Asked Questions - Population
Development
AreaSearch assessment of residential development drivers sees a low level of activity in Mildura Surrounds, placing the area among the bottom 25% of areas assessed nationally
Mildura Surrounds averaged approximately six new dwelling approvals annually over the past five financial years, from FY21 to FY25, totalling 31 homes. In FY26 so far, two dwellings have been approved. Each dwelling has attracted an average of 2.4 new residents per year during this period, indicating strong demand that may support property values.
The average construction cost value for these new homes is $411,000, suggesting developers are focusing on the premium market with high-end developments. This financial year has seen $88.9 million in commercial approvals, reflecting robust local commercial activity. Compared to the Rest of Vic., Mildura Surrounds shows significantly reduced construction levels, at 68.0% below the regional average per person. This constrained new construction typically reinforces demand and pricing for existing homes. Similarly, national comparisons reflect market maturity and possible development constraints.
All new constructions have been standalone homes, maintaining the area's traditional low-density character with a focus on family homes appealing to those seeking space. The current estimated population count is 1420 people per dwelling approval, reflecting its quiet, low-activity development environment. According to AreaSearch quarterly estimates, Mildura Surrounds is projected to gain 599 residents by 2041. At current development rates, housing supply may struggle to keep pace with population growth, potentially intensifying buyer competition and supporting price increases.
Frequently Asked Questions - Development
Infrastructure
Mildura Surrounds has moderate levels of nearby infrastructure activity, ranking in the top 50% nationally
Changes to local infrastructure significantly influence an area's performance. AreaSearch has identified 41 projects likely impacting the region. Notable initiatives include Victorian Murray Floodplain Restoration Project, Nowingi Solar Power Station, Red Cliffs Solar Farm, and Sunraysia Water Efficiency Project. The following list details those projects expected to be most relevant.
Professional plan users can use the search below to filter and access additional projects.
INFRASTRUCTURE SEARCH
 Denotes AI-based impression for illustrative purposes only, not to be taken as definitive under any circumstances. Please follow links and conduct other investigations from the project's source for actual imagery. Developers and project owners wishing us to use original imagery please Contact Us and we will do so.
Frequently Asked Questions - Infrastructure
Victorian Murray Floodplain Restoration Project
A $429 million joint Victorian-Commonwealth initiative to construct regulators, channels, containment banks and ancillary works at nine high-priority floodplain sites along the Victorian Murray River. The project will enable active environmental watering of over 14,000 hectares of floodplain, restoring natural inundation patterns, improving ecological health and building drought resilience while maintaining existing flood protection for surrounding landholders.

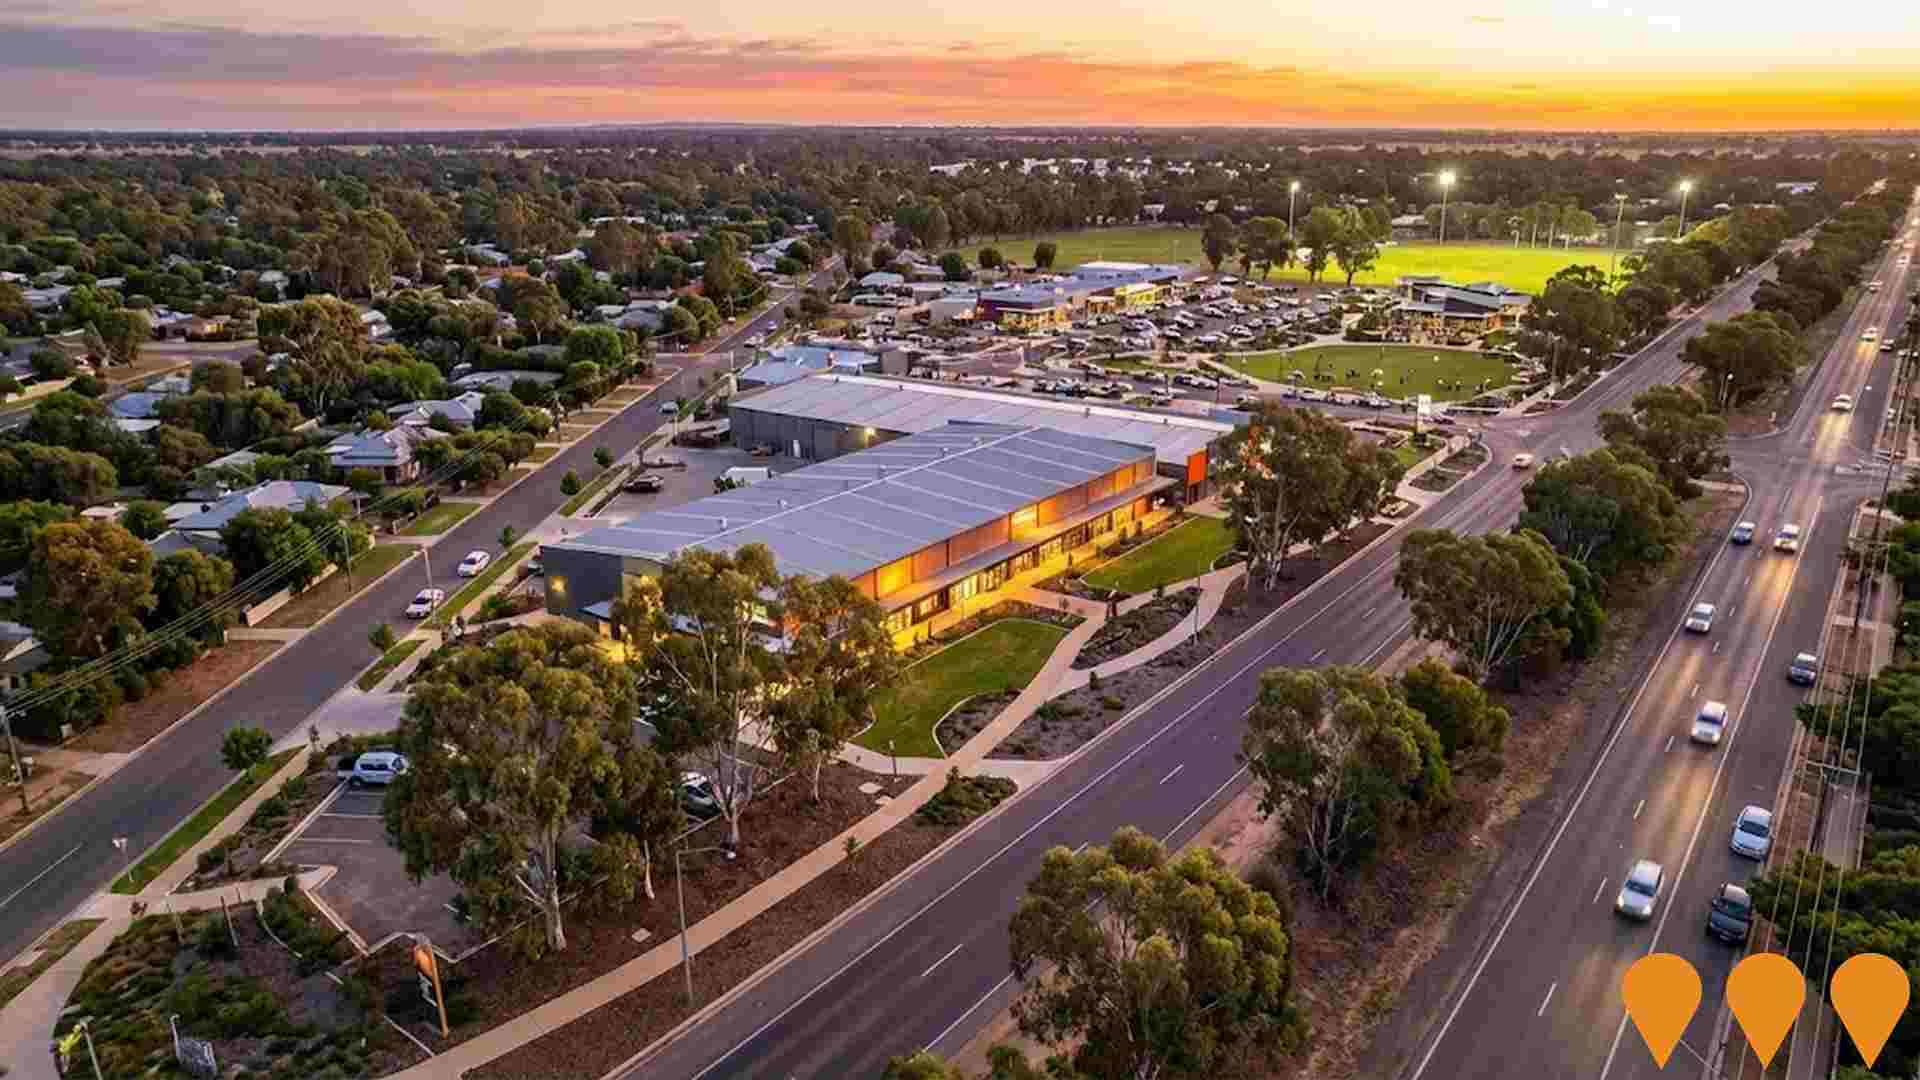
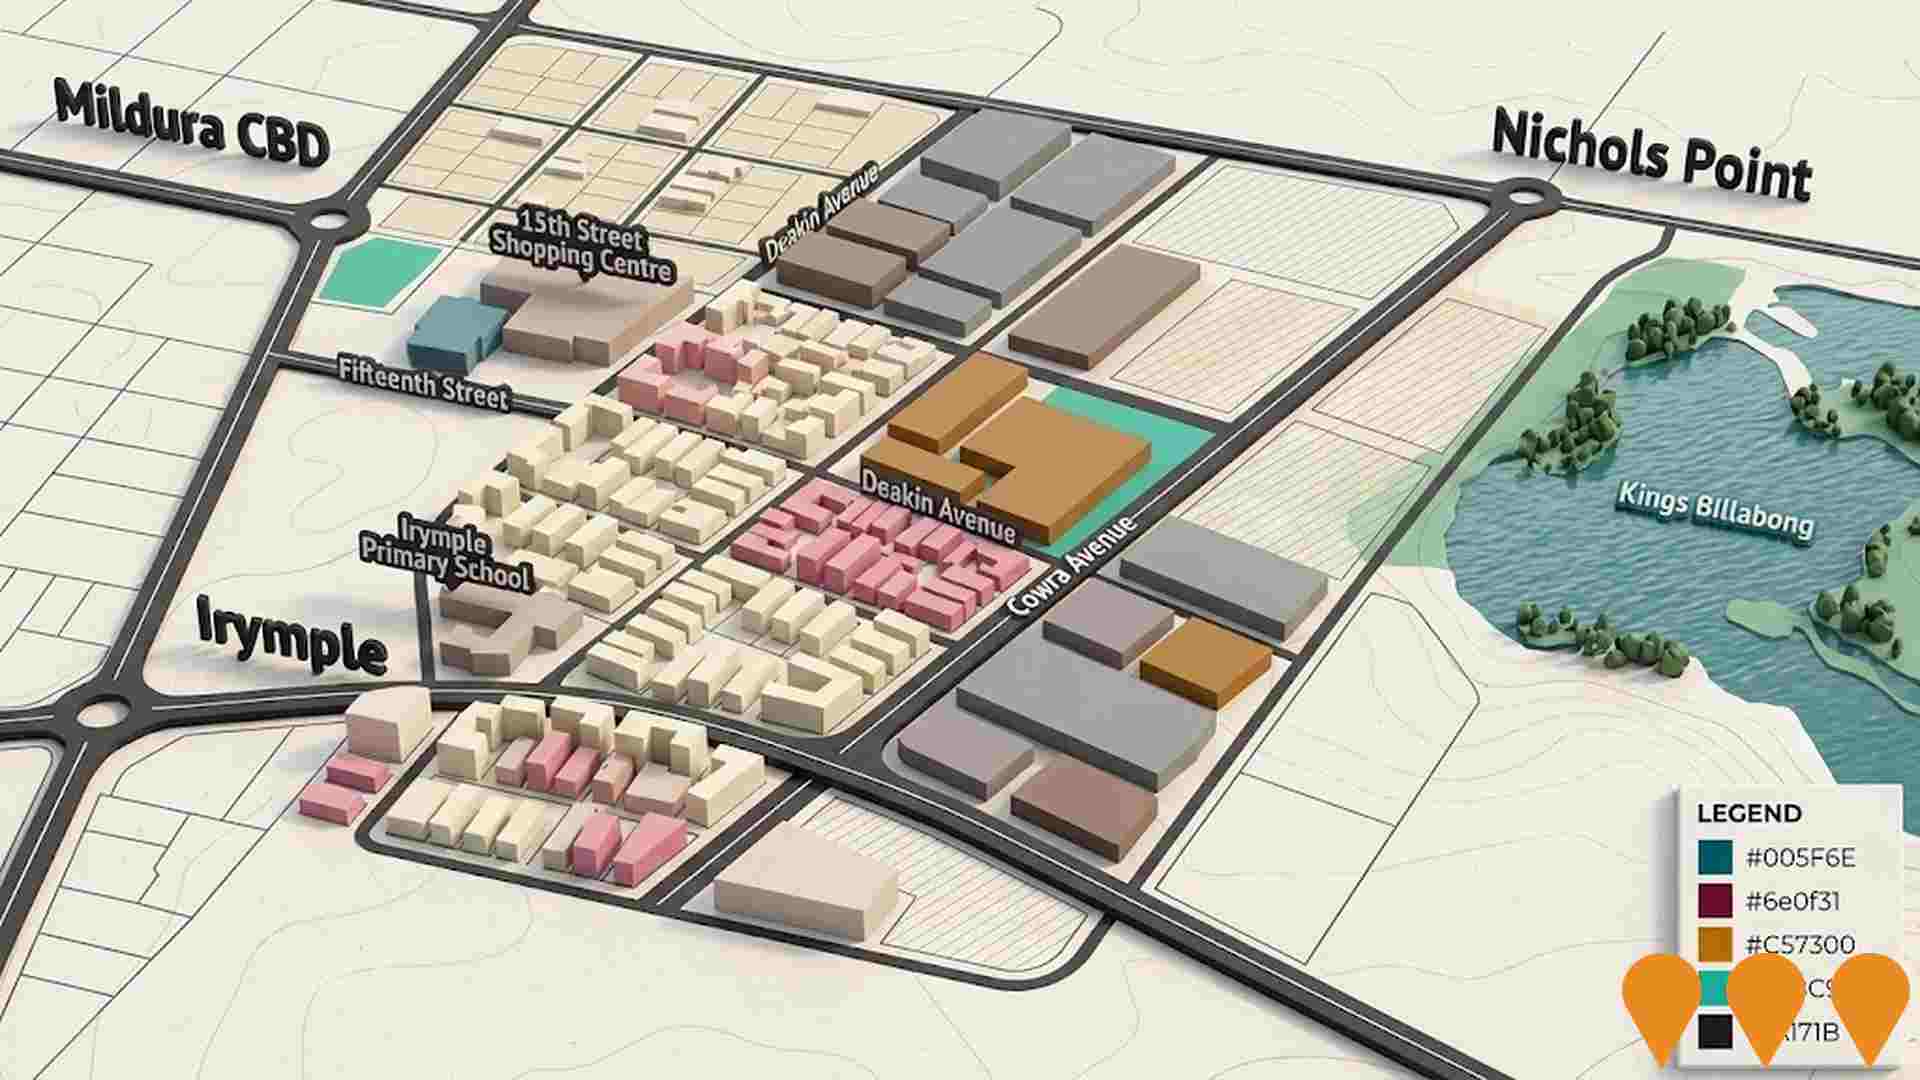
Irymple Hub
A retail complex featuring an IGA supermarket, commercial shops, pharmacy, medical clinic, gym, and eateries to serve the local community.
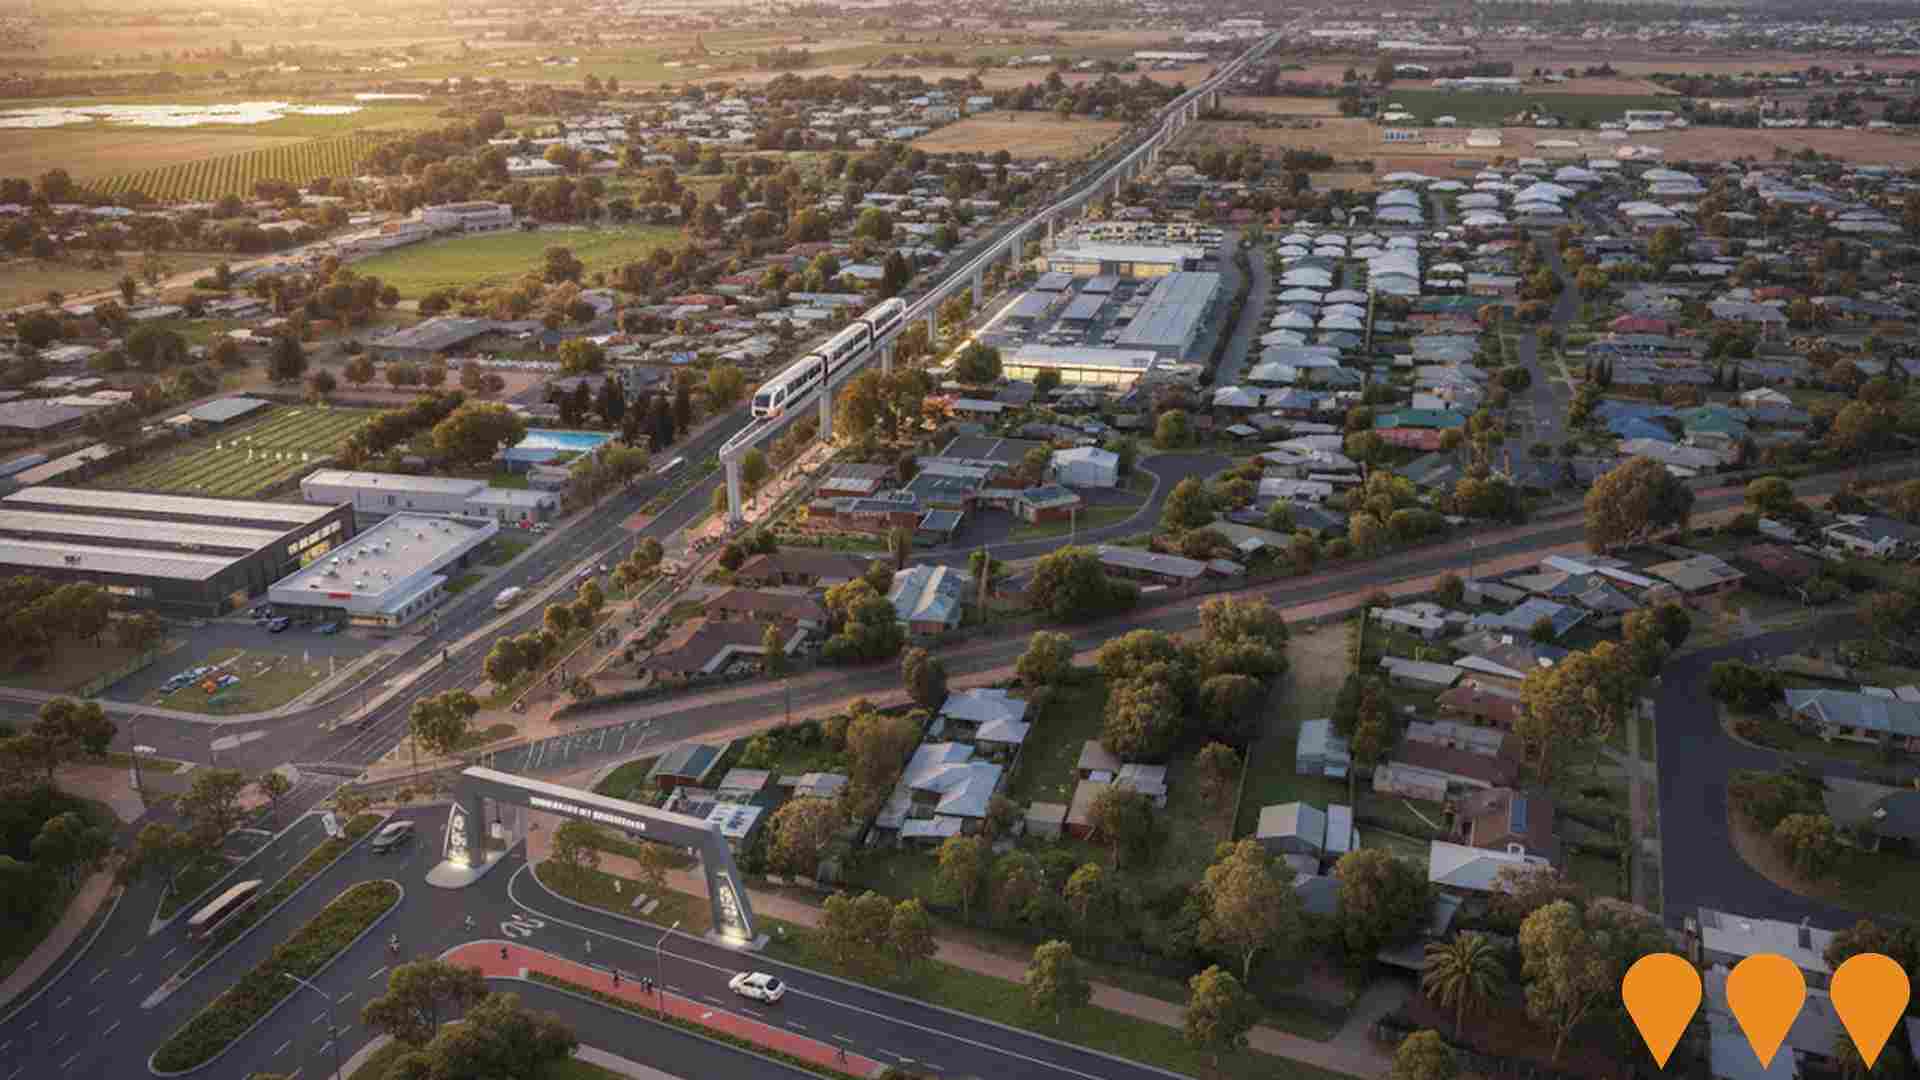
Nowingi Solar Power Station
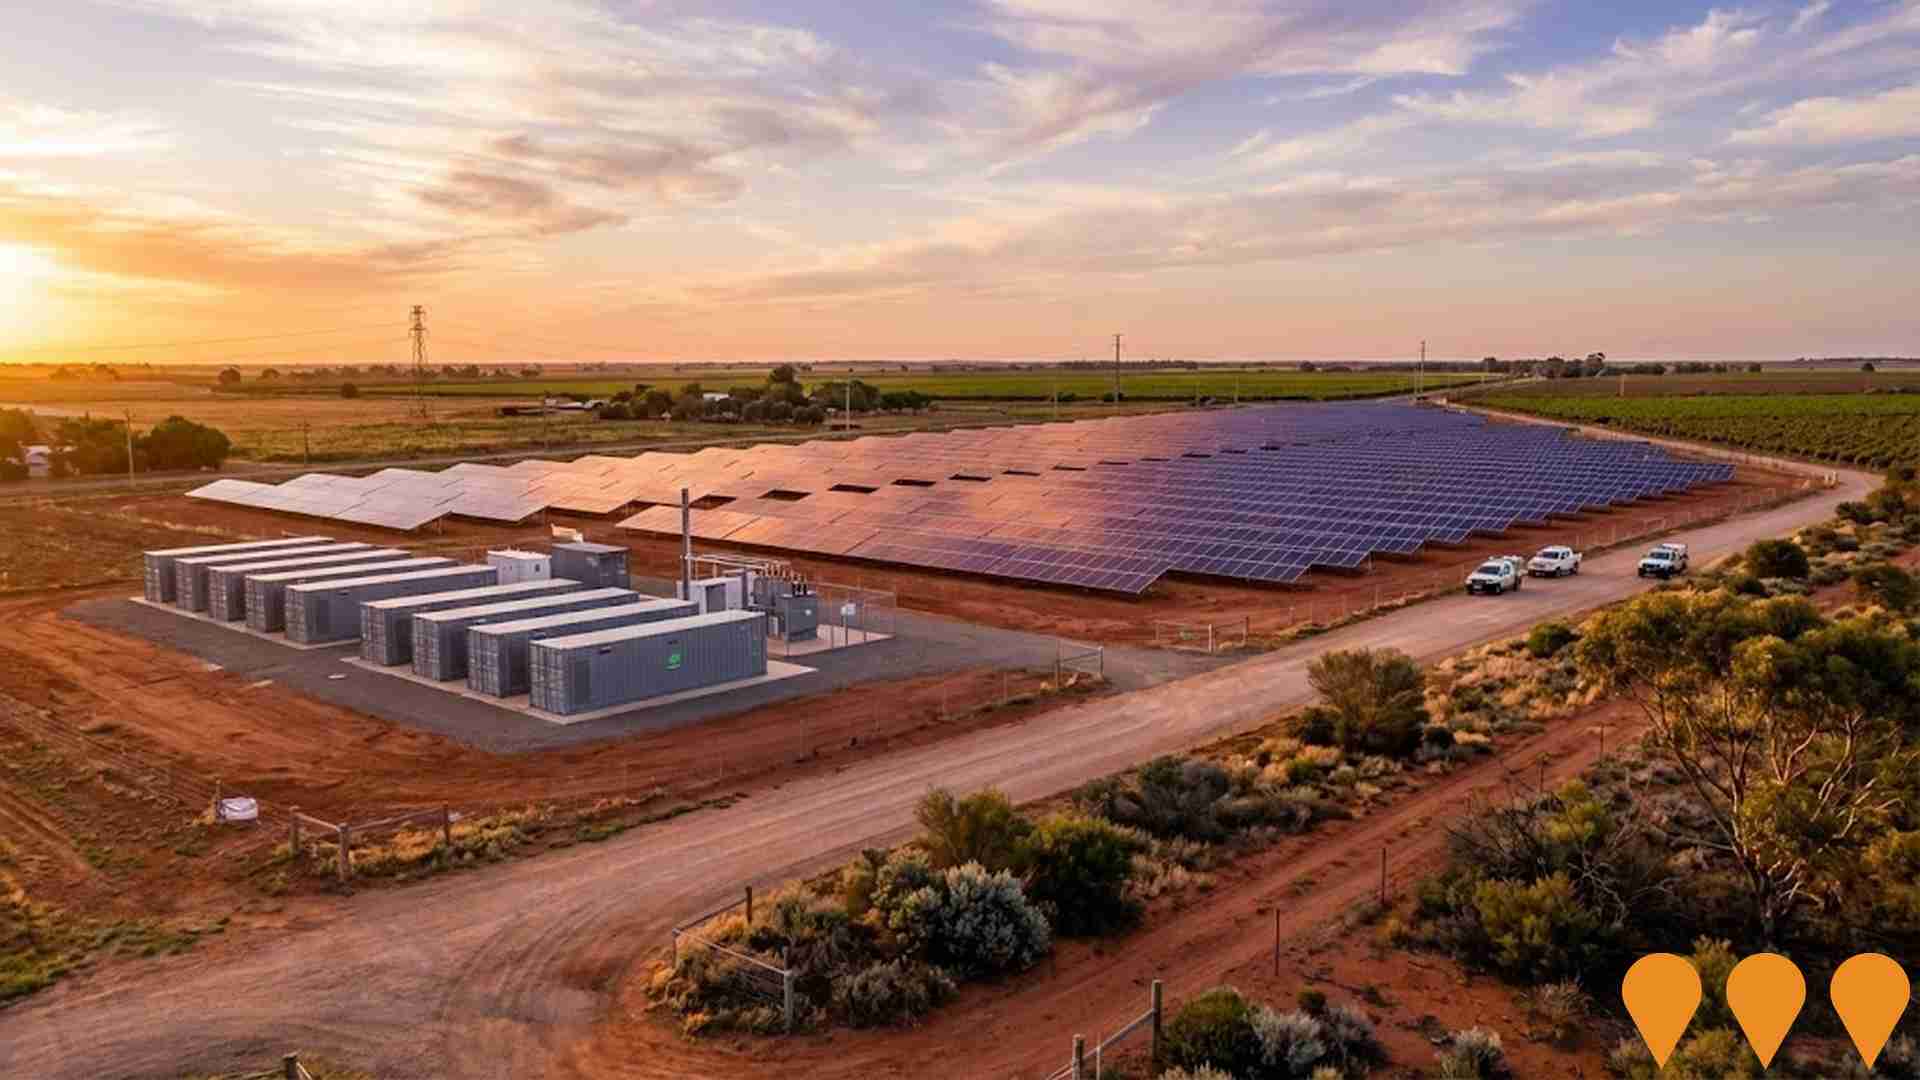
A 300 MW solar photovoltaic power station with integrated 300 MW/2.4 GWh (8-hour duration) battery energy storage system. The project received federal approval in September 2025 and was awarded a Capacity Investment Scheme agreement by the Australian Government in October 2025. When operational, it will be Australia's largest 8-hour duration battery facility, capable of powering 100,000 homes. Construction is expected to commence in 2026, creating approximately 250 jobs over an 18-month build period, with 5 permanent operational positions. The 639-hectare site will support agrivoltaic practices, allowing continued sheep grazing alongside solar generation.
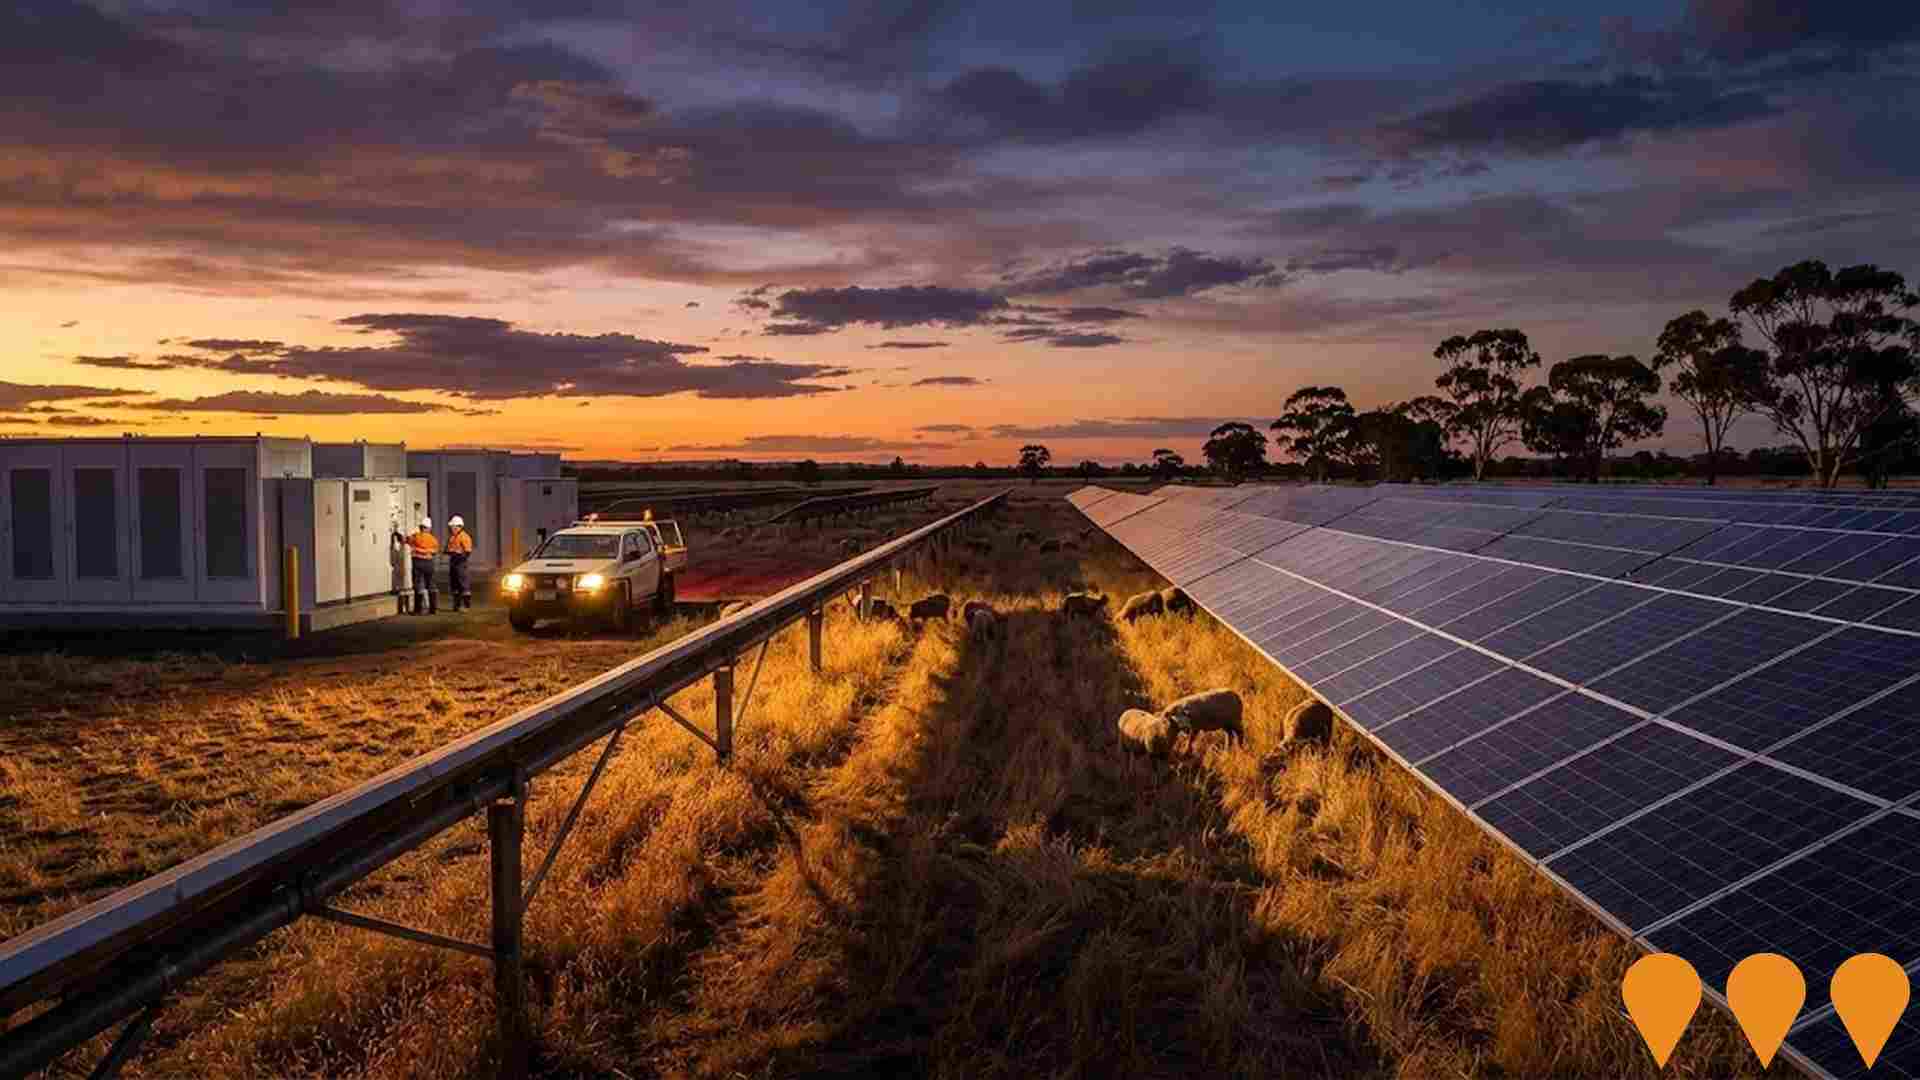
Sunraysia Water Efficiency Project
The $37.9 million Sunraysia Water Efficiency Project improved irrigation efficiency across the Merbein, Mildura, and Red Cliffs Irrigation Districts through modernization of infrastructure including 27km of channel upgrades (lining and pipeline installation), replacement of 357 Dethridge meters, and upgrade of 325 domestic and stock meters. Completed in 2024, the project recovers 1.8 GL of water annually for environmental purposes in the Murray-Darling Basin, created over 100 local jobs during construction, and delivered a $20 million regional GDP increase. The project was delivered by Lower Murray Water and funded by the Australian Government.

Mildura Motorsports and Community Precinct
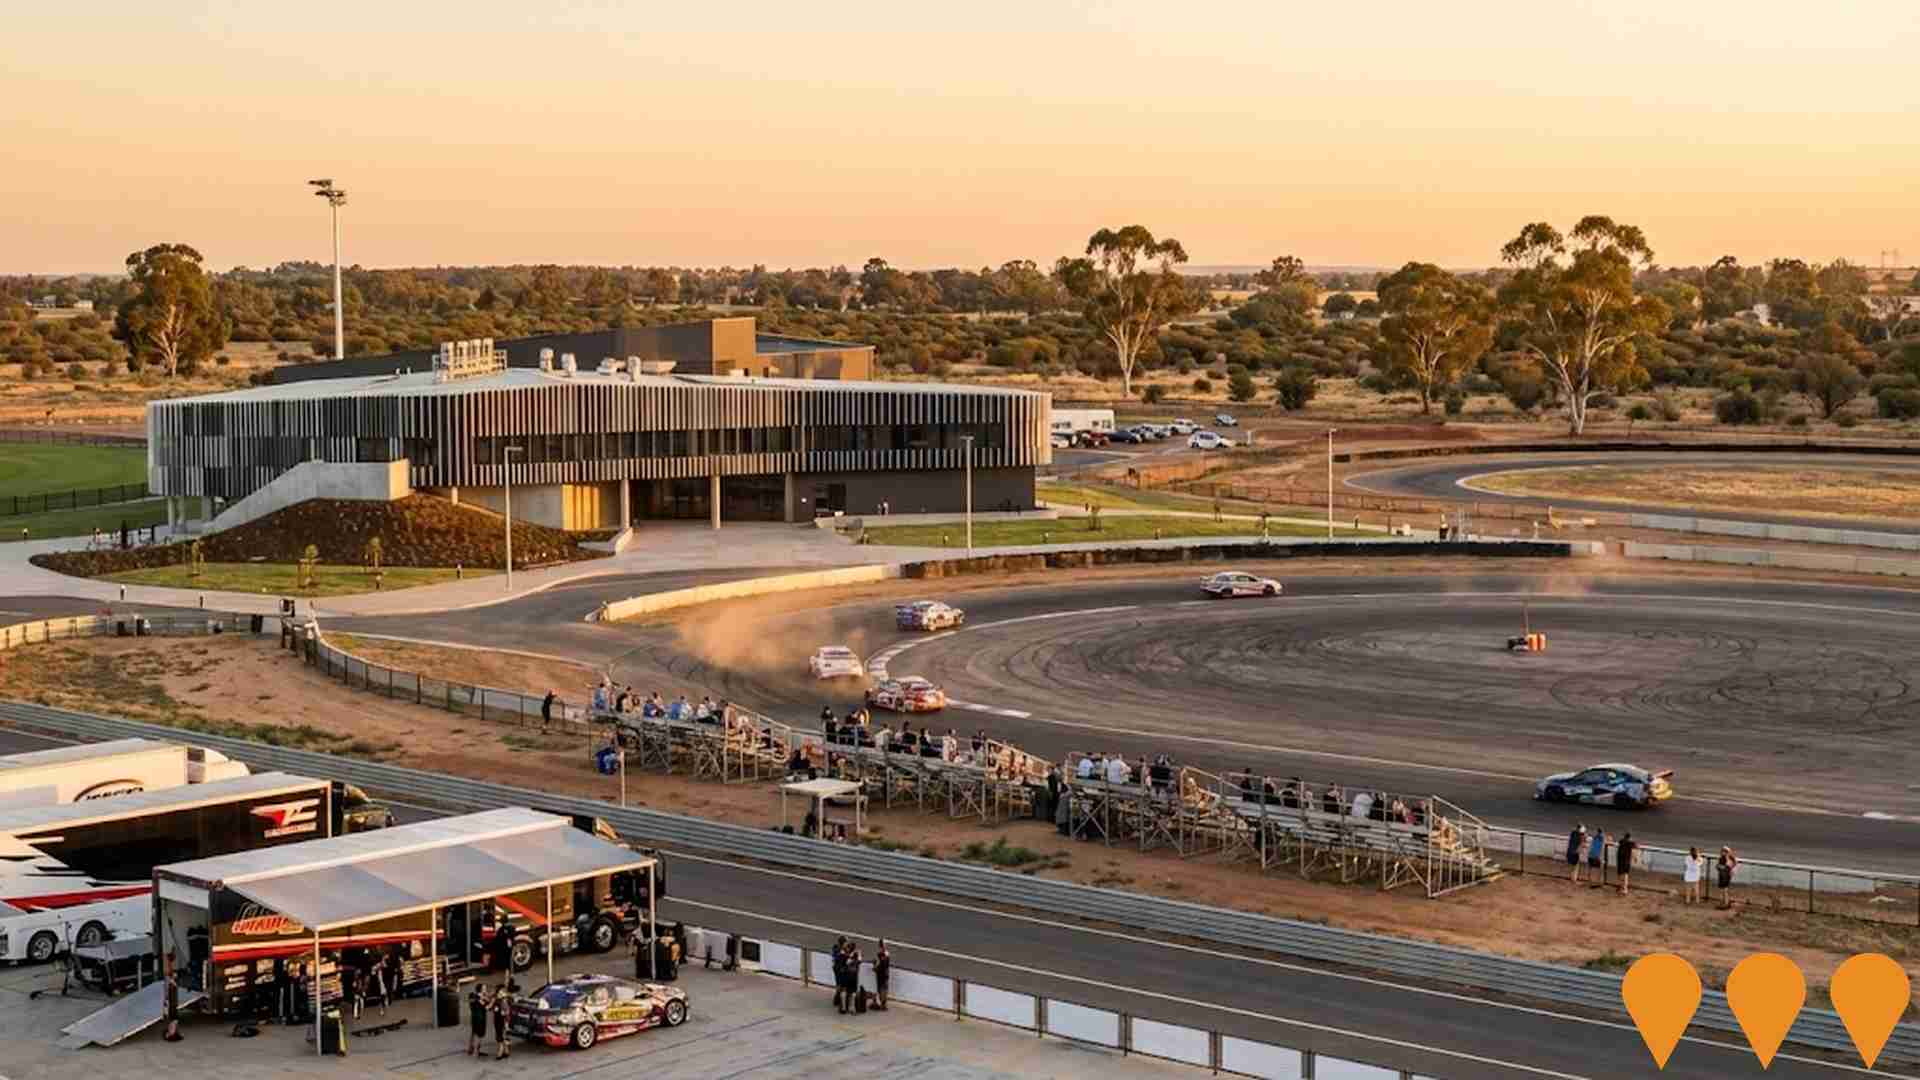
A proposed $22 million motorsports and community precinct in Koorlong near Mildura, featuring a 3km sealed road circuit, multi-use skid pan, pits, control tower, office facilities, maintenance shed, camping facilities, and food and beverage services. Designed to support motorsport activities, vehicle testing, and community events in the Sunraysia region.
Mildura Solar Farm
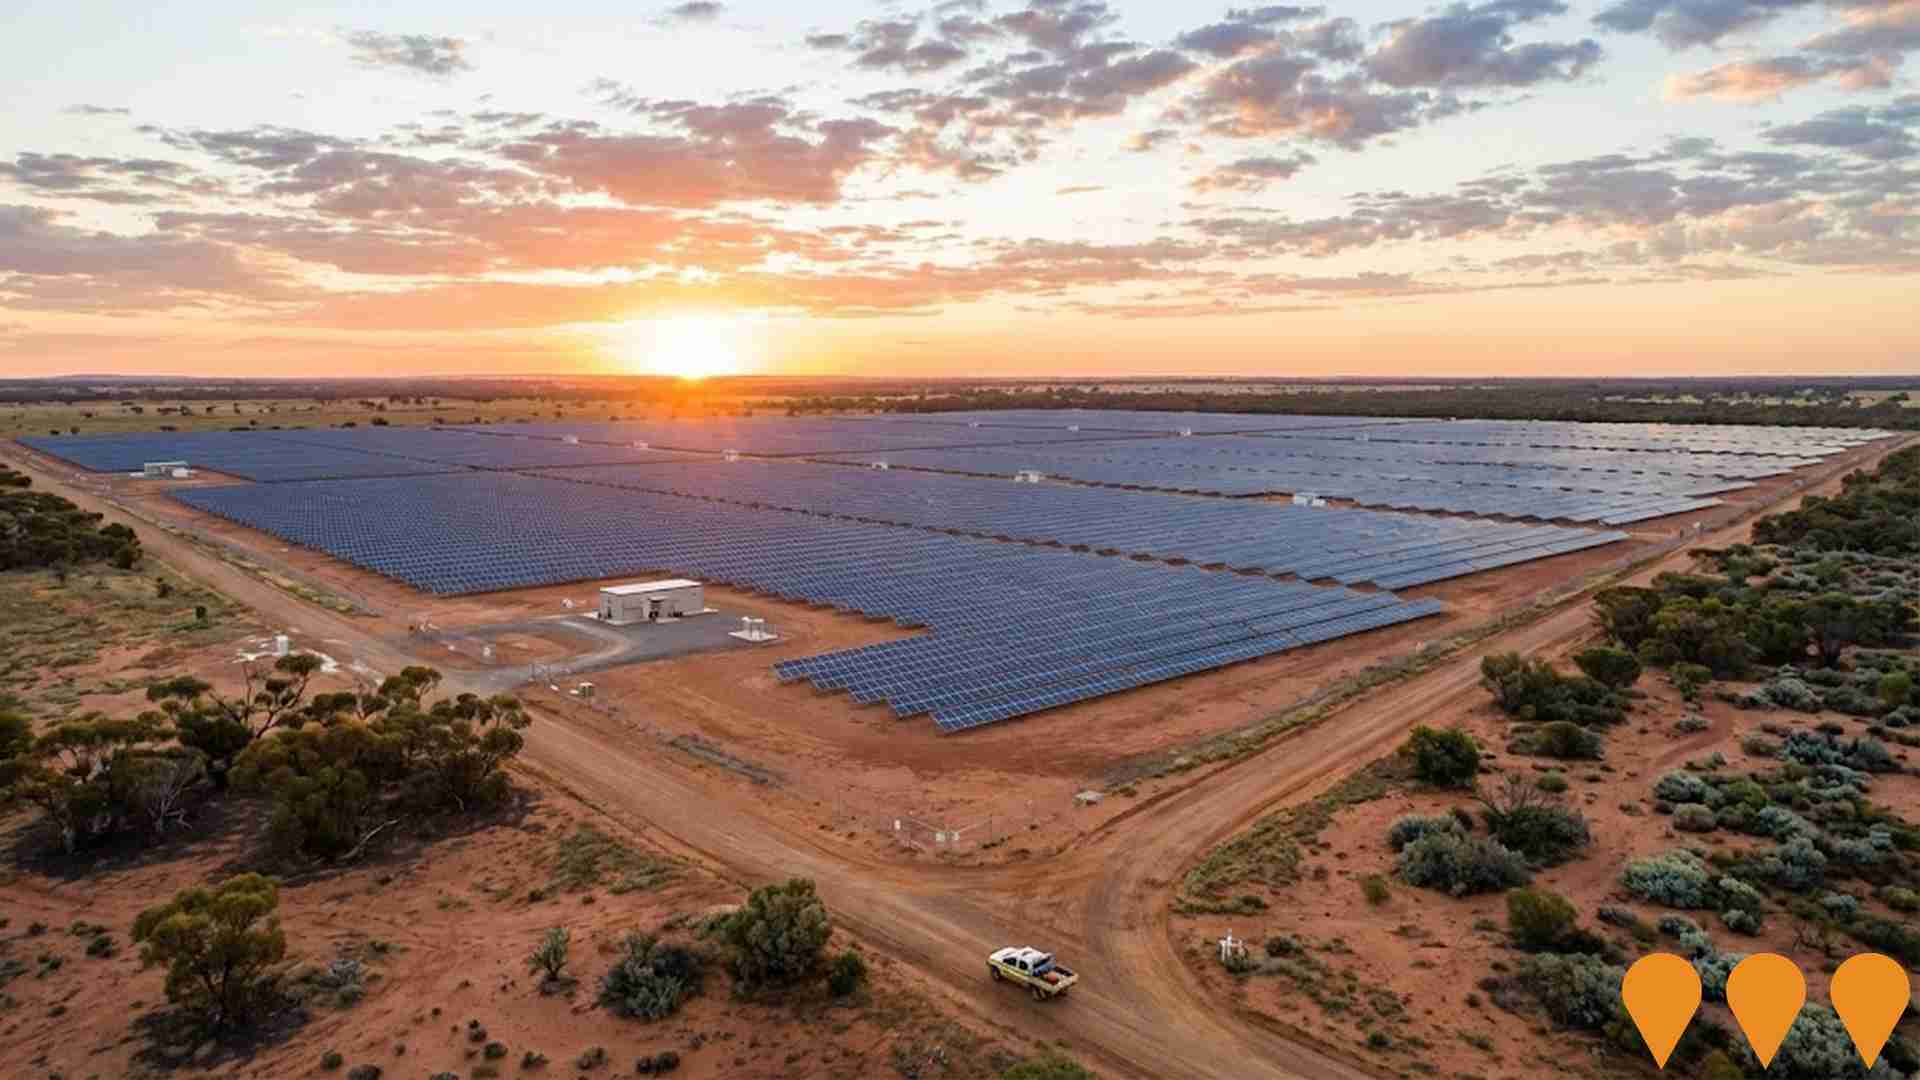
The Mildura Solar Farm is a 110 MW DC solar project located near Mildura, Victoria. It is designed to generate approximately 160,000 MWh of clean, renewable electricity annually, sufficient to power around 34,000 homes. The project supports Victoria's renewable energy targets and provides economic benefits to the local community through job creation and investment. Developed by Sante Group.
Sunraysia Modernisation Project 2
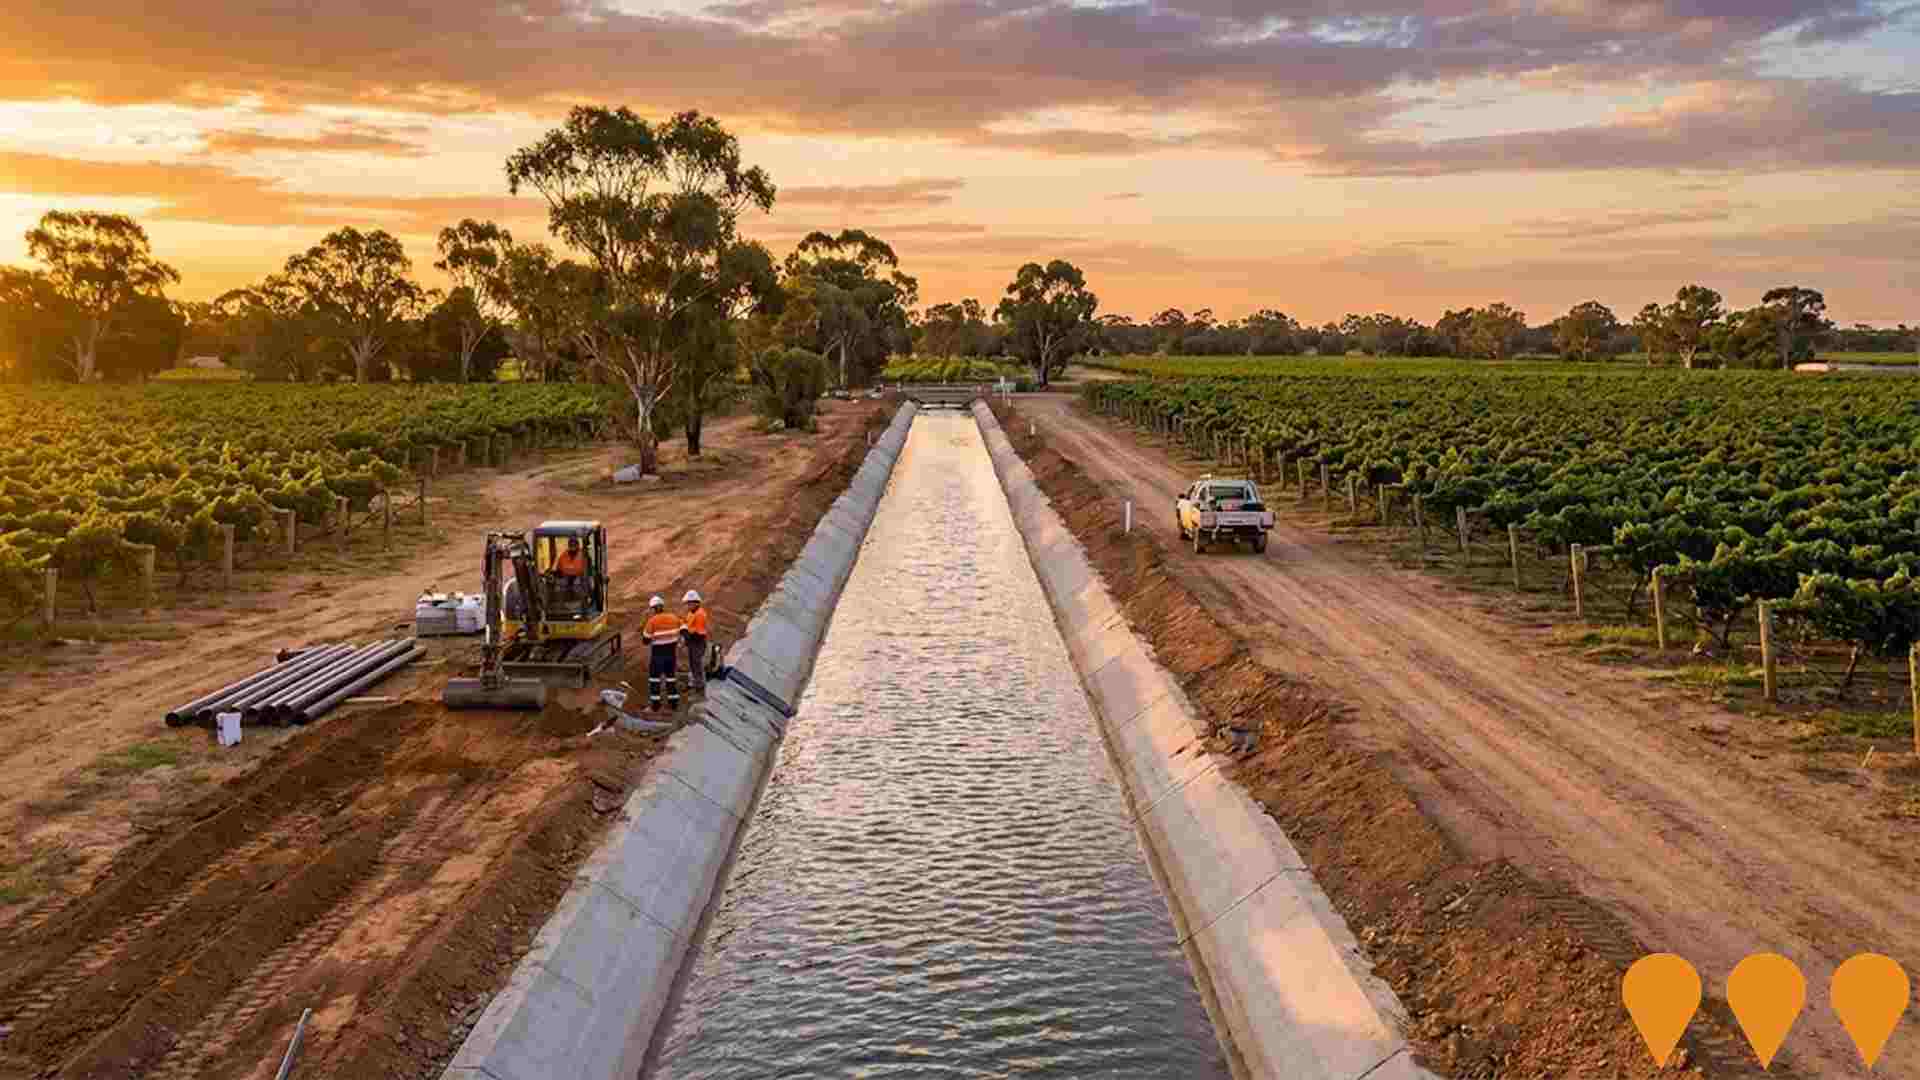
Building on the success of the $120 million Sunraysia Modernisation Project, SMP2 utilized existing infrastructure and capacity to create opportunities for the Merbein and Red Cliffs irrigation districts. The project supplied additional water and unlocked 2,000 hectares of additional land for irrigation, ensuring these districts can meet the needs of modern horticulture and remain viable into the future. Construction began in March 2019 and was completed in October 2019, one month ahead of schedule, ready for the 2019/20 irrigation season. The project improved resilience and crop diversification while benefiting existing irrigation customers through cost-efficiency and improved business sustainability.
Mildura South Neighbourhood Activity Centre
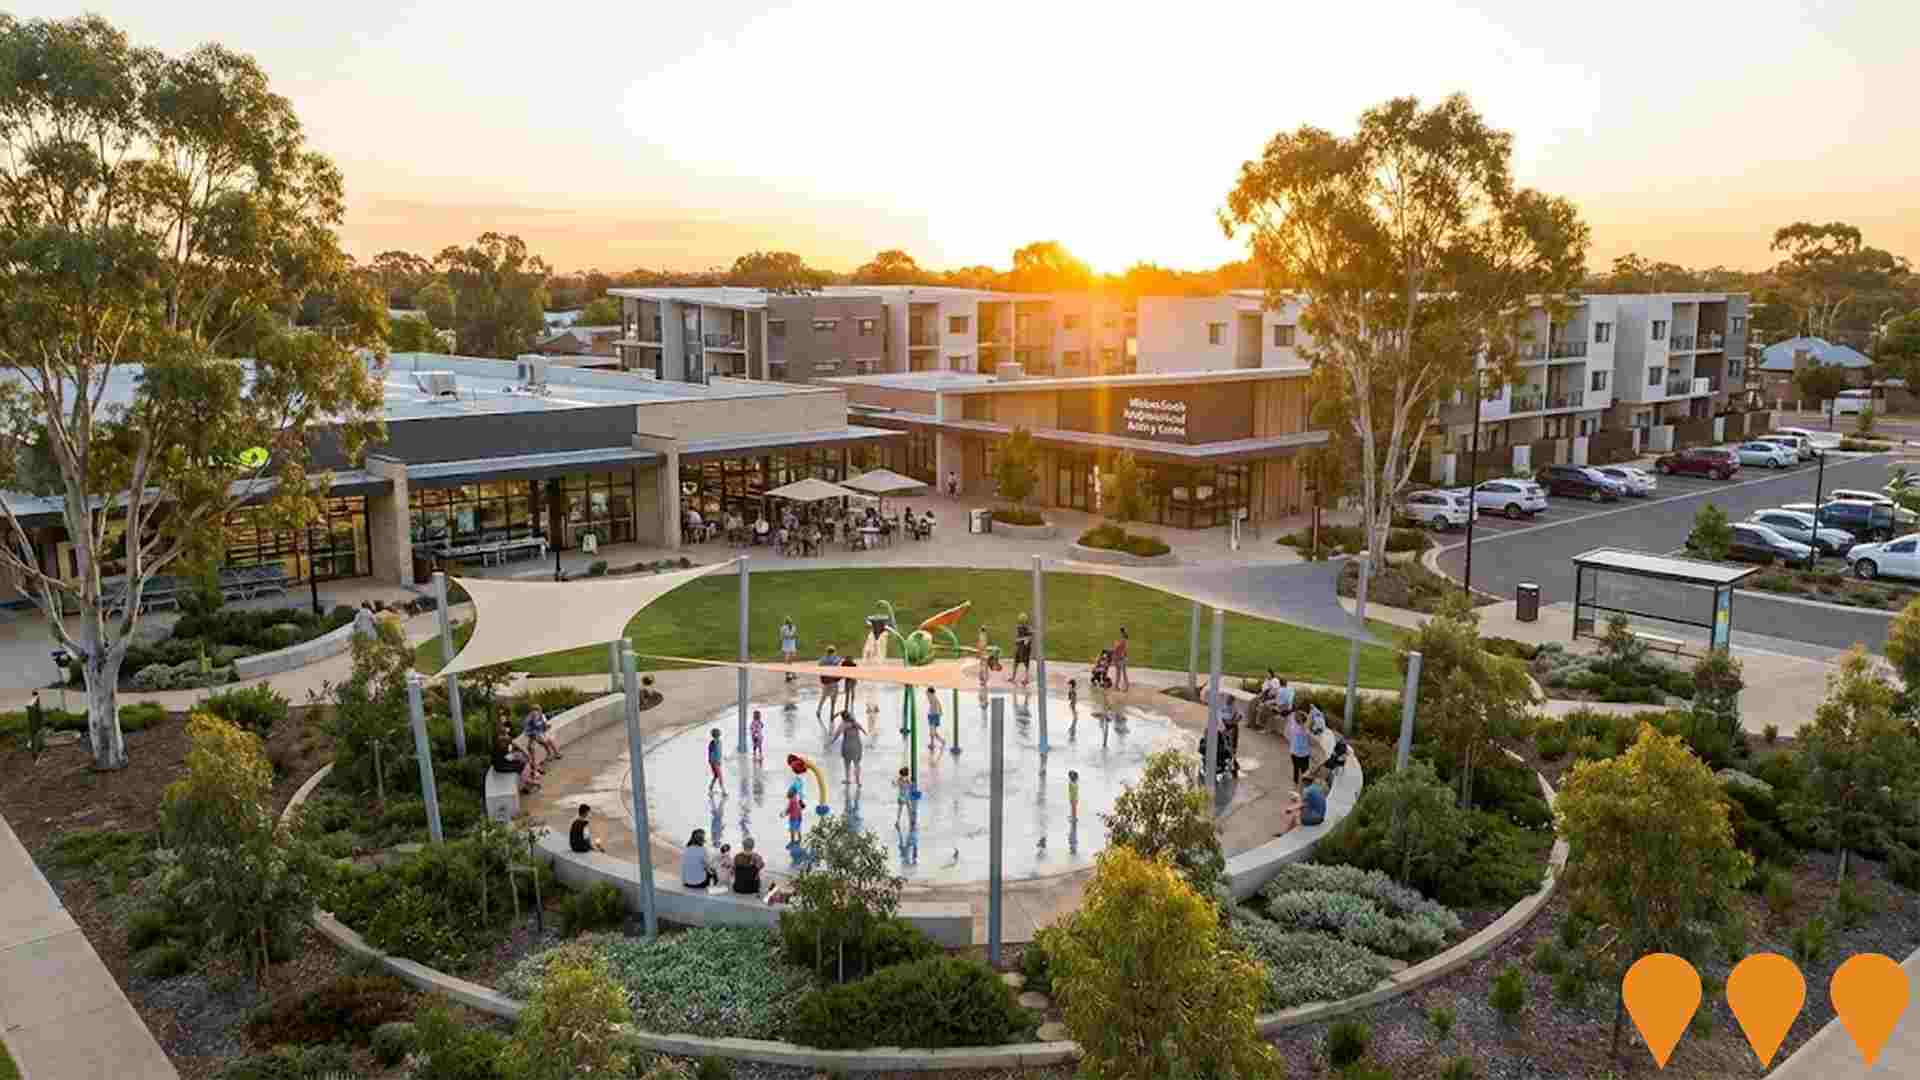
Approved $150 million mixed-use neighbourhood activity centre comprising four distinct precincts: commercial (supermarket, specialty shops, health services, hospitality), residential (medium density housing), community (hub, childcare, recreation facilities) and village green (public open space, community garden). The 8-hectare development will serve up to 10,000 residents in the growing Mildura South corridor over the next 10 years.
Employment
Mildura Surrounds ranks among the top 25% of areas assessed nationally for overall employment performance
Mildura Surrounds has a balanced workforce with white and blue collar jobs, diverse sectors represented, and an unemployment rate of 1.4% as of September 2025. There are 2,018 residents employed, with an unemployment rate 2.4% lower than Rest of Vic.'s 3.8%.
Workforce participation is similar to Rest of Vic.'s 57.4%. Employment is concentrated in agriculture, forestry & fishing (5.6 times the regional level), health care & social assistance, and education & training. Construction shows lower representation at 4.3% versus the regional average of 10.4%. Many residents commute elsewhere for work based on Census data analysis.
Over the year to September 2025, labour force levels decreased by 4.1%, employment declined by 2.6%, resulting in a 1.5 percentage point drop in unemployment rate. In contrast, Rest of Vic. had an employment decline of 0.7% and labour force decline of 0.6%. State-level data to 25-Nov shows VIC employment grew by 1.13% year-on-year, with the state unemployment rate at 4.7%, compared to the national rate of 4.3%. Jobs and Skills Australia's forecasts suggest national employment will expand by 6.6% over five years and 13.7% over ten years. Applying these projections to Mildura Surrounds' employment mix, local employment is estimated to increase by 4.8% over five years and 11.0% over ten years.
Frequently Asked Questions - Employment
Income
The area's income levels rank in the lower 15% nationally based on AreaSearch comparative data
AreaSearch's latest postcode level ATO data for financial year 2022 shows Mildura Surrounds SA2 had a median income of $45,046 and an average of $52,319 among taxpayers. This is below the national average. Rest of Vic., in comparison, had a median of $48,741 and an average of $60,693. Based on Wage Price Index growth of 12.16% since financial year 2022, current estimates for Mildura Surrounds would be approximately $50,524 (median) and $58,681 (average) as of September 2025. The 2021 Census reported household, family, and personal incomes in Mildura Surrounds fell between the 16th and 28th percentiles nationally. The earnings profile shows that 30.0% of locals (1,145 people) earned between $1,500 - 2,999, similar to metropolitan regions where 30.3% fall within this range. Housing costs are modest, with 93.3% of income retained, but total disposable income ranks at the 26th percentile nationally.
Frequently Asked Questions - Income
Housing
Mildura Surrounds is characterized by a predominantly suburban housing profile, with above-average rates of outright home ownership
In Mildura Surrounds, as per the latest Census evaluation, 92.4% of dwellings were houses with 7.5% being other types such as semi-detached homes, apartments, and 'other' dwellings. This contrasts with Non-Metro Vic.'s 85.6% houses and 14.3% other dwellings. Home ownership in Mildura Surrounds stood at 54.5%, with mortgaged dwellings at 25.0% and rented ones at 20.5%. The median monthly mortgage repayment was $900, significantly lower than Non-Metro Vic.'s average of $1,863 and the national average of $1,863. The median weekly rent figure in Mildura Surrounds was $150, substantially below Non-Metro Vic.'s $265 and the national figure of $375.
Frequently Asked Questions - Housing
Household Composition
Mildura Surrounds features high concentrations of lone person households, with a lower-than-average median household size
Family households account for 64.5% of all households, including 23.9% couples with children, 32.7% couples without children, and 6.9% single parent families. Non-family households constitute the remaining 35.5%, with lone person households at 32.7% and group households making up 2.9%. The median household size is 2.3 people, which is smaller than the Rest of Vic. average of 2.4.
Frequently Asked Questions - Households
Local Schools & Education
Mildura Surrounds faces educational challenges, with performance metrics placing it in the bottom quartile of areas assessed nationally
The area's university qualification rate is 13.2%, significantly lower than Victoria's average of 33.4%. Bachelor degrees are the most common at 10.0%, followed by postgraduate qualifications (1.7%) and graduate diplomas (1.5%). Vocational credentials are prevalent, with 37.3% of residents aged 15+ holding them, including advanced diplomas (8.1%) and certificates (29.2%). Educational participation is high at 28.8%, with 11.5% in primary education, 9.6% in secondary education, and 2.0% pursuing tertiary education.
Educational participation is notably high, with 28.8% of residents currently enrolled in formal education. This includes 11.5% in primary education, 9.6% in secondary education, and 2.0% pursuing tertiary education.
Frequently Asked Questions - Education
Schools Detail
Nearby Services & Amenities
Transport
Transport servicing is very low compared to other areas nationally based on assessment of service frequency, route connectivity and accessibility
Analysis of public transport in Mildura Surrounds shows 15 active transport stops operating. These are a mix of bus stops serviced by 10 individual routes. Together, they provide 67 weekly passenger trips.
Accessibility is limited; residents typically live 3747 meters from the nearest stop. Service frequency averages 9 trips per day across all routes, equating to approximately 4 weekly trips per stop.
Frequently Asked Questions - Transport
Transport Stops Detail
Health
Health performance in Mildura Surrounds is lower than average with common health conditions somewhat prevalent across both younger and older age cohorts
Mildura Surrounds faces significant health challenges with common health conditions prevalent across both younger and older age cohorts. The rate of private health cover is extremely low at approximately 46% of the total population (~1,763 people), compared to the national average of 55.3%.
The most common medical conditions in the area are arthritis and asthma, impacting 8.4% and 8.3% of residents respectively. 66.9% of residents declare themselves completely clear of medical ailments, compared to 65.1% across Rest of Vic.. As of 2021, 24.1% of residents are aged 65 and over (919 people), which is higher than the 19.2% in Rest of Vic.. Health outcomes among seniors in Mildura Surrounds are particularly strong, performing better than the general population in health metrics.
Frequently Asked Questions - Health
Cultural Diversity
Mildura Surrounds is considerably less culturally diverse than average when assessed alongside AreaSearch's national rankings for language and cultural background related metrics
Mildura Surrounds had a cultural diversity index below the average, with 84.9% of its population being citizens, 91.3% born in Australia, and 94.4% speaking English only at home. Christianity was the predominant religion, comprising 48.8% of people in Mildura Surrounds as of the latest available data. Notably, the 'Other' category made up 1.4% of the population, slightly higher than the 1.0% average across Rest of Vic..
In terms of ancestry, Australians were the largest group at 33.9%, followed by English at 31.6% and Scottish at 8.2%. Some ethnic groups showed significant differences in representation: Samoan was overrepresented at 1.1% (vs regional average of 0.2%), German at 5.5% (vs 4.0%), and Croatian at 0.4% (vs 0.5%).
Frequently Asked Questions - Diversity
Age
Mildura Surrounds hosts an older demographic, ranking in the top quartile nationwide
Mildura Surrounds has a median age of 45 years, which is slightly higher than Rest of Vic.'s median age of 43. This figure is considerably older than the national norm of 38 years. Comparing with the average in Rest of Vic., Mildura Surrounds has an over-representation of the 25-34 cohort (13.6% locally) and an under-representation of the 15-24 age group (10.2%). Since 2021, the 25-34 age group has increased from 10.6% to 13.6% of the population. Conversely, the 55-64 cohort has decreased from 16.5% to 12.6%. Demographic projections indicate significant changes in Mildura Surrounds' age profile by 2041. The 25-34 age group is projected to expand by 211 people (41%), growing from 519 to 731 individuals. Conversely, population declines are projected for the 65-74 and 55-64 cohorts.
