Chart Color Schemes
This analysis uses ABS Statistical Areas Level 2 (SA2) boundaries, which can materially differ from Suburbs and Localities (SAL) even when sharing similar names.
SA2 boundaries are defined by the Australian Bureau of Statistics and are designed to represent communities for statistical reporting (e.g., census and ERP).
Suburbs and Localities (SAL) represent commonly-used suburb/locality names (postal-style areas) and may use different geographic boundaries. For comprehensive analysis, consider reviewing both boundary types if available.
est. as @ -- *
ABS ERP | -- people | --
2021 Census | -- people
Sales Activity
Curious about local property values? Filter the chart to assess the volume and appreciation (including resales) trends and regional comparisons, or scroll to the map below view this information at an individual property level.
Find a Recent Sale
Sales Detail
Population
Population growth drivers in Yagoona - Birrong are above average based on AreaSearch's ranking of recent, and medium to long-term trends
Yagoona - Birrong's population is approximately 23,391 as of November 2025. This figure represents an increase of 907 people since the 2021 Census, which reported a population of 22,484. The change is inferred from the estimated resident population of 23,406 in June 2024 and an additional 139 validated new addresses since the Census date. This results in a population density ratio of 4,207 persons per square kilometer, placing Yagoona - Birrong among the top 10% of locations assessed by AreaSearch, indicating high demand for land in the area. Over the past decade, from 2015 to 2025, Yagoona - Birrong has shown resilient growth patterns with a compound annual growth rate of 1.2%, outperforming the SA3 area. Population growth was primarily driven by overseas migration, contributing approximately 61.9% of overall population gains during recent periods.
AreaSearch is adopting ABS/Geoscience Australia projections for each SA2 area, released in 2024 with a base year of 2022. For areas not covered by this data, AreaSearch utilises NSW State Government's SA2 level projections released in 2022 with a base year of 2021. Growth rates by age group from these aggregations are applied to all areas for years 2032 to 2041. By 2041, Yagoona - Birrong is expected to experience population growth just below the national median, expanding by approximately 2,304 persons, reflecting a total increase of 9.9% over the 17-year period based on the latest annual ERP population numbers.
Frequently Asked Questions - Population
Development
AreaSearch assessment of residential approval activity sees Yagoona - Birrong among the top 30% of areas assessed nationwide
Yagoona - Birrong averaged approximately 116 new dwelling approvals annually over the past five financial years, from FY21 to FY25, with a total of 582 homes approved during this period. In FY26 up until now, there have been 139 dwelling approvals. On average, around 1.6 people moved to the area per year for each dwelling built over these five financial years, suggesting balanced supply and demand conditions that create stable market environments.
The average construction cost value of new homes being built is approximately $286,000, which is lower than regional levels, indicating more affordable housing options for buyers in the area. In terms of commercial development, $27.2 million worth of approvals have been recorded so far this financial year, suggesting balanced commercial development activity in Yagoona - Birrong. Compared to Greater Sydney, Yagoona - Birrong shows comparable new home approvals per capita, indicating market equilibrium consistent with surrounding areas.
The composition of new developments consists of 56% standalone homes and 44% attached dwellings, with a growing mix of townhouses and apartments providing varied housing options across different price points. This ranges from family homes to more affordable compact living spaces. Currently, Yagoona - Birrong has around 226 people per dwelling approval, indicating characteristics of a low-density area. Population forecasts suggest that Yagoona - Birrong will gain approximately 2,318 residents by the year 2041, based on the latest AreaSearch quarterly estimate. Given current development rates, new housing supply should comfortably meet demand, providing good conditions for buyers and potentially supporting growth beyond current population projections in the area.
Frequently Asked Questions - Development
Infrastructure
Yagoona - Birrong has strong levels of nearby infrastructure activity, ranking in the top 40% nationally
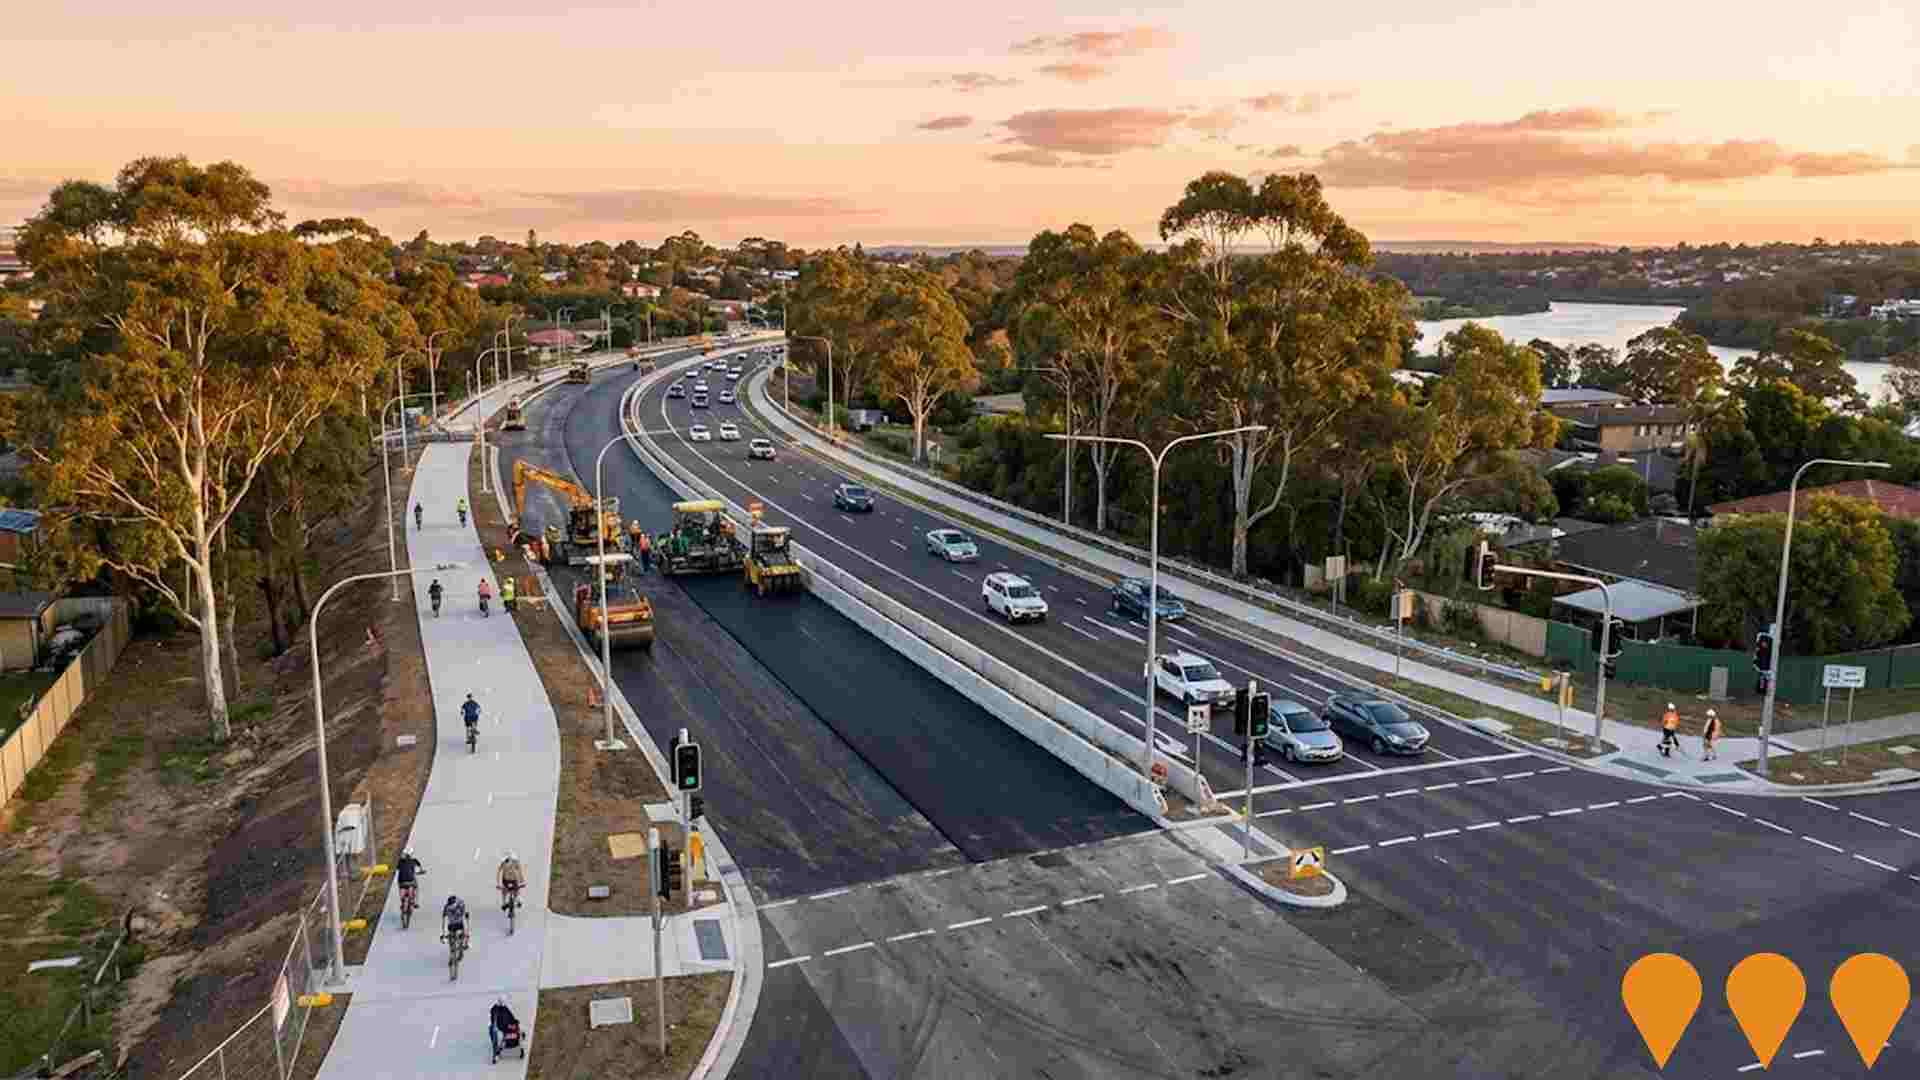
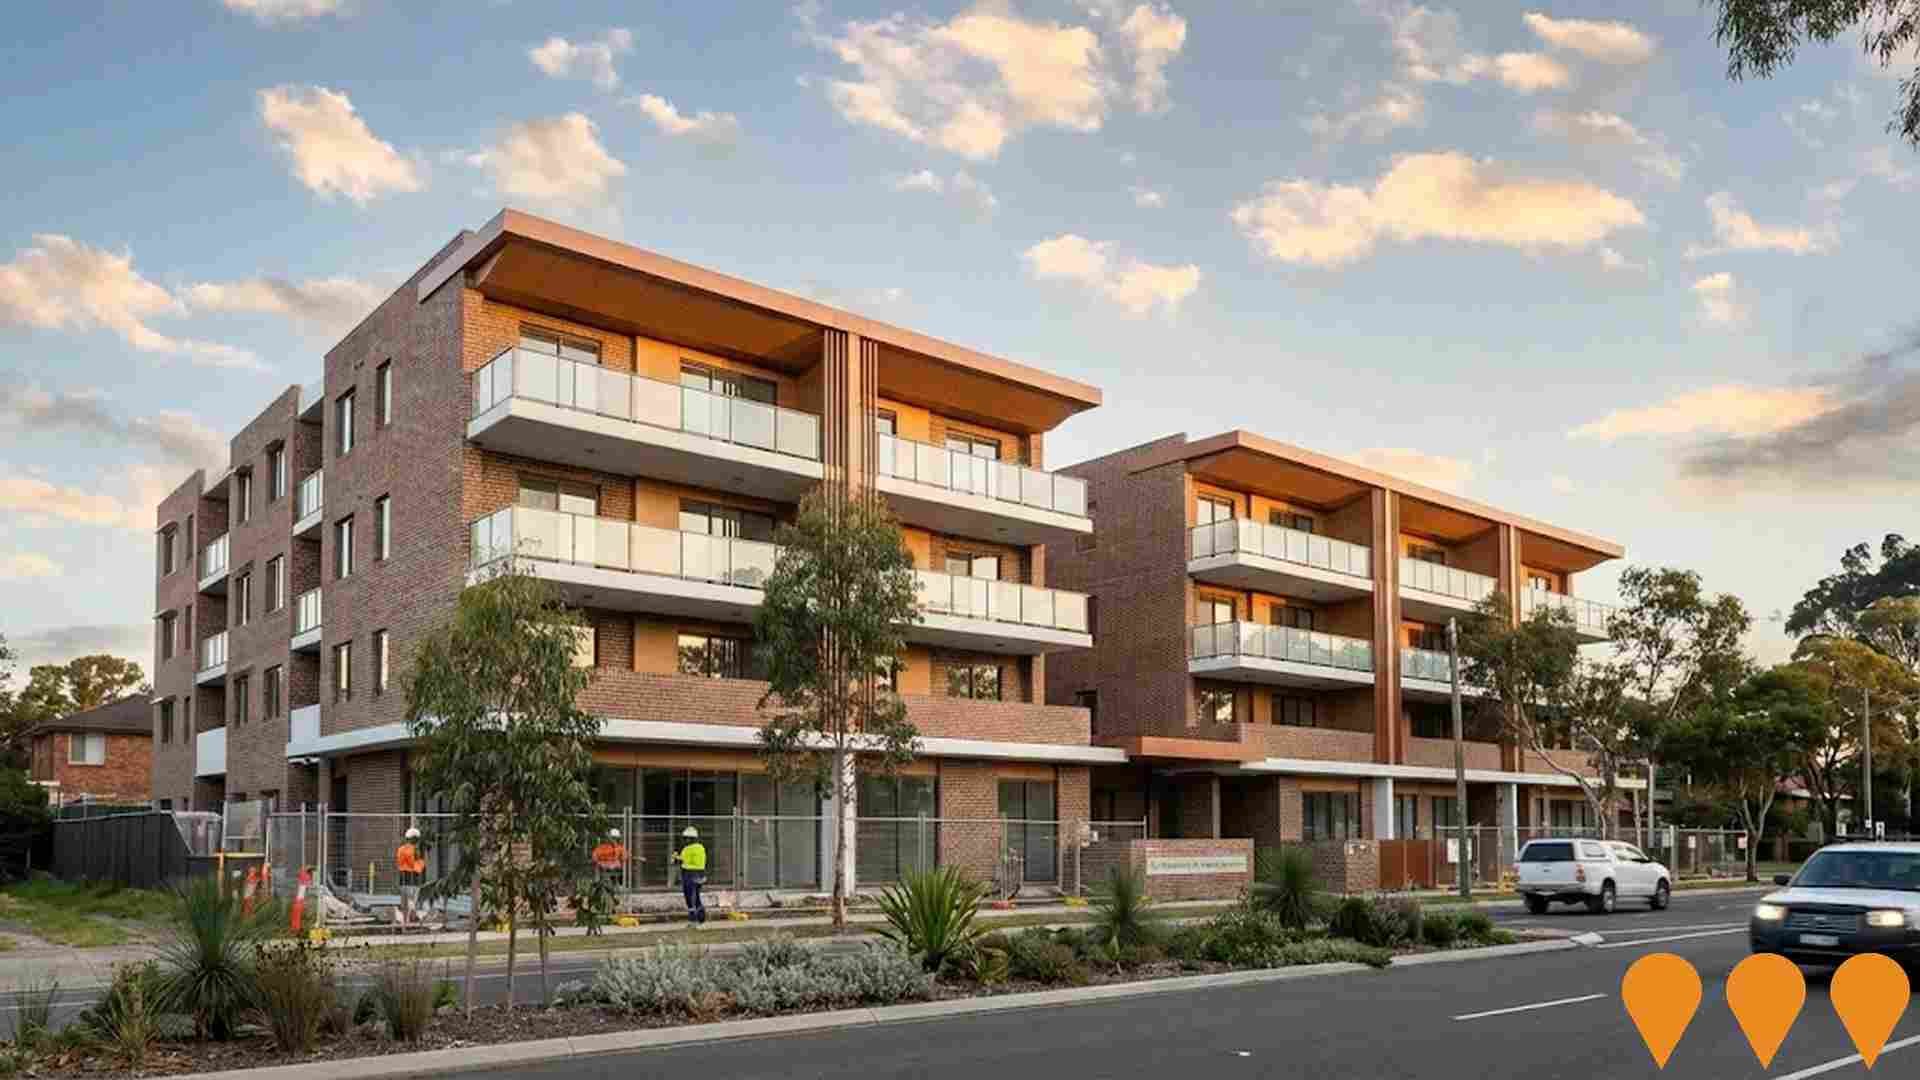
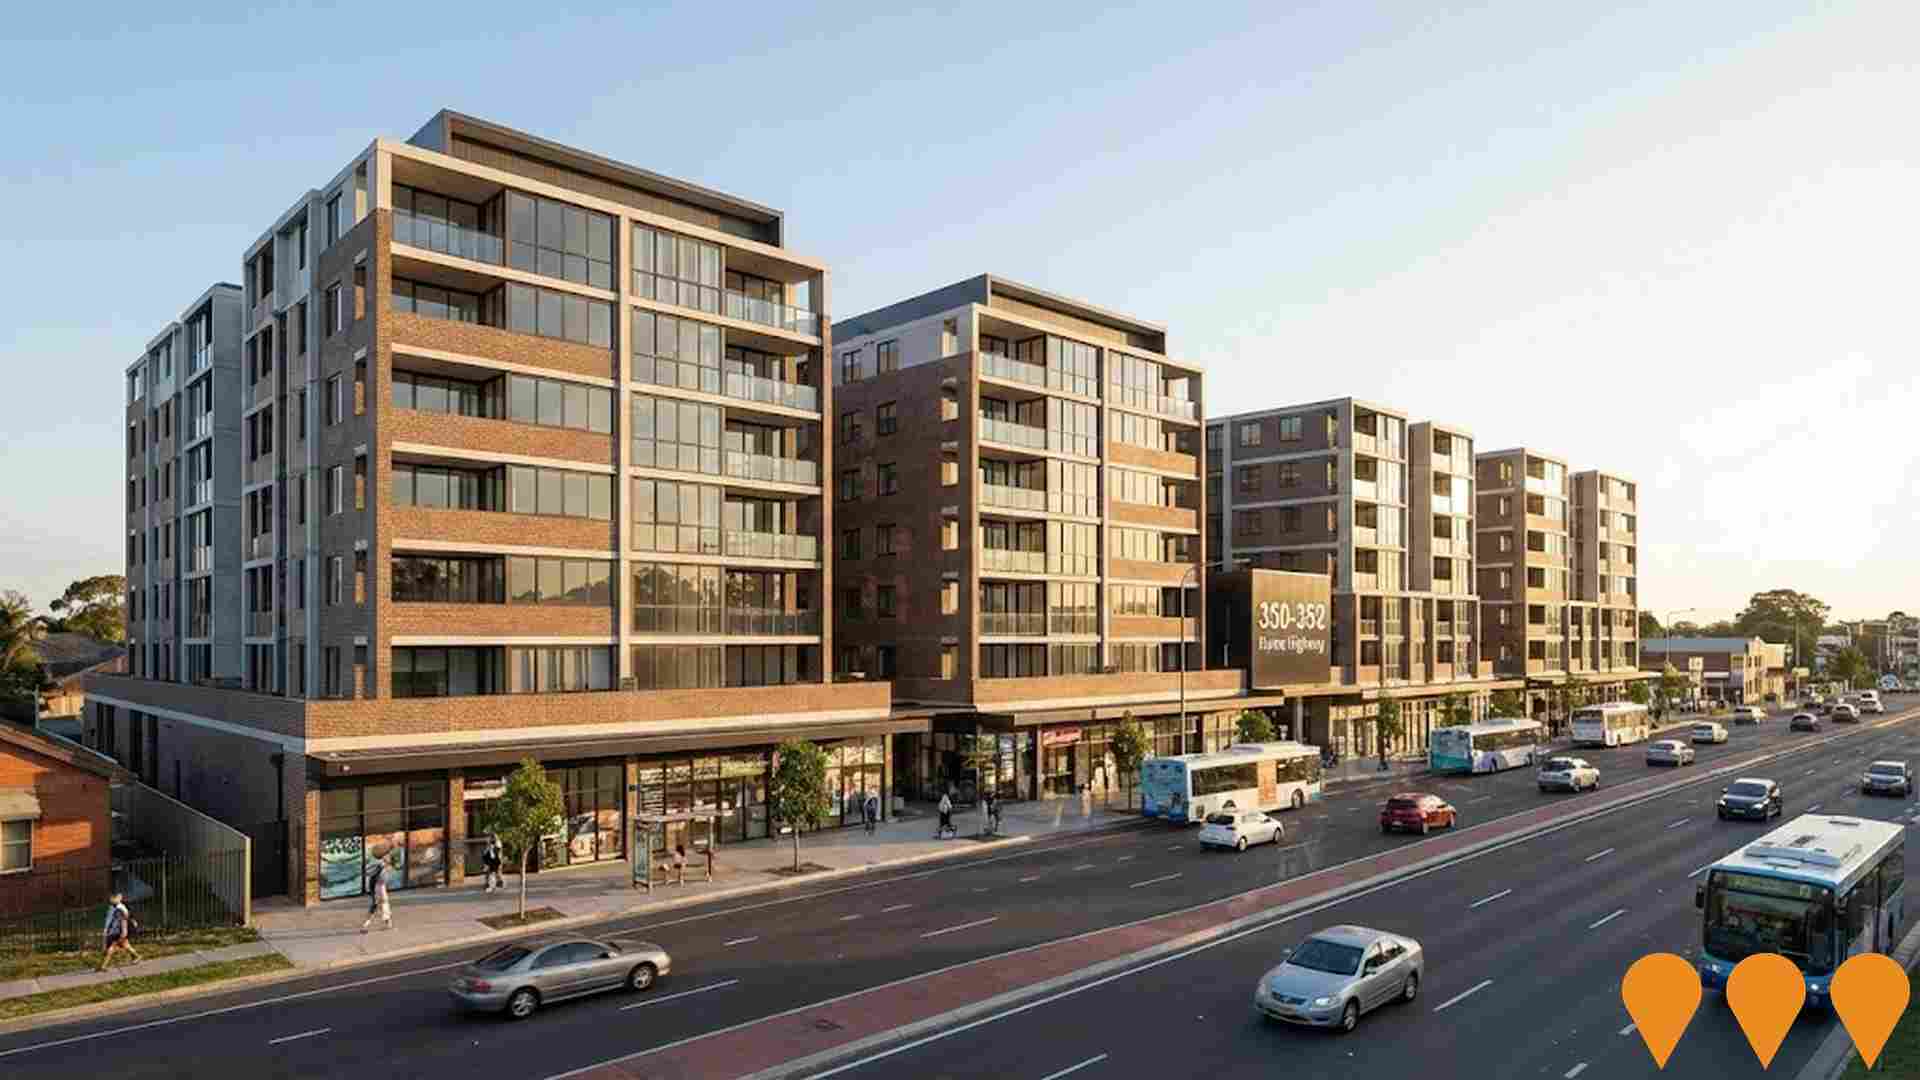
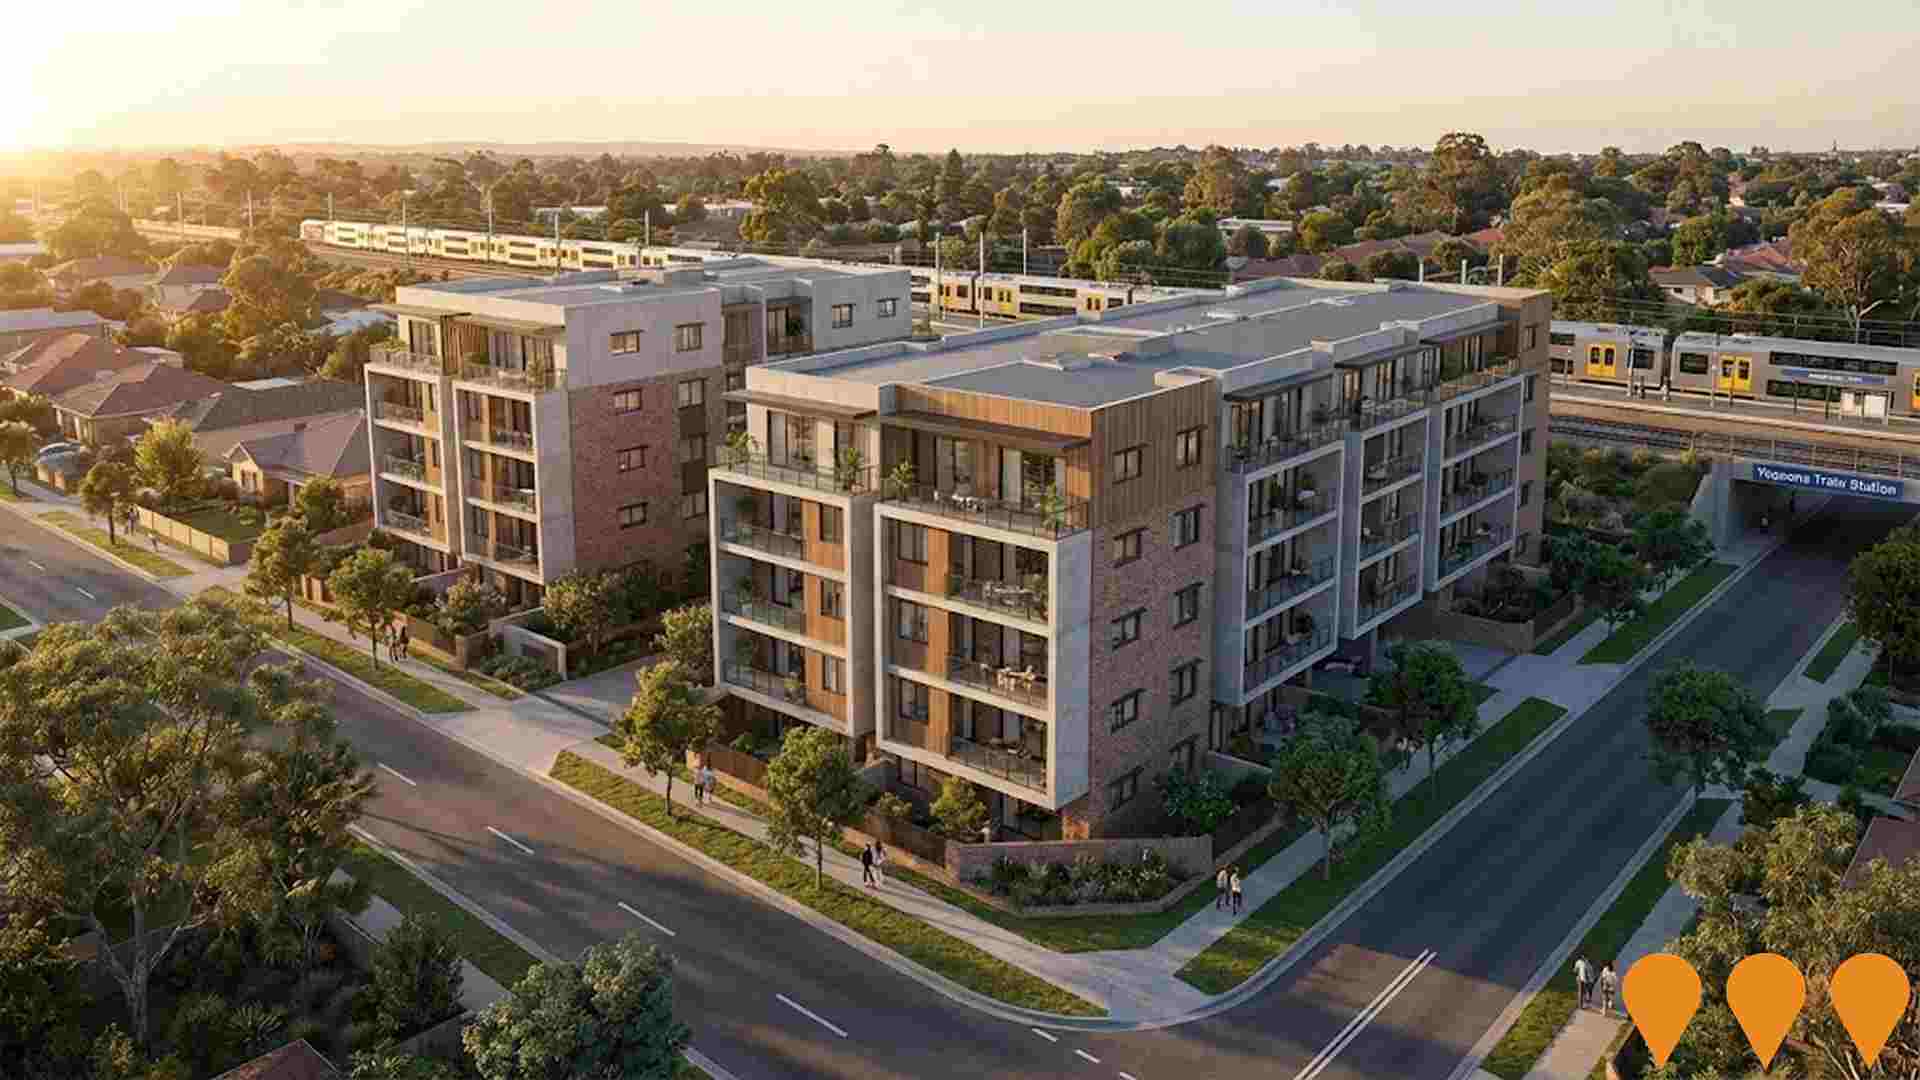
Thirty-three infrastructure projects have been identified by AreaSearch as potentially impacting the area. Notable ones include the Henry Lawson Drive Upgrade Program, 25-29 Rookwood Road Yagoona, 283-289 Cooper Road Redevelopment, and Yagoona Public Preschool. The following list details those likely to be most relevant.
Professional plan users can use the search below to filter and access additional projects.
INFRASTRUCTURE SEARCH
 Denotes AI-based impression for illustrative purposes only, not to be taken as definitive under any circumstances. Please follow links and conduct other investigations from the project's source for actual imagery. Developers and project owners wishing us to use original imagery please Contact Us and we will do so.
Frequently Asked Questions - Infrastructure
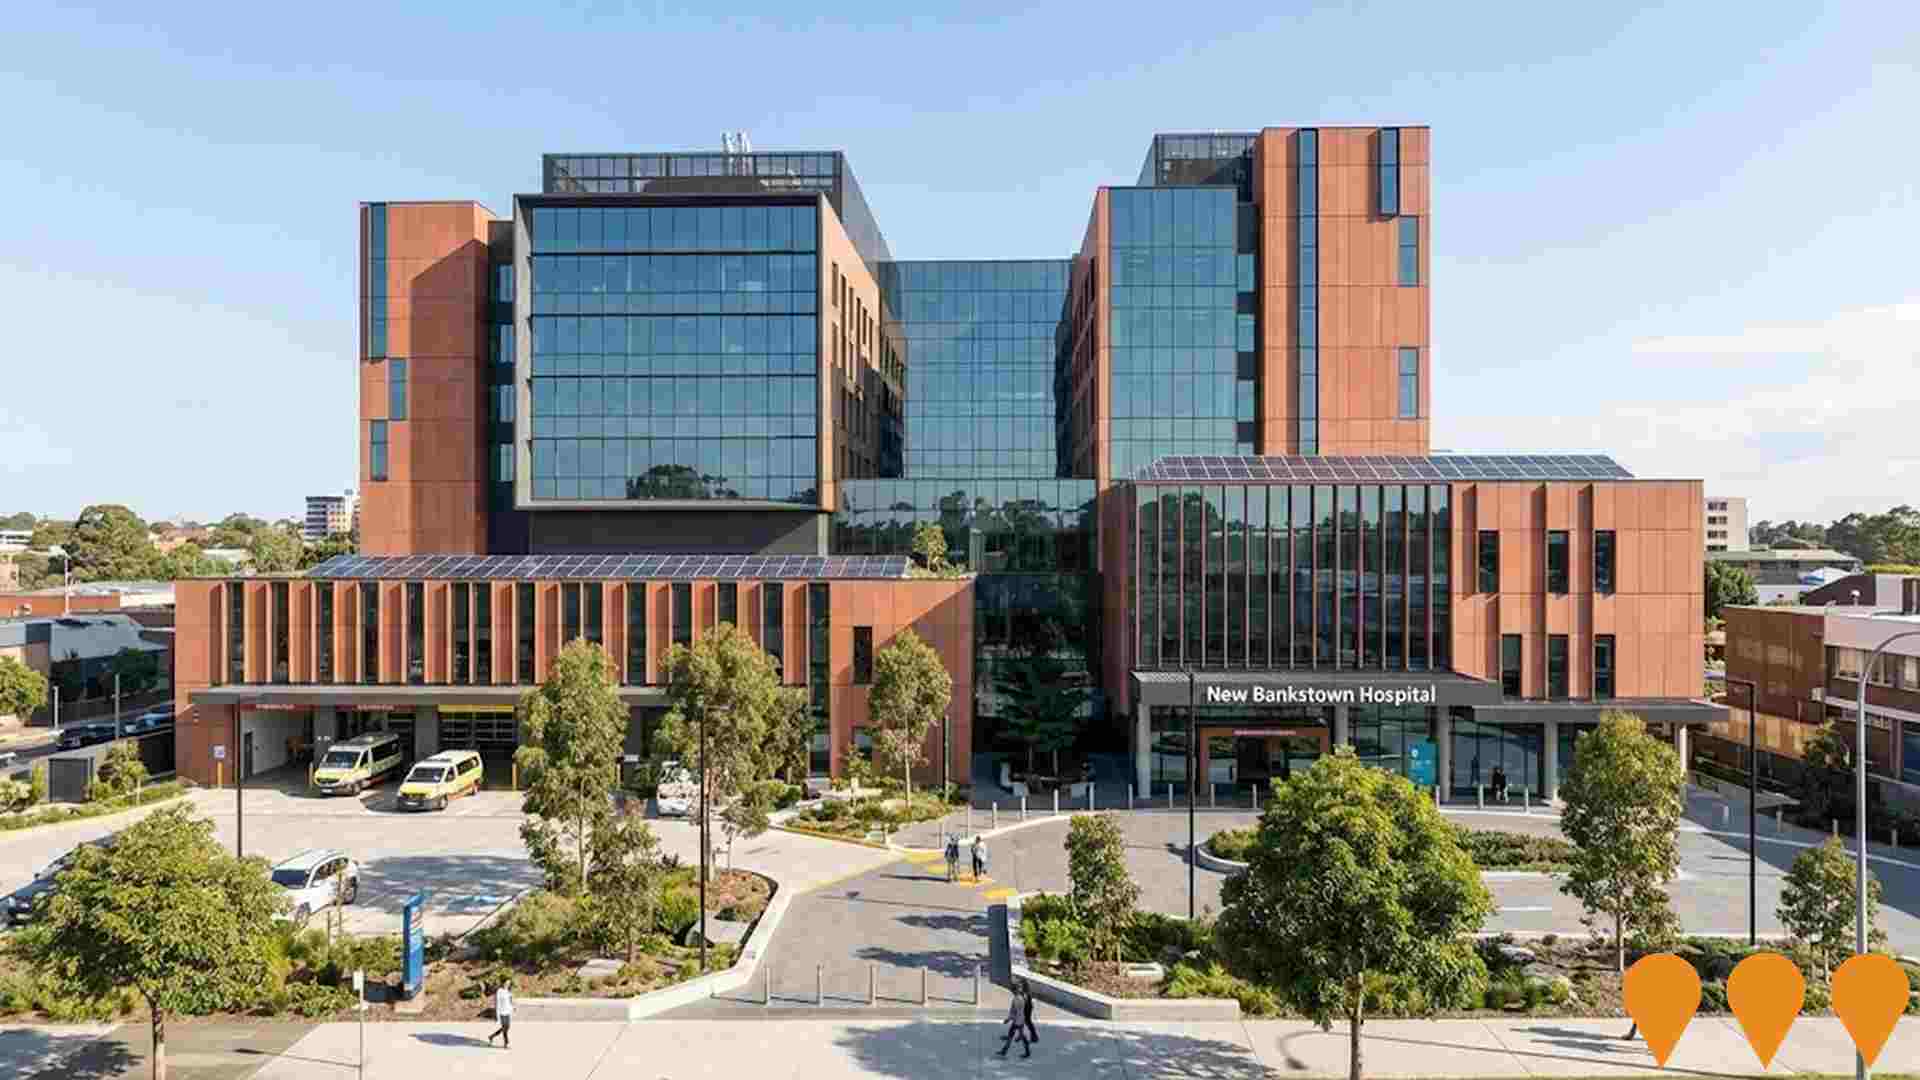
New Bankstown Hospital
The NSW Government is delivering a brand-new $2 billion+ state-of-the-art hospital on the Bankstown TAFE campus site in the Bankstown CBD. This is the largest single investment in a public hospital in NSW history. The new multi-storey facility will deliver expanded emergency, intensive care, operating theatres, maternity, paediatrics, mental health, cancer care, aged care and comprehensive teaching/training facilities. The existing Bankstown-Lidcombe Hospital will transition acute services to the new site upon completion (expected 2031) and be repurposed for community health services. As of December 2025 the project remains in detailed planning with the State Significant Development Application (SSD-46059944) under assessment by the Department of Planning, Housing and Infrastructure. Community consultation continues and early works (site preparation and demolition) are scheduled to commence in 2026 subject to final approvals.
Bankstown CBD Transformation
The comprehensive transformation of the Bankstown CBD is underway. Key components include the Bankstown CBD Upgrade (in construction) and the adoption of the Bankstown City Centre Master Plan (Planning Proposal submitted for Gateway Determination). The Master Plan guides streetscape improvements, new mixed-use developments, enhanced public spaces, and transport connectivity to create a vibrant, walkable city center, celebrating cultural diversity and supporting future growth. Recent completed projects under this umbrella include a $27 million stormwater upgrade, Paul Keating Park Play Space, and The Appian Way Pedestrian Mall transformation. The overall vision is a long-term, multi-developer initiative for Bankstown to become a leading health, education, and jobs hub.

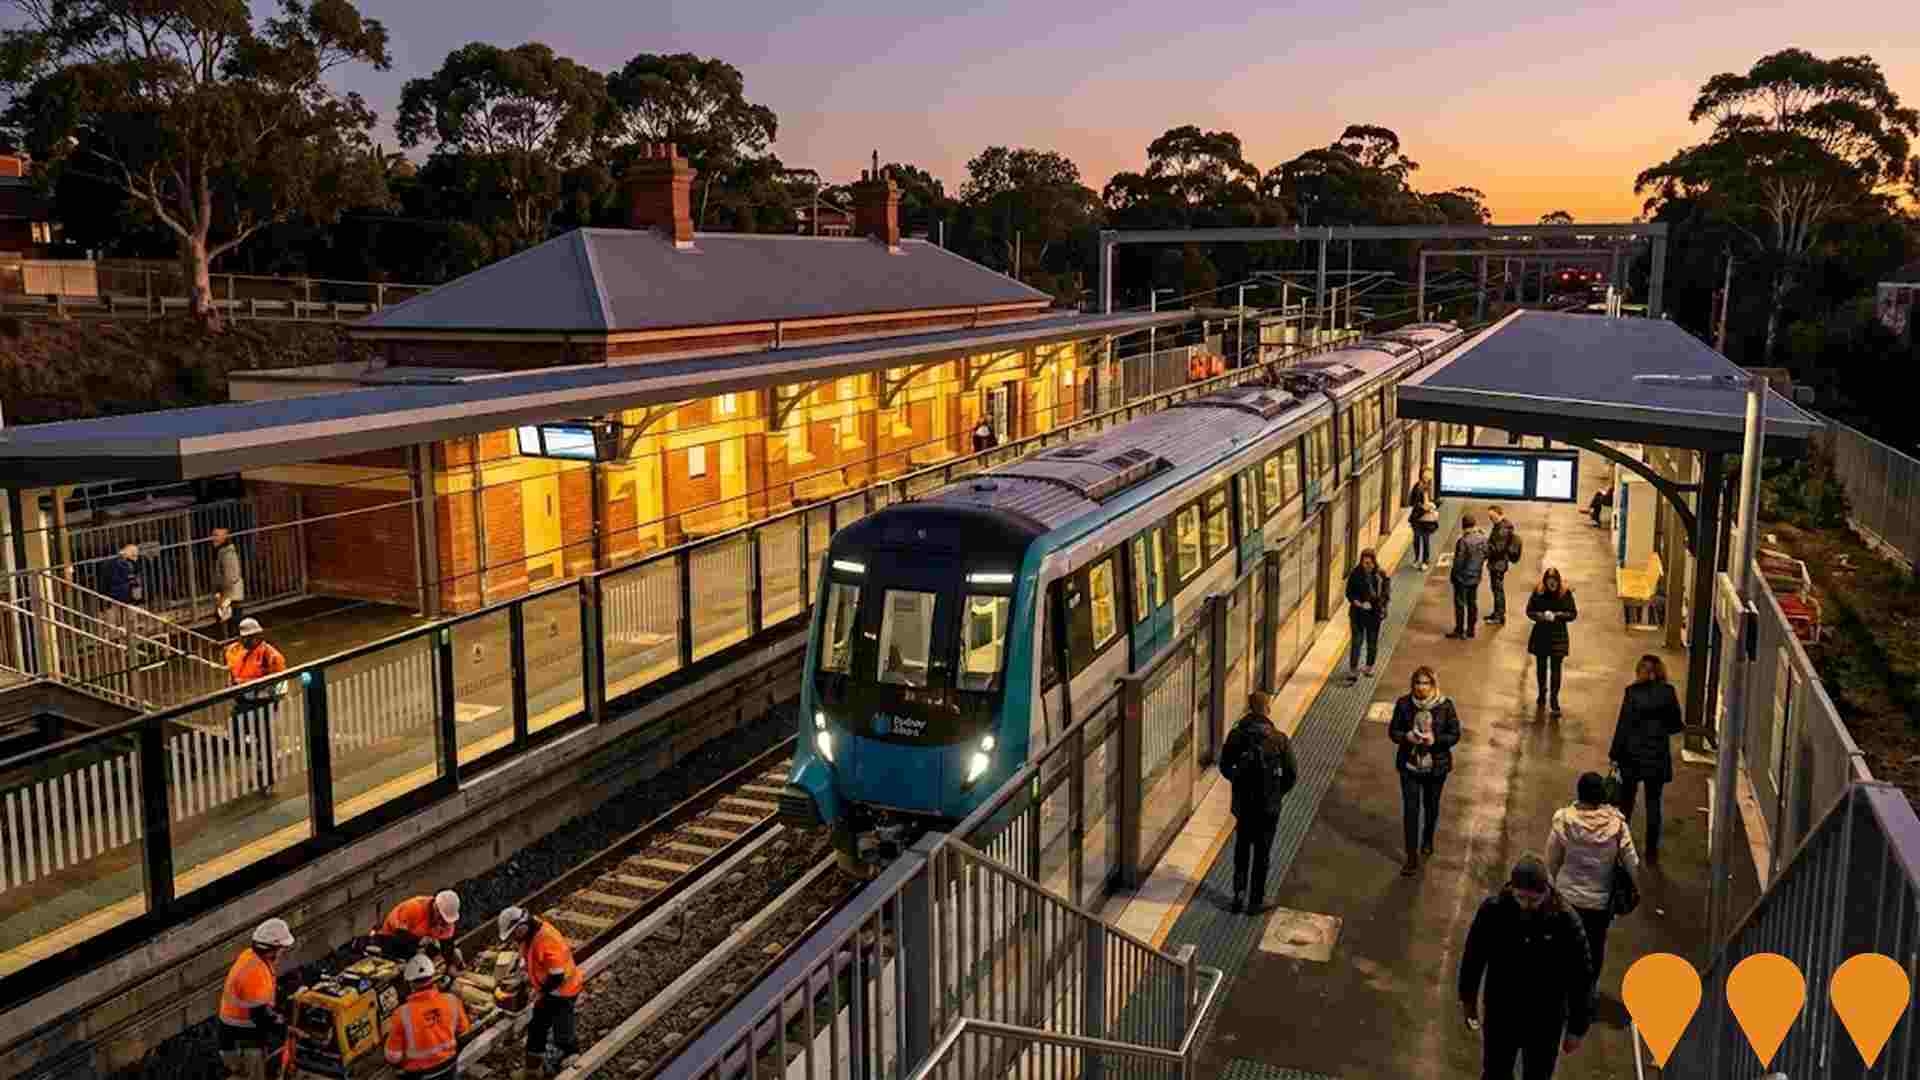
Sydney Metro Bankstown Line Conversion
Conversion of the T3 Bankstown Line between Sydenham and Bankstown to metro standards as part of the Sydney Metro City & Southwest project. Includes upgrades to 11 stations with platform screen doors, new signalling systems, accessibility enhancements (lifts and level access), track modifications, and introduction of autonomous, air-conditioned metro trains with 4-minute peak frequencies. The line closed in September 2024 for intensive conversion works managed by Martinus Rail. Expected to open in 2026 (delayed from earlier targets due to industrial action). Provides fast travel times, e.g., Bankstown to Central in 28 minutes, and forms part of the overall 66 km Sydney Metro network.
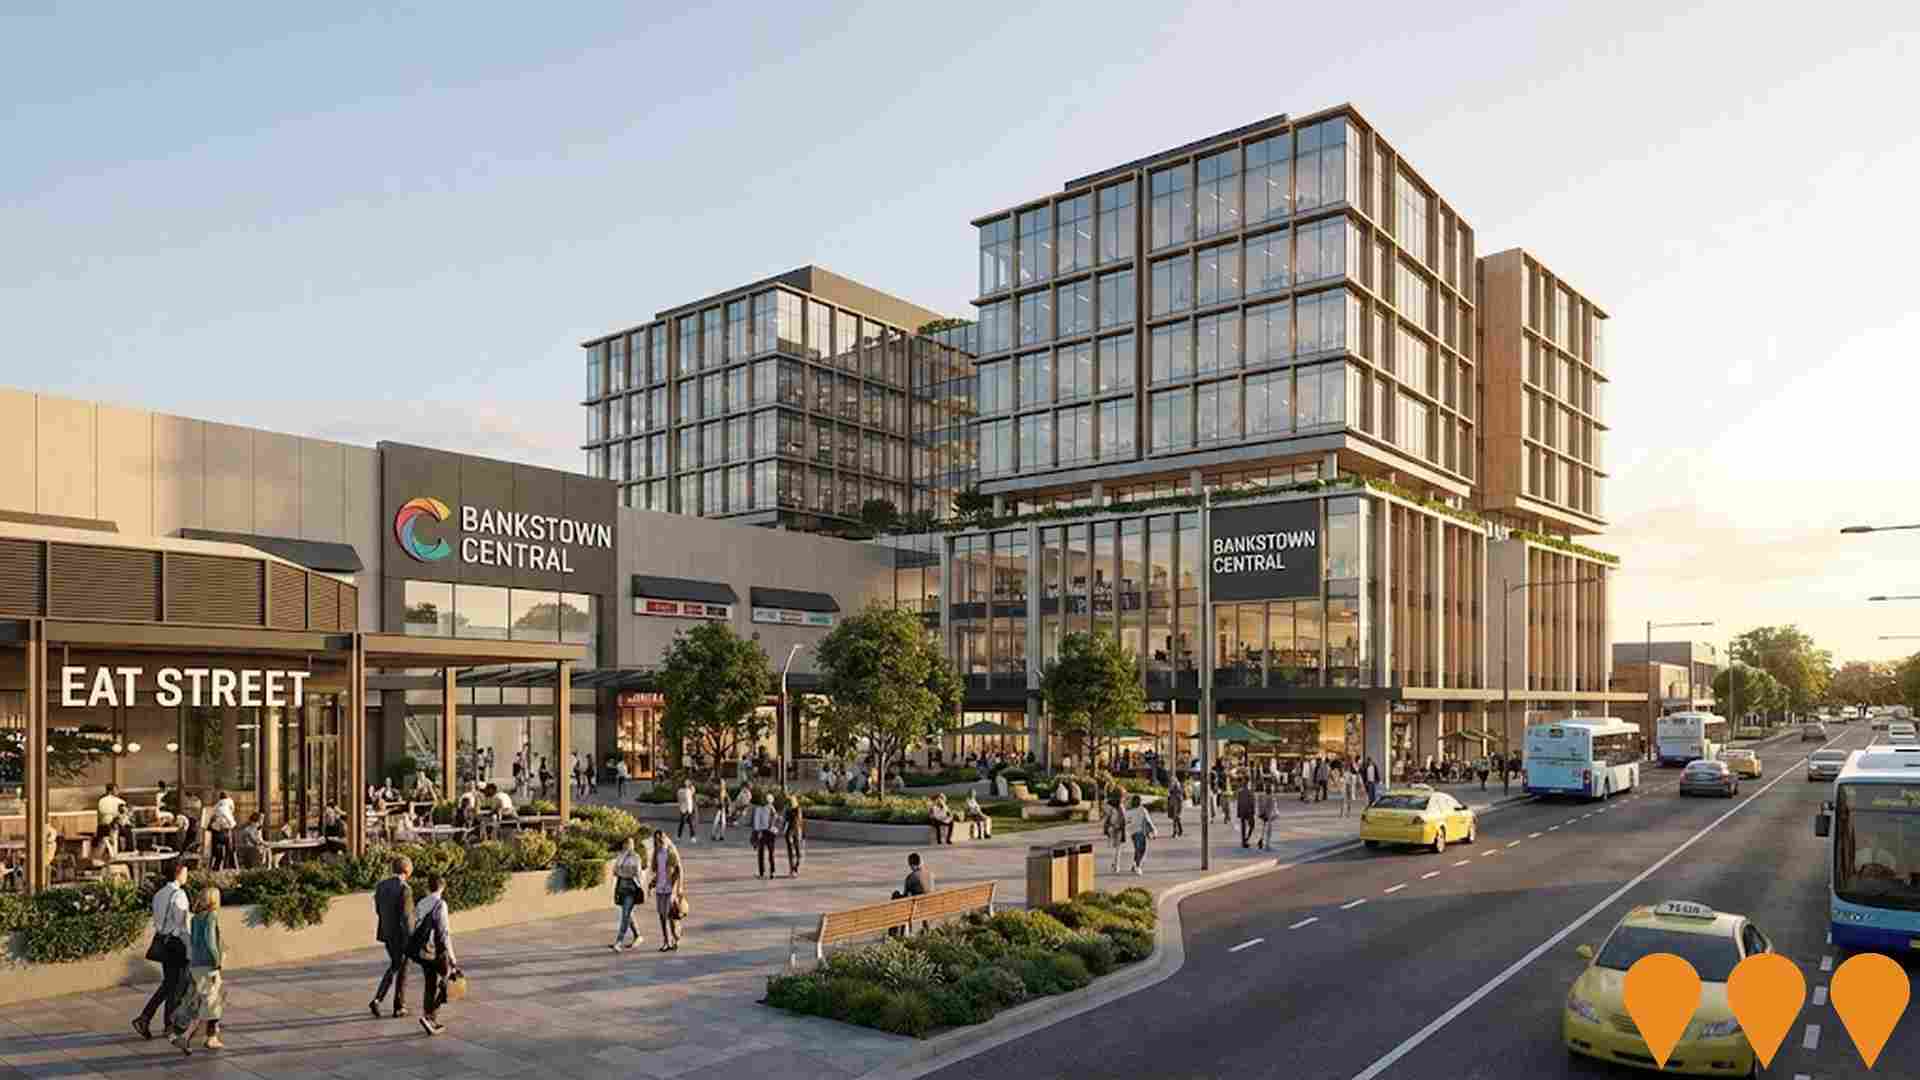
Bankstown Exchange (Stage 1 - Bankstown Central Masterplan)
Stage 1 of the Bankstown Central masterplan delivers approximately 30,000 sqm of A-grade commercial office space across three buildings (two 8-level towers and one 5-level building), ground-floor retail with an activated 'Eat Street' dining precinct, new public plazas, a repositioned bus interchange, basement parking for 320 vehicles, 240 bicycle spaces and end-of-trip facilities. The project is a key catalyst for the Bankstown Health and Education Innovation Precinct.
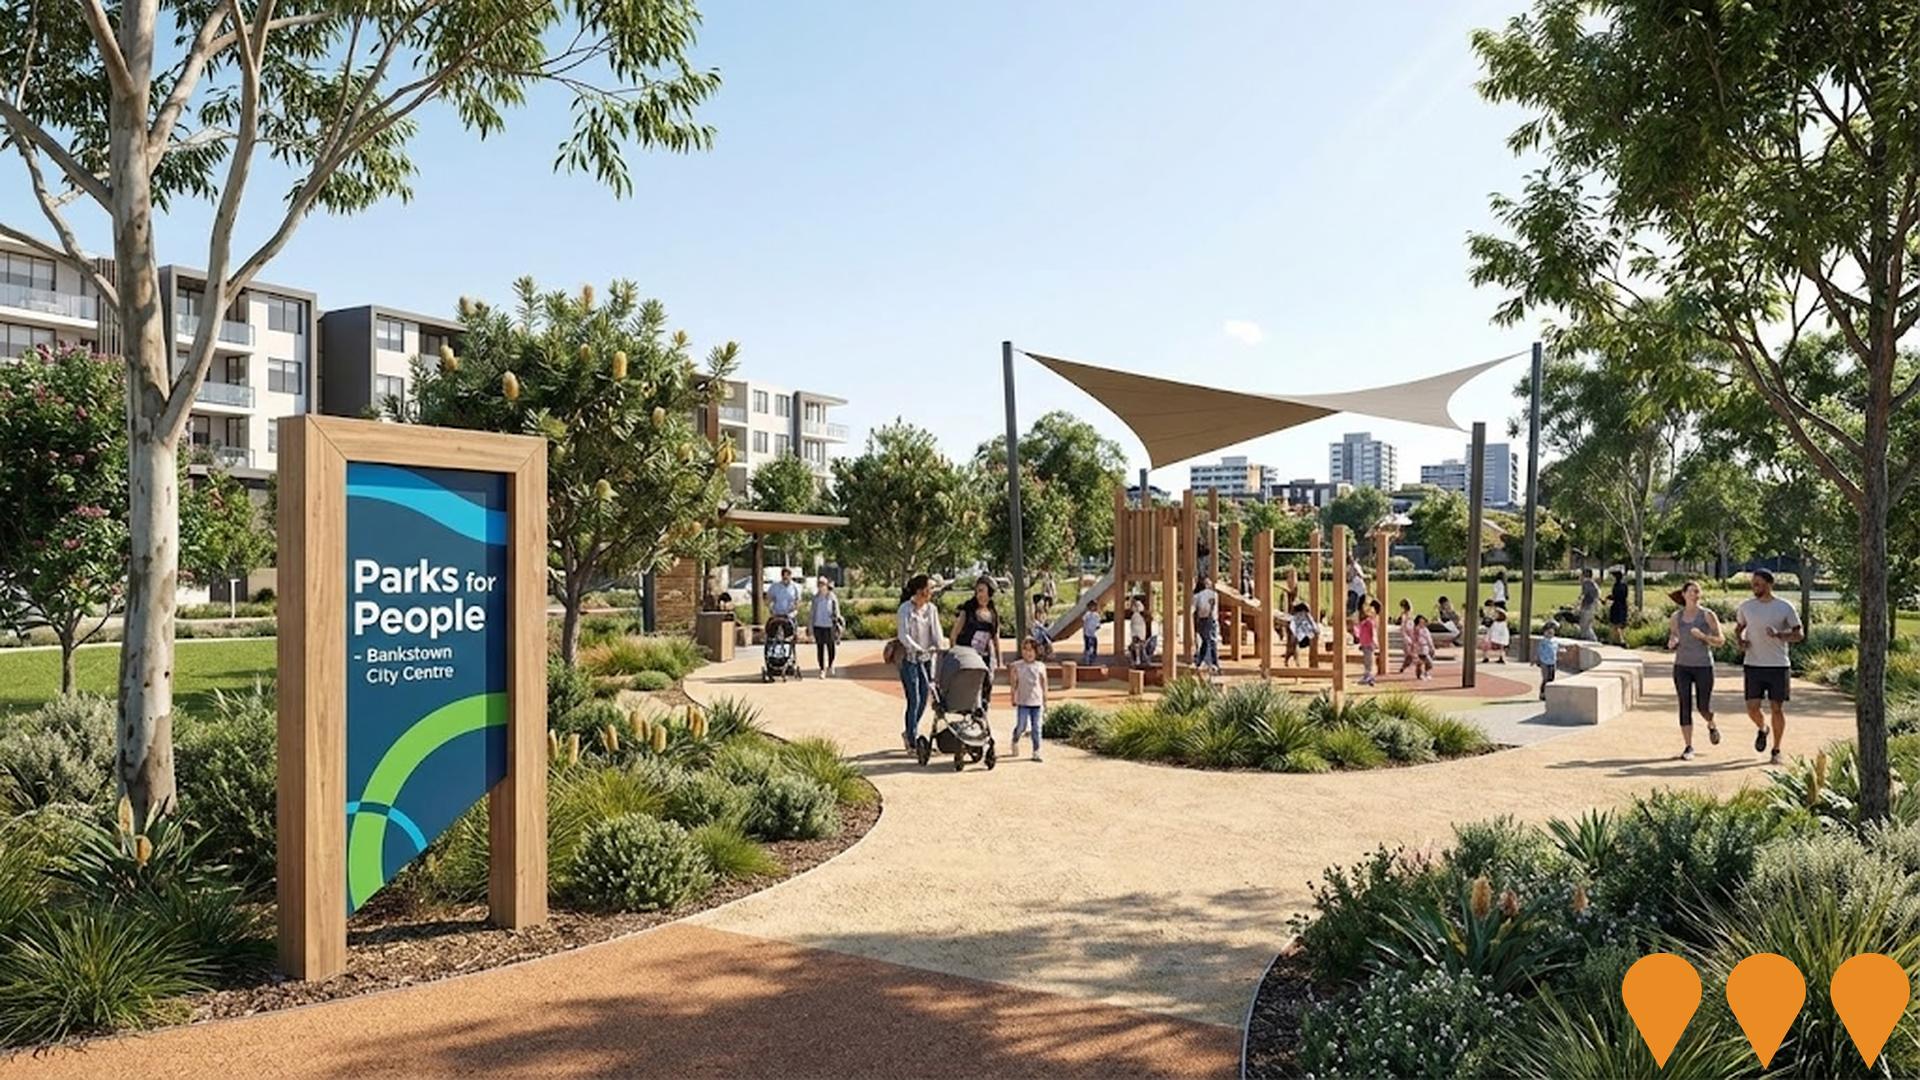
Parks for People Program - Bankstown
NSW Government $50 million Parks for People program delivering new and upgraded public open spaces, parks, playgrounds, community gardens and sports facilities in Bankstown as part of the Transport Oriented Development (TOD) Program to support increased housing density and improve liveability in the Bankstown city centre precinct.
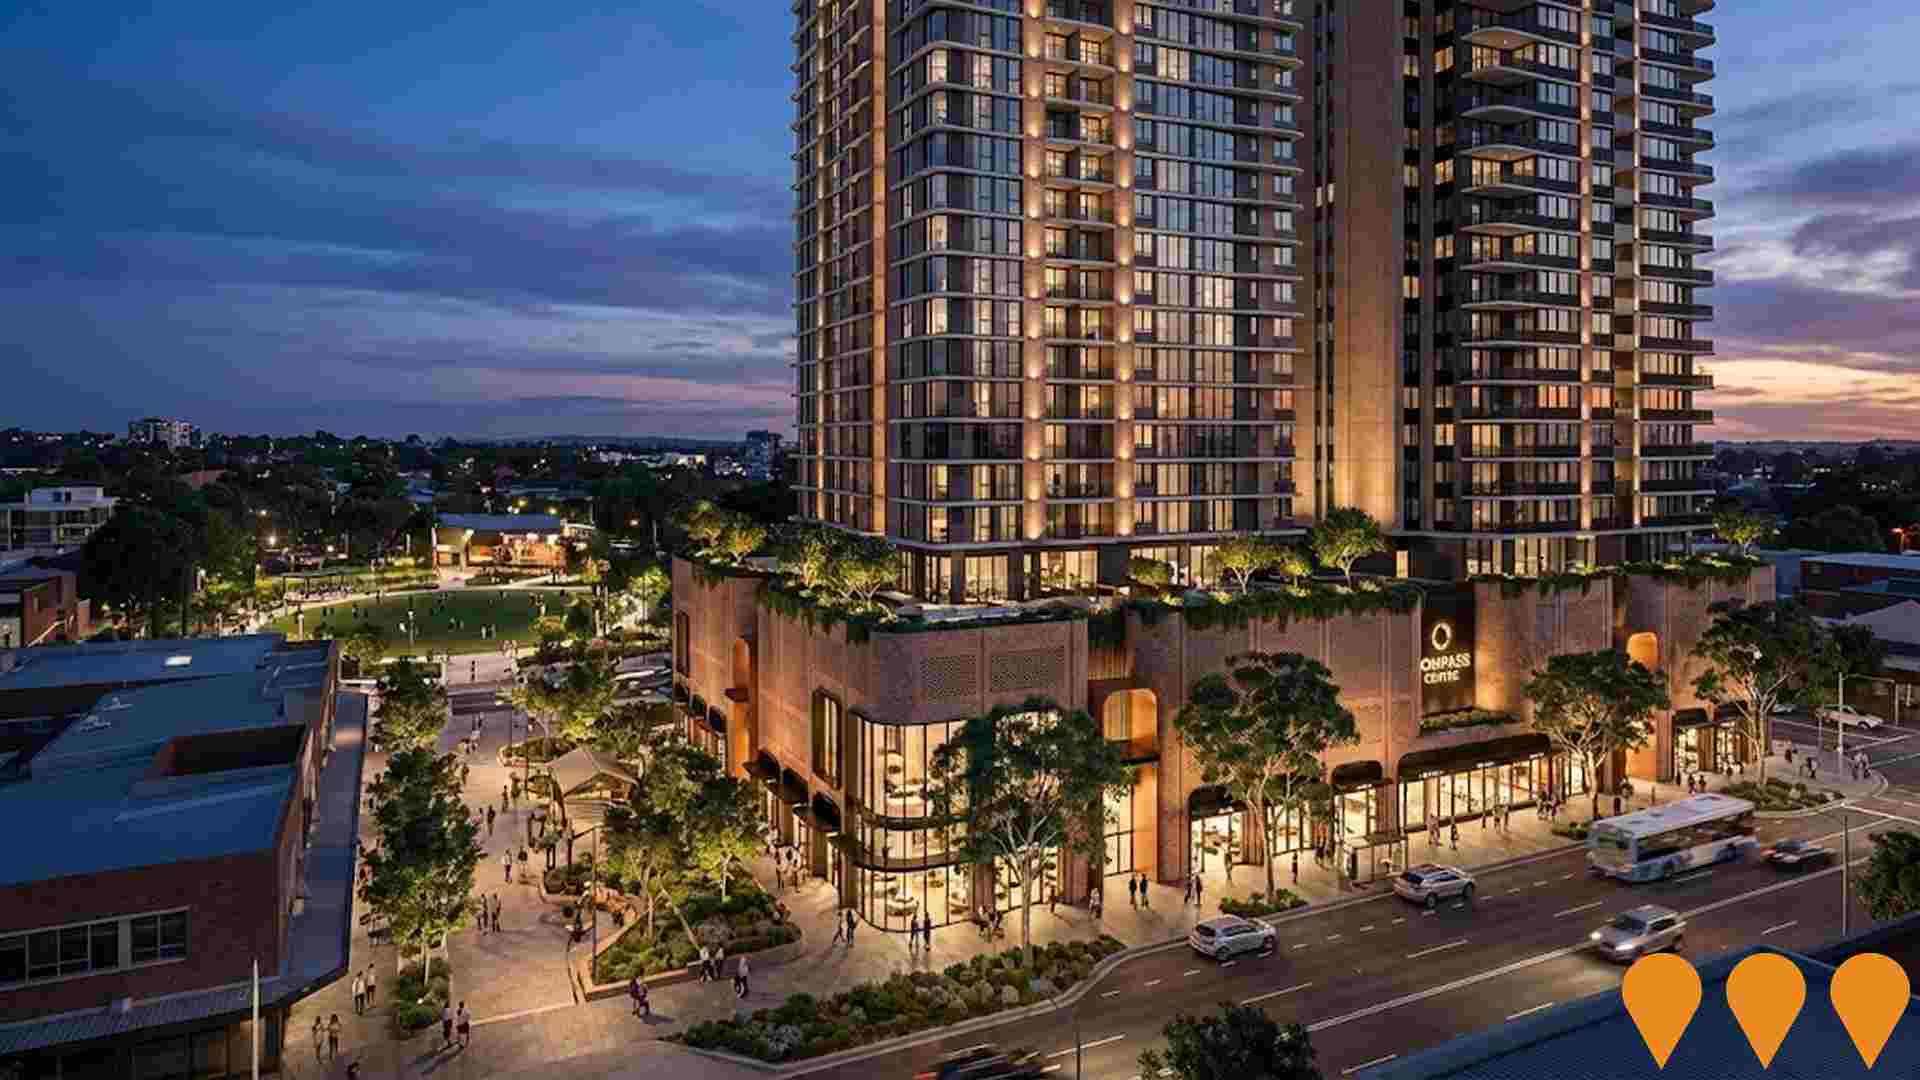
Compass Centre Redevelopment
Redevelopment of the Compass Centre site in Bankstown with demolition of existing structures and construction of a mixed-use precinct featuring a 5-storey podium and three towers: one 19-storey hotel (~169 rooms) and two 24-storey residential build-to-rent towers (339 apartments). Includes retail spaces, supermarket, gym, childcare centre, medical centre, function centre, through-site links to Bankstown Station and Paul Keating Park, enhanced public domain, landscaping, and a two-level basement. SSD application (PPSSDH-182) under assessment as of November 2025.
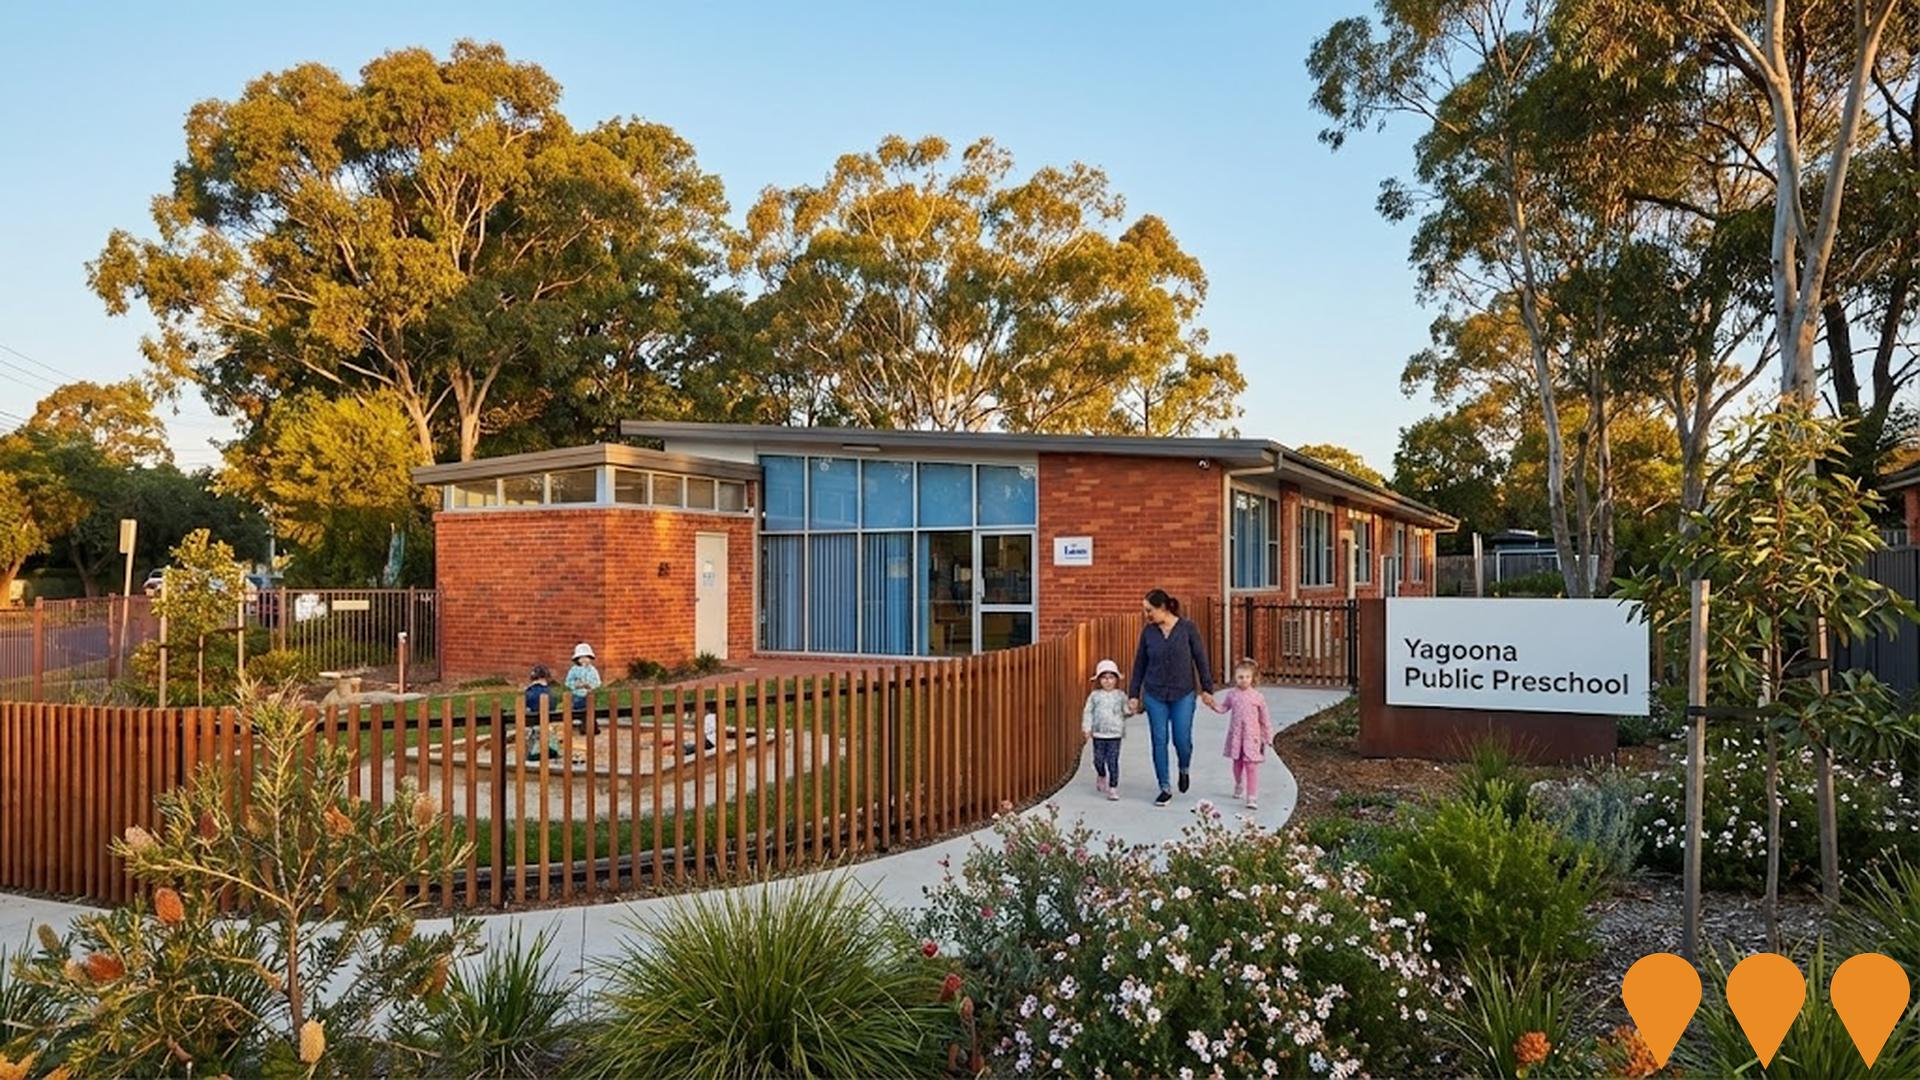
Yagoona Public Preschool
New public preschool facility to be built at Yagoona Public School site as part of NSW Government's $769 million plan to deliver 100 new public preschools. Will provide early childhood education services for local community with completion expected by 2027.
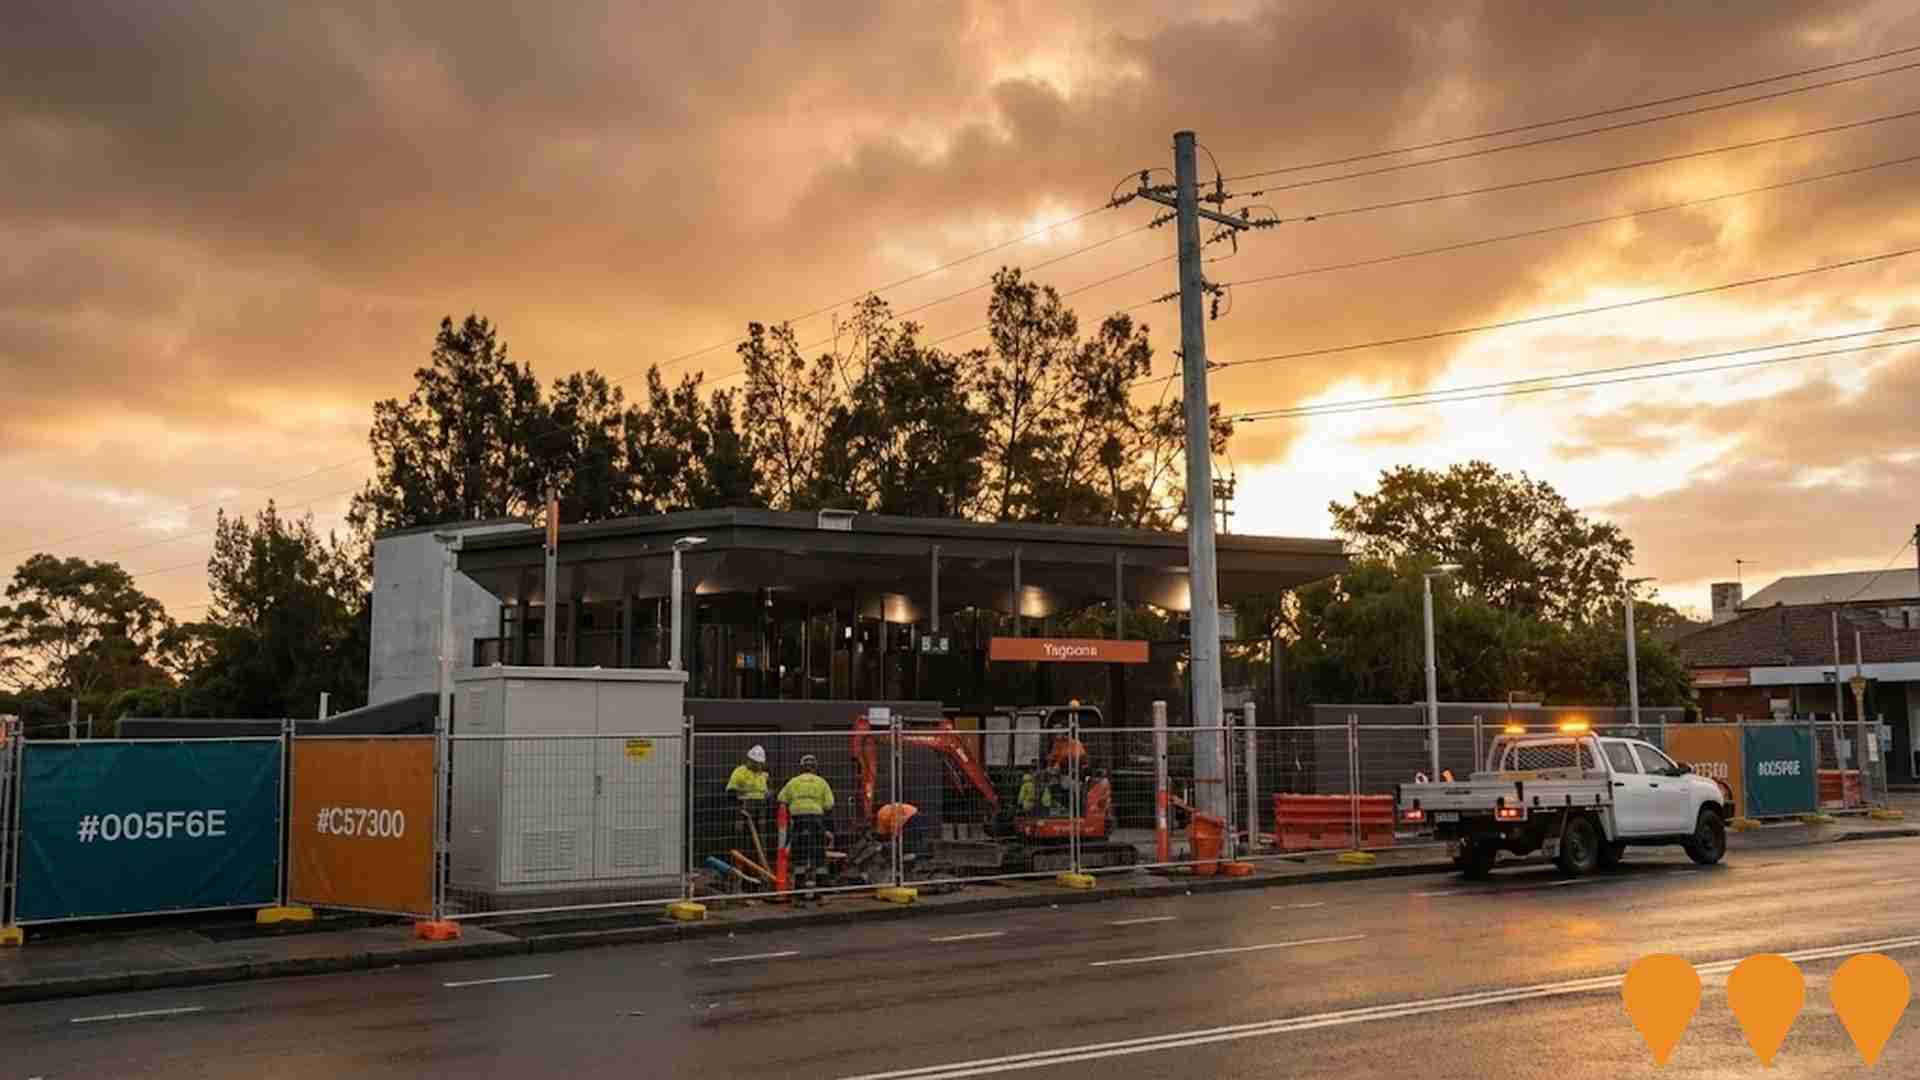
Power Supply Upgrade - Yagoona Station
Electrical infrastructure upgrade at Yagoona Railway Station to support increased capacity and future metro conversion. Part of broader Sydney Metro infrastructure preparation works across the Bankstown line corridor.
Employment
The labour market performance in Yagoona - Birrong lags significantly behind most other regions nationally
Yagoona-Birrong has a skilled workforce with diverse sector representation and an unemployment rate of 9.2%. Over the past year, it experienced an estimated employment growth of 3.0%.
As of September 2025, there are 9,719 residents in work, with an unemployment rate of 5.1%, which is higher than Greater Sydney's rate of 4.2%. The workforce participation rate lags significantly at 44.3% compared to Greater Sydney's 60.0%. Leading employment industries among residents include health care & social assistance, retail trade, and transport, postal & warehousing. Notably, the area has a high concentration in transport, postal & warehousing, with employment levels at 1.8 times the regional average.
However, professional & technical services employ only 6.8% of local workers, below Greater Sydney's 11.5%. The predominantly residential area appears to offer limited employment opportunities locally. Between September 2024 and September 2025, employment levels increased by 3.0%, while the labour force increased by 4.0%, resulting in an unemployment rise of 0.9 percentage points. In comparison, Greater Sydney recorded employment growth of 2.1% and unemployment rising by 0.2 percentage points during the same period. State-level data to November 25, 2025 shows NSW employment contracted by 0.03%, with the state unemployment rate at 3.9%. Nationally, employment is forecast to expand by 6.6% over five years and 13.7% over ten years. Applying these projections to Yagoona-Birrong's employment mix suggests local employment should increase by 6.3% over five years and 13.2% over ten years.
Frequently Asked Questions - Employment
Income
Income figures position the area below 75% of locations analysed nationally by AreaSearch
The median taxpayer income in Yagoona - Birrong SA2 was $41,154 and average income was $52,450 according to postcode level ATO data aggregated by AreaSearch for financial year 2022. These figures are lower than national averages, with Greater Sydney's median income being $56,994 and average income at $80,856. Based on a Wage Price Index growth of 12.61% since financial year 2022, estimated median income for September 2025 would be approximately $46,344 and average income around $59,064. In 2021 Census figures, individual incomes were at the 5th percentile ($528 weekly), while household incomes were at the 32nd percentile. The majority of residents (7,227 people) fall within the $1,500 - 2,999 income bracket, which is 30.9%. Housing affordability pressures are severe with only 78.8% of income remaining, ranking at the 25th percentile.
Frequently Asked Questions - Income
Housing
Yagoona - Birrong displays a diverse mix of dwelling types, with a higher proportion of rental properties than the broader region
In Yagoona-Birrong, as per the latest Census, 67.1% of dwellings were houses, with the remaining 32.9% comprising semi-detached homes, apartments, and other types. This differs from Sydney metropolitan areas, which had 61.5% houses and 38.4% other dwellings. Home ownership in Yagoona-Birrong stood at 30.1%, similar to Sydney metro's rate. Mortgaged dwellings accounted for 31.6%, while rented properties made up 38.2%. The median monthly mortgage repayment was $2,131, below the Sydney metro average of $2,240. Weekly rent in Yagoona-Birrong was $400, compared to Sydney's $425. Nationally, mortgage repayments were higher at $1,863 and rents were lower at $375.
Frequently Asked Questions - Housing
Household Composition
Yagoona - Birrong features high concentrations of family households, with a higher-than-average median household size
Family households constitute 77.8% of all households, including 42.6% couples with children, 17.5% couples without children, and 16.0% single parent families. Non-family households comprise the remaining 22.2%, with lone person households at 19.8% and group households comprising 2.4%. The median household size is 3.2 people, larger than the Greater Sydney average of 3.1.
Frequently Asked Questions - Households
Local Schools & Education
Educational outcomes in Yagoona - Birrong fall within the lower quartile nationally, indicating opportunities for improvement in qualification attainment
The area's university qualification rate is 23.5%, significantly lower than Greater Sydney's average of 38.0%. This presents both a challenge and an opportunity for targeted educational initiatives. Bachelor degrees are the most common at 17.3%, followed by postgraduate qualifications (5.1%) and graduate diplomas (1.1%). Vocational credentials are prominent, with 27.3% of residents aged 15+ holding them - advanced diplomas account for 10.5% and certificates for 16.8%.
Educational participation is high, with 33.9% of residents currently enrolled in formal education. This includes 11.3% in primary education, 9.3% in secondary education, and 6.5% pursuing tertiary education.
Frequently Asked Questions - Education
Schools Detail
Nearby Services & Amenities
Transport
Transport servicing is high compared to other areas nationally based on assessment of service frequency, route connectivity and accessibility
Transport analysis shows 125 active transport stops operating within Yagoona-Birrong area. These comprise a mix of train and bus services. There are 35 individual routes servicing these stops, collectively providing 6466 weekly passenger trips.
Transport accessibility is rated excellent, with residents typically located 139 meters from the nearest stop. Service frequency averages 923 trips per day across all routes, equating to approximately 51 weekly trips per individual stop.
Frequently Asked Questions - Transport
Transport Stops Detail
Health
Yagoona - Birrong's residents are extremely healthy with younger cohorts in particular seeing very low prevalence of common health conditions
Analysis of health metrics shows strong performance throughout Yagoona-Birrong. Younger cohorts in particular have a very low prevalence of common health conditions. The rate of private health cover is extremely low at approximately 46% of the total population (~10,806 people), compared to 48.6% across Greater Sydney and the national average of 55.3%.
The most common medical conditions in the area are arthritis and asthma, impacting 6.0 and 6.0% of residents respectively, while 76.1% declare themselves completely clear of medical ailments compared to 75.8% across Greater Sydney. The area has 16.0% of residents aged 65 and over (3,747 people). Health outcomes among seniors are above average but require more attention than the broader population.
Frequently Asked Questions - Health
Cultural Diversity
Yagoona - Birrong is among the most culturally diverse areas in the country based on AreaSearch assessment of a range of language and cultural background related metrics
Yagoona-Birrong is among the most culturally diverse areas in Australia, with 47.4 percent of its population born overseas and 69.8 percent speaking a language other than English at home. The predominant religion in Yagoona-Birrong, as of recent data, is Christianity, comprising 41.5 percent of the population. However, Islam is notably overrepresented, making up 33.0 percent of the population, compared to the Greater Sydney average of 27.9 percent.
Regarding ancestry, the top three groups in Yagoona-Birrong are 'Other', at 20.4 percent; Lebanese, at 18.4 percent; and Vietnamese, at 14.7 percent, which is substantially higher than the regional average of 8.5 percent. There are also notable divergences in the representation of certain other ethnic groups: Macedonian is overrepresented at 3.1 percent (versus 1.7 percent regionally), Samoan at 0.7 percent (versus 0.5 percent), and Chinese at 7.7 percent (versus 7.6 percent).
Frequently Asked Questions - Diversity
Age
Yagoona - Birrong's population is younger than the national pattern
Yagoona - Birrong has a median age of 35 years, which is younger than Greater Sydney's 37 and the national average of 38. The age group 5-14 makes up 14.0% of the population, higher than Greater Sydney's figure. Meanwhile, the 35-44 age cohort accounts for 12.8%, lower than other areas. Between 2021 and present, the 75 to 84 age group has increased from 4.1% to 5.0%. Conversely, the 55 to 64 age group has decreased from 11.7% to 10.7%. By 2041, population forecasts show significant changes in Yagoona - Birrong's demographics. The 75 to 84 age cohort is projected to rise by 884 people (75%), from 1,176 to 2,061. Notably, the combined 65+ age groups will account for 69% of total population growth. However, both the 5-14 and 0-4 age groups are expected to decrease in numbers.
