Chart Color Schemes
This analysis uses ABS Statistical Areas Level 2 (SA2) boundaries, which can materially differ from Suburbs and Localities (SAL) even when sharing similar names.
SA2 boundaries are defined by the Australian Bureau of Statistics and are designed to represent communities for statistical reporting (e.g., census and ERP).
Suburbs and Localities (SAL) represent commonly-used suburb/locality names (postal-style areas) and may use different geographic boundaries. For comprehensive analysis, consider reviewing both boundary types if available.
est. as @ -- *
ABS ERP | -- people | --
2021 Census | -- people
Sales Activity
Curious about local property values? Filter the chart to assess the volume and appreciation (including resales) trends and regional comparisons, or scroll to the map below view this information at an individual property level.
Find a Recent Sale
Sales Detail
Population
Population growth drivers in Wallsend - Elermore Vale are slightly above average based on AreaSearch's ranking of recent, and medium term trends
Wallsend-Elermore Vale's population is approximately 21,849 as of November 2025. This figure represents an increase of 891 people since the 2021 Census, which reported a population of 20,958. The growth is inferred from the estimated resident population of 21,691 in June 2024 and an additional 262 validated new addresses since the Census date. The population density is around 1,015 persons per square kilometer. Wallsend-Elermore Vale's population grew by 4.3% between the Census and November 2025, which is within 0.8 percentage points of the non-metro area growth rate of 5.1%. Overseas migration contributed approximately 62.0% of overall population gains during recent periods.
AreaSearch uses ABS/Geoscience Australia projections for each SA2 area released in 2024 with a base year of 2022, and NSW State Government's SA2 level projections for areas not covered by this data, released in 2022 with a base year of 2021. Growth rates by age group from these aggregations are applied to all areas for the years 2032 to 2041. Based on demographic trends and latest annual ERP population numbers, Wallsend-Elermore Vale is projected to expand by 3,041 persons by 2041, reflecting a total increase of 13.2% over the 17-year period.
Frequently Asked Questions - Population
Development
AreaSearch assessment of residential approval activity sees Wallsend - Elermore Vale among the top 30% of areas assessed nationwide
Wallsend-Elermore Vale has seen approximately 91 new homes approved annually. Between FY2021 and FY2025, around 456 homes were approved, with an additional 43 approved in FY2026 so far. Each dwelling built over these years resulted in an average of 2.2 new residents yearly, indicating strong demand that supports property values.
New homes are being constructed at an average cost of $225,000, which is below the regional average, suggesting more affordable housing options for buyers. In FY2026, $10.4 million in commercial approvals have been registered, demonstrating moderate levels of commercial development. Compared to Rest of NSW, Wallsend-Elermore Vale has around three-quarters the rate of new dwelling approvals per person and ranks among the 55th percentile nationally for areas assessed. New developments consist of 30.0% detached dwellings and 70.0% attached dwellings, reflecting a shift from the current housing mix of 80.0% houses due to reduced development site availability and changing lifestyle demands and affordability requirements. Wallsend-Elermore Vale has around 337 people per dwelling approval, indicating characteristics of a low-density area.
By 2041, Wallsend-Elermore Vale is projected to grow by approximately 2,883 residents (latest AreaSearch quarterly estimate). Development is keeping pace with projected growth, though buyers may face increasing competition as the population expands.
Frequently Asked Questions - Development
Infrastructure
Wallsend - Elermore Vale has strong levels of nearby infrastructure activity, ranking in the top 30% nationally
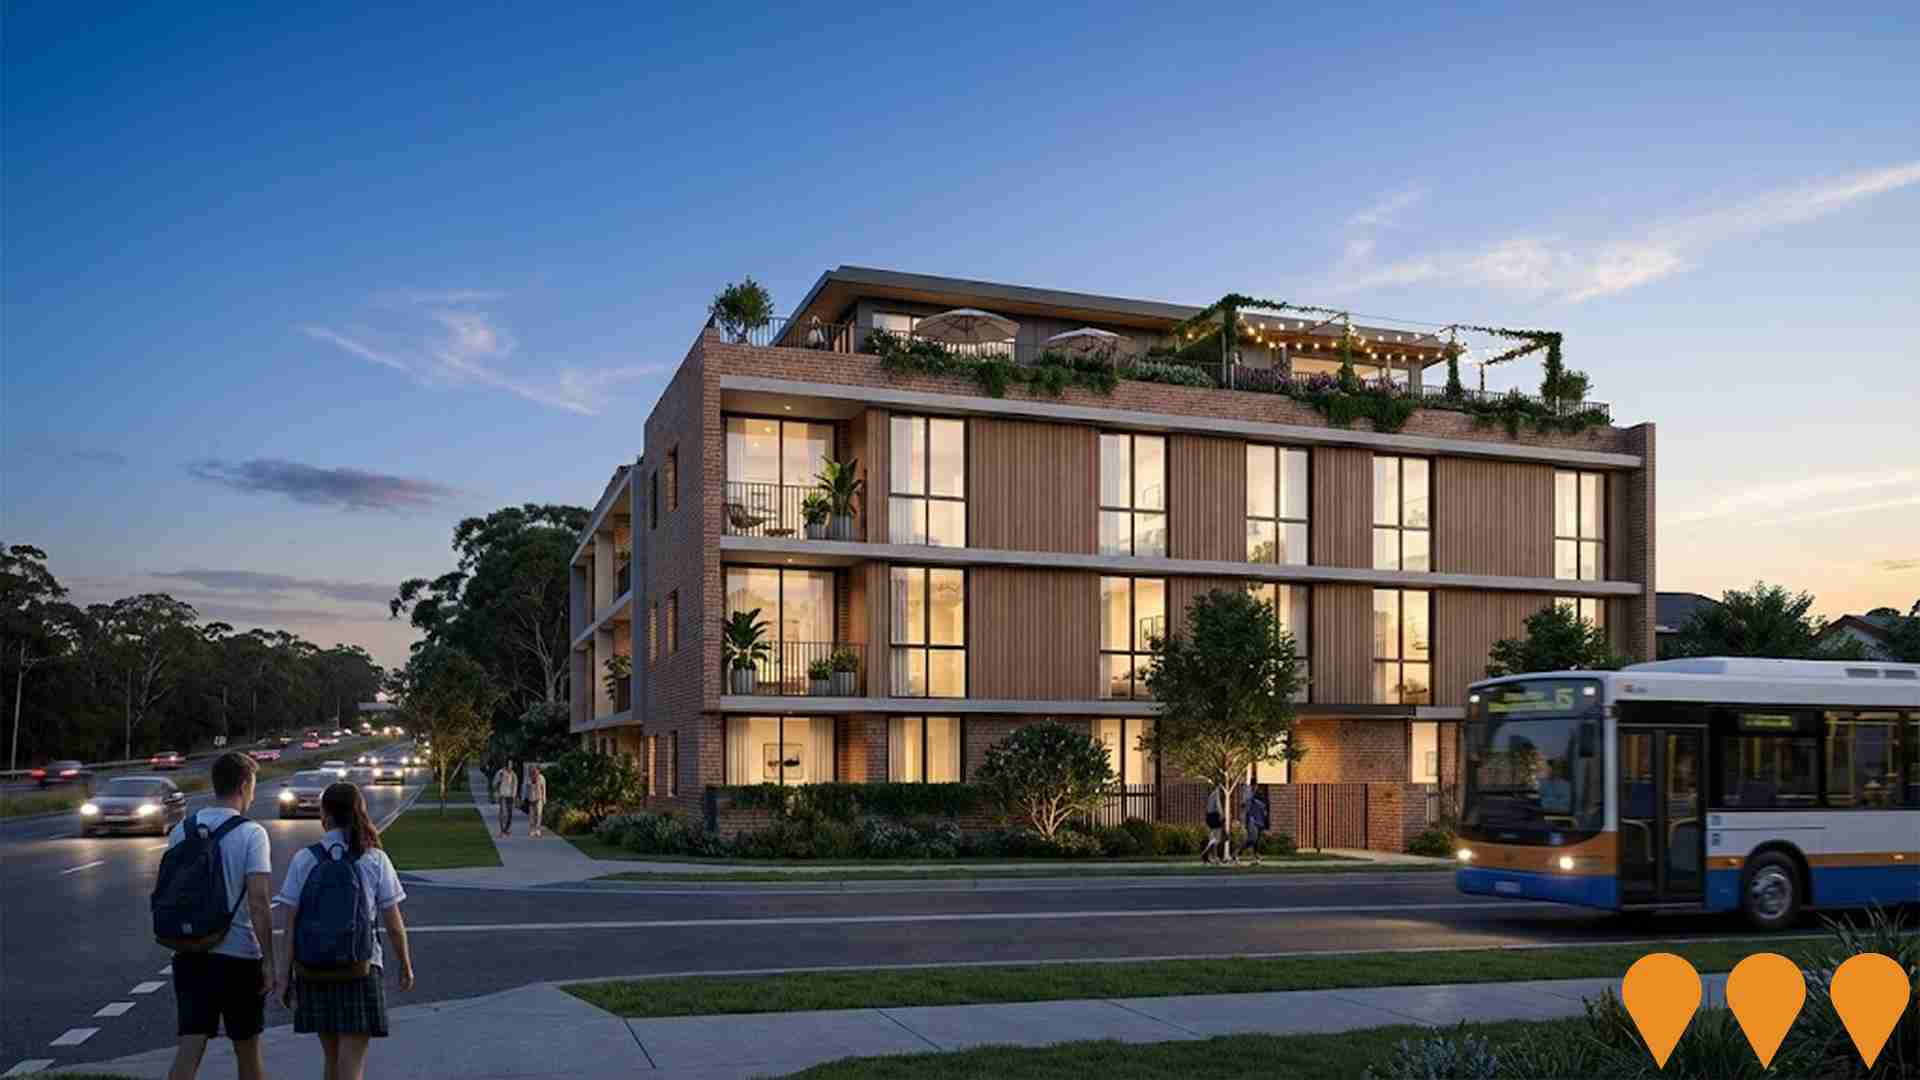
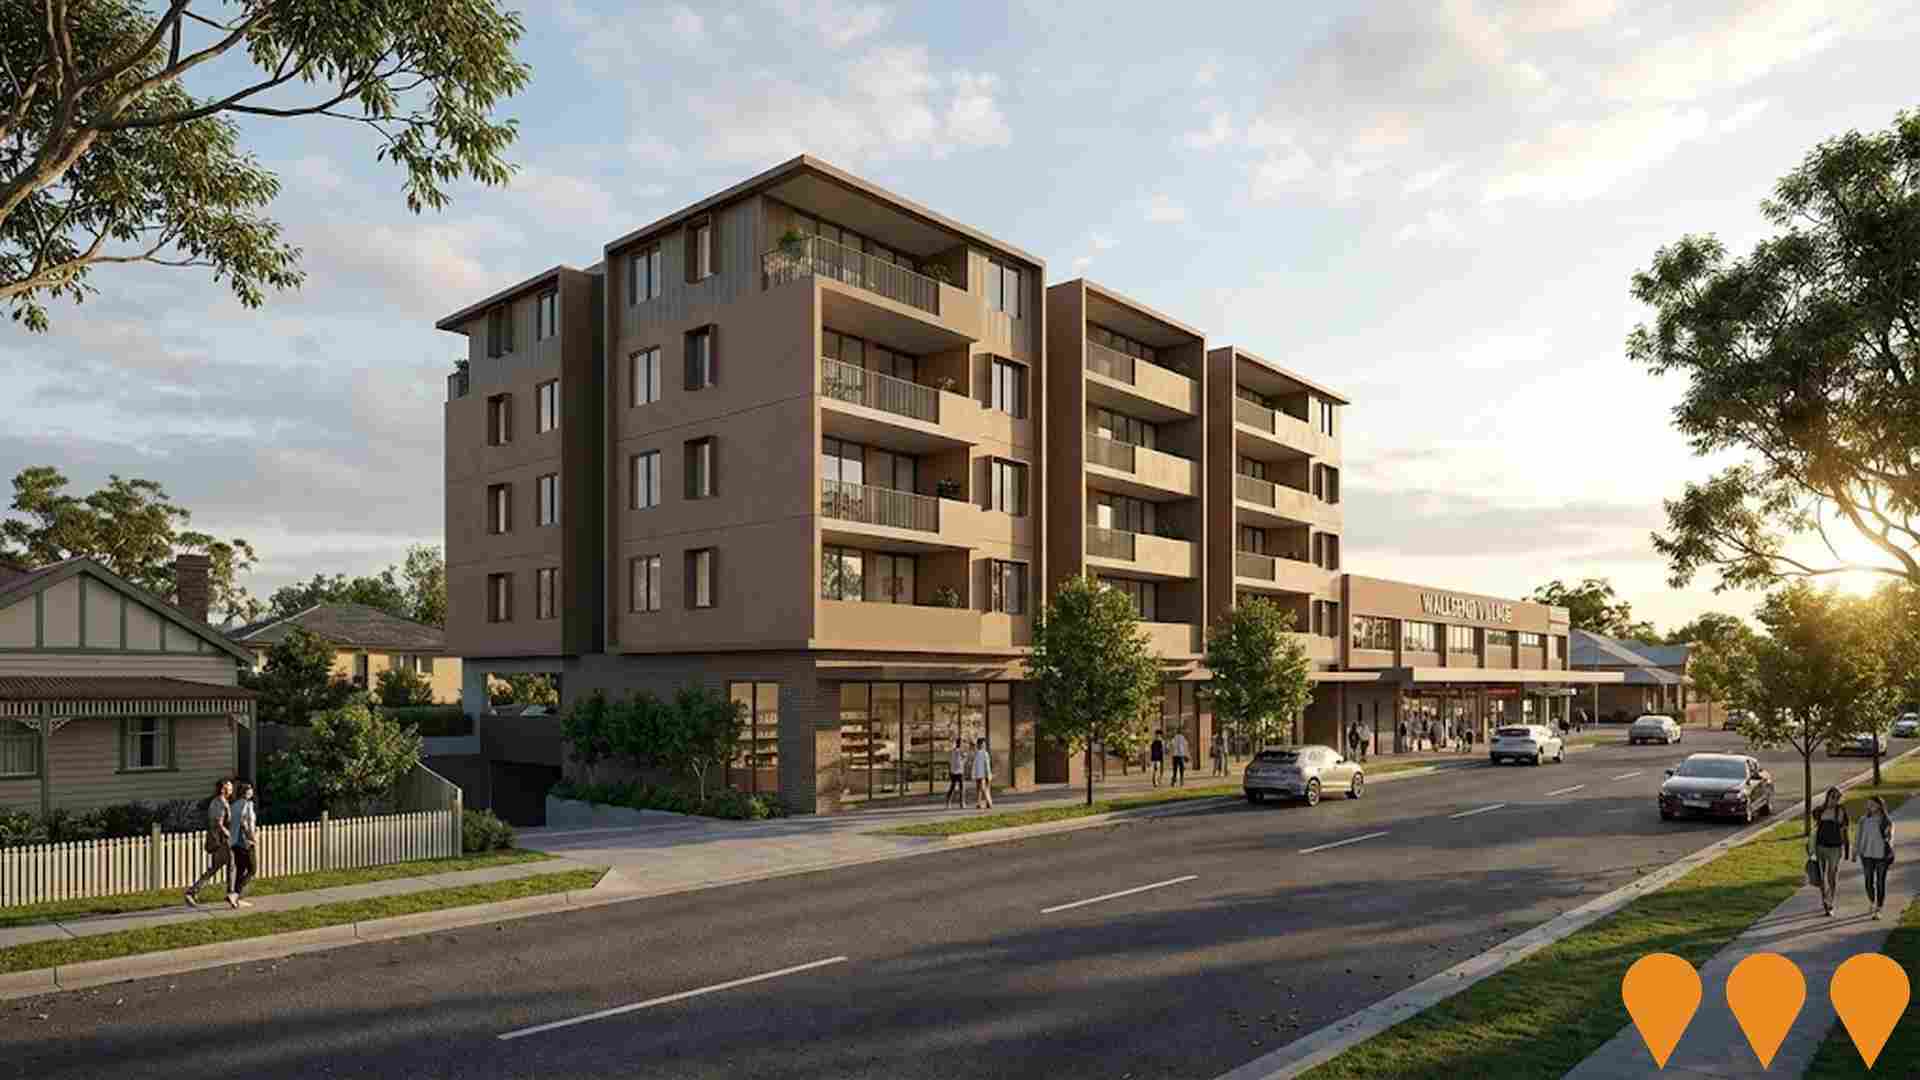
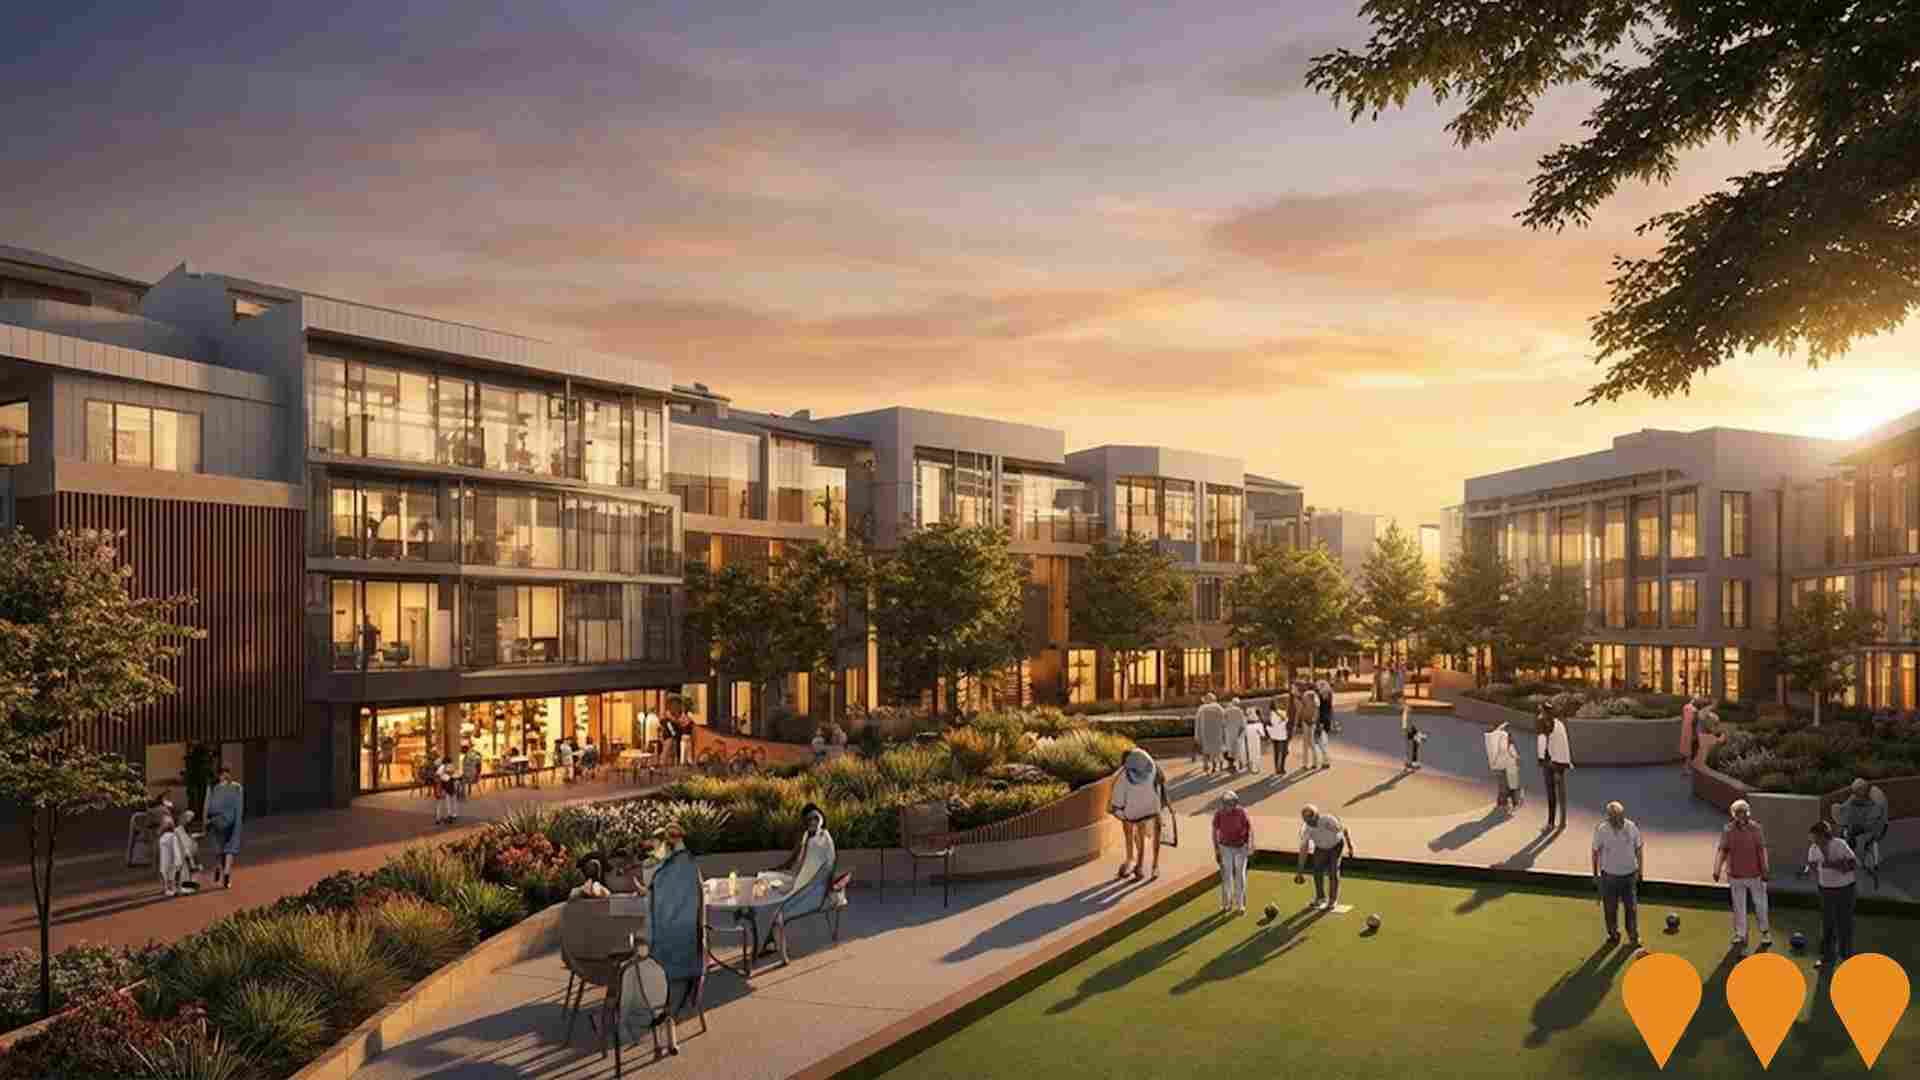
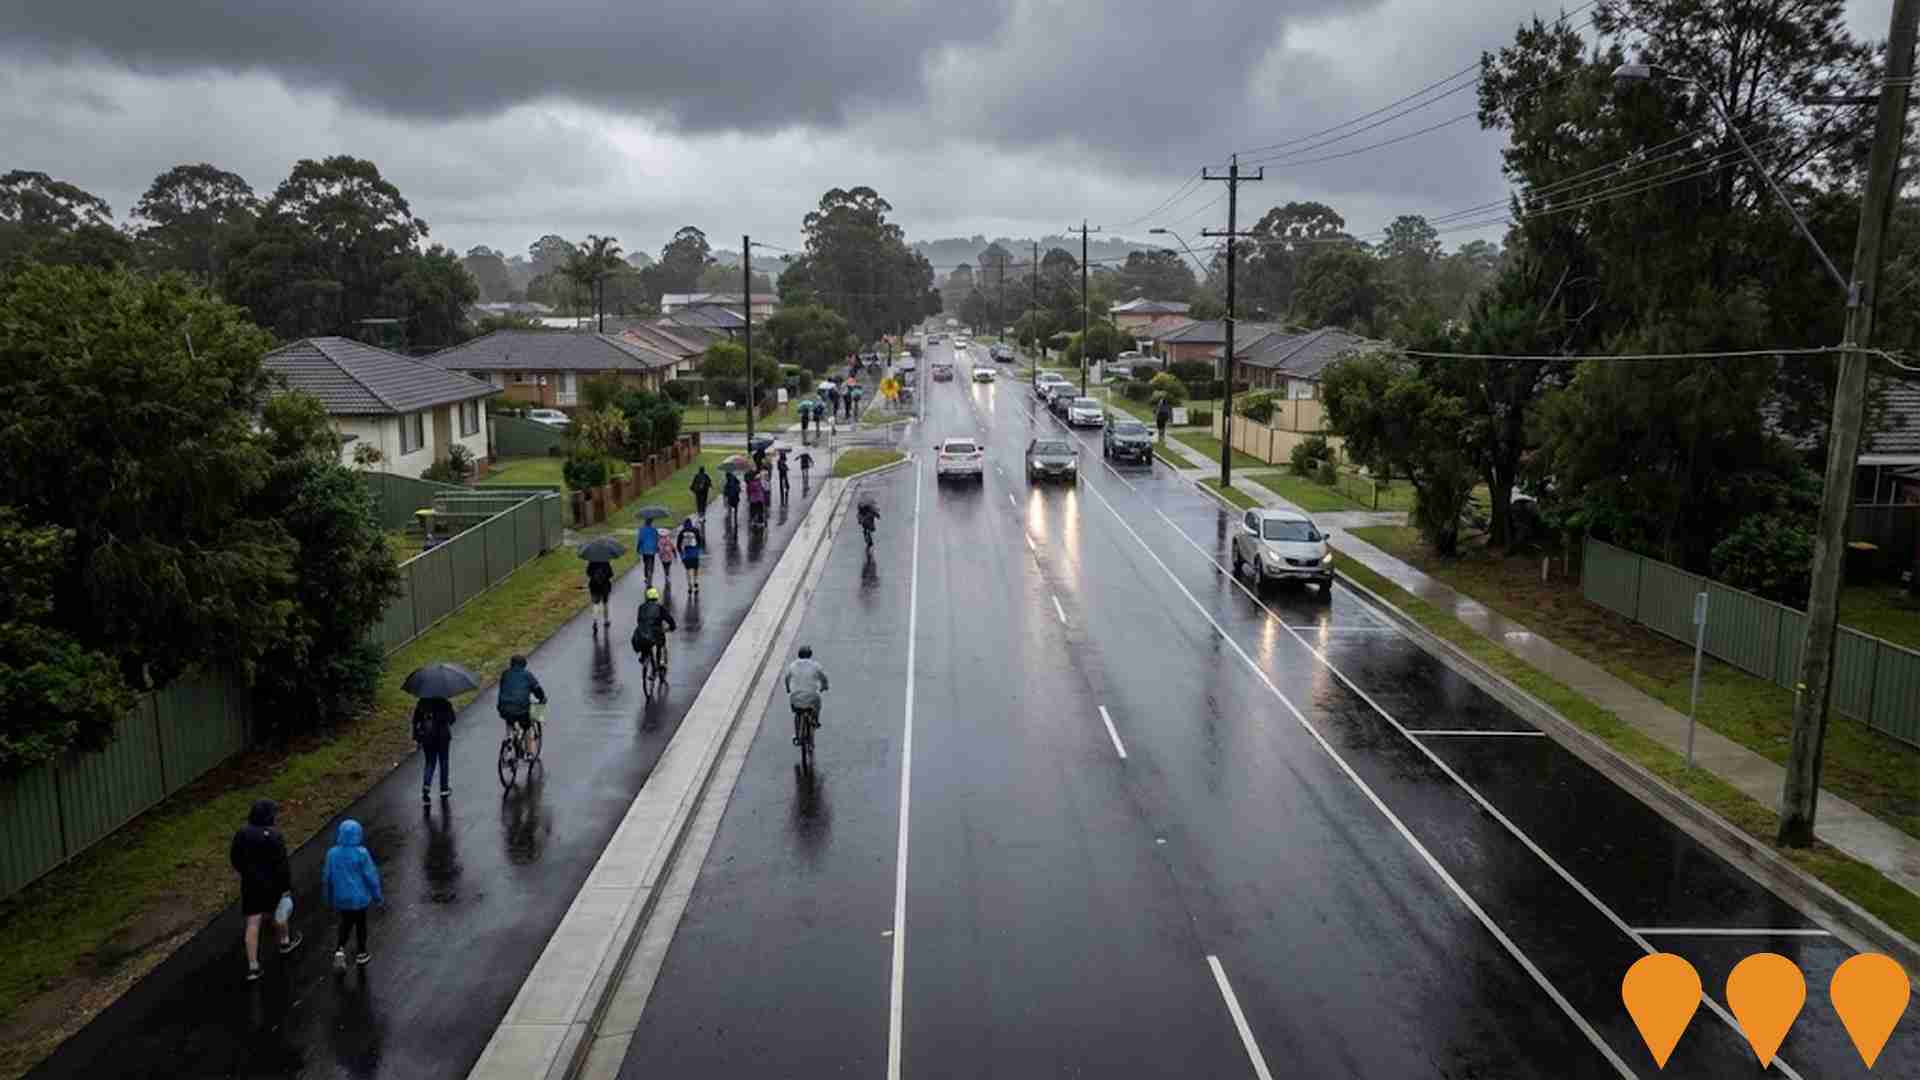
Changes in local infrastructure, major projects, and planning initiatives significantly impact an area's performance. AreaSearch has identified 38 projects likely to affect the area. Notable ones include Western Corridor Road Upgrades - Longworth Avenue and Minmi Road, 6-10 Council Street Apartments, Duncan Close Residential Development, and Infinite Early Learning Elermore Vale. The following list details those most relevant.
Professional plan users can use the search below to filter and access additional projects.
INFRASTRUCTURE SEARCH
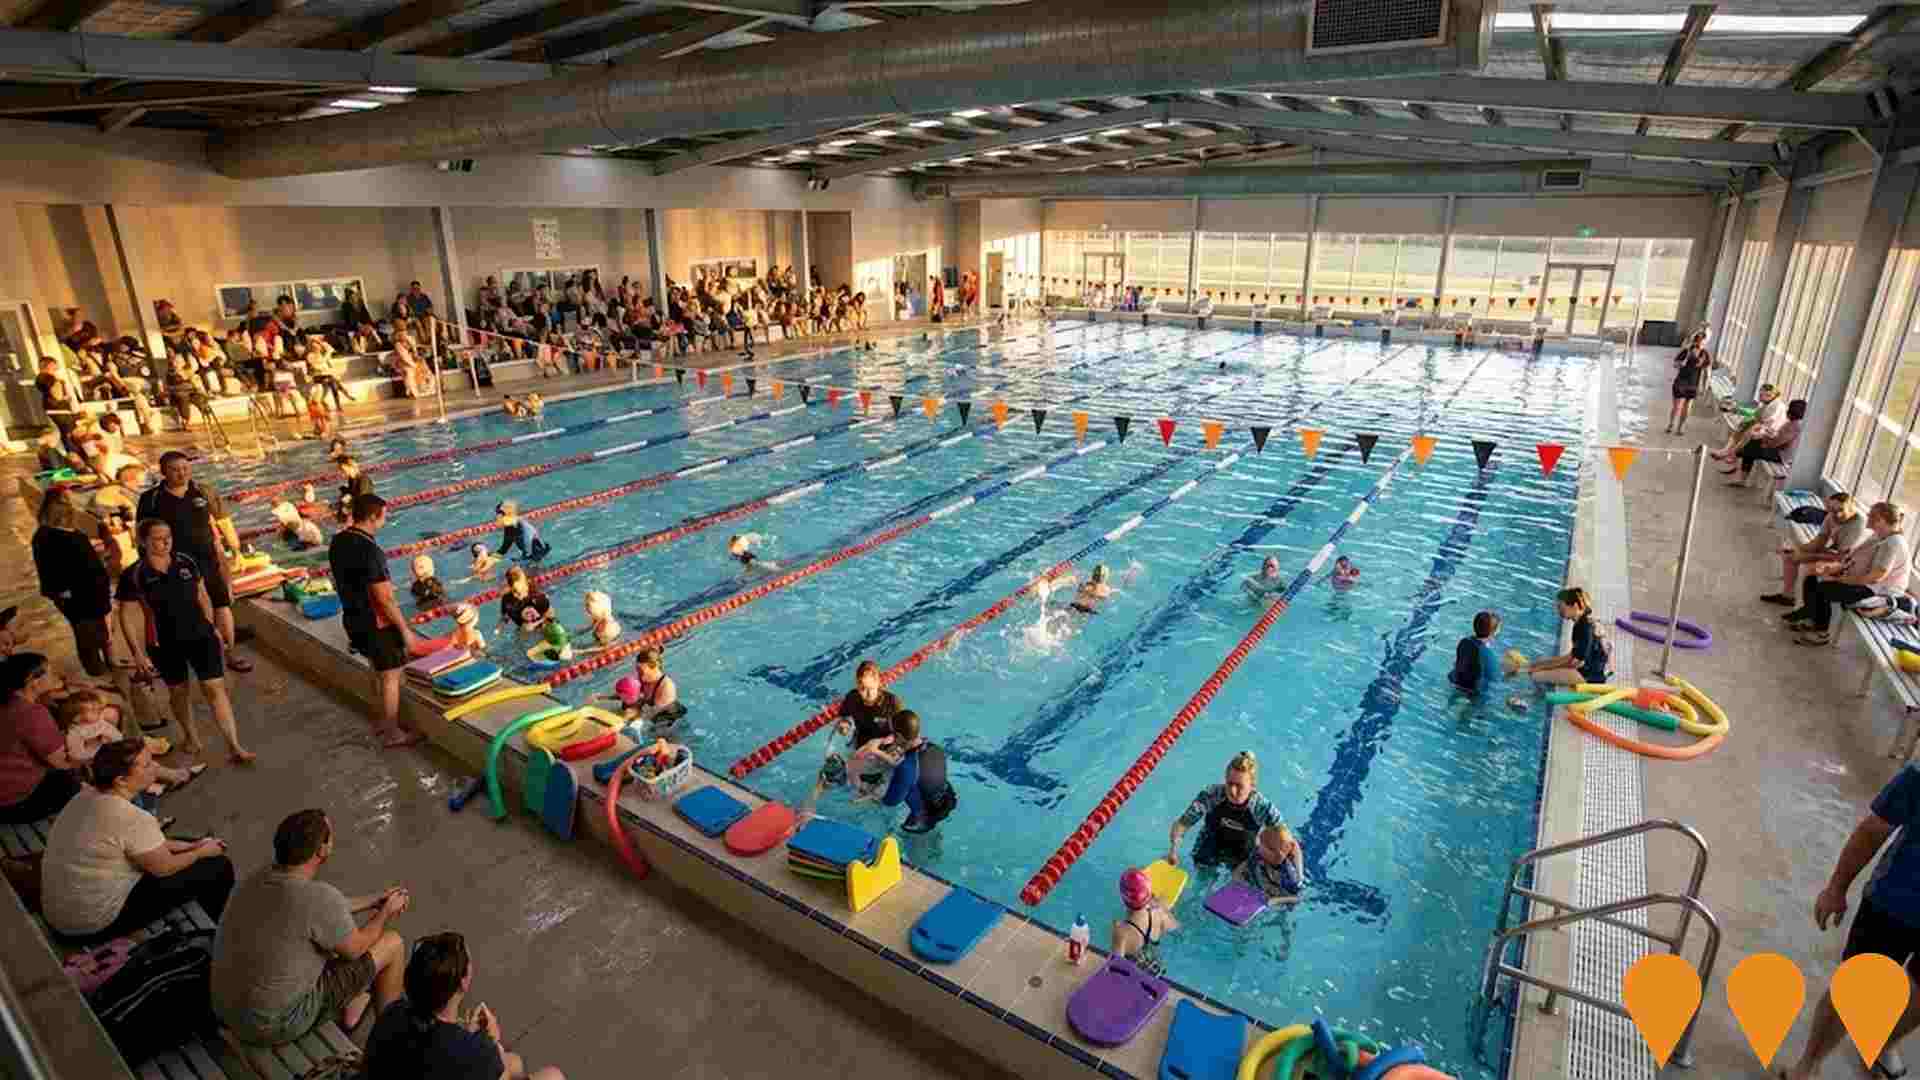
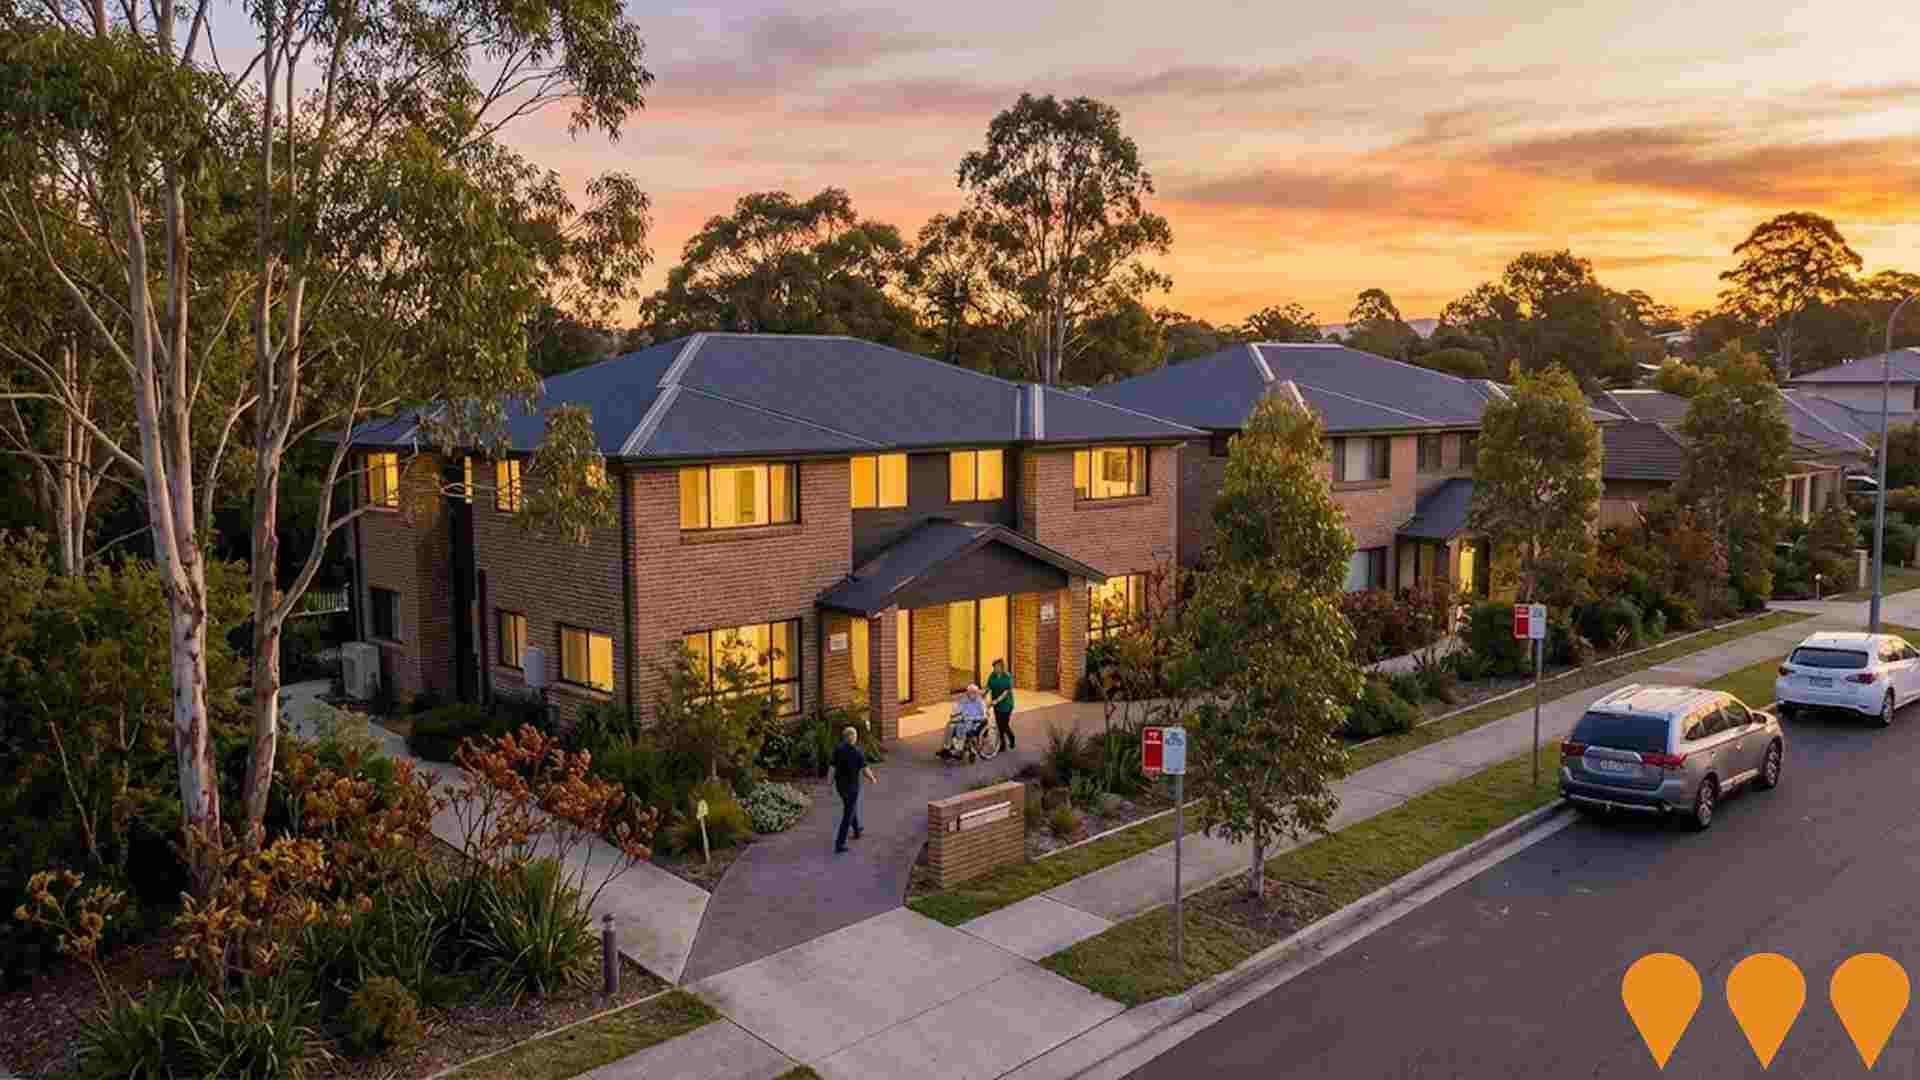
 Denotes AI-based impression for illustrative purposes only, not to be taken as definitive under any circumstances. Please follow links and conduct other investigations from the project's source for actual imagery. Developers and project owners wishing us to use original imagery please Contact Us and we will do so.
Frequently Asked Questions - Infrastructure
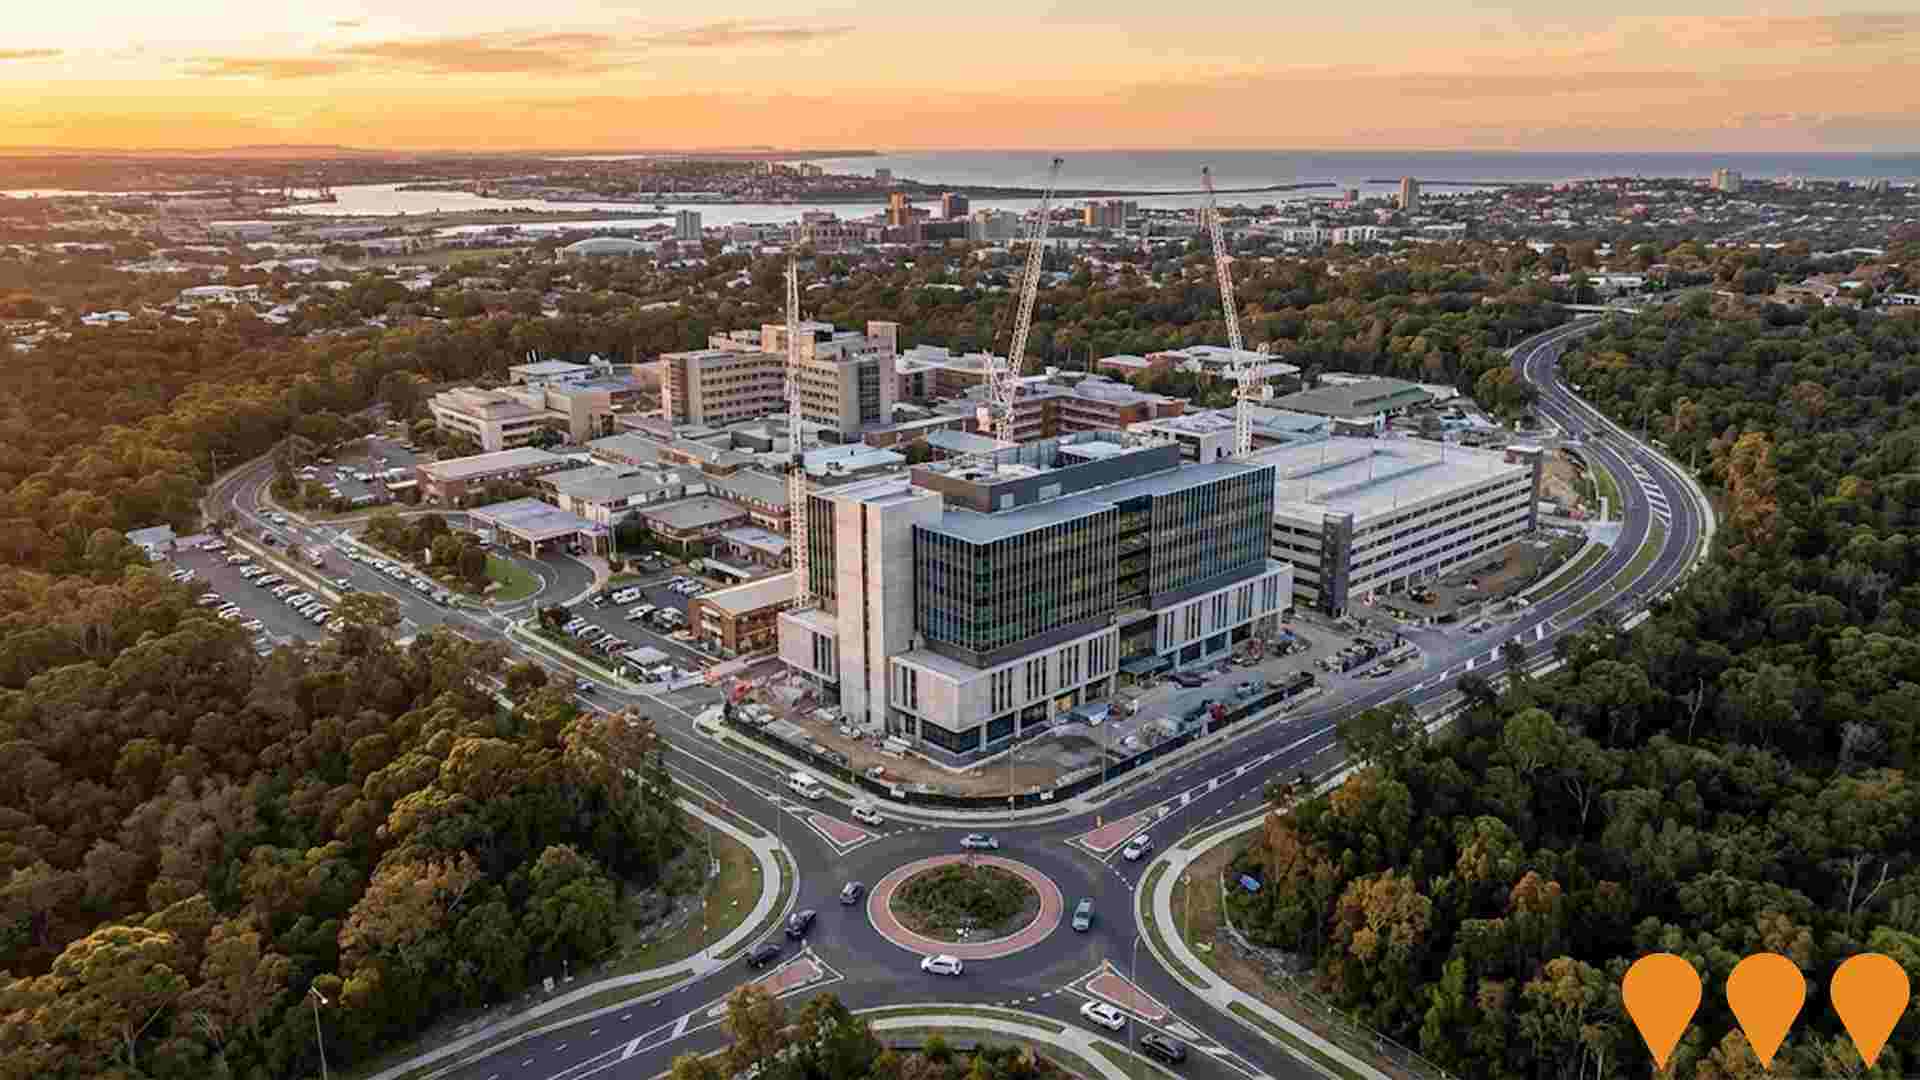
John Hunter Health and Innovation Precinct
The John Hunter Health and Innovation Precinct is the redevelopment and expansion of John Hunter Hospital in New Lambton Heights, Newcastle. The project centres on a new seven-storey Acute Services Building delivering an expanded Emergency Department, 60% more ICU capacity, 50% additional operating theatres, new maternity and birthing suites, neonatal intensive care, paediatric services, research and innovation spaces, public realm improvements and a multi-storey car park. The $835 million project is being delivered by Health Infrastructure NSW in partnership with Hunter New England Local Health District, with Multiplex as the managing contractor and BVN as lead architect. Practical completion is anticipated in 2026.
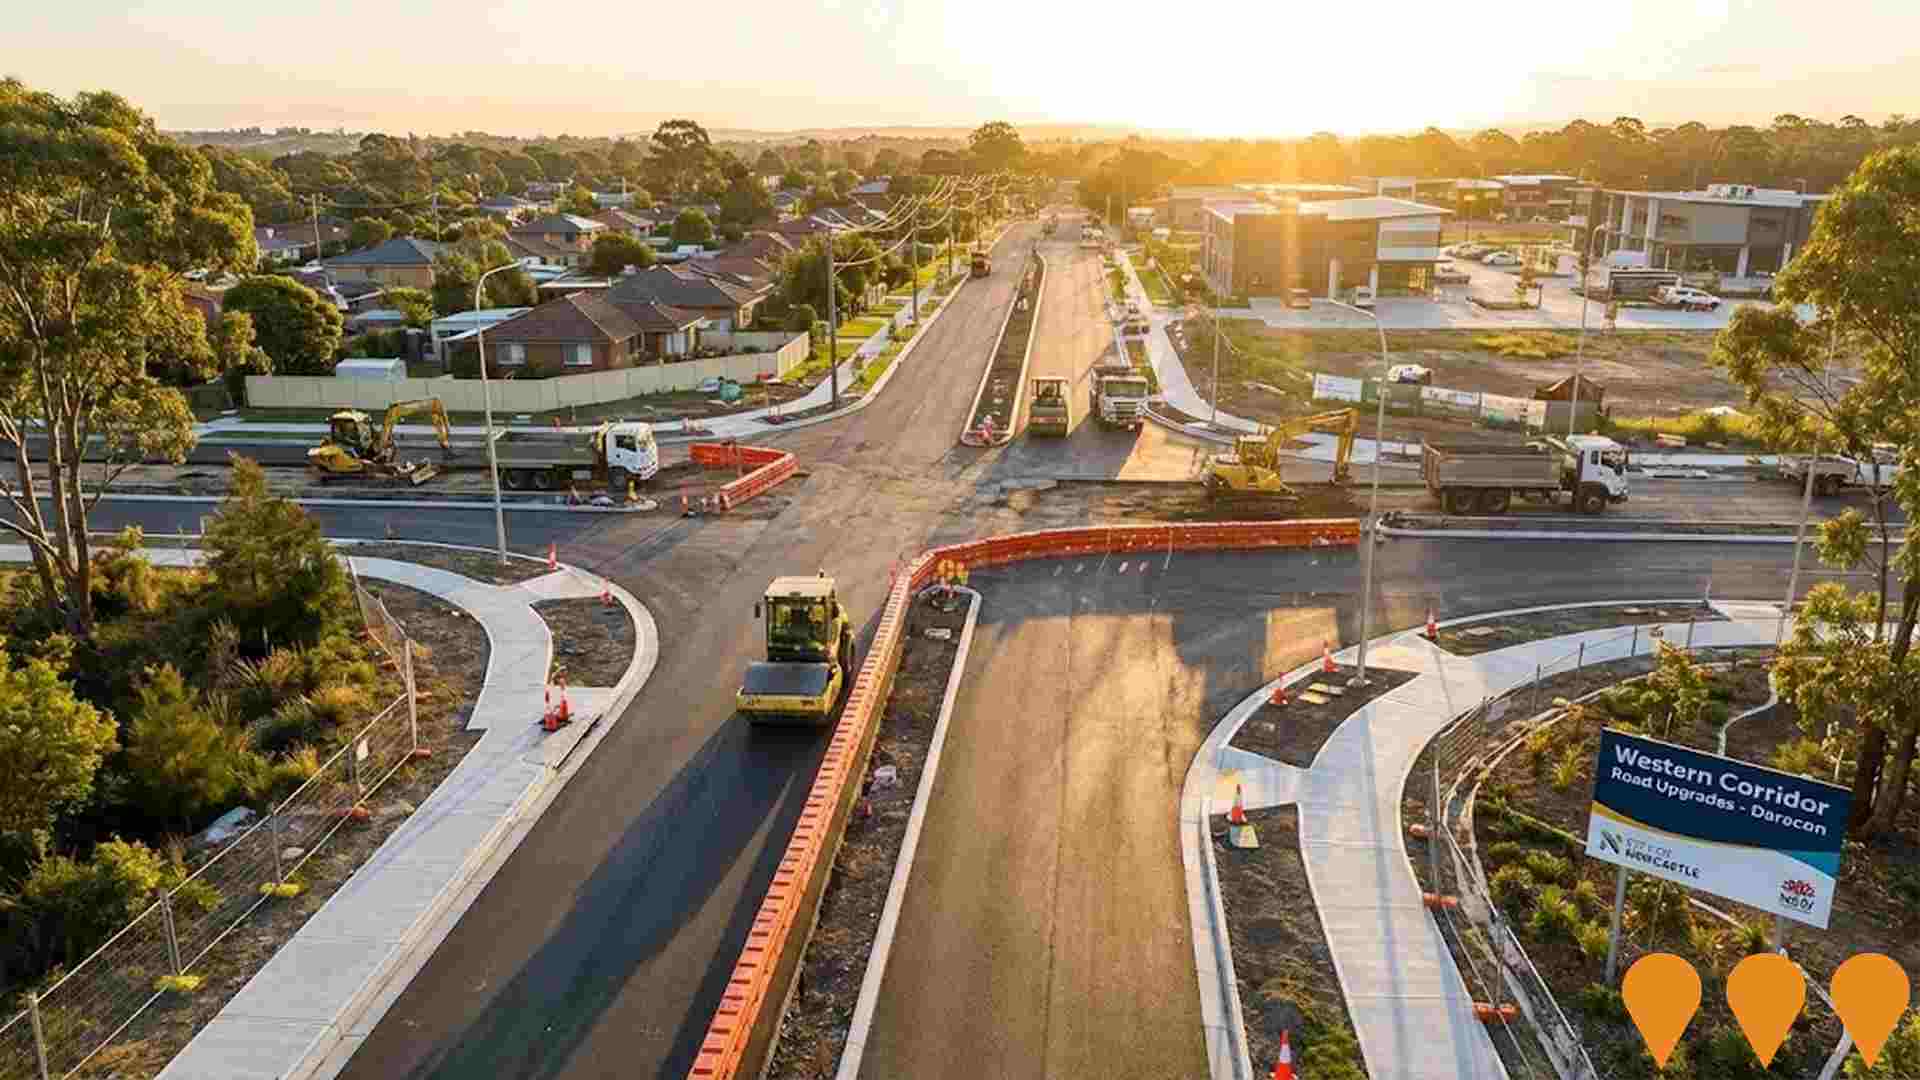
Western Corridor Road Upgrades - Longworth Avenue and Minmi Road
Major dual-lane road upgrades along Longworth Avenue (Newcastle Road to Cameron Street) and Minmi Road (Maryland Drive to Summerhill Road roundabout) in Wallsend. The project includes widening roads to four lanes (two lanes each direction), removing difficult right turns, adding dedicated turning lanes, improved cycling and pedestrian connections, upgraded stormwater infrastructure, and intersection improvements. Daracon is the principal contractor, with construction commenced March 2025 and completion expected mid-2026. Funded by City of Newcastle with $7.61 million contribution from NSW Government's Accelerated Infrastructure Fund.
Lambton Park Master Plan
A comprehensive master plan approved by Newcastle Council in May 2025 to guide the future development of Lambton Park. The plan focuses on enhancing facilities, community engagement, heritage preservation, and recreational opportunities while maintaining the park as an open green space. Key developments include Lambton Pool upgrades, heritage rotunda preservation, improved accessibility, tennis courts, bowling club facilities, children's playgrounds, walking tracks, and the transformation of the former Baby Health Centre into a modern cafe.

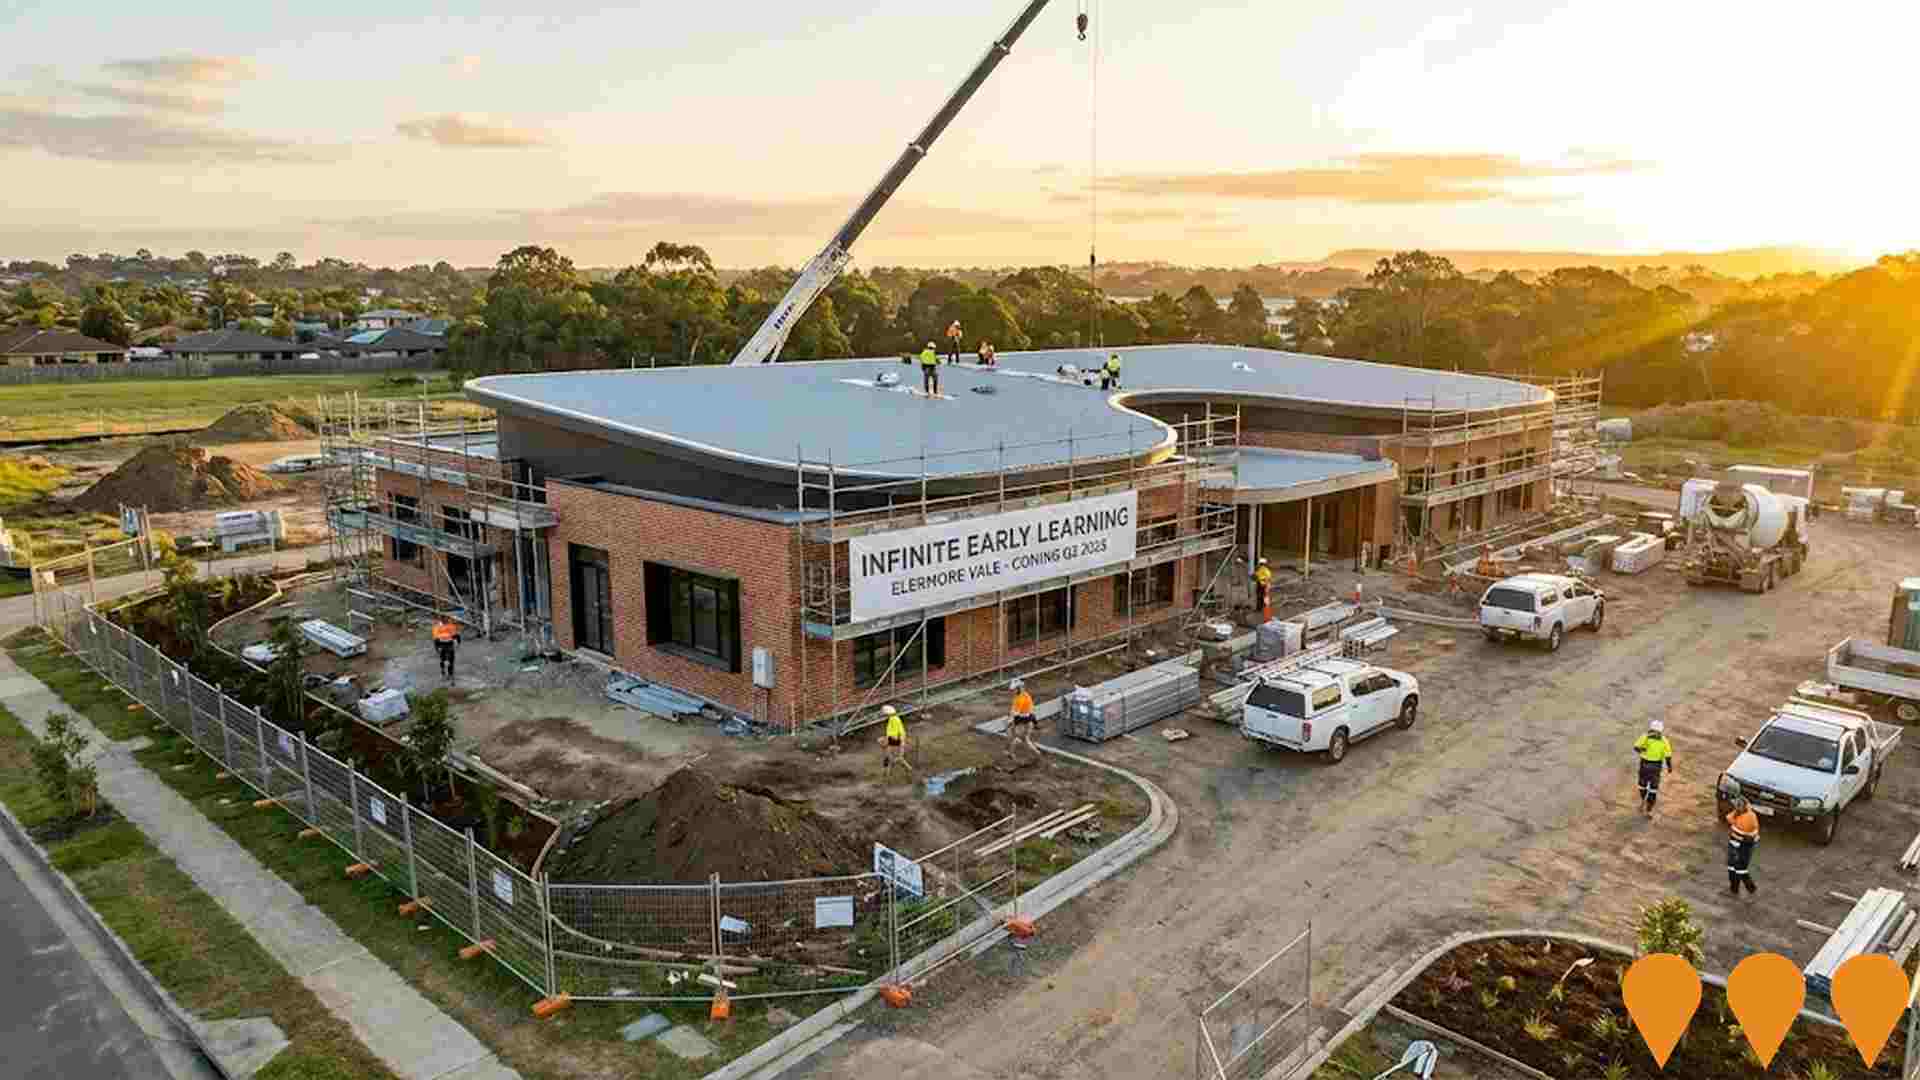
Infinite Early Learning Elermore Vale
A 141-place state-of-the-art childcare centre with six indoor play areas, originally planned as a medical and childcare facility including pharmacy, cafe, and pathology services, now changed to childcare only and under construction, set to open in Q3 2025.
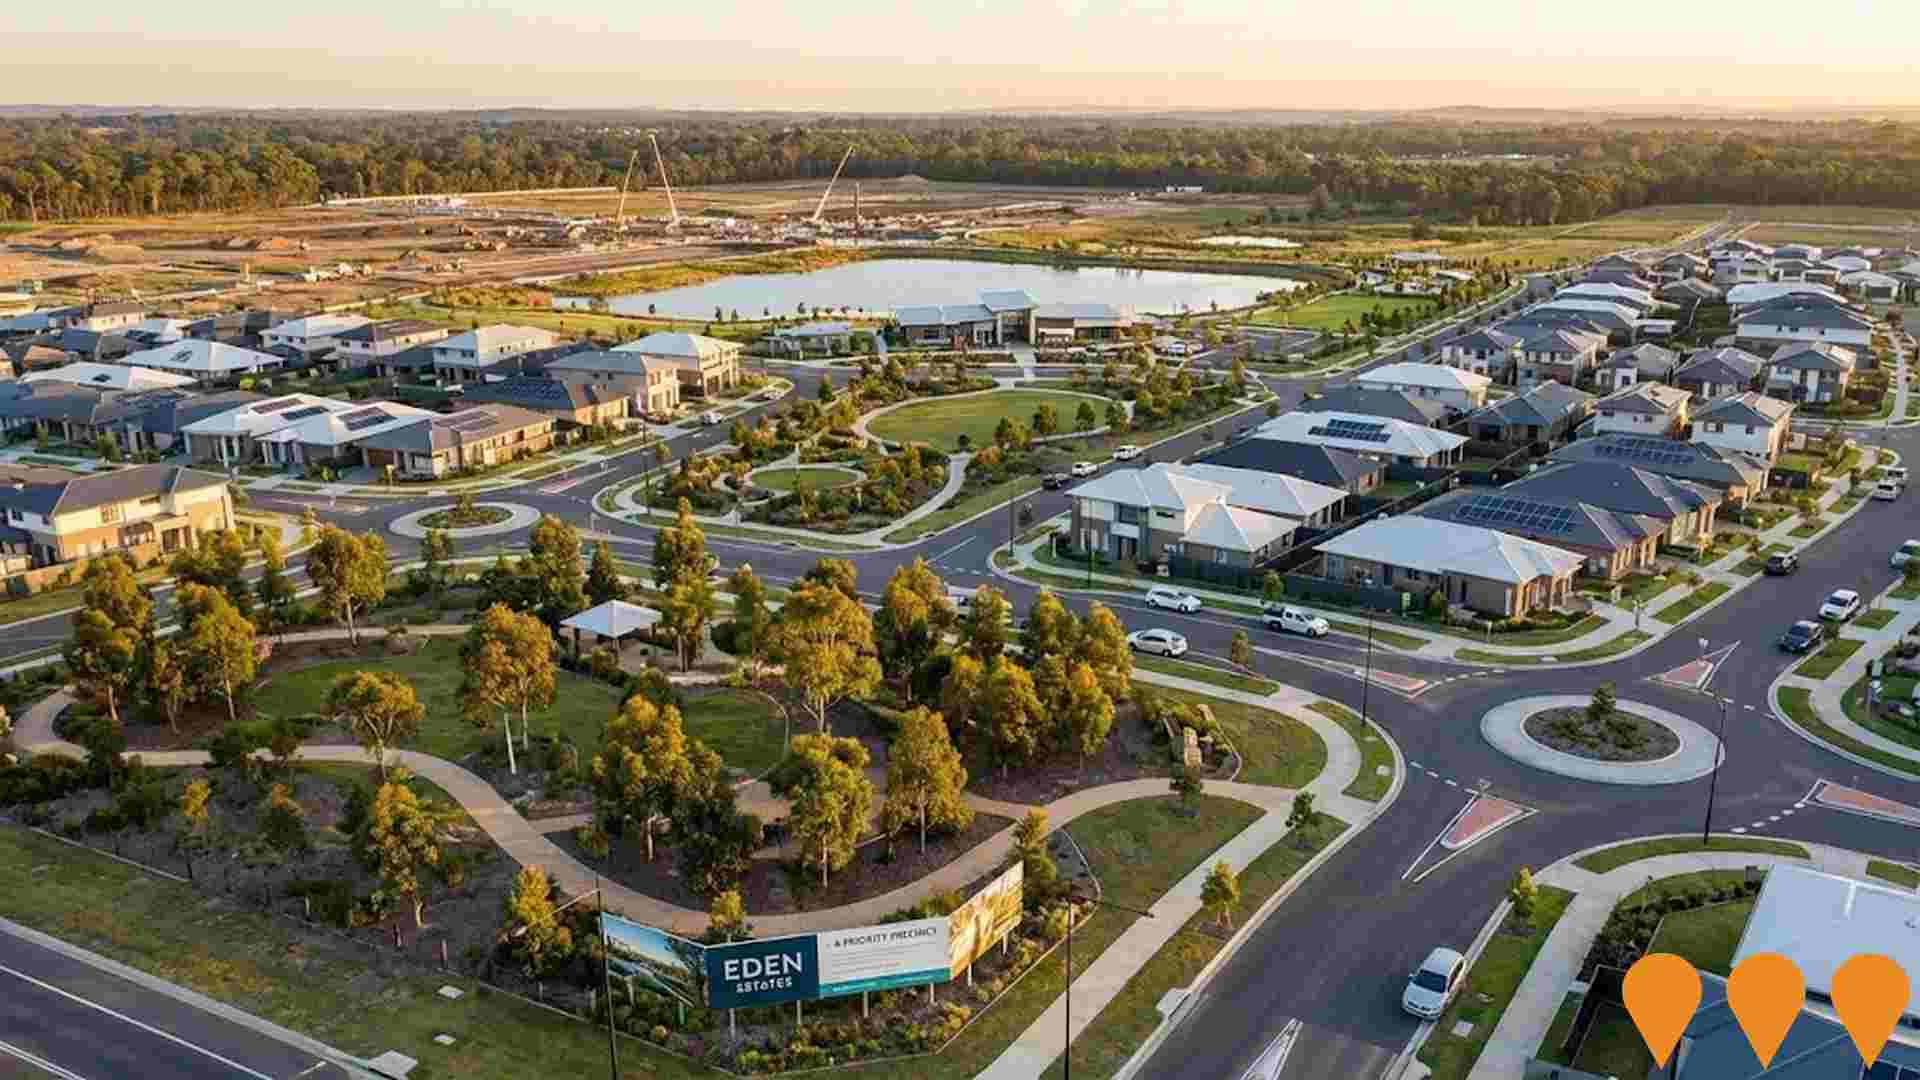
Eden Estates
State-significant masterplanned residential precinct spanning approximately 574 hectares across Newcastle and Lake Macquarie LGAs. The rezoning proposal seeks to deliver up to 4,200 new dwellings, employment lands, community facilities, open space and conservation areas. Declared a Priority Precinct by the NSW Government in 2024 with public exhibition of the draft planning package occurring November-December 2024.
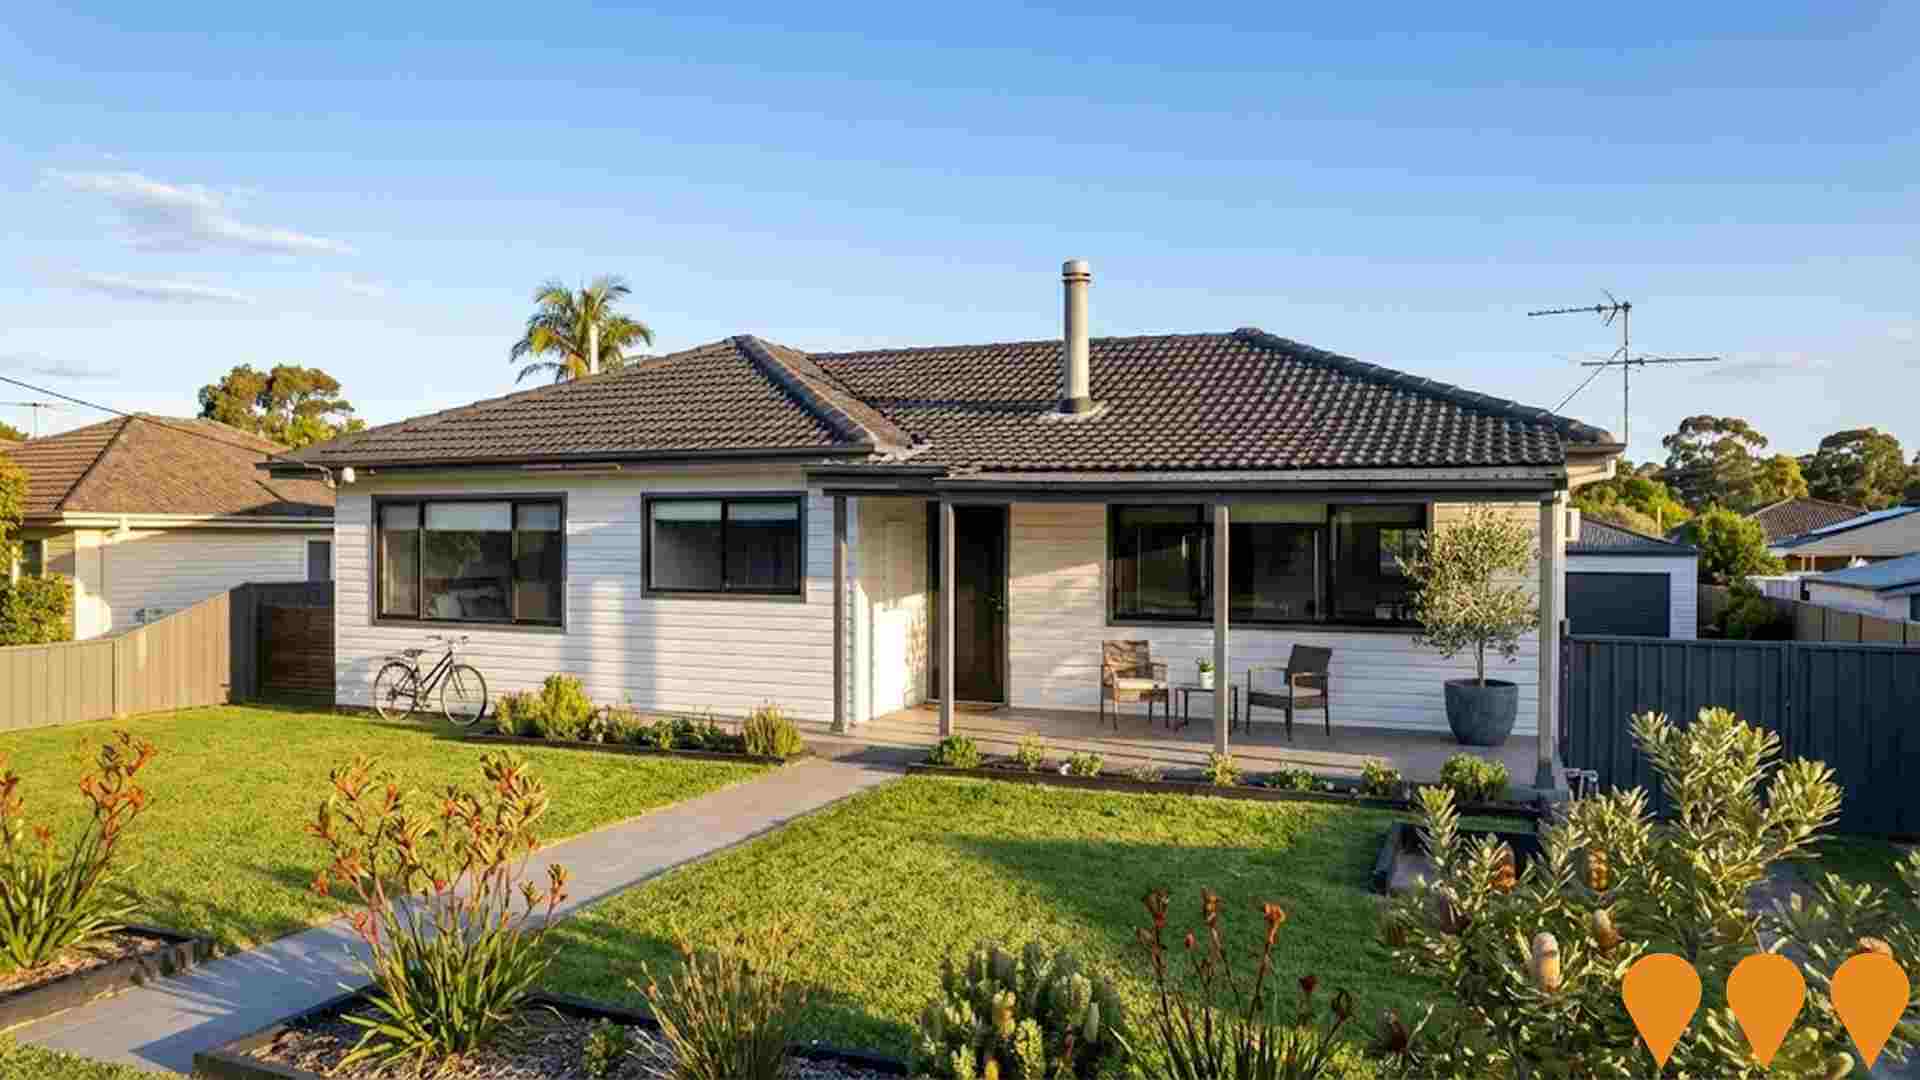
Duncan Close Residential Development
Staged development of 49 multi-dwelling homes on a vacant lot, including shared outdoor space and associated site works.
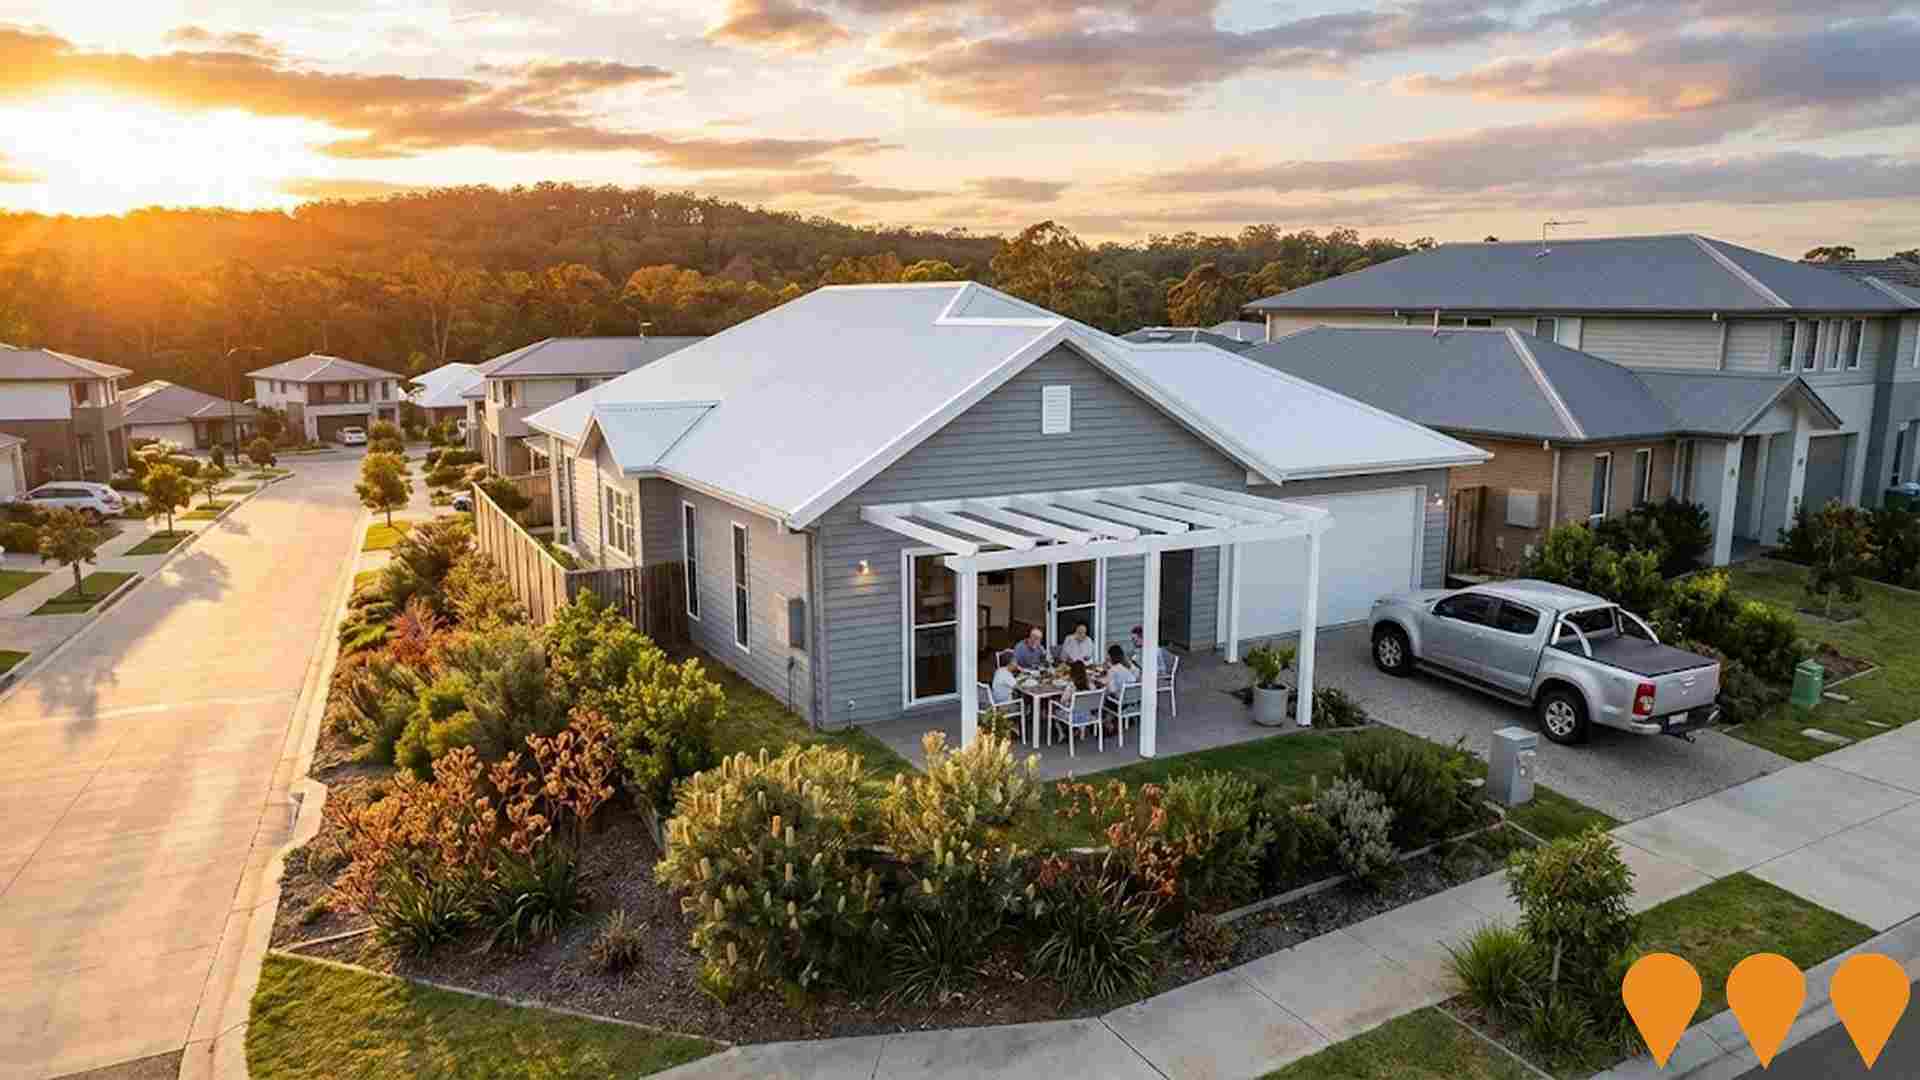
Elermore Ridge
A residential community featuring 106 homes over six stages, including two and three bedroom designs in single-level, split-level, and townhouse formats with contemporary finishes, gourmet kitchens with stone benchtops and stainless steel appliances, spacious open-plan living areas, and private terraces with gas outlets for outdoor entertaining. The community offers wide streets, tree-shaded parkland areas, and easy access to major amenities.
Elermore Fields Estate
A 4.20 hectare residential estate in Elermore Vale, offering 42 lots for house and land packages. Nestled in a family-friendly suburb with access to public transport, shopping centres, quality schools, parks, and close to Newcastle CBD.
Employment
Wallsend - Elermore Vale shows employment indicators that trail behind approximately 70% of regions assessed across Australia
Wallsend - Elermore Vale has a skilled workforce with significant representation in essential services sectors. The unemployment rate was 5.0% as of September 2025, with an estimated employment growth of 2.5% over the past year.
There were 11,056 residents employed at this time, while the unemployment rate was 1.2% higher than Rest of NSW's rate of 3.8%. Workforce participation was similar to Rest of NSW's 56.4%. The dominant employment sectors among residents included health care & social assistance, retail trade, and education & training. Health care & social assistance had particularly notable concentration with employment levels at 1.3 times the regional average.
Agriculture, forestry & fishing had limited presence with only 0.5% of employment compared to the regional average of 5.3%. The area appears to offer limited local employment opportunities as indicated by the count of Census working population versus resident population. During the year to September 2025, employment levels increased by 2.5%, and labour force increased by 3.6%, causing the unemployment rate to rise by 1.0 percentage points. In comparison, Rest of NSW saw a fall in employment by 0.5%, a contraction in labour force by 0.1%, and an increase in unemployment by 0.4 percentage points. State-level data from 25-Nov shows that NSW employment contracted by 0.03% (losing 2,260 jobs), with the state unemployment rate at 3.9%. This compares favourably to the national unemployment rate of 4.3%. Jobs and Skills Australia's national employment forecasts from May-25 suggest that national employment is forecast to expand by 6.6% over five years and 13.7% over ten years. However, growth rates differ significantly between industry sectors. Applying these projections to Wallsend - Elermore Vale's employment mix suggests local employment should increase by 6.9% over five years and 14.5% over ten years, although it is important to note that this is a simple weighting extrapolation for illustrative purposes and does not take into account localised population projections.
Frequently Asked Questions - Employment
Income
The area's income profile falls below national averages based on AreaSearch analysis
The median taxpayer income in Wallsend - Elermore Vale SA2 is $53,183 according to postcode level ATO data aggregated by AreaSearch for the financial year 2022. The average income for this area during the same period is $62,737. This is slightly lower than the national average, which contrasts with Rest of NSW's median income of $49,459 and average income of $62,998. Based on Wage Price Index growth of 12.61% since financial year 2022, current estimates for Wallsend - Elermore Vale would be approximately $59,889 (median) and $70,648 (average) as of September 2025. According to the 2021 Census, household, family, and personal incomes in Wallsend - Elermore Vale rank modestly, between the 31st and 34th percentiles. Distribution data shows that 31.5% of locals (6,882 people) fall within the $1,500 - $2,999 income bracket, mirroring the surrounding region where 29.9% occupy this category. Housing affordability pressures are severe in Wallsend - Elermore Vale, with only 82.0% of income remaining after housing costs, ranking at the 31st percentile. The area's SEIFA income ranking places it in the 4th decile.
Frequently Asked Questions - Income
Housing
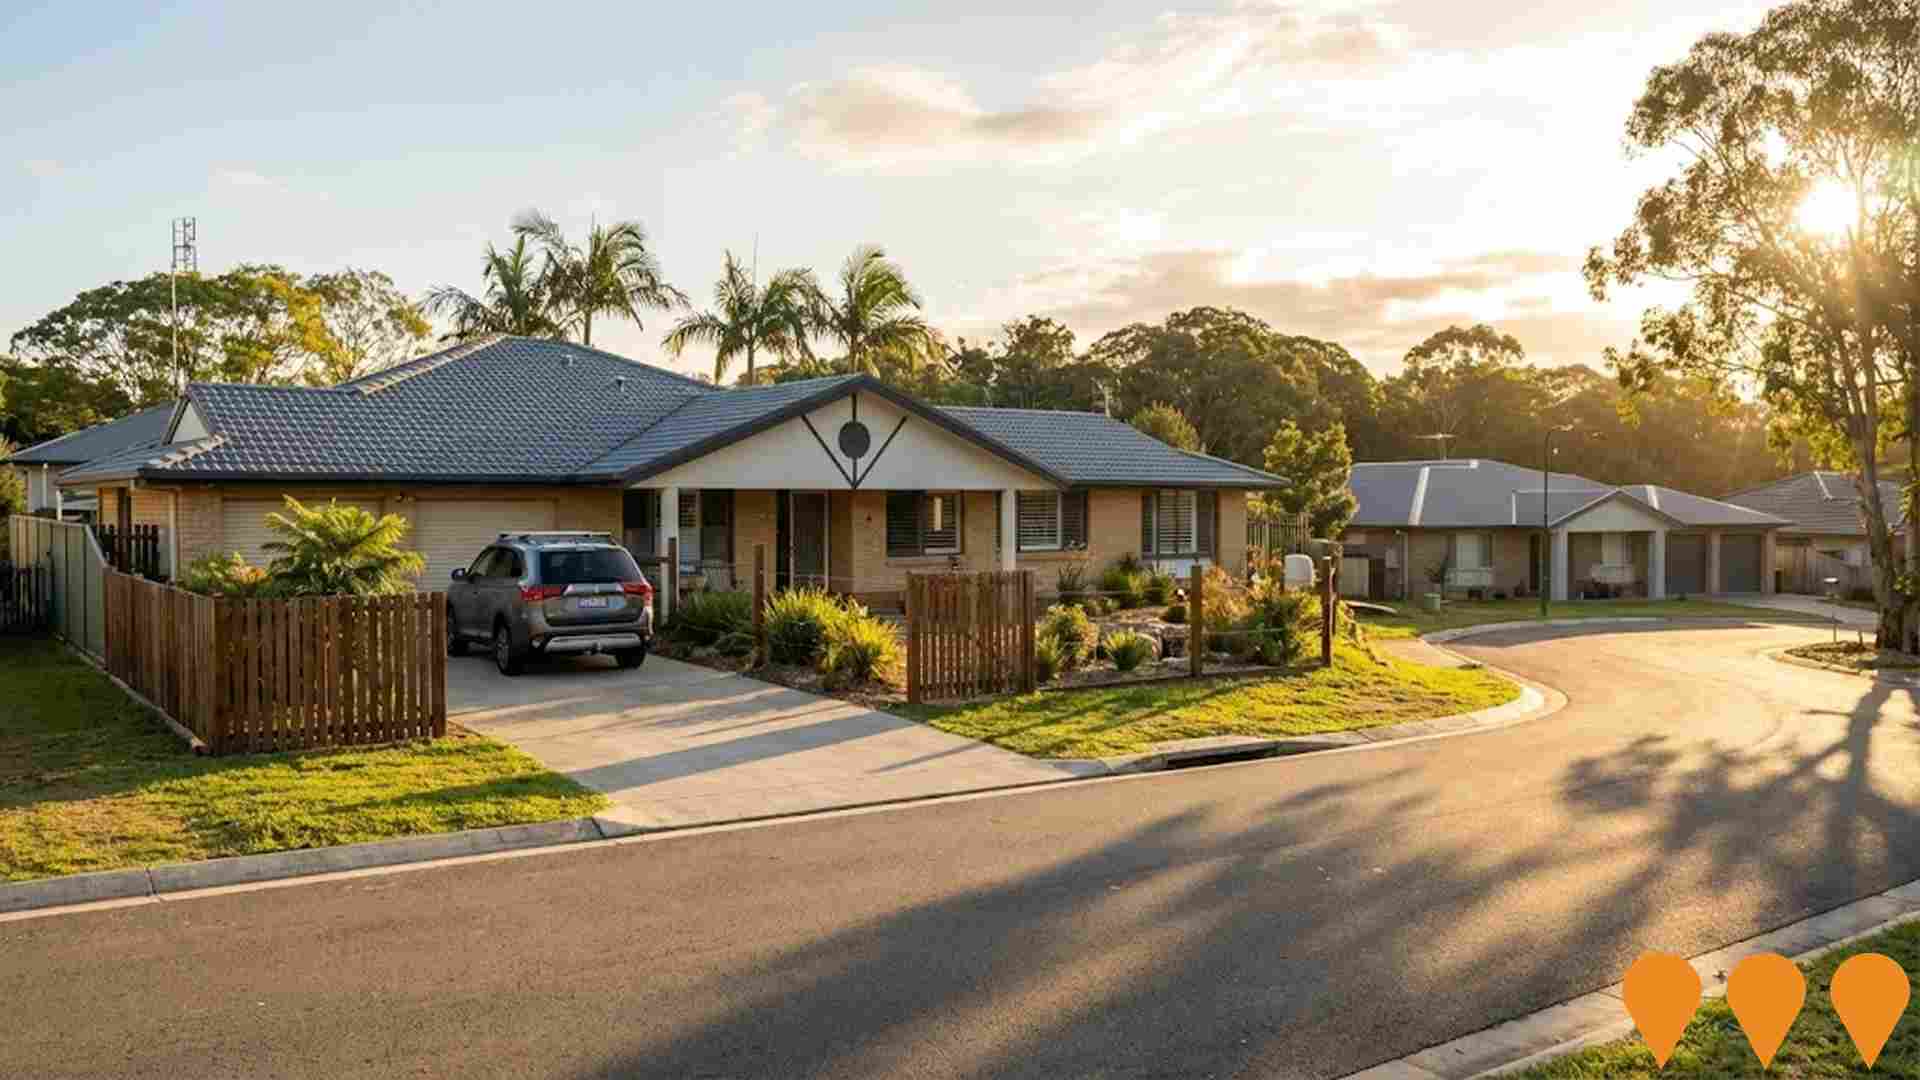
Wallsend - Elermore Vale is characterized by a predominantly suburban housing profile, with above-average rates of outright home ownership
In Wallsend-Elermore Vale, as per the latest Census evaluation, 79.6% of dwellings were houses, with the remaining 20.4% comprising semi-detached homes, apartments, and other types. This differs from Non-Metro NSW's composition of 70.5% houses and 29.5% other dwellings. Home ownership in Wallsend-Elermore Vale stood at 33.1%, with mortgaged properties at 33.8% and rented dwellings at 33.1%. The median monthly mortgage repayment was $1,777, lower than Non-Metro NSW's average of $1,962. Weekly rent in the area was $380, compared to Non-Metro NSW's $400. Nationally, Wallsend-Elermore Vale's mortgage repayments were lower at $1,777 versus Australia's average of $1,863, while rents were higher at $380 compared to the national figure of $375.
Frequently Asked Questions - Housing
Household Composition
Wallsend - Elermore Vale features high concentrations of group households, with a fairly typical median household size
Family households constitute 66.3% of all households, including 26.5% couples with children, 25.7% couples without children, and 12.8% single parent families. Non-family households account for the remaining 33.7%, with lone person households at 28.9% and group households comprising 4.8%. The median household size is 2.4 people, which aligns with the average in the Rest of NSW.
Frequently Asked Questions - Households
Local Schools & Education
Educational outcomes in Wallsend - Elermore Vale fall within the lower quartile nationally, indicating opportunities for improvement in qualification attainment
Educational qualifications in Wallsend show that 23.8% of residents aged 15 and above hold university degrees, compared to the NSW average of 32.2%. The most common qualification is a bachelor degree, held by 16.6% of residents. Postgraduate qualifications are held by 5.3%, and graduate diplomas by 1.9%. Vocational credentials are also prevalent, with 36.2% of residents aged 15 and above holding them.
Advanced diplomas account for 9.6%, and certificates for 26.6%. Educational participation is high in Wallsend, with 27.5% of residents currently enrolled in formal education. This includes 8.3% in primary education, 6.6% in secondary education, and 6.2% pursuing tertiary education.
Frequently Asked Questions - Education
Schools Detail
Nearby Services & Amenities
Transport
Transport servicing is good compared to other areas nationally based on assessment of service frequency, route connectivity and accessibility
Transport analysis in Wallsend - Elermore Vale shows 203 active transport stops operating, all of which are bus stops. These stops are served by 105 different routes, collectively carrying out 2,570 weekly passenger trips. Transport accessibility is rated as excellent, with residents typically located just 136 meters from the nearest stop.
On average, there are 367 trips per day across all routes, which equates to approximately 12 weekly trips per individual stop.
Frequently Asked Questions - Transport
Transport Stops Detail
Health
Health performance in Wallsend - Elermore Vale is well below average with a range of health conditions having marked impacts on both younger and older age cohorts
Wallsend - Elermore Vale faces significant health challenges, as indicated by health data. The area has a lower rate of private health cover at approximately 51%, compared to the average SA2 area and Rest of NSW at 55.6%.
Mental health issues affect around 11.5% of residents, while arthritis impacts about 10.1%. About 59.9% of residents report no medical ailments, which is lower than the 64.9% reported in Rest of NSW. The area has a higher proportion of seniors aged 65 and over at 20%, compared to 16.7% in Rest of NSW. Health outcomes among seniors present challenges similar to those faced by the general population.
Frequently Asked Questions - Health
Cultural Diversity
Wallsend - Elermore Vale ranks below the Australian average when compared to other local markets across a number of language and cultural background related metrics
Wallsend-Elermore Vale showed lower cultural diversity, with 84.6% born in Australia, 89.6% being citizens, and 87.8% speaking English only at home. Christianity was the predominant religion at 51.8%. Islam was overrepresented at 2.5%, compared to 1.7% regionally.
Top ancestry groups were English (29.0%), Australian (28.4%), and Scottish (8.3%). Notable divergences included Macedonian at 1.2% vs regional 0.8%, Polish at 1.1% vs regional 0.8%, and Welsh at 0.8% vs regional 0.8%.
Frequently Asked Questions - Diversity
Age
Wallsend - Elermore Vale's population is slightly older than the national pattern
The median age in Wallsend - Elermore Vale is 39 years, which is significantly lower than Rest of NSW's average of 43 but essentially aligned with Australia's median age of 38 years. Compared to Rest of NSW, Wallsend - Elermore Vale has a higher proportion of residents aged 25-34 (17.3%) but fewer residents aged 65-74 (9.4%). According to the 2021 Census, the population aged 25 to 34 grew from 14.7% to 17.3%, while the 55 to 64 age group declined from 11.2% to 9.9% and the 65 to 74 group decreased from 10.7% to 9.4%. By 2041, demographic projections indicate significant shifts in Wallsend - Elermore Vale's age structure. The 25 to 34 age group is expected to grow by 30%, reaching 4,899 people from the current 3,777. Conversely, the 65 to 74 and 55 to 64 cohorts are projected to experience population declines.
