Chart Color Schemes
This analysis uses ABS Statistical Areas Level 2 (SA2) boundaries, which can materially differ from Suburbs and Localities (SAL) even when sharing similar names.
SA2 boundaries are defined by the Australian Bureau of Statistics and are designed to represent communities for statistical reporting (e.g., census and ERP).
Suburbs and Localities (SAL) represent commonly-used suburb/locality names (postal-style areas) and may use different geographic boundaries. For comprehensive analysis, consider reviewing both boundary types if available.
est. as @ -- *
ABS ERP | -- people | --
2021 Census | -- people
Sales Activity
Curious about local property values? Filter the chart to assess the volume and appreciation (including resales) trends and regional comparisons, or scroll to the map below view this information at an individual property level.
Find a Recent Sale
Sales Detail
Population
Pyrmont has seen population growth performance typically on par with national averages when looking at short and medium term trends
Pyrmont's population was approximately 13,976 as of November 2025. This figure represents an increase of 1,318 people since the 2021 Census, which recorded a population of 12,658. The change is inferred from the estimated resident population of 13,958 in June 2024 and an additional 19 validated new addresses since the Census date. This results in a population density ratio of 15,028 persons per square kilometer, placing Pyrmont among the top 10% of locations assessed by AreaSearch for land scarcity. Between 2021 and 2024, Pyrmont's population growth exceeded both state (6.7%) and metropolitan area averages, driven primarily by overseas migration contributing approximately 89.0% of overall population gains during recent periods. AreaSearch uses ABS/Geoscience Australia projections for each SA2 area released in 2024 with a base year of 2022.
For areas not covered by this data, AreaSearch employs NSW State Government's SA2 level projections released in 2022 using a base year of 2021. Growth rates by age group from these aggregations are applied to all areas for the years 2032 to 2041. By 2041, Pyrmont is forecasted to experience significant population growth, with an increase of 4,116 persons projected based on latest annual ERP population numbers. This reflects a total increase of approximately 29.3% over the 17-year period.
Frequently Asked Questions - Population
Development
Residential development activity is lower than average in Pyrmont according to AreaSearch's national comparison of local real estate markets
Pyrmont had only one residential development approval in the past five years. This indicates that the area is largely built out with minimal vacant land available for new developments. Established areas like Pyrmont typically see steady demand for existing properties due to limited new-build alternatives.
Comparing Pyrmont's construction levels to Greater Sydney shows substantially reduced activity, which generally supports stronger demand and values for established homes. This level of development is also below the national average, reflecting the area's maturity and suggesting possible planning constraints may be in place.
Frequently Asked Questions - Development
Infrastructure
Pyrmont has very high levels of nearby infrastructure activity, ranking in the top 10% nationally
Twenty-two projects have been identified by AreaSearch as potentially impacting the area's performance. Key projects include The Star Sydney - Ritz-Carlton Hotel & Lyric Theatre, Pyrmont Place, The Bays Metro Station & Precinct, and Pyrmont Metro Station & Over Station Development. Details of those most relevant are listed below.
Professional plan users can use the search below to filter and access additional projects.
INFRASTRUCTURE SEARCH
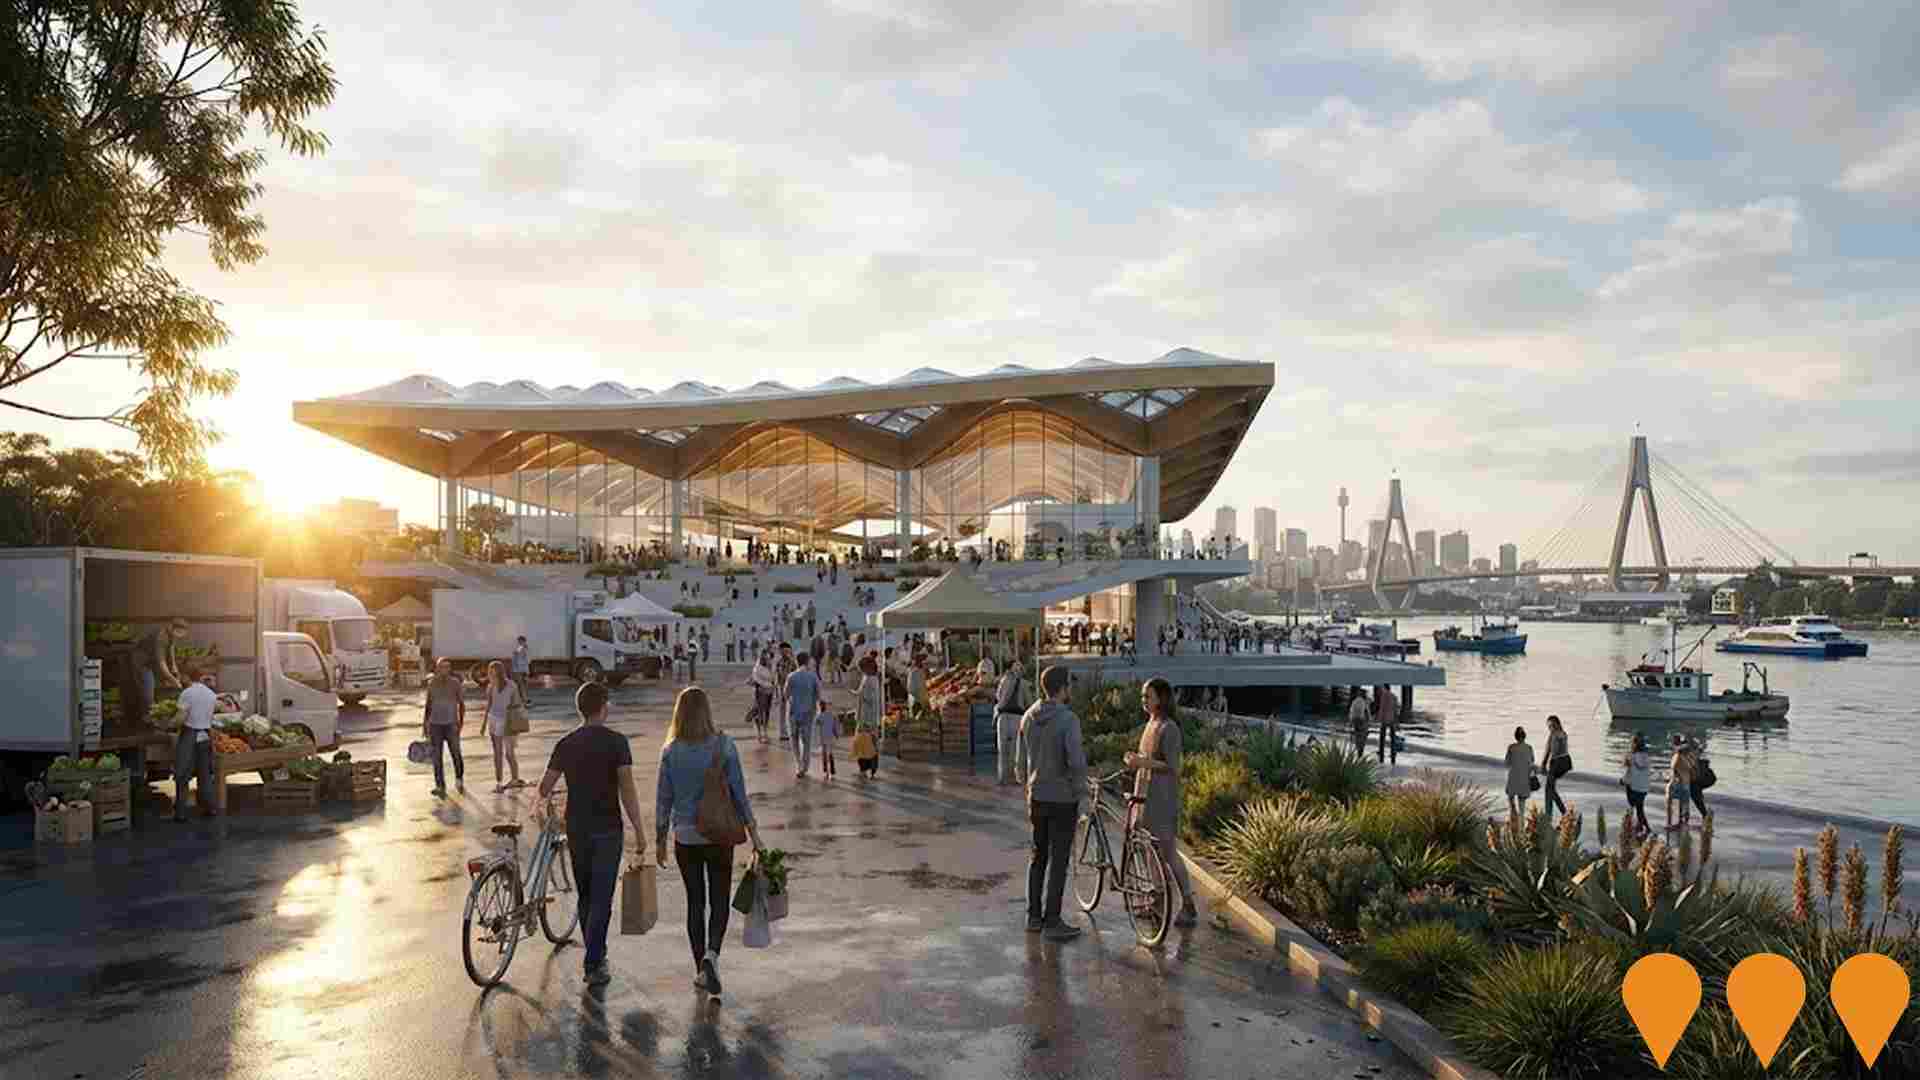
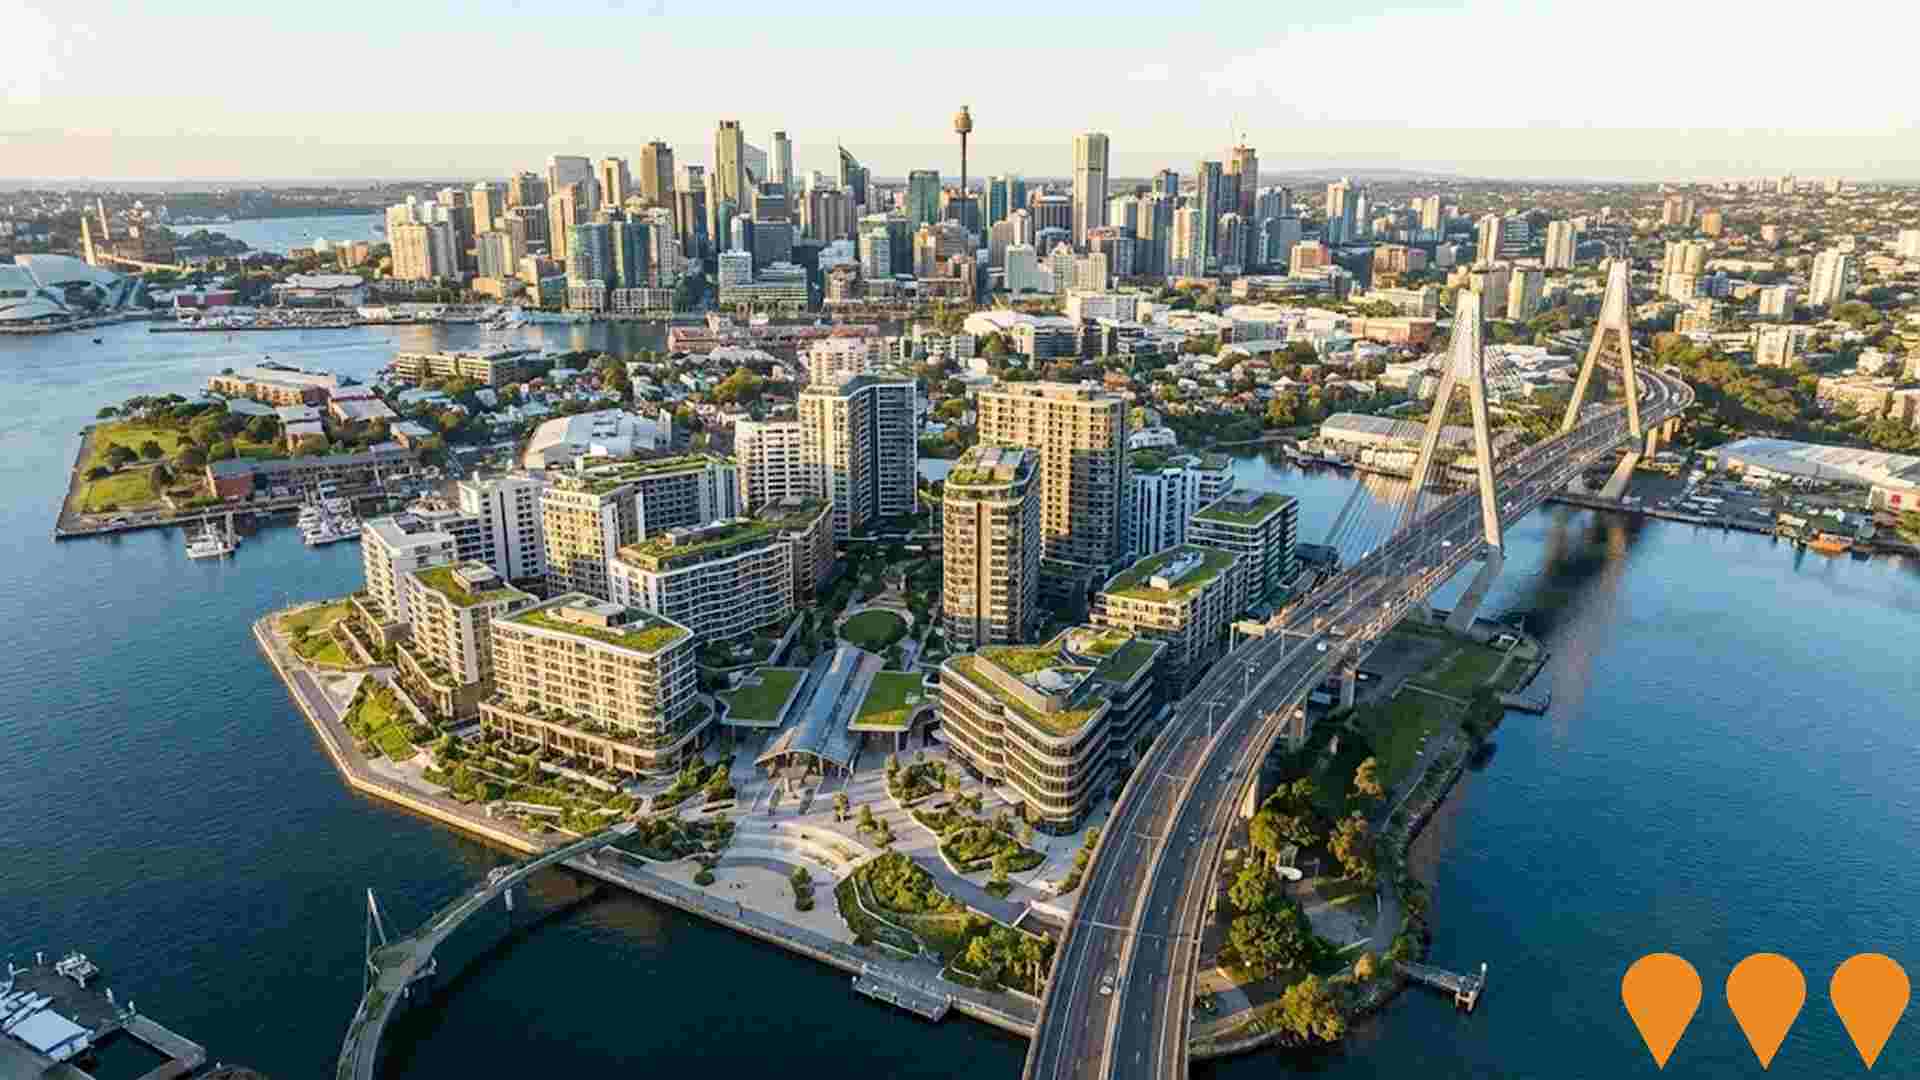
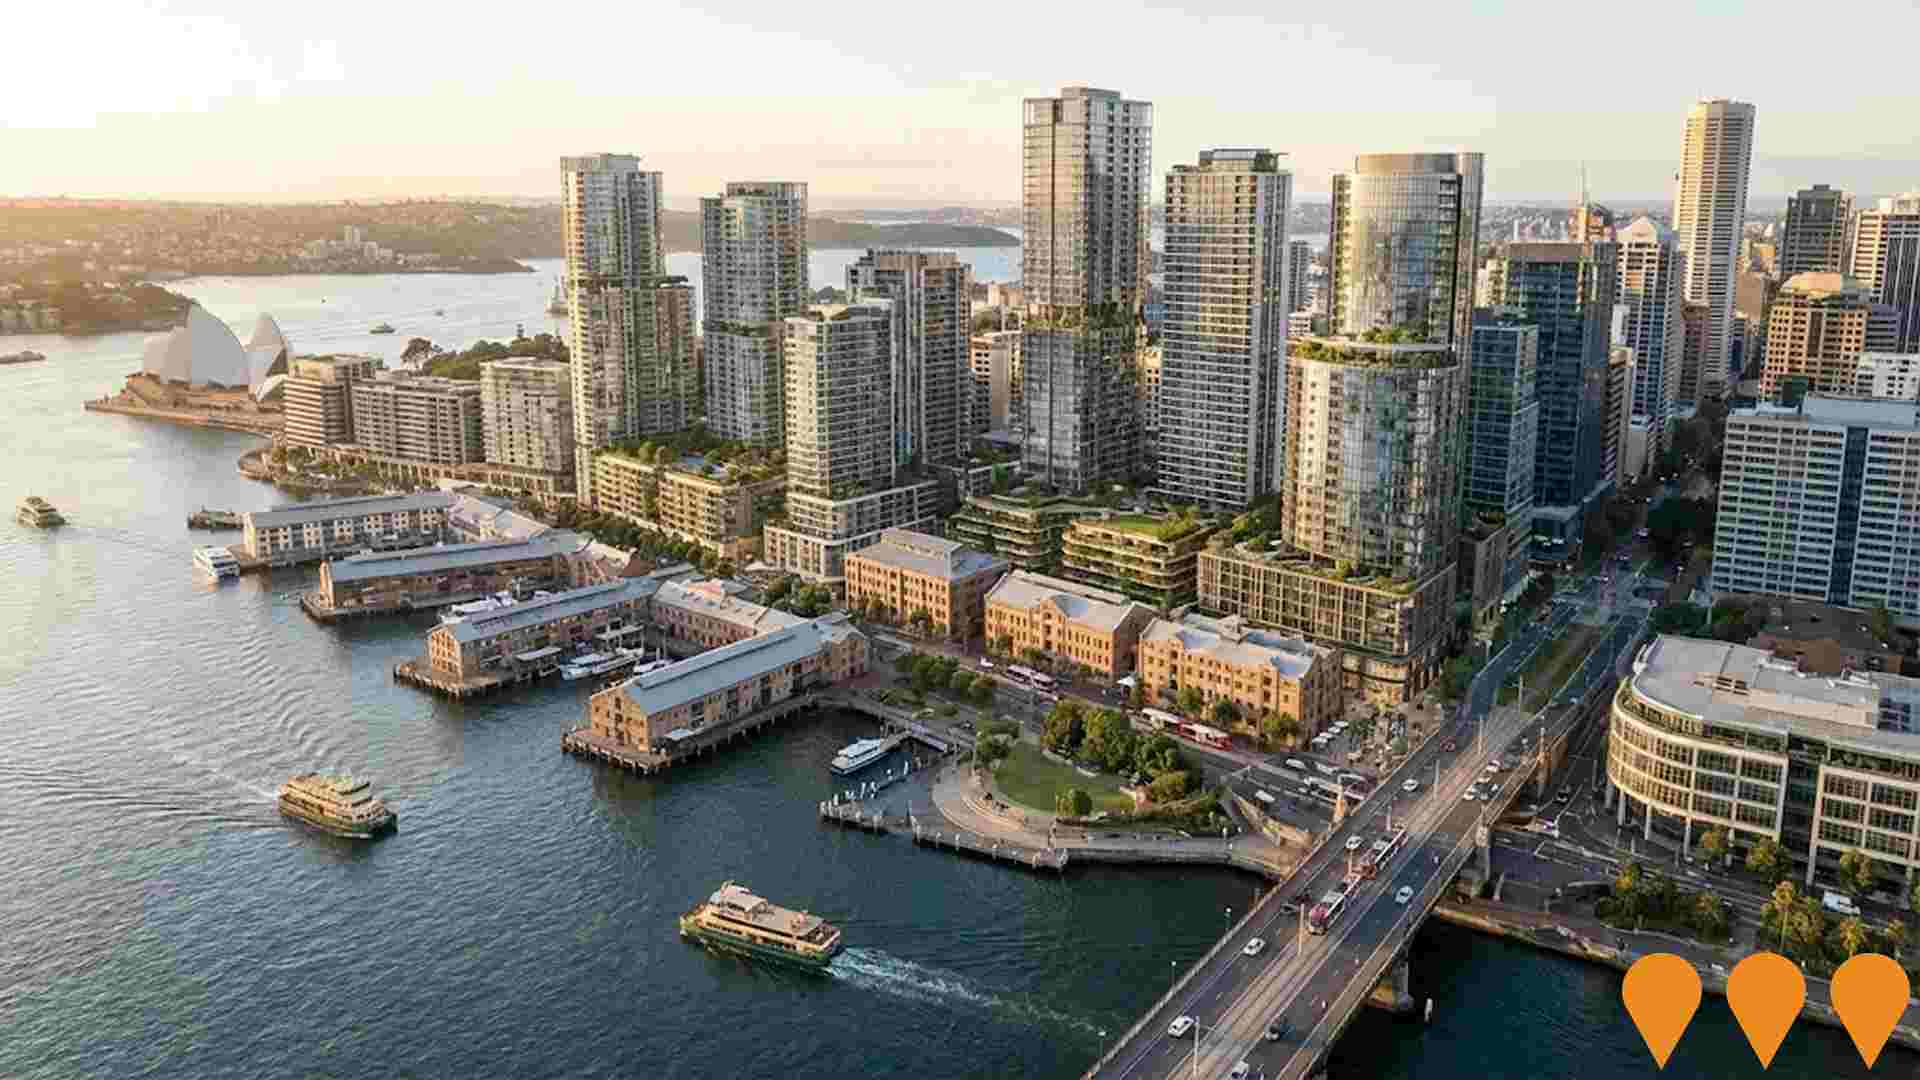
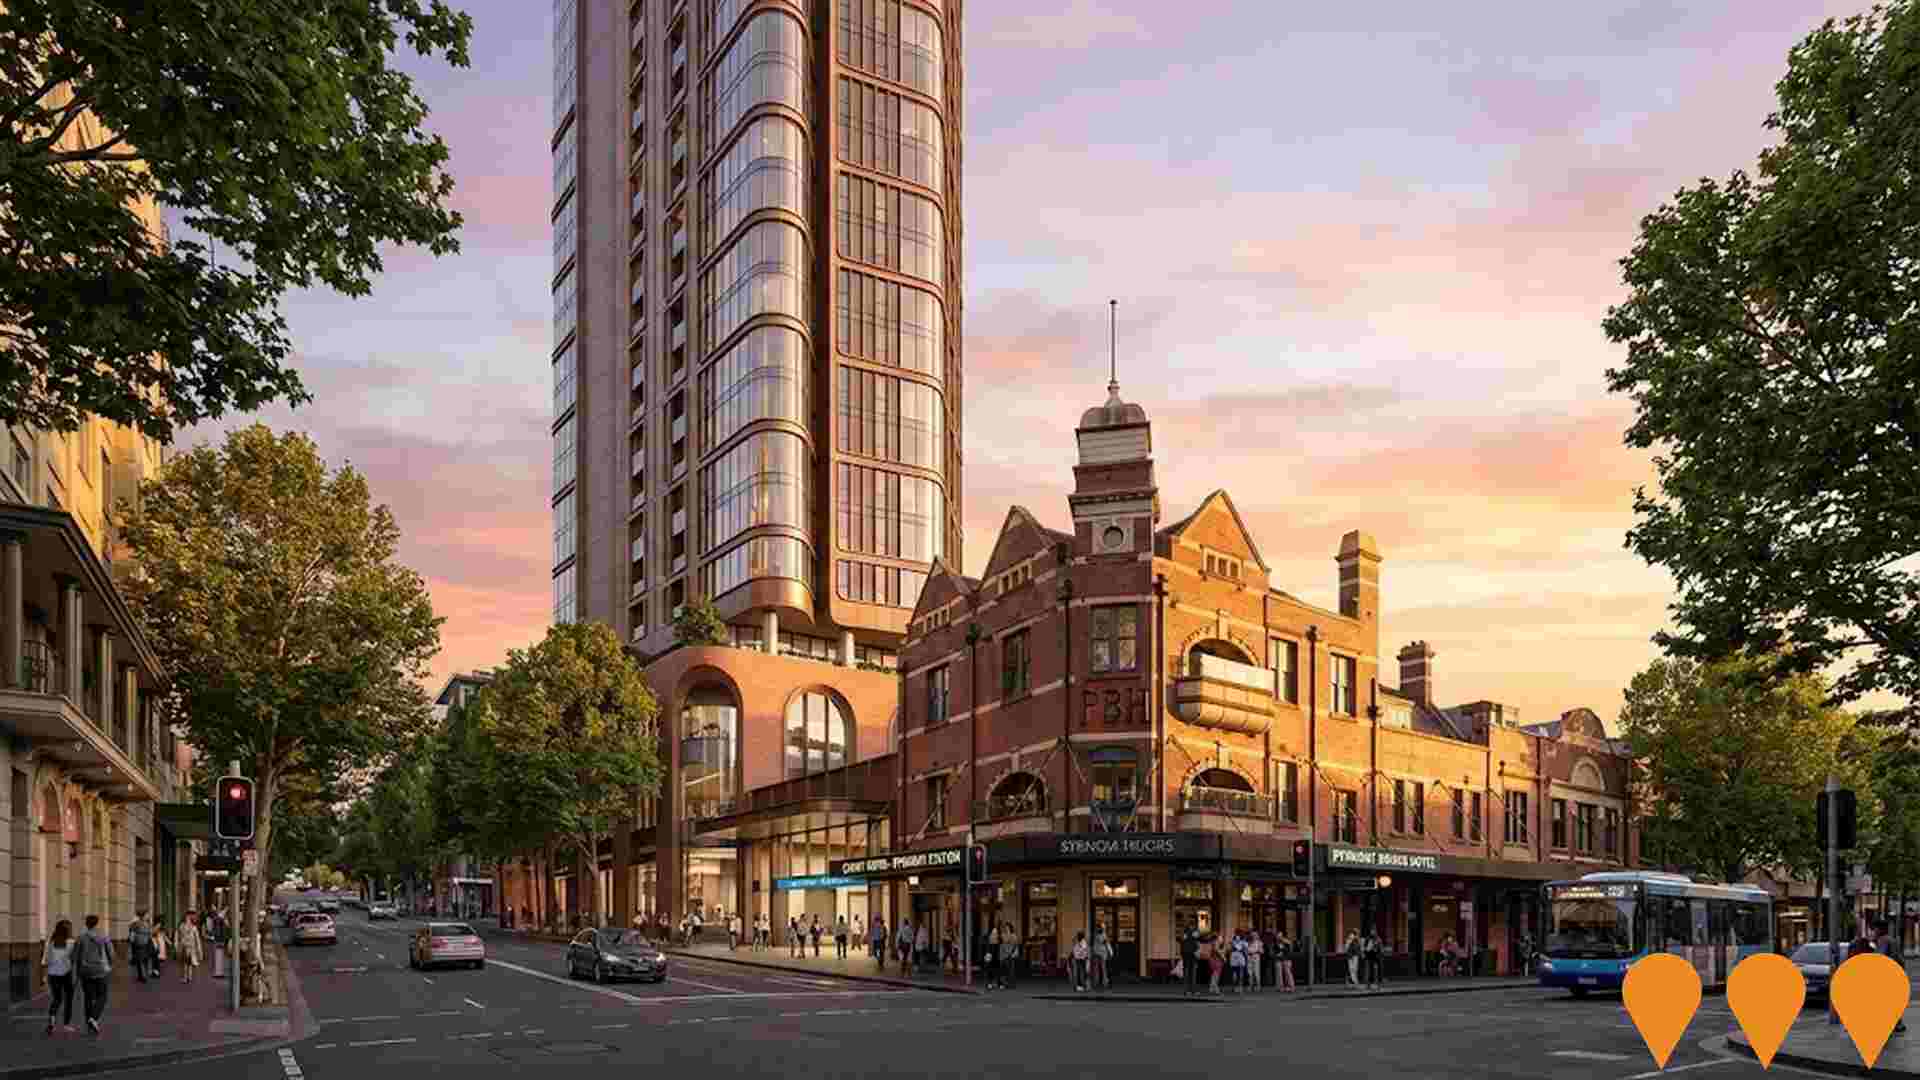
 Denotes AI-based impression for illustrative purposes only, not to be taken as definitive under any circumstances. Please follow links and conduct other investigations from the project's source for actual imagery. Developers and project owners wishing us to use original imagery please Contact Us and we will do so.
Frequently Asked Questions - Infrastructure
New Sydney Fish Market
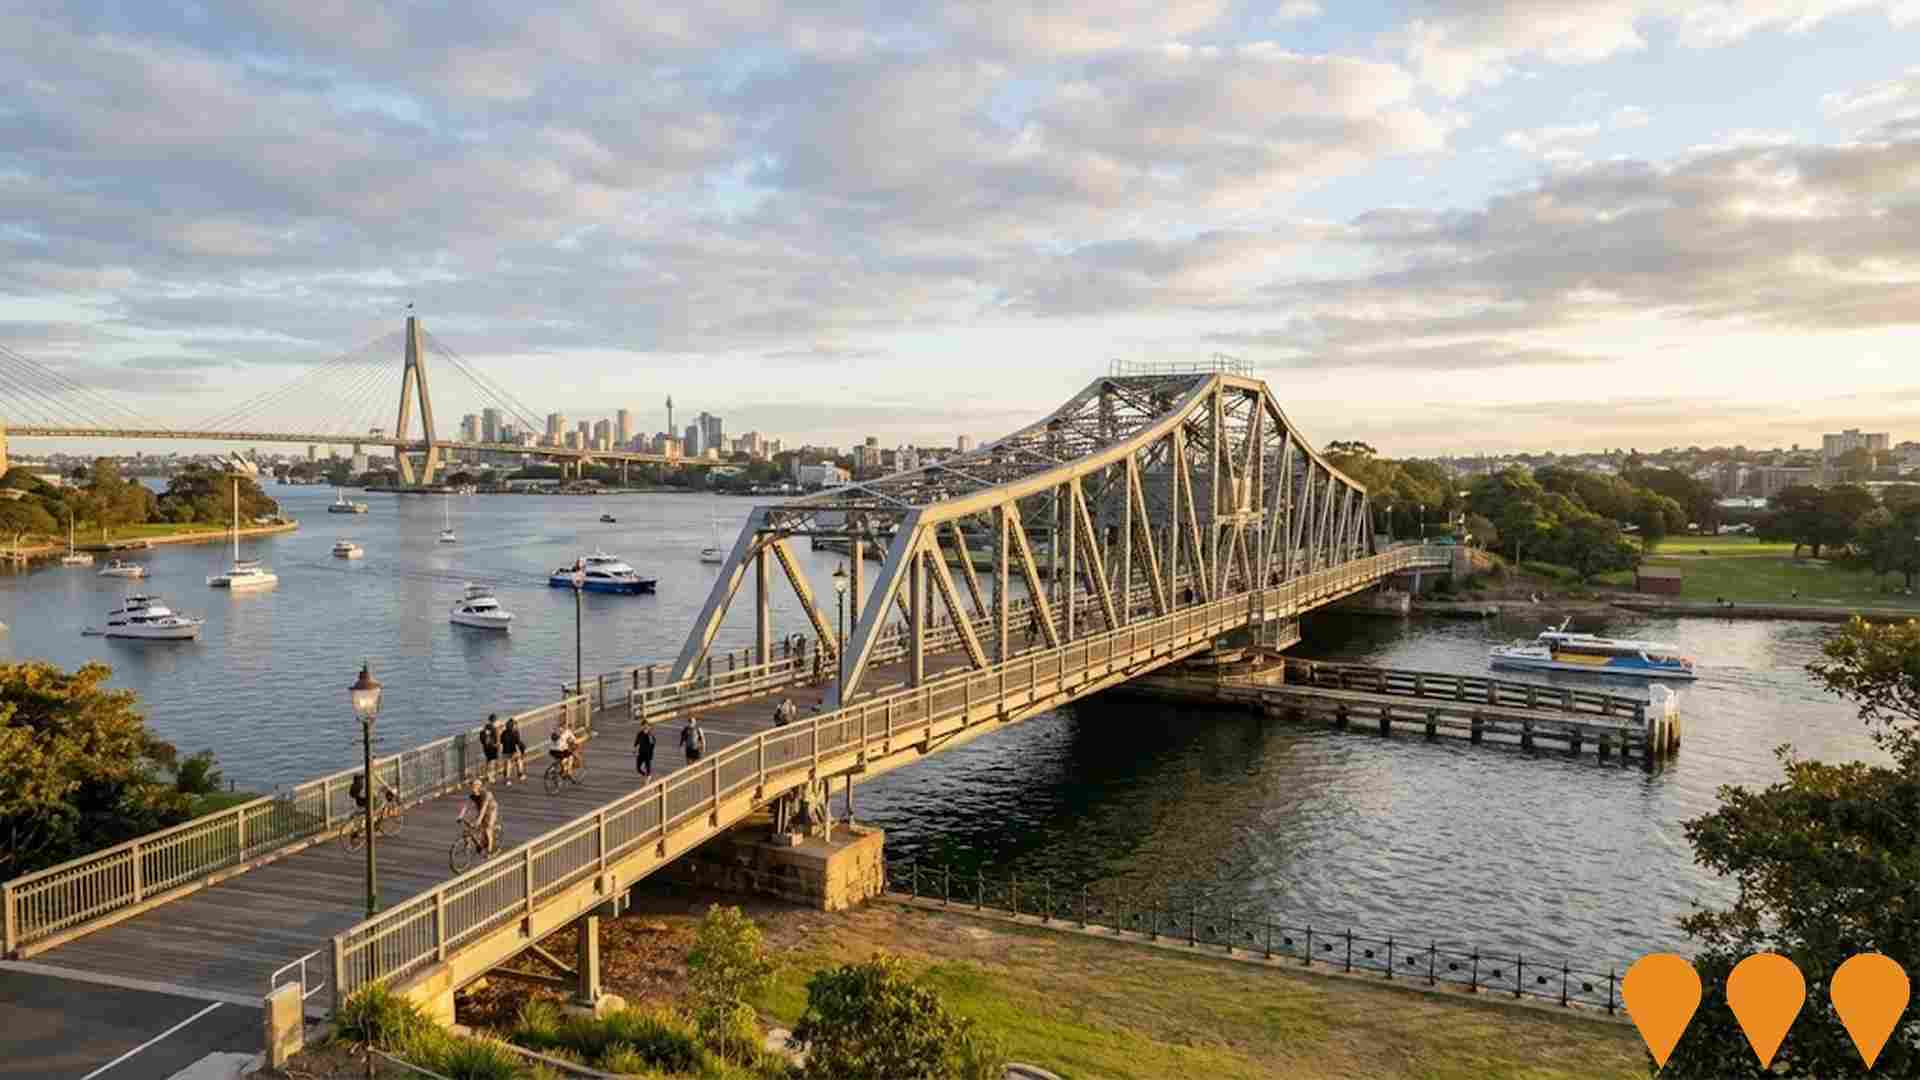
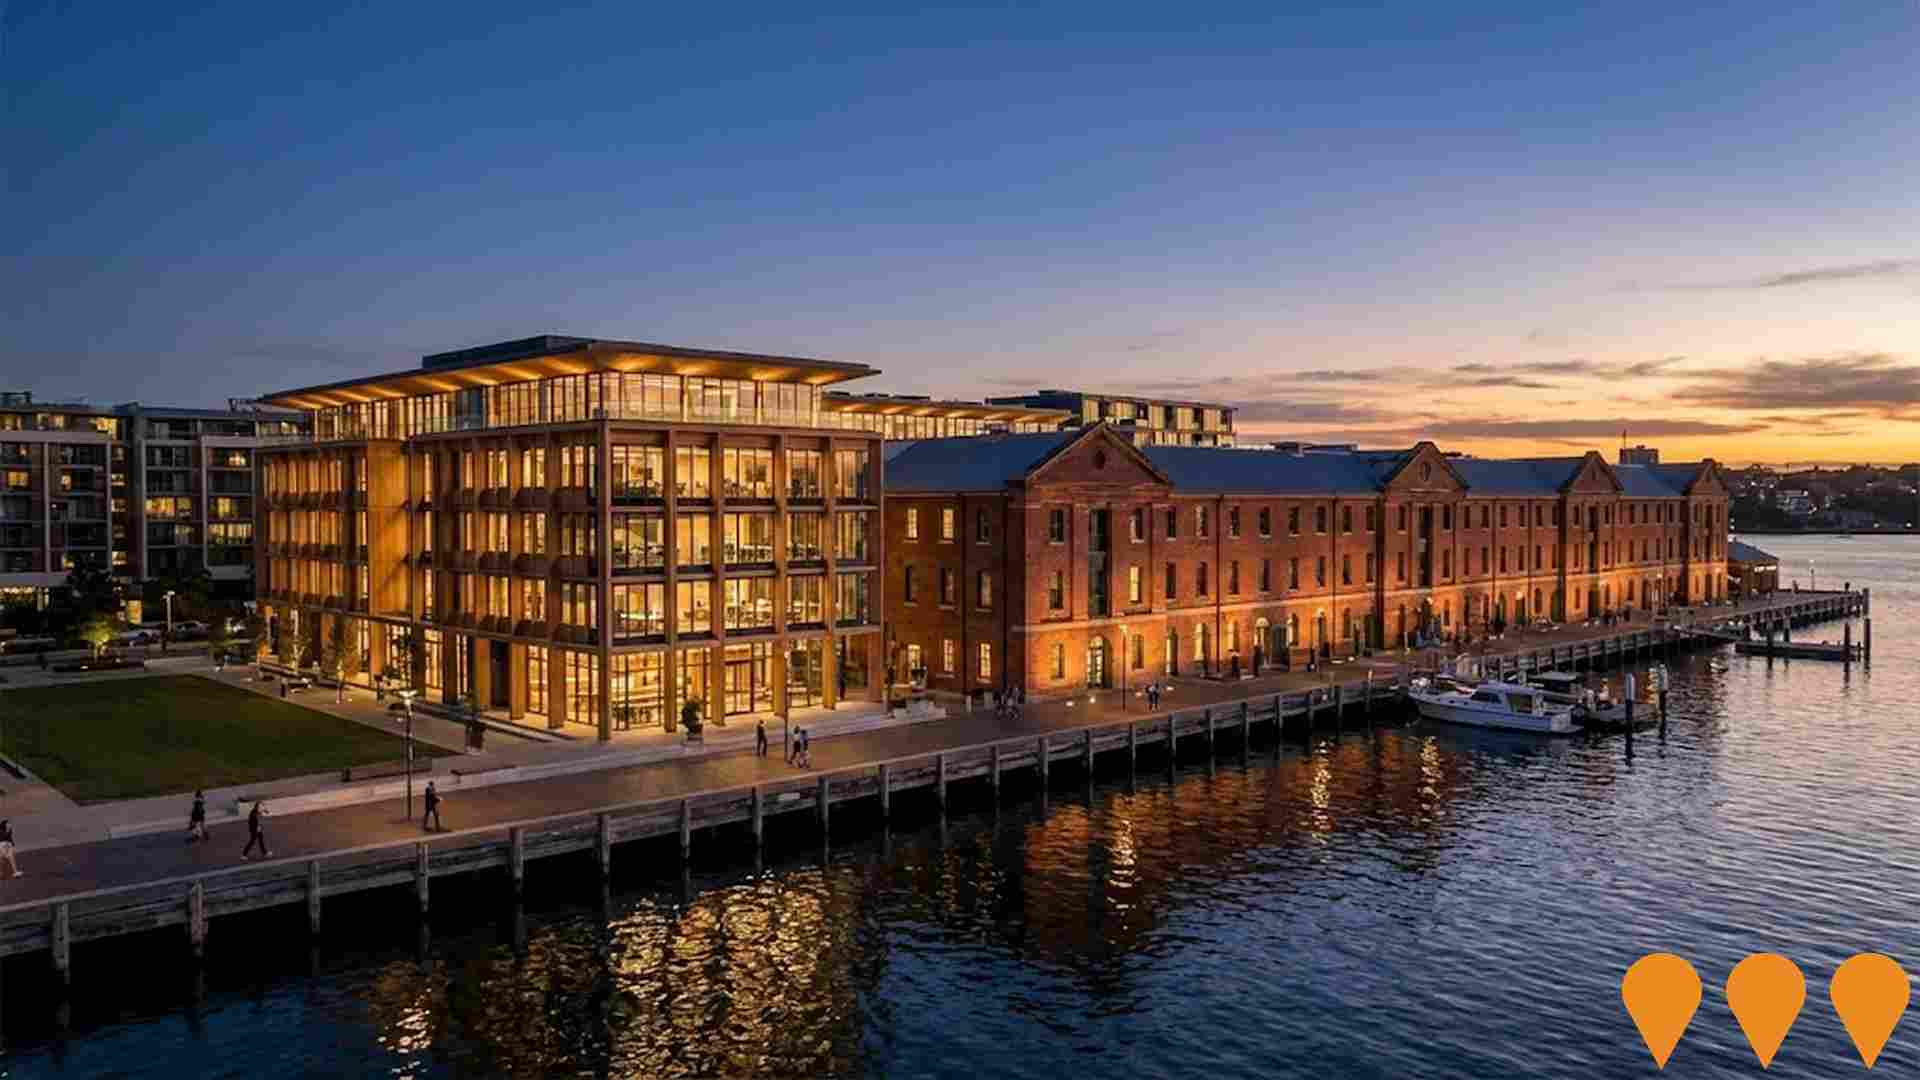
The NSW Government is delivering a purpose-built new Sydney Fish Market at Blackwattle Bay designed by 3XN with BVN and Aspect Studios. The c. 26,000 sqm facility will house retail, restaurants and bars, fishmongers and wholesale auction facilities, new wharf and boating infrastructure, and a continuous public foreshore promenade. Construction is nearing completion with government indicating building completion and handover to the operator in late 2025, with public opening scheduled for 19 January 2026. The project is expected to attract over 6 million visitors annually.
The Bays Metro Station & Precinct
The Bays Metro Station is part of the Bays West Transit Orientated Development (TOD) precinct, which will create a new urban centre with residential, commercial, and retail spaces connected to the Sydney Metro West line. The precinct rezoning is set to deliver more well-located homes.
Pyrmont Peninsula Place Strategy
The Pyrmont Peninsula Place Strategy is the NSW Government's 20-year vision for Pyrmont Peninsula. Endorsed in May 2022 and finalised in December 2022, it guides urban renewal of the peninsula into a vibrant, innovative, mixed-use precinct with up to 4,000 new homes, capacity for 23,000 additional jobs, new public spaces, improved transport and delivery of key infrastructure including a new Sydney Metro West station at Pyrmont.
Pyrmont Metro Station & Over Station Development
New underground Sydney Metro West station at Pyrmont with integrated over-station development. The station forms part of the 24km Metro West line between Westmead and The Bays. A 31-storey mixed-use tower above the station (SSD-52585731) includes 160 apartments, retail and commercial floor space. Station cavern excavation complete, TBMs arrived July 2025, platform and station fit-out underway. Over-station development construction expected to commence 2026.
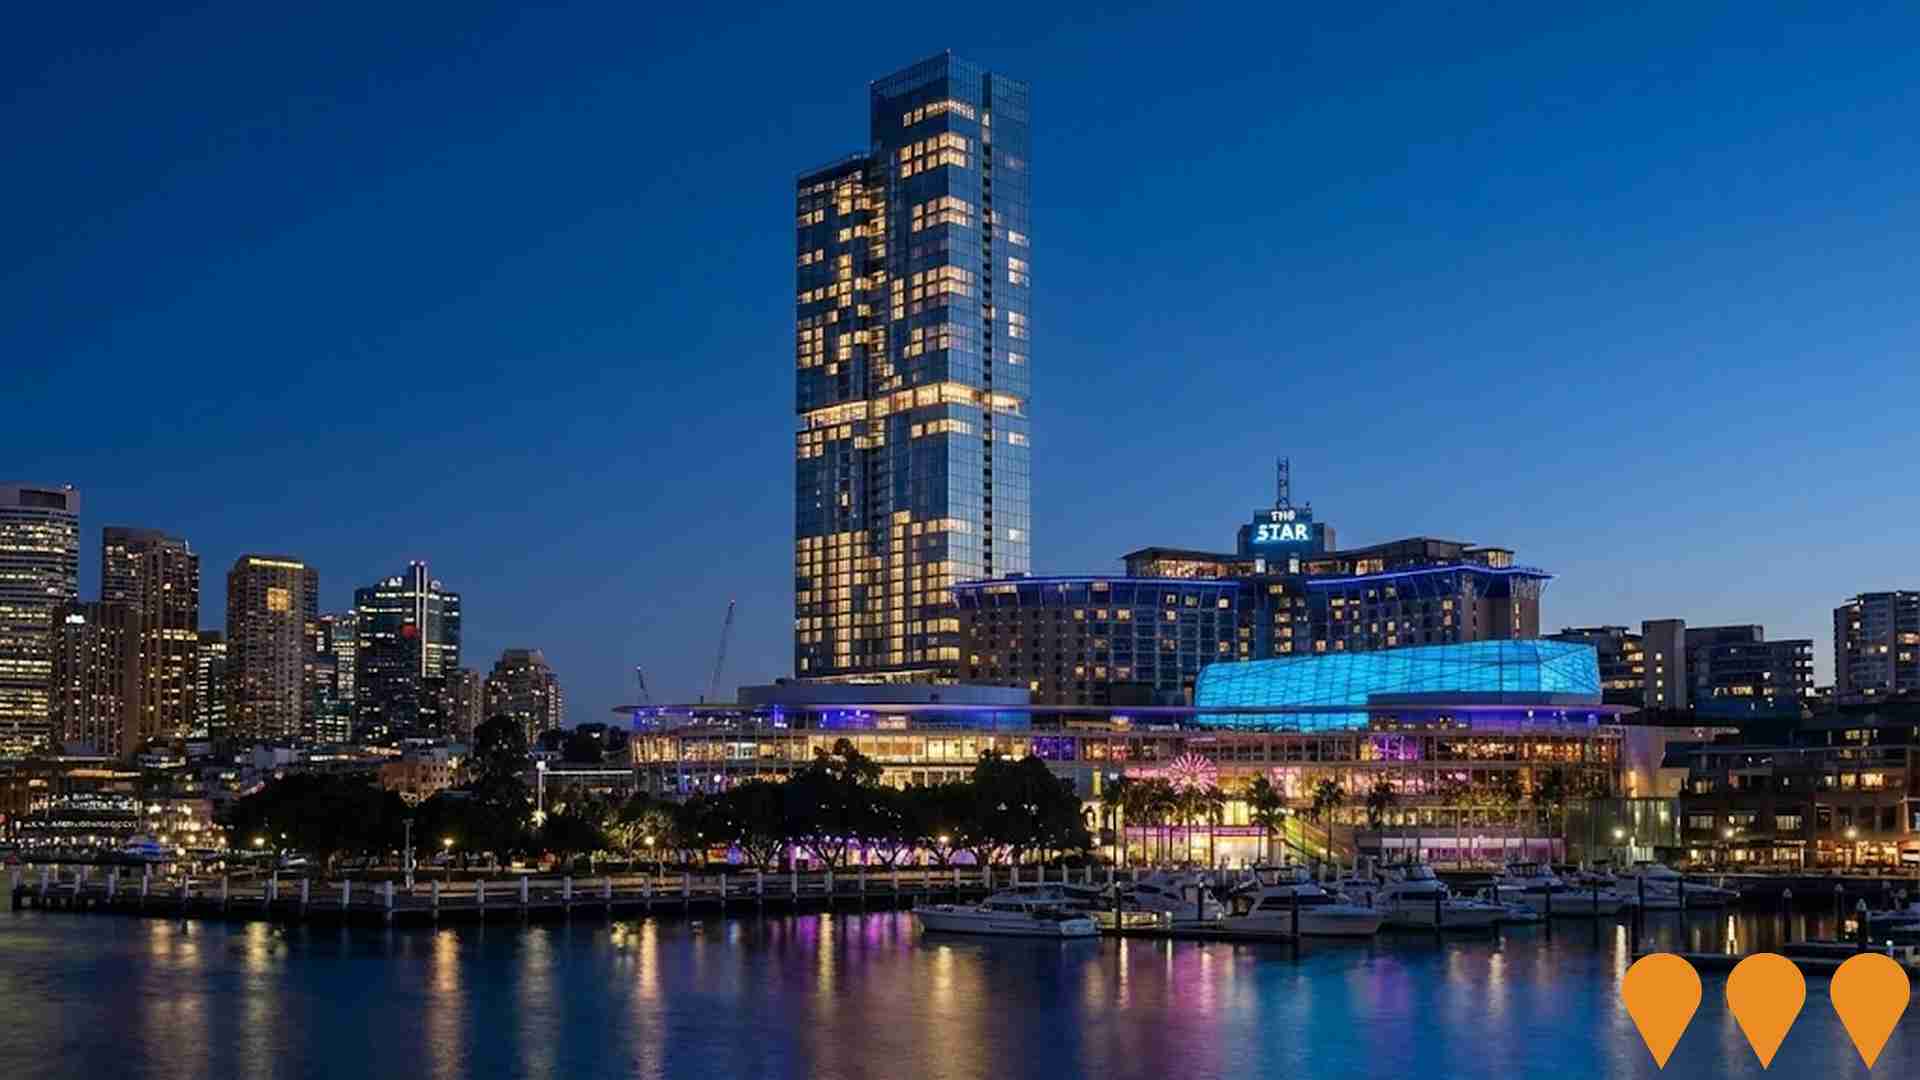
The Star Sydney - Ritz-Carlton Hotel & Lyric Theatre
66-storey Ritz-Carlton luxury hotel and residential tower (237 hotel rooms + 153 residential apartments) and new 1550-seat Lyric Theatre at The Star Sydney. Construction commenced in 2024 with main tower works expected to reach ground level by late 2025. The existing Event Centre and Lyric Theatre were sold to Foundation Theatres in January 2025 and will be converted into three new performance venues opening late 2025. Hotel and new theatre expected completion 2029.
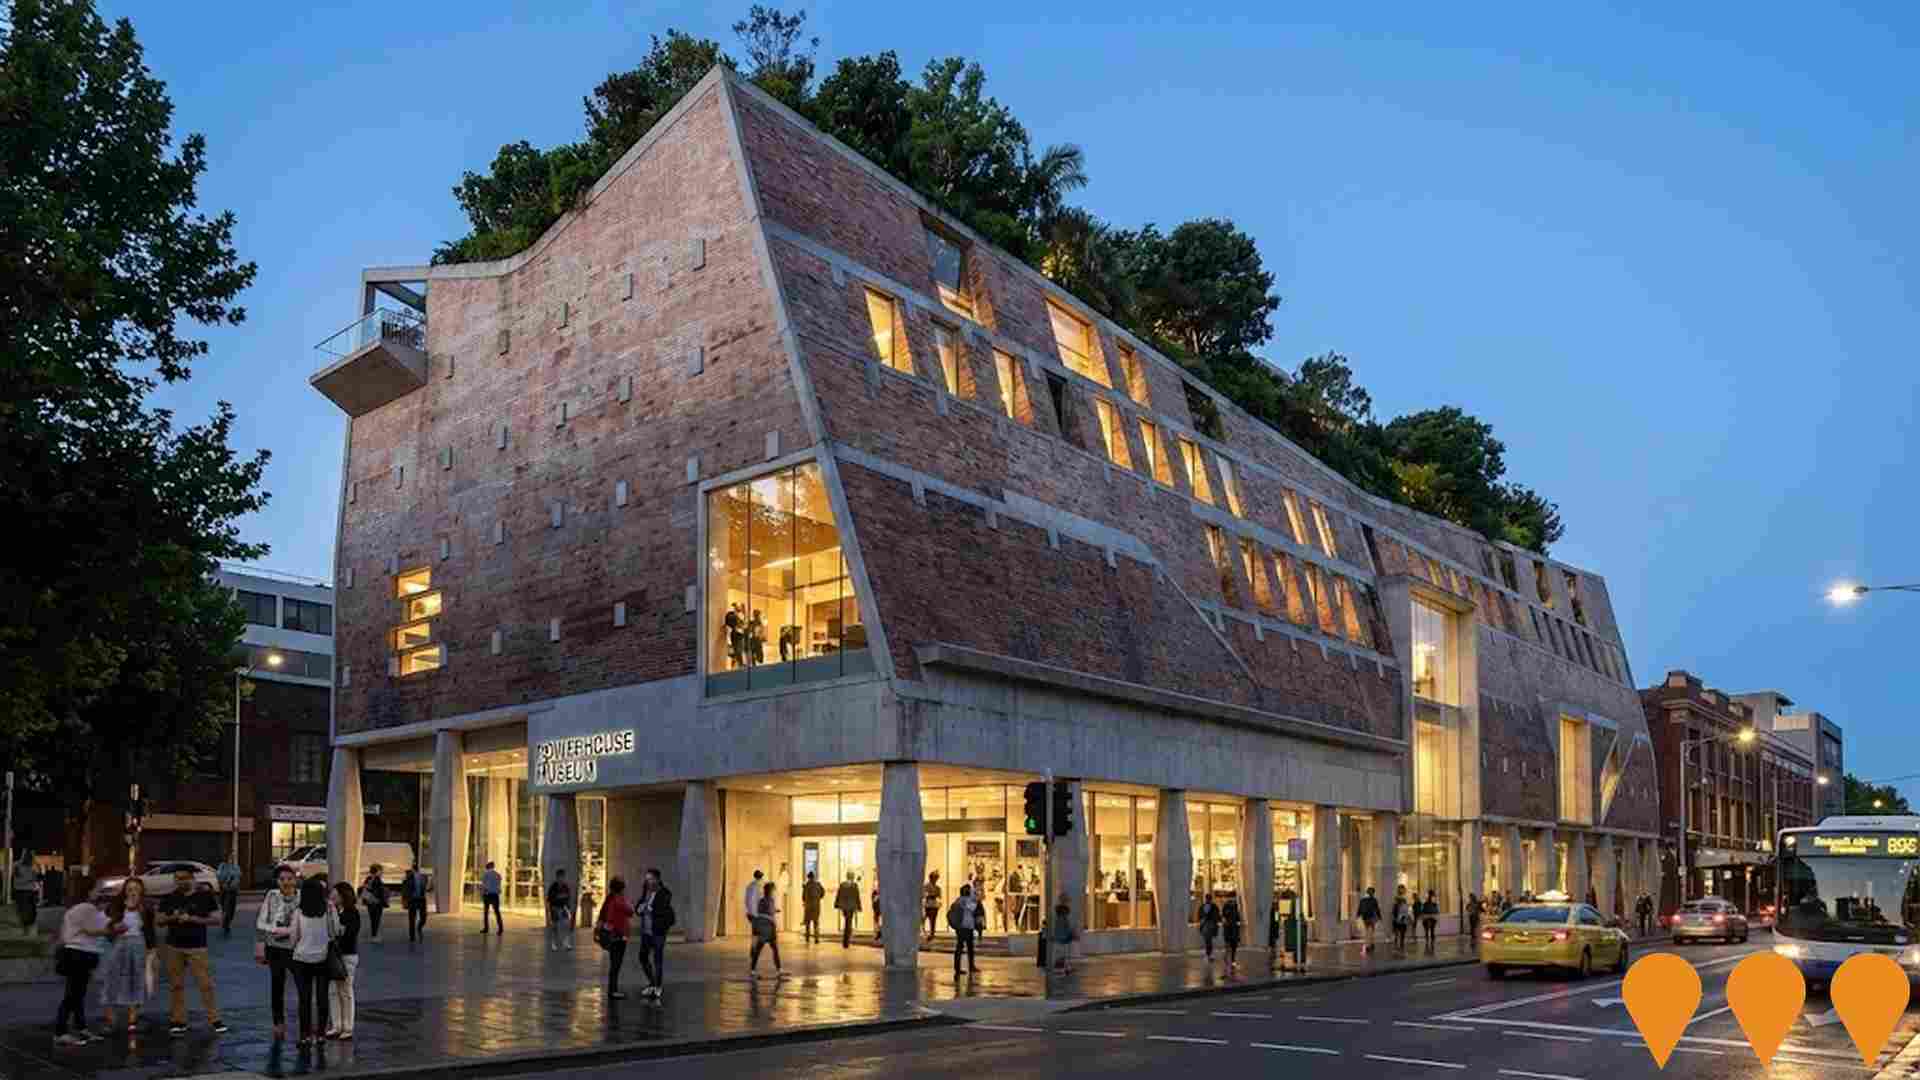
Powerhouse Ultimo Renewal
Major renewal and expansion of the Powerhouse Museum (Museum of Applied Arts and Sciences) in Ultimo. The project delivers new exhibition and education spaces, a 2,000 sqm public plaza on The Goods Line, rooftop venues, improved pedestrian links, heritage restoration of the Ultimo Powerhouse building, and adaptive reuse of the former Harwood building.
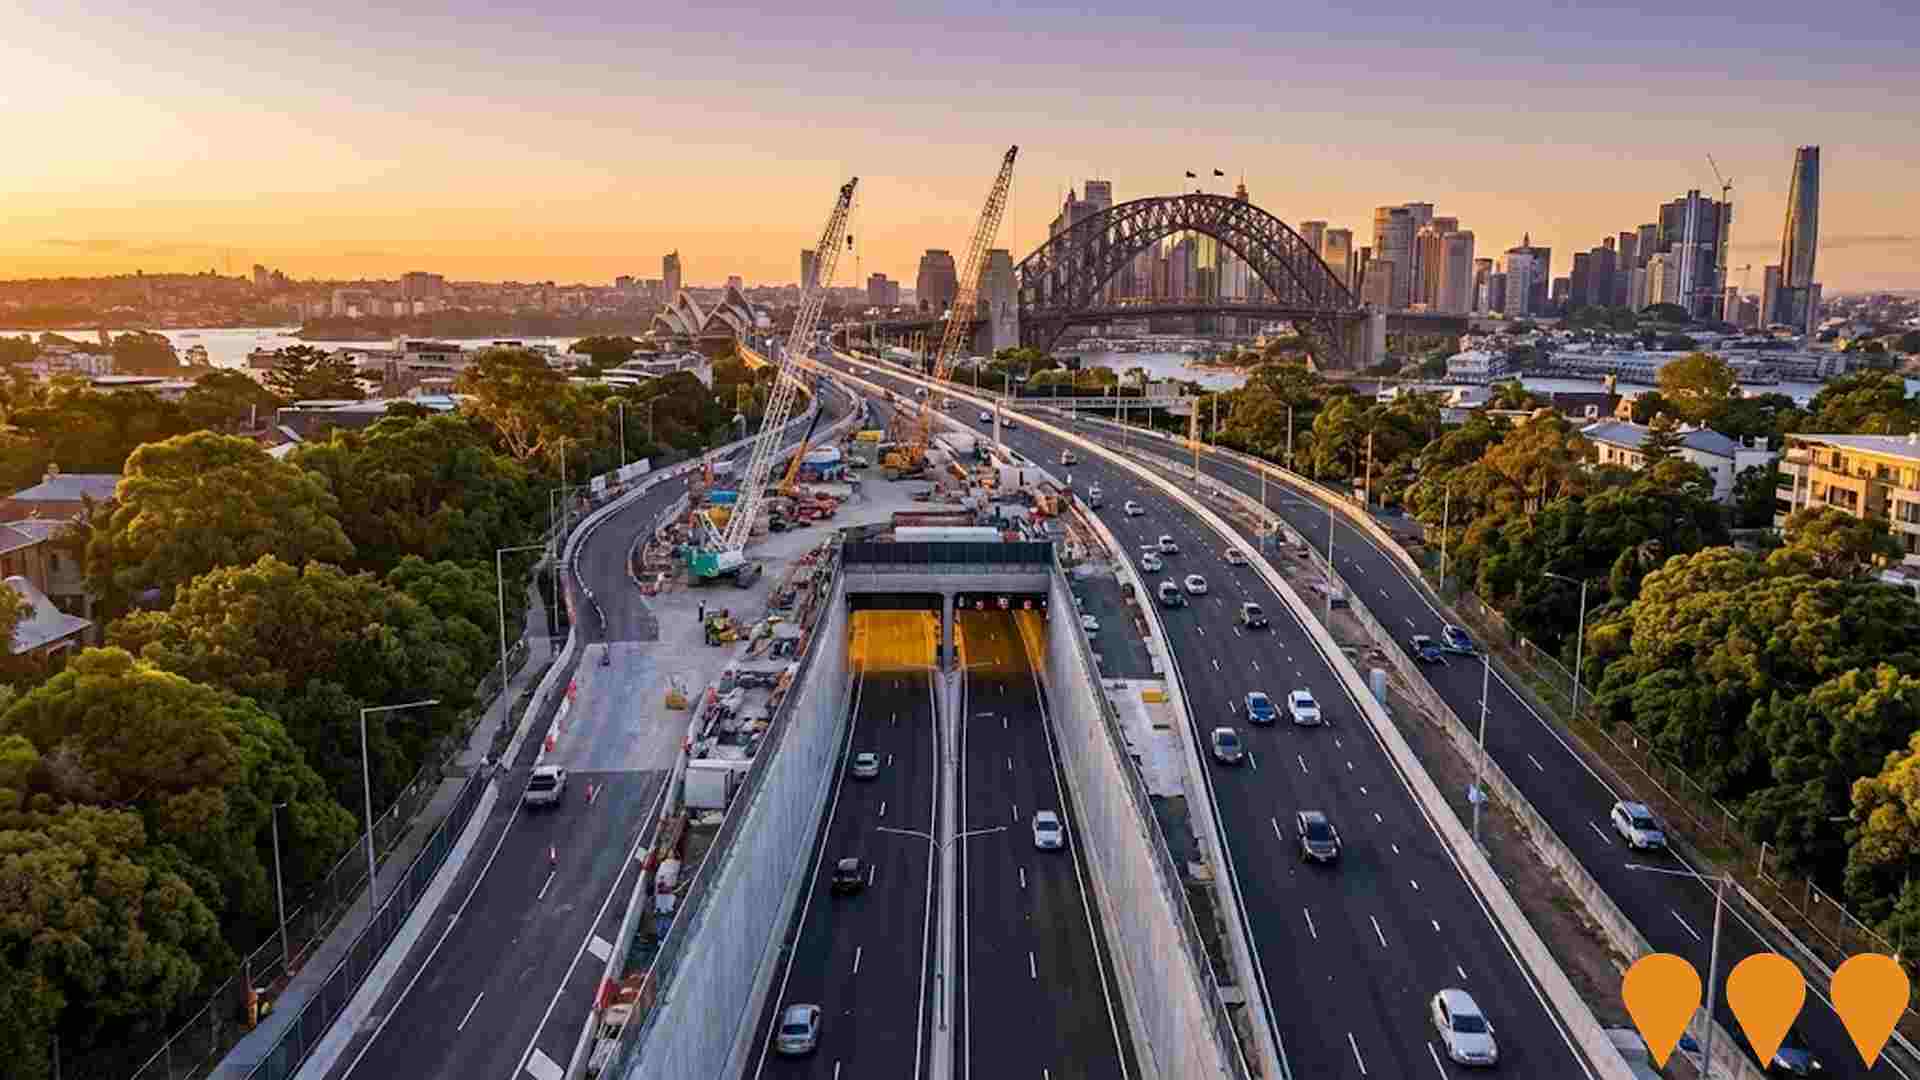
Western Harbour Tunnel
Major new motorway tunnel providing Sydney's third harbour crossing. Approximately 6.5 km of twin three-lane tunnels connecting the Rozelle Interchange (M4-M5 Link) to the Warringah Freeway at Cammeray, including immersed tube tunnels under Sydney Harbour. Delivered in two main contracts: Southern tunnel (Rozelle to Birchgrove) by John Holland CPB Contractors JV - tunnelling complete; Northern tunnel and harbour crossing by Acciona - tunnelling well underway with TBMs launched in 2025. Full opening targeted for 2028.
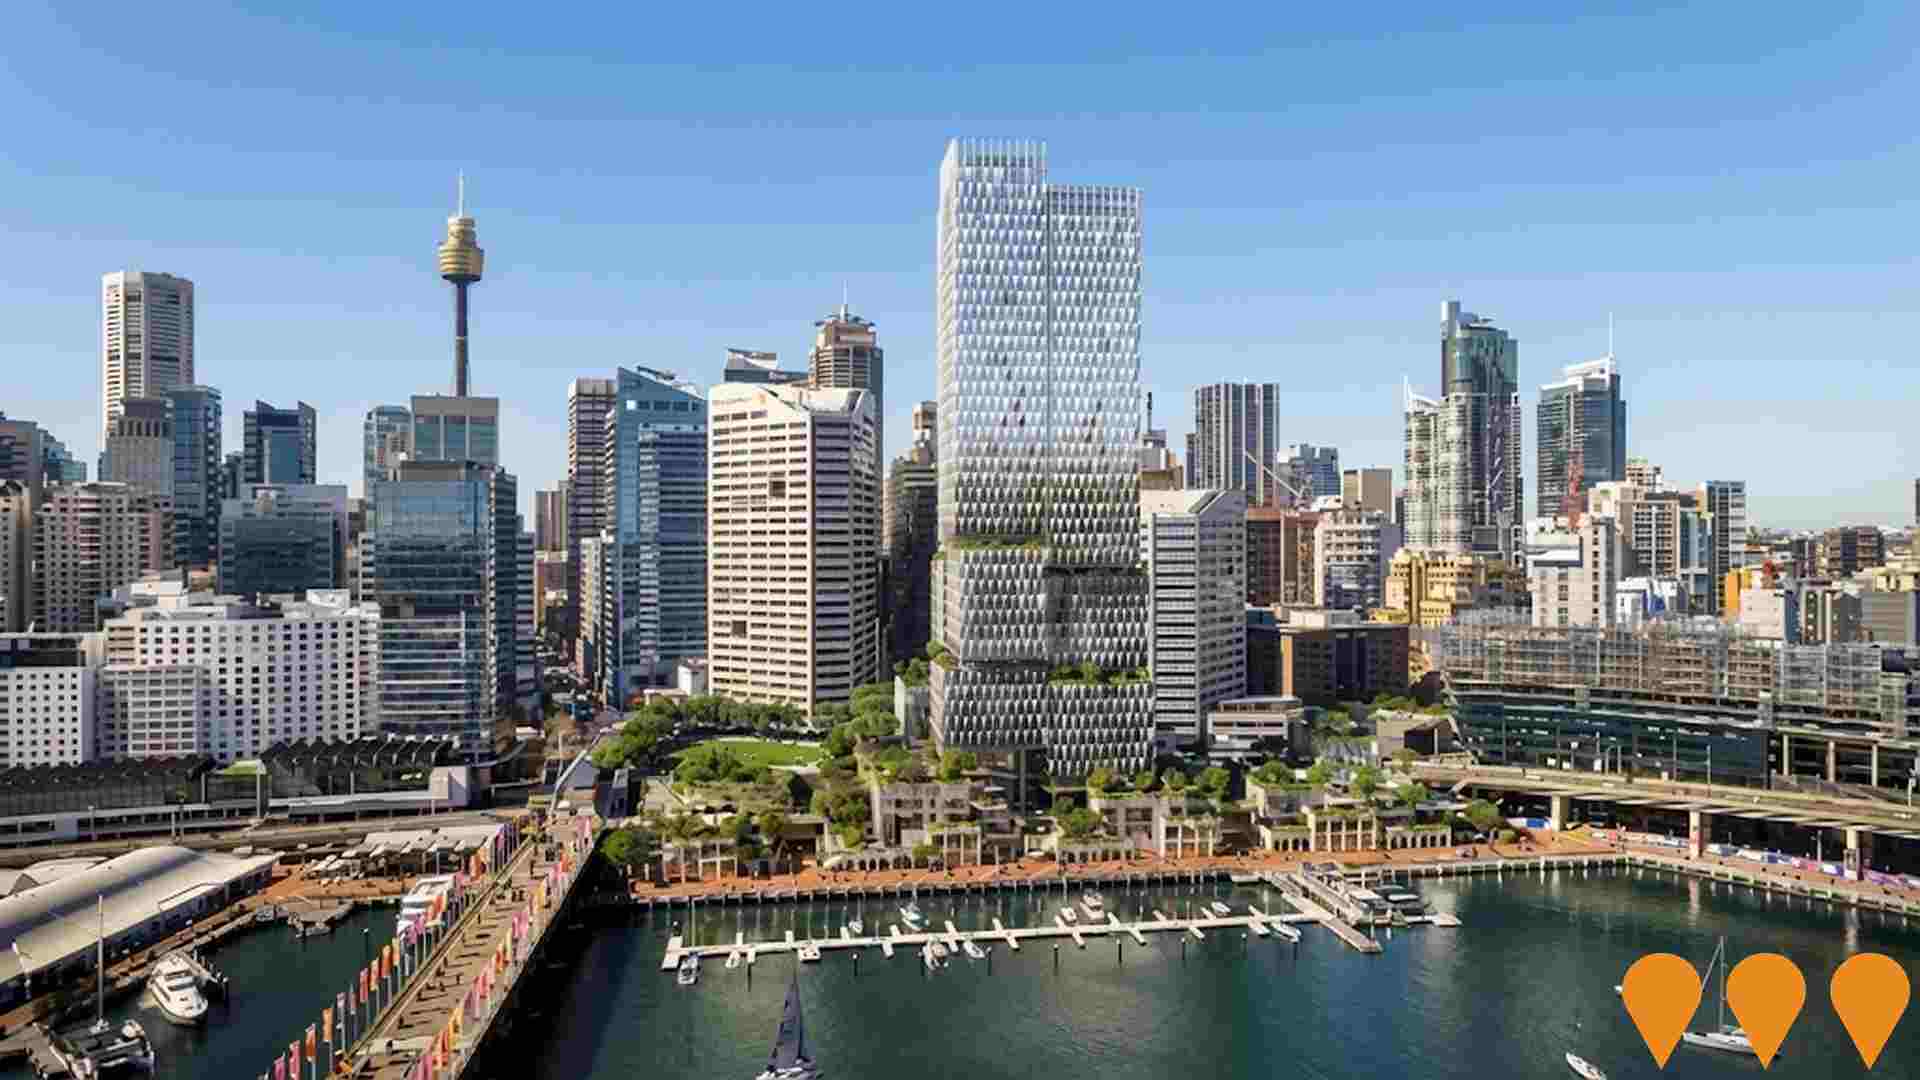
Cockle Bay Park (Cockle Bay Wharf Redevelopment)
State-significant mixed-use redevelopment of Cockle Bay Wharf delivering a 183-metre commercial office tower with approximately 75,000 sqm premium office space, 14,000 sqm retail and dining precinct, and 10,000 sqm of new elevated public parkland bridging the Western Distributor to reconnect the Sydney CBD with Darling Harbour.
Employment
Employment performance in Pyrmont has been broadly consistent with national averages
Pyrmont's workforce is highly educated with significant representation in the technology sector. Its unemployment rate was 3.5% as of September 2025.
In that month, 8,632 residents were employed at a rate 0.7% lower than Greater Sydney's 4.2%. Workforce participation in Pyrmont stood at 67.0%, exceeding Greater Sydney's 60.0%. Dominant employment sectors included professional & technical, finance & insurance, and accommodation & food. Notably, the area had a concentration of professional & technical jobs at 1.8 times the regional average, while health care & social assistance was under-represented at 7.8% compared to Greater Sydney's 14.1%.
There were 1.5 workers per resident as recorded in the Census, indicating Pyrmont functions as an employment hub attracting workers from nearby areas. Between September 2024 and September 2025, Pyrmont's labour force decreased by 1.3% while employment declined by 1.7%, causing unemployment to rise by 0.4 percentage points. In contrast, Greater Sydney saw employment increase by 2.1% and the labour force grow by 2.4%. Statewide in NSW, between November 2024 and November 2025, employment contracted by 0.03%, with unemployment at 3.9%. Nationally, the unemployment rate was 4.3%. Jobs and Skills Australia's national employment forecasts from May 2025 project a 6.6% increase over five years and 13.7% over ten years. Applying these projections to Pyrmont's employment mix suggests local employment should increase by 7.3% over five years and 14.4% over ten years, though this is a simplified extrapolation for illustrative purposes.
Frequently Asked Questions - Employment
Income
Income metrics indicate excellent economic conditions, with the area achieving higher performance than 75% of national locations assessed by AreaSearch
Pyrmont SA2 had a median taxpayer income of $63,456 and an average of $105,118 in the 2022 financial year, according to postcode level ATO data aggregated by AreaSearch. This is notably higher than Greater Sydney's median income of $56,994 and average income of $80,856. By September 2025, estimated incomes would be approximately $71,458 (median) and $118,373 (average), based on Wage Price Index growth of 12.61% since the 2022 financial year. The 2021 Census places Pyrmont's household, family, and personal incomes between the 88th and 94th percentiles nationally. Income distribution shows that 30.6% of residents (4,276 people) fall into the $1,500 - $2,999 weekly bracket, which is consistent with broader trends in the area. Notably, 41.8% of residents earn more than $3,000 weekly. High housing costs consume 20.1% of income, but strong earnings place disposable income at the 82nd percentile nationally. The area's SEIFA income ranking places it in the 9th decile.
Frequently Asked Questions - Income
Housing
Pyrmont features a more urban dwelling mix with significant apartment living, with above-average rates of outright home ownership
The latest Census evaluation of Pyrmont's dwelling structure showed 0.0% houses and 100.0% other dwellings (semi-detached, apartments, 'other' dwellings), compared to Sydney metro's 2.3% houses and 97.7% other dwellings. Home ownership in Pyrmont was at 18.3%, with the remainder being mortgaged (18.5%) or rented (63.2%). The median monthly mortgage repayment was $2,800, higher than Sydney metro's average of $2,705. The median weekly rent in Pyrmont was $580, compared to Sydney metro's $550. Nationally, Pyrmont's mortgage repayments were significantly higher than the Australian average of $1,863, and rents were substantially above the national figure of $375.
Frequently Asked Questions - Housing
Household Composition
Pyrmont features high concentrations of group households and lone person households, with a higher-than-average median household size
Family households constitute 57.4% of all households, including 15.9% couples with children, 33.1% couples without children, and 7.0% single parent families. Non-family households account for the remaining 42.6%, with lone person households at 33.0% and group households comprising 9.6%. The median household size is 2.1 people, larger than the Greater Sydney average of 1.9.
Frequently Asked Questions - Households
Local Schools & Education
Pyrmont shows strong educational performance, ranking in the upper quartile nationally when assessed across multiple qualification and achievement indicators
Pyrmont's residents aged 15 and above have a higher educational attainment than national and state averages. 59.3% of Pyrmont residents hold university qualifications, compared to 30.4% in Australia and 32.2% in NSW. Bachelor degrees are the most common at 37.0%, followed by postgraduate qualifications (18.8%) and graduate diplomas (3.5%). Vocational pathways account for 21.3% of qualifications, with advanced diplomas at 11.7% and certificates at 9.6%.
Educational participation is high, with 27.2% of residents currently enrolled in formal education. This includes 7.6% in tertiary education, 4.5% in primary education, and 3.6% pursuing secondary education.
Frequently Asked Questions - Education
Schools Detail
Nearby Services & Amenities
Transport
Transport servicing is high compared to other areas nationally based on assessment of service frequency, route connectivity and accessibility
Pyrmont has 30 active public transport stops offering a mix of ferry, light rail, and bus services. These stops are served by five different routes, together accommodating 3,824 weekly passenger trips. The area's transport accessibility is rated excellent, with residents, on average, located just 123 meters from the nearest stop.
Services run at an average frequency of 546 trips per day across all routes, translating to roughly 127 weekly trips per individual stop.
Frequently Asked Questions - Transport
Transport Stops Detail
Health
Pyrmont's residents boast exceedingly positive health performance metrics with very low prevalence of common health conditions across all age groups
Health outcomes data shows excellent results across Pyrmont, with very low prevalence of common health conditions across all age groups. The rate of private health cover is exceptionally high at approximately 74% of the total population (10,300 people), compared to 69.7% across Greater Sydney and a national average of 55.3%. The most common medical conditions in the area are asthma and mental health issues, affecting 5.7% and 5.7% of residents respectively, while 79.1% report being completely clear of medical ailments compared to 77.4% across Greater Sydney.
Pyrmont has 14.3% of residents aged 65 and over (1,999 people), which is higher than the 9.7% in Greater Sydney. Health outcomes among seniors are particularly strong, broadly in line with the general population's health profile.
Frequently Asked Questions - Health
Cultural Diversity
Pyrmont is among the most culturally diverse areas in the country based on AreaSearch assessment of a range of language and cultural background related metrics
Pyrmont's cultural diversity is notable, with 43.1% speaking a language other than English at home and 56.2% born overseas. Christianity is the predominant religion in Pyrmont, accounting for 37.0% of its population. However, Buddhism shows an overrepresentation, comprising 7.0% compared to Greater Sydney's 7.1%.
The top three ancestry groups are Other (18.4%), English (16.8%), and Chinese (14.6%). Some ethnic groups show notable divergences: Spanish is overrepresented at 1.3%, Russian at 1.1%, and Korean at 1.7% compared to regional percentages of 1.0%, 0.8%, and 1.1% respectively.
Frequently Asked Questions - Diversity
Age
Pyrmont's population is slightly younger than the national pattern
Pyrmont's median age is 37, matching Greater Sydney's figure of 37 and closely resembling Australia's median age of 38 years. The 25-34 age group constitutes 25.8% of Pyrmont's population, higher than Greater Sydney's percentage but lower than the national average of 14.5%. The 5-14 age group makes up 5.2% of Pyrmont's population. Between 2021 and present, the 15 to 24 age group has increased from 7.9% to 9.7%, while the 75 to 84 cohort has risen from 3.5% to 4.9%. Conversely, the 55 to 64 age group has decreased from 10.5% to 9.3%, and the 0 to 4 age group has fallen from 4.8% to 3.7%. By 2041, demographic projections indicate significant shifts in Pyrmont's age structure. Notably, the 25 to 34 age group is projected to grow by 95%, reaching 7,042 people from its current figure of 3,605. Meanwhile, both the 45 to 54 and 35 to 44 age groups are expected to decrease in number.


