Chart Color Schemes
This analysis uses ABS Statistical Areas Level 2 (SA2) boundaries, which can materially differ from Suburbs and Localities (SAL) even when sharing similar names.
SA2 boundaries are defined by the Australian Bureau of Statistics and are designed to represent communities for statistical reporting (e.g., census and ERP).
Suburbs and Localities (SAL) represent commonly-used suburb/locality names (postal-style areas) and may use different geographic boundaries. For comprehensive analysis, consider reviewing both boundary types if available.
est. as @ -- *
ABS ERP | -- people | --
2021 Census | -- people
Sales Activity
Curious about local property values? Filter the chart to assess the volume and appreciation (including resales) trends and regional comparisons, or scroll to the map below view this information at an individual property level.
Find a Recent Sale
Sales Detail
Population
Population growth drivers in Chippendale are slightly above average based on AreaSearch's ranking of recent, and medium term trends
Chippendale's population is around 9,509 as of November 2025. This reflects an increase of 1,706 people (21.9%) since the 2021 Census, which reported a population of 7,803 people. The change is inferred from the estimated resident population of 9,490 from the ABS as of June 2024 and an additional 16 validated new addresses since the Census date. This level of population equates to a density ratio of 20,671 persons per square kilometer. Chippendale's growth rate exceeded the state (6.7%) and metropolitan area, marking it as a growth leader in the region. Population growth was primarily driven by overseas migration contributing approximately 95.4% of overall population gains during recent periods.
AreaSearch is adopting ABS/Geoscience Australia projections for each SA2 area, released in 2024 with 2022 as the base year. For areas not covered, AreaSearch utilises NSW State Government's SA2 level projections released in 2022 with 2021 as the base year. Growth rates by age group are applied to all areas for years 2032 to 2041. Population projections predict exceptional growth over the period, with the area expected to expand by 4,843 persons to 2041 based on latest annual ERP population numbers, reflecting an increase of 50.7% in total over the 17 years.
Frequently Asked Questions - Population
Development
Residential development activity is lower than average in Chippendale according to AreaSearch's national comparison of local real estate markets
Chippendale has recorded approximately 28 residential properties granted approval each year. Over the past five financial years, from FY-21 to FY-25, a total of 143 homes were approved, with no approvals so far in FY-26. On average, 3.1 people moved to the area annually for each dwelling built over these five years.
This high demand outpaces supply, which typically drives up prices and increases competition among buyers. The average construction cost of new properties is $18,000, lower than regional levels, suggesting more affordable housing options for buyers.
In FY-26, Chippendale has registered $53.7 million in commercial approvals, indicating strong commercial development momentum. Compared to Greater Sydney, Chippendale shows approximately 56% of the construction activity per person and ranks among the fourth percentile nationally in terms of buyer options, suggesting limited choices while demand for established dwellings strengthens. This activity is below the national average, indicating the area's established nature and potential planning limitations. According to the latest AreaSearch quarterly estimate, Chippendale is forecasted to gain 4,824 residents by 2041. If current construction levels persist, housing supply may lag population growth, likely intensifying buyer competition and supporting price growth.
Frequently Asked Questions - Development
Infrastructure
Chippendale has strong levels of nearby infrastructure activity, ranking in the top 30% nationally
Changes to local infrastructure significantly influence an area's performance. AreaSearch has identified 23 projects likely impacting the area. Key projects include The Post House, Tech Central Innovation Precinct, University of Sydney Darlington Terraces Redevelopment, and UTS National First Nations College. The following list details those most relevant.
Professional plan users can use the search below to filter and access additional projects.
INFRASTRUCTURE SEARCH
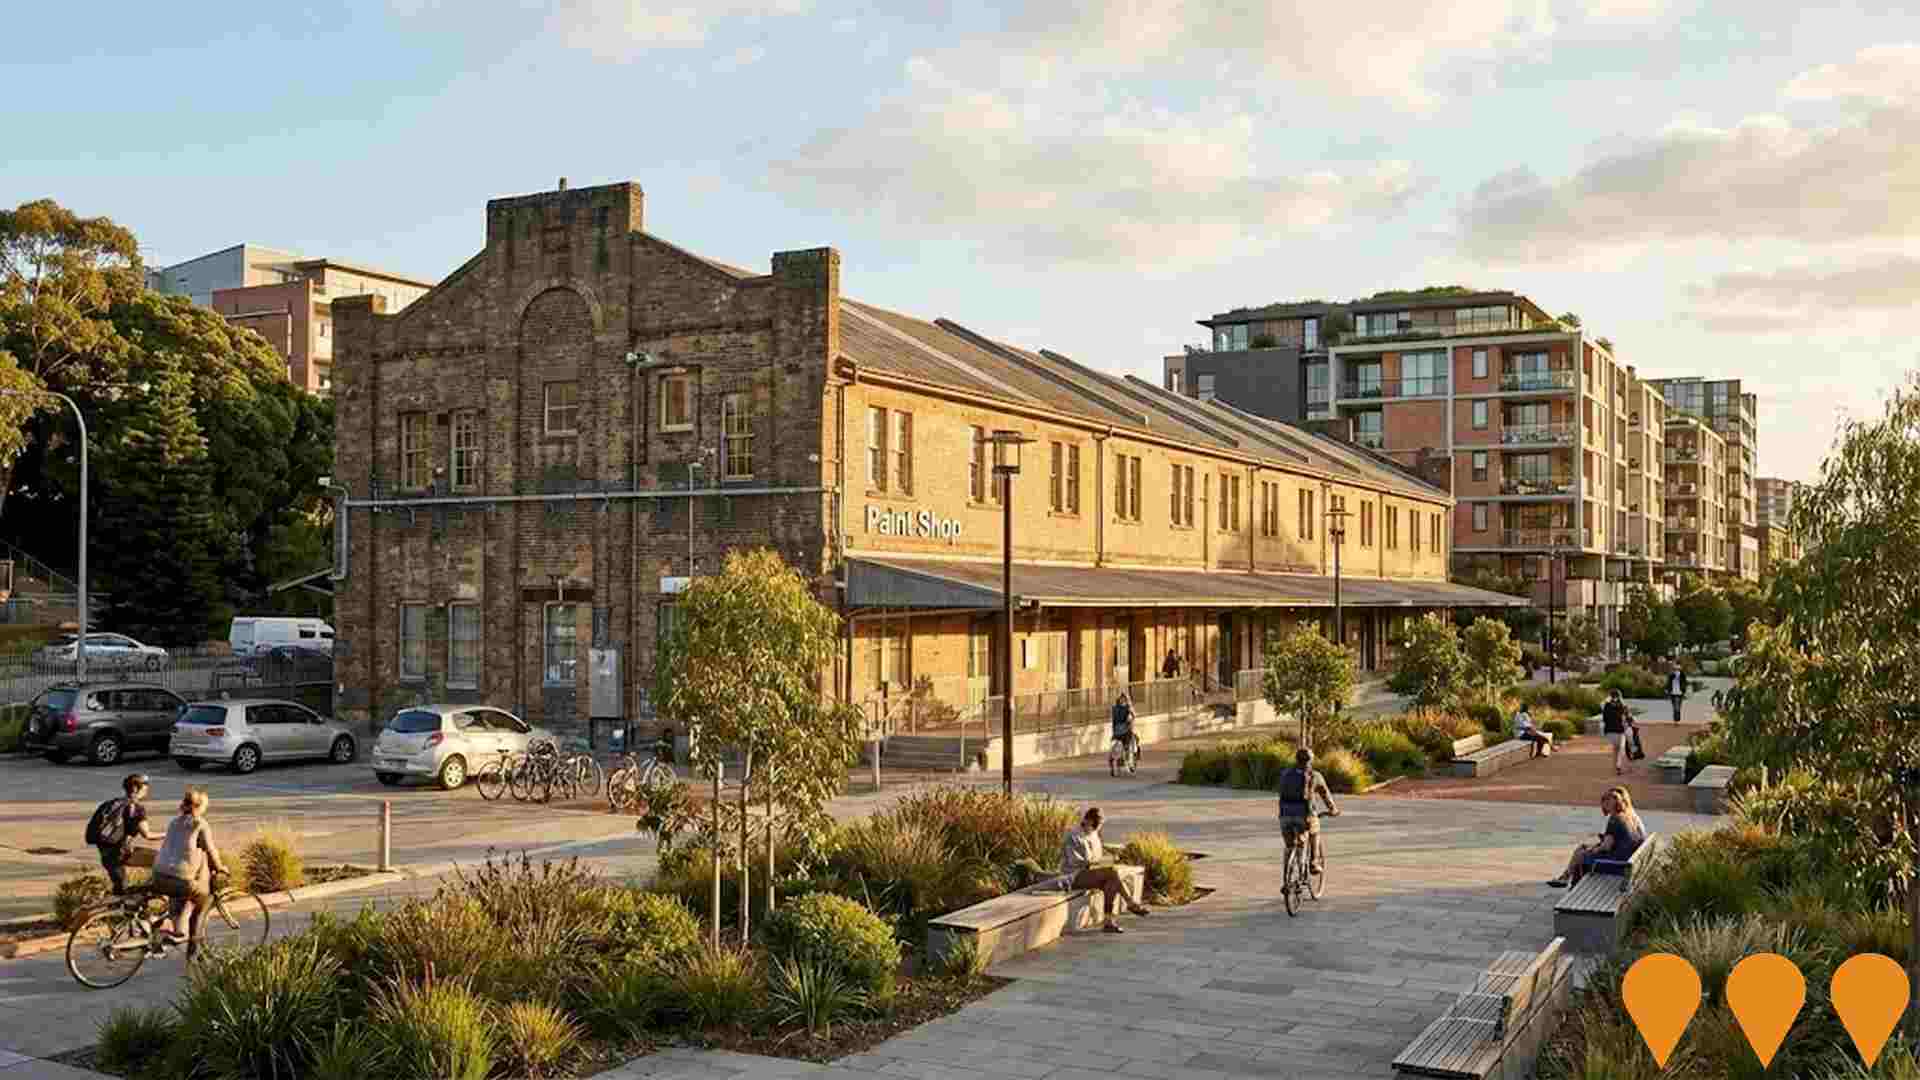
 Denotes AI-based impression for illustrative purposes only, not to be taken as definitive under any circumstances. Please follow links and conduct other investigations from the project's source for actual imagery. Developers and project owners wishing us to use original imagery please Contact Us and we will do so.
Frequently Asked Questions - Infrastructure
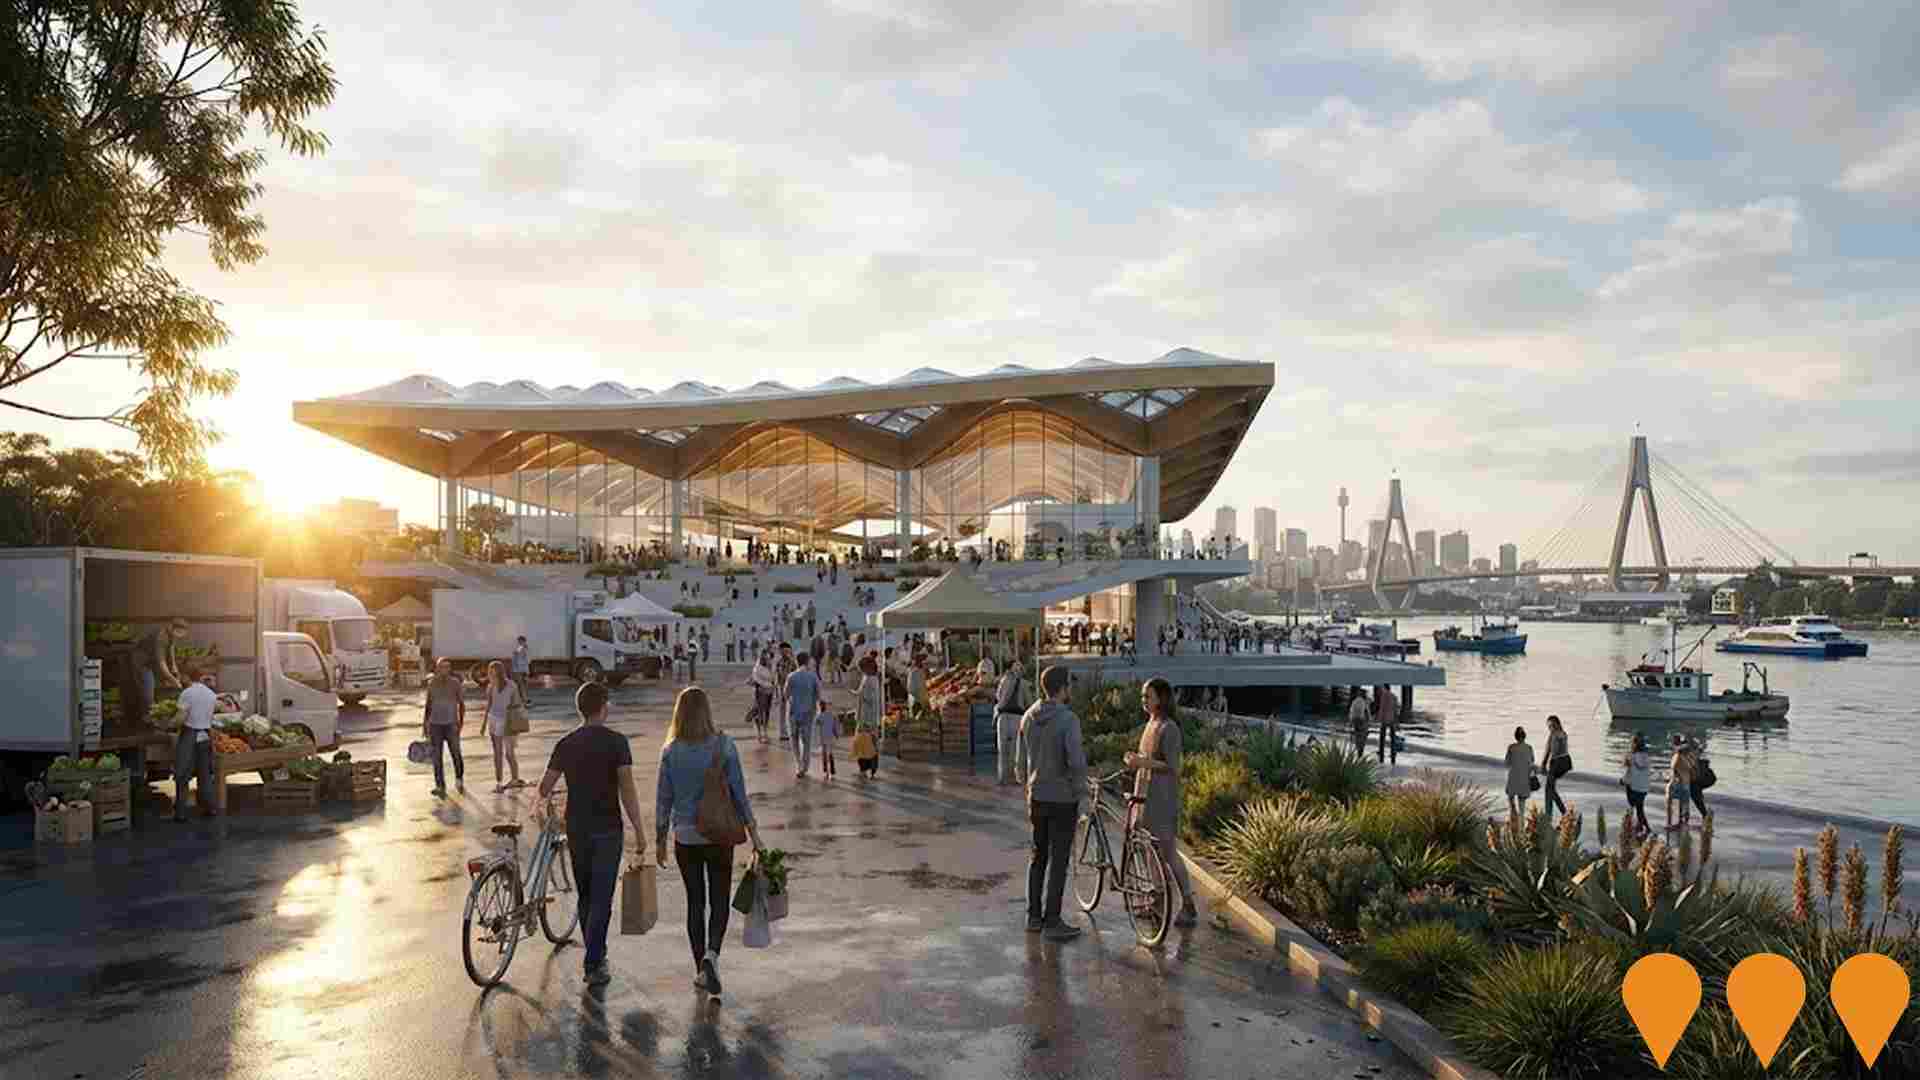
New Sydney Fish Market
The NSW Government is delivering a purpose-built new Sydney Fish Market at Blackwattle Bay designed by 3XN with BVN and Aspect Studios. The c. 26,000 sqm facility will house retail, restaurants and bars, fishmongers and wholesale auction facilities, new wharf and boating infrastructure, and a continuous public foreshore promenade. Construction is nearing completion with government indicating building completion and handover to the operator in late 2025, with public opening scheduled for 19 January 2026. The project is expected to attract over 6 million visitors annually.
Tech Central Innovation Precinct
A 6ha+ innovation district spanning Central Station, South Eveleigh, Camperdown and Haymarket. Designed to be Australia's leading deep-tech and advanced manufacturing hub with over 250,000 sqm of new commercial floor space, 25,000+ new jobs and co-location of universities, startups, scale-ups and global tech firms. Multiple buildings already under construction or completed (e.g. Tech Central Scaleup Hub, Atlassian HQ, Quantum Terminal, UTS Central Stage 2).

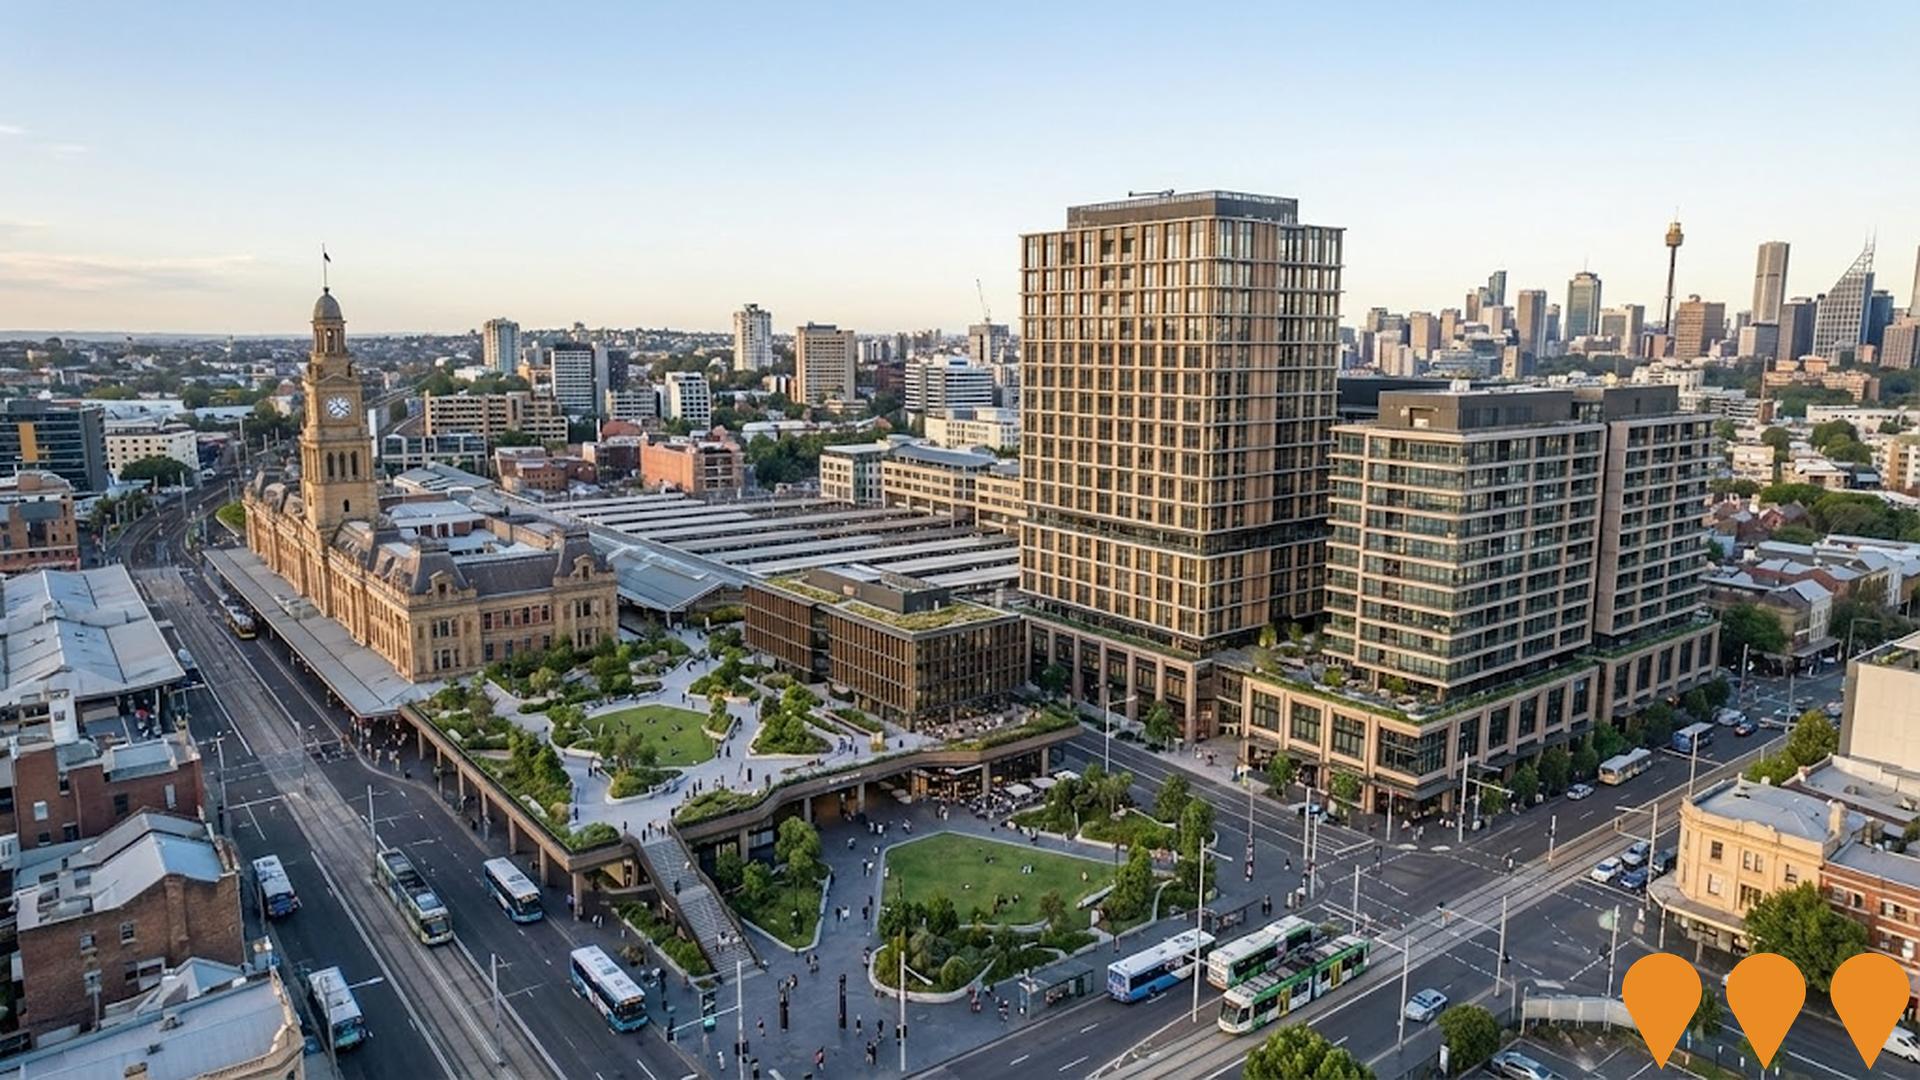
Central Precinct Renewal Program
The Central Precinct Renewal Program (formerly Central to Eveleigh) transforms 24 hectares of government land around Sydney's Central Station into a global innovation and technology precinct known as 'Tech Central'. The project involves building a deck over the rail lines to create new public squares, parks, and mixed-use towers. Key developments include the Atlassian Central hybrid timber tower and Central Place Sydney. Rezoning was approved in August 2025, enabling approx 950 new homes, 28,700 jobs, and improved pedestrian connections between Surry Hills, Chippendale, and Redfern.
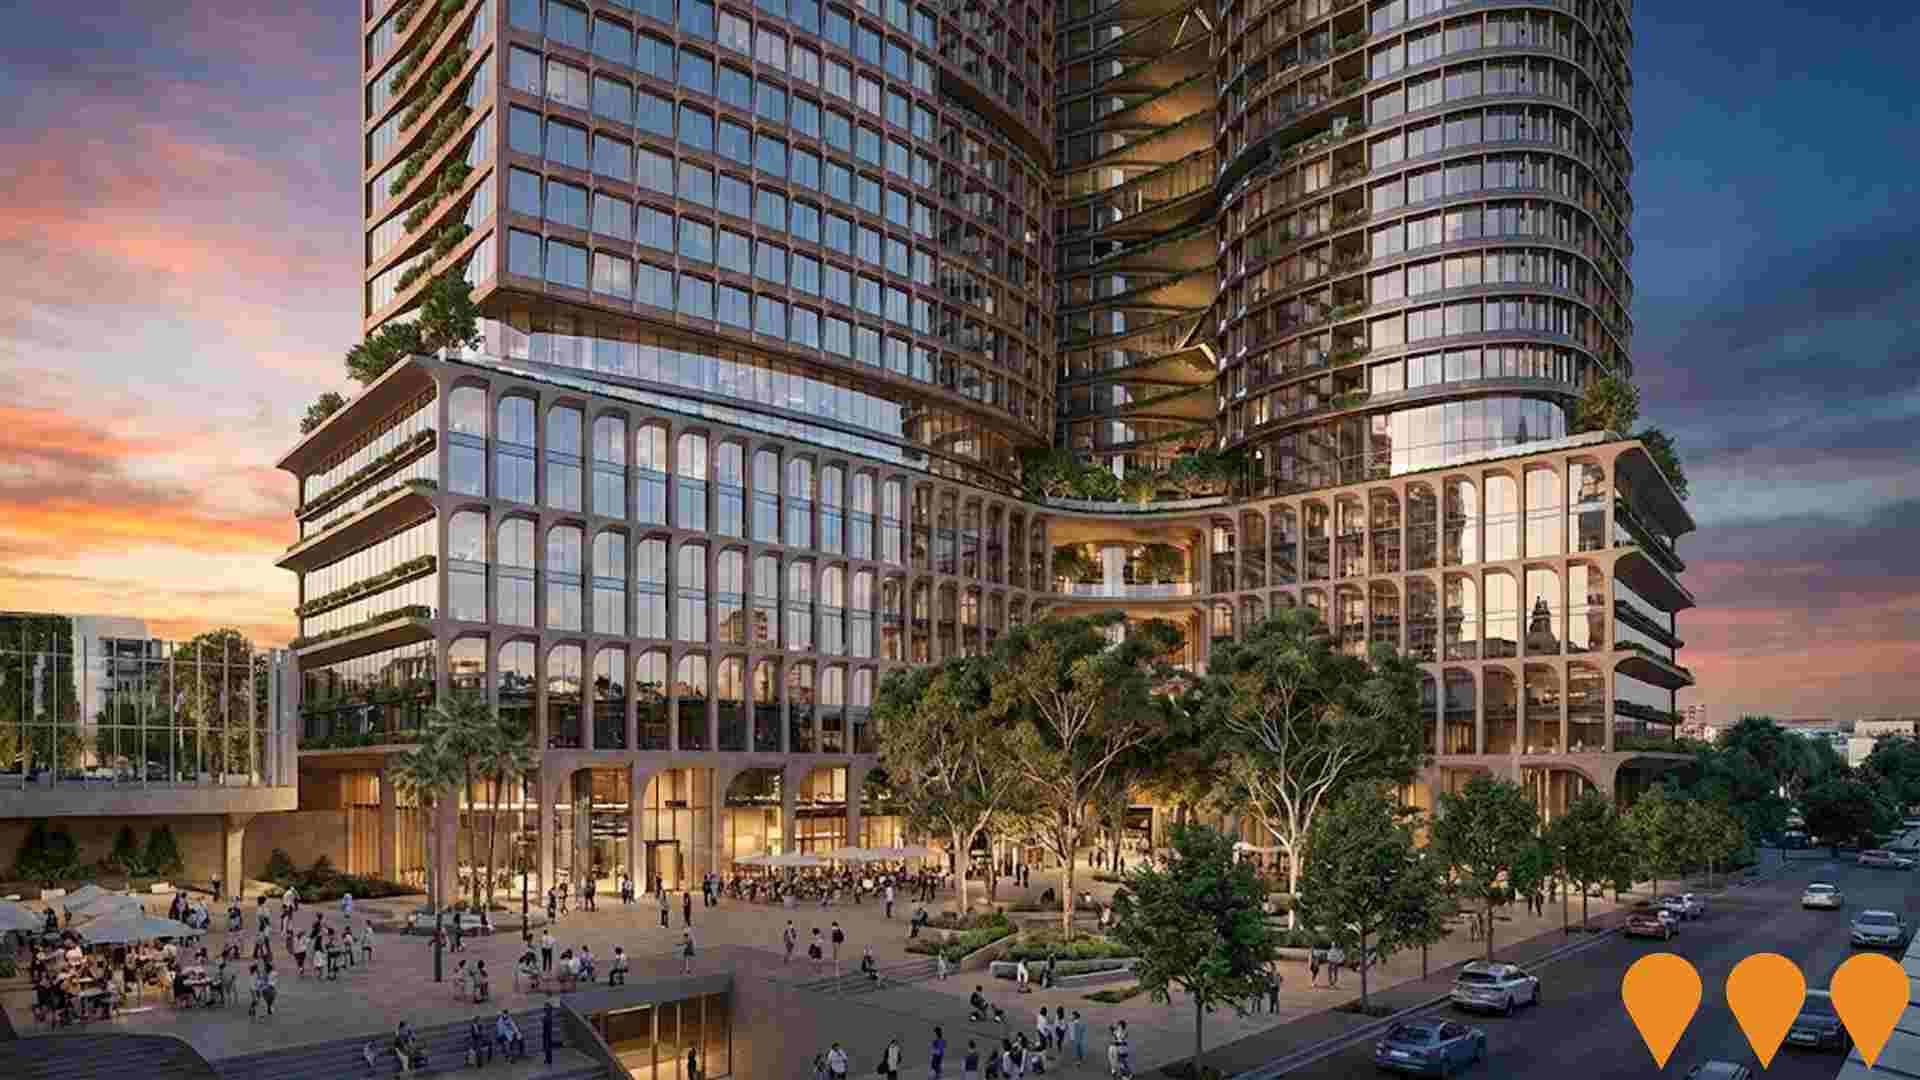
Central Place Sydney
A $3 billion flagship commercial development at the heart of Sydney's 'Tech Central' precinct. The project features two sustainable office towers (35 and 37 storeys) and a low-rise 'connector' building, delivering over 130,000sqm of premium workspace. Designed by SOM and Fender Katsalidis, it aims for 100% renewable energy operations and includes AI-powered closed cavity facades, extensive public realm upgrades, and retail amenities. It will serve as a workplace for over 15,000 employees.
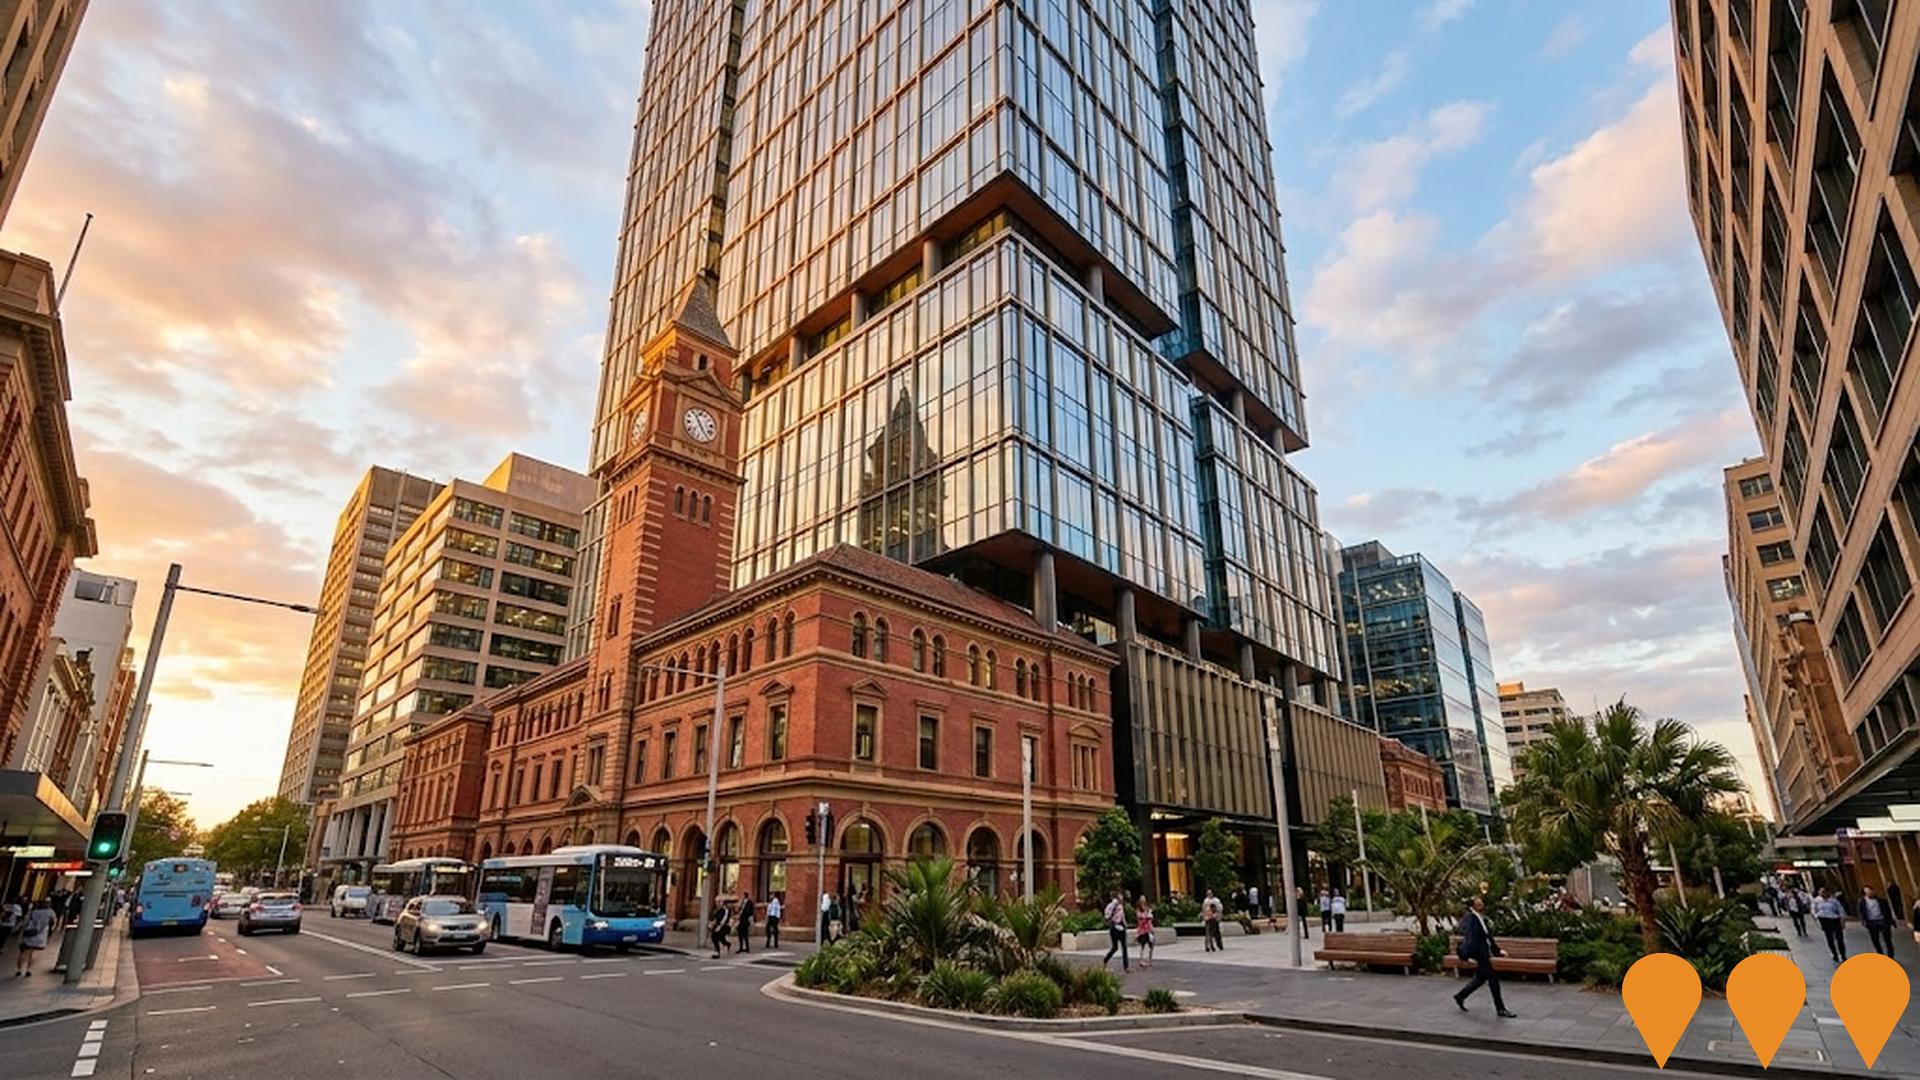
The Post House
45-storey mixed-use tower in the Tech Central precinct incorporating the heritage-listed former Parcels Post Office. Delivers 29,228sqm premium office space, 204-key hotel (levels 10-19), ground-floor and podium retail, co-working spaces, rooftop pool and day spa, and a new public plaza (Henry Deane Plaza). Construction is well underway with completion expected 2028.
Atlassian Central
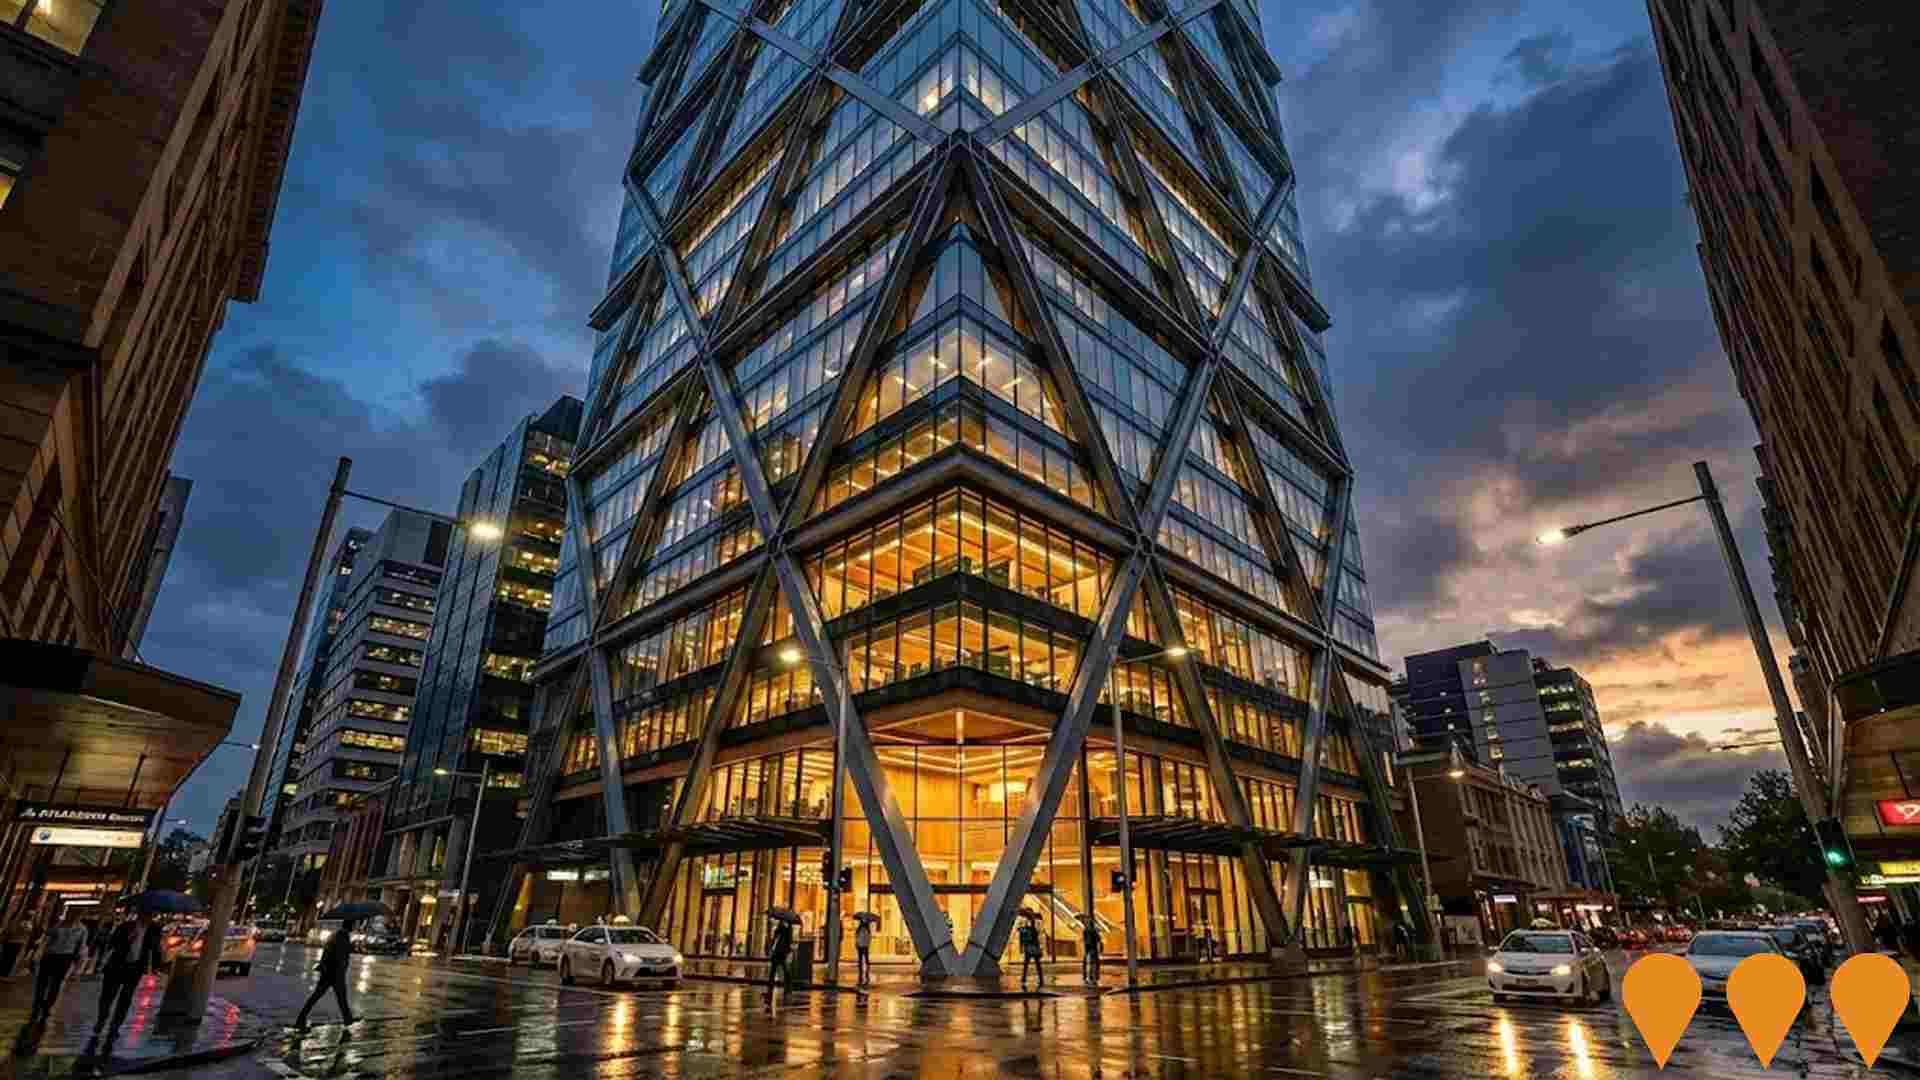
Atlassian's global headquarters, a 39-storey tower designed by SHoP Architects and BVN, anchoring the Tech Central precinct. It is set to be the world's tallest commercial hybrid timber building, featuring a steel exoskeleton and glass facade, providing 75,000sqm of office space. The project integrates the heritage-listed Parcels Building and includes YHA accommodation on lower levels. The design targets a 50% reduction in embodied carbon and operates on 100% renewable energy. Construction began in August 2022 and is forecast for practical completion in November 2026.
Mariyung Fleet (New Intercity Fleet)
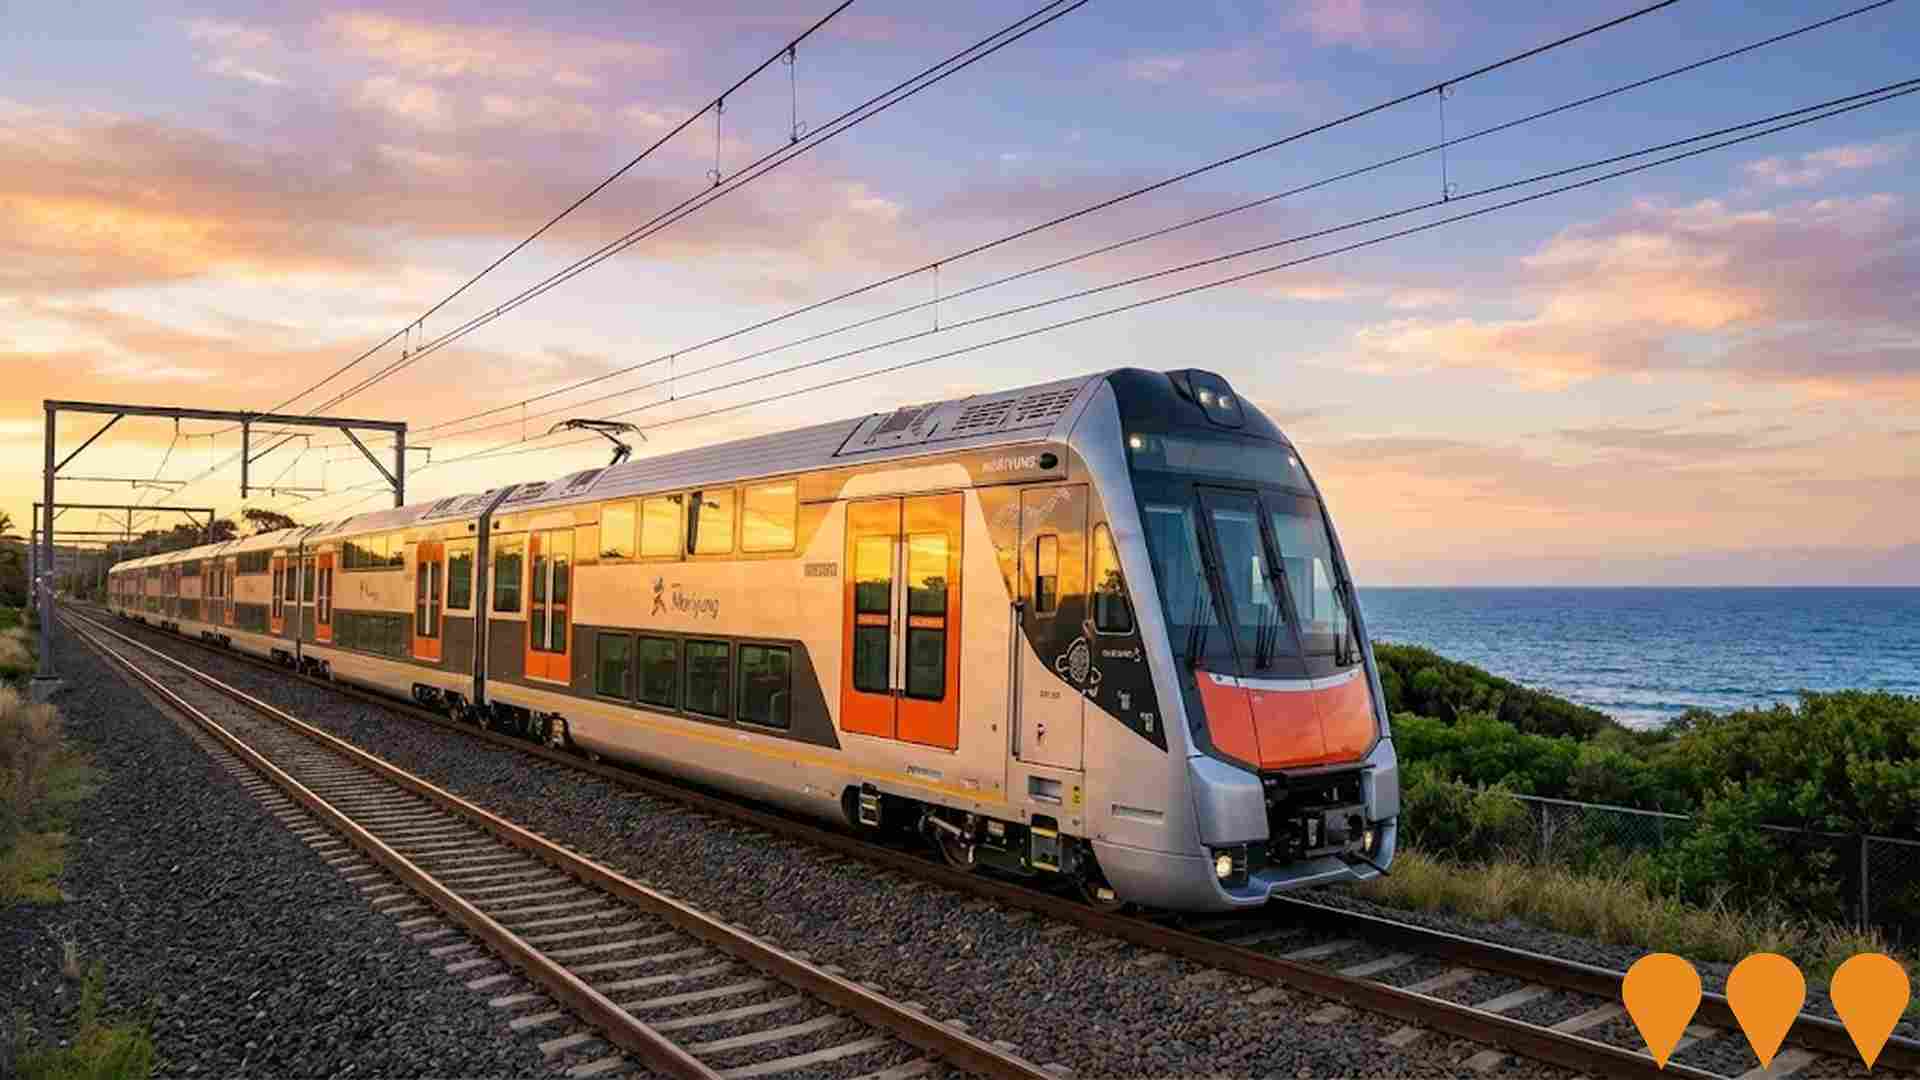
The Mariyung Fleet is a 610-carriage double-deck electric train fleet being delivered by RailConnect NSW (UGL, Hyundai Rotem, Mitsubishi Electric Australia) for Transport for NSW. Named after the Darug word for emu, the fleet commenced passenger services on the Central Coast & Newcastle Line on 3 December 2024, followed by the Blue Mountains Line on 13 October 2025. Services on the South Coast Line are scheduled to commence in 2026. The fleet features modern amenities including spacious 2x2 seating, charging ports, improved accessibility with wheelchair spaces and accessible toilets, CCTV emergency help points, and dedicated spaces for luggage, prams and bicycles. The trains operate in flexible 4-car, 6-car, 8-car or 10-car formations. The fleet replaces aging V-set trains that entered service in the 1970s and serves approximately 26 million passenger journeys annually across the electrified intercity network. Supporting infrastructure includes the new Kangy Angy Maintenance Facility, platform extensions, and signaling upgrades at multiple stations.
Central Park
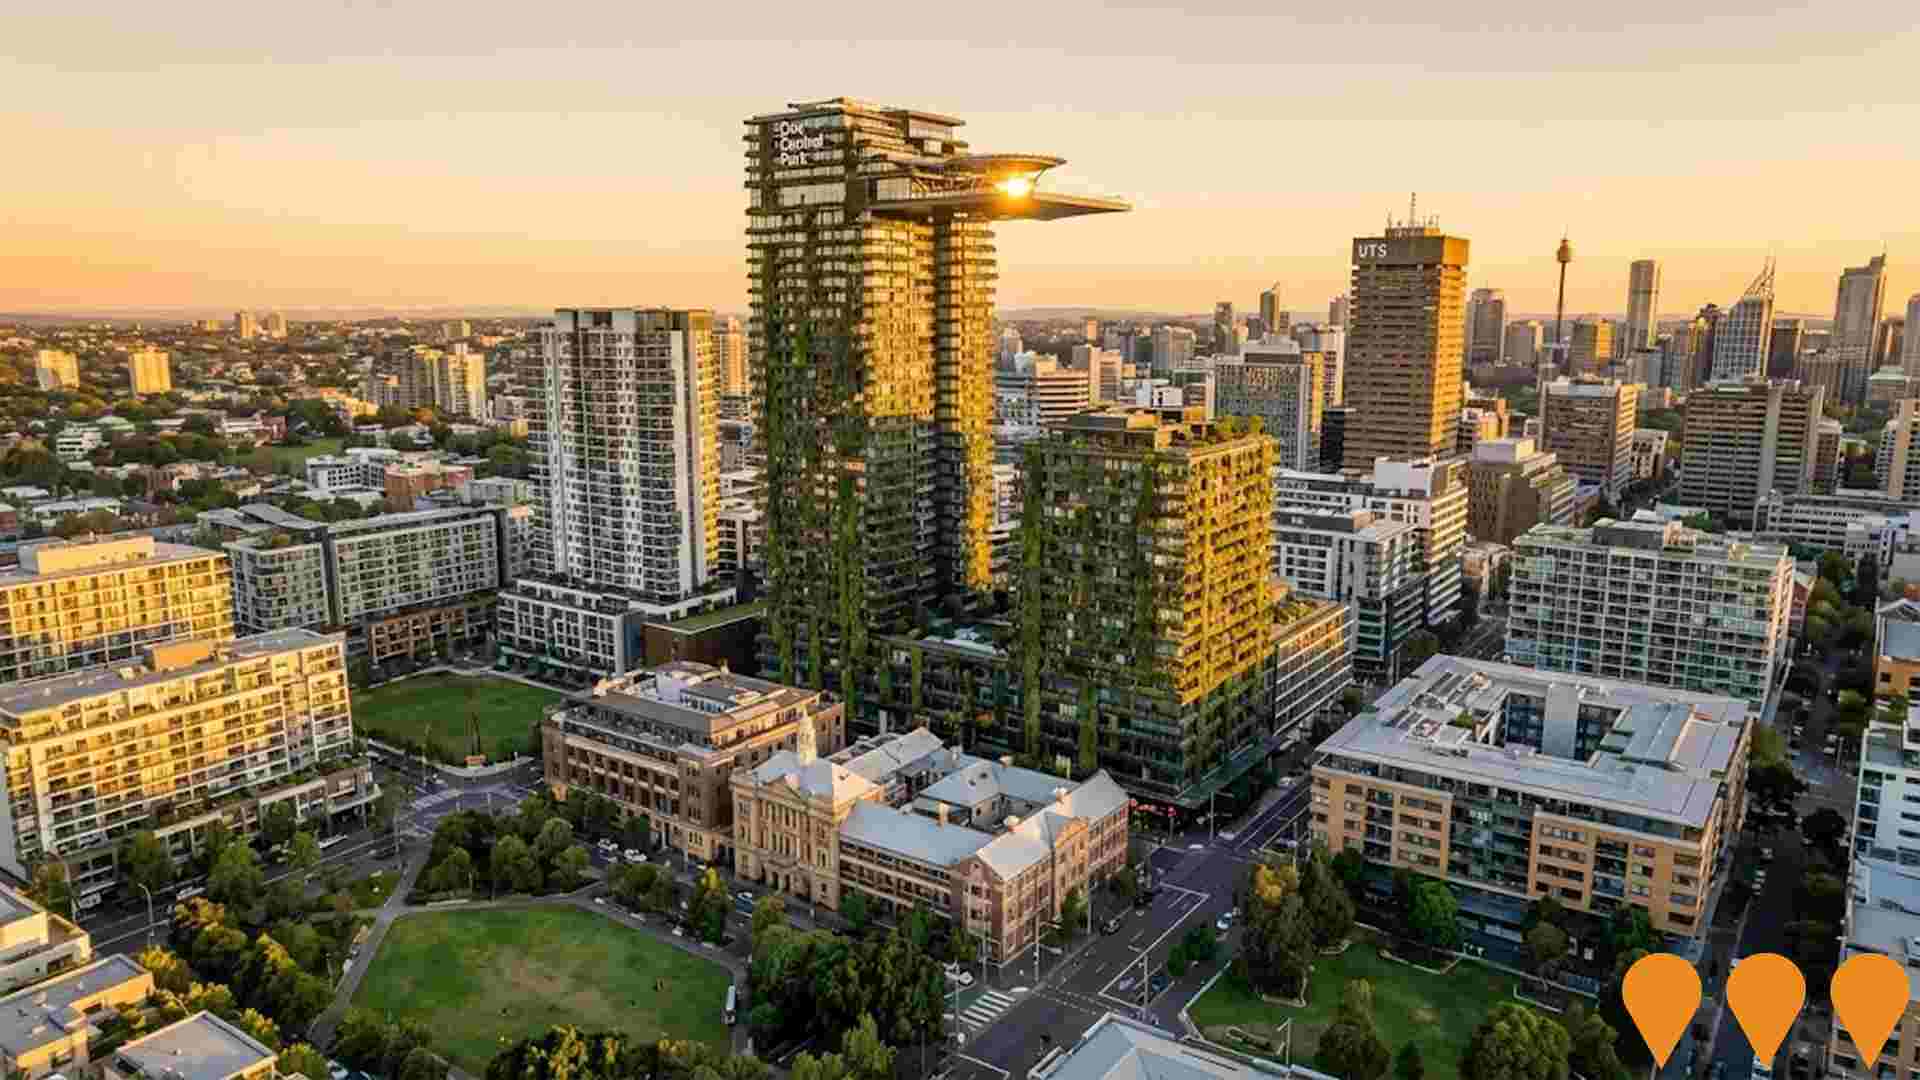
A $2 billion mixed-use urban renewal precinct on the former Carlton & United Brewery site (5.8 ha). Delivered over 2,200 apartments, student accommodation, retail (Central Park Mall), offices, hotels, childcare and public parkland including the 6,400 mý Chippendale Green. Iconic elements include the One Central Park towers (Jean Nouvel & PTW Architects) featuring the world's tallest vertical gardens by Patrick Blanc, a cantilevered heliostat and light installation. A benchmark for sustainable inner-city regeneration in Australia.
Employment
Chippendale shows employment indicators that trail behind approximately 70% of regions assessed across Australia
Chippendale's workforce is highly educated with notable representation in the technology sector. The unemployment rate as of September 2025 was 4.9%.
There were 5,836 residents employed at this time, with an unemployment rate of 0.7% higher than Greater Sydney's rate of 4.2%. Workforce participation was 63.0%, slightly above Greater Sydney's 60.0%. Employment is concentrated in professional & technical services (1.8 times the regional level), accommodation & food services, and education & training. However, construction shows lower representation at 3.3% compared to the regional average of 8.6%.
The worker-to-resident ratio was 0.7, indicating above-normal local employment opportunities. Over the year to September 2025, labour force levels decreased by 1.3%, while employment declined by 1.0%, reducing unemployment by 0.3 percentage points. Conversely, Greater Sydney saw employment rise by 2.1% and unemployment increase by 0.2 percentage points. As of 25-Nov in NSW, employment contracted by 0.03% (losing 2,260 jobs), with the state unemployment rate at 3.9%. Nationally, employment is forecast to grow by 6.6% over five years and 13.7% over ten years. Applying these projections to Chippendale's employment mix suggests local employment should increase by 7.2% over five years and 14.3% over ten years.
Frequently Asked Questions - Employment
Income
Income levels sit below national averages according to AreaSearch assessment
AreaSearch aggregated latest postcode level ATO data released for financial year 2022. Chippendale SA2 had a median income of $47,408 and an average income of $68,064 among taxpayers. These figures were above the national average and compared to Greater Sydney's levels of $56,994 and $80,856 respectively. Based on Wage Price Index growth of 12.61% since financial year 2022, current estimates for Chippendale SA2 would be approximately $53,386 (median) and $76,647 (average) as of September 2025. Census 2021 income data showed personal income ranked at the 64th percentile ($882 weekly), while household income sat at the 41st percentile. The data indicated that 30.6% of Chippendale SA2's population (2,909 individuals) fell within the $1,500 - $2,999 income range, mirroring the broader area where 30.9% occupied this bracket. Housing affordability pressures were severe, with only 70.3% of income remaining, ranking at the 24th percentile. The area's SEIFA income ranking placed it in the 10th decile.
Frequently Asked Questions - Income
Housing
Chippendale features a more urban dwelling mix with significant apartment living, with a higher proportion of rental properties than the broader region
Chippendale's dwelling structure, as per the latest Census, consisted of 0.1% houses and 100.0% other dwellings (semi-detached, apartments, 'other' dwellings). This contrasts with Sydney metro's figures of 2.3% houses and 97.7% other dwellings. Home ownership in Chippendale was at 9.1%, with mortgaged dwellings at 13.1% and rented ones at 77.8%. The median monthly mortgage repayment in the area was $2,409, lower than Sydney metro's average of $2,705. The median weekly rent figure for Chippendale was recorded as $520, compared to Sydney metro's $550. Nationally, Chippendale's mortgage repayments were higher at $2,409 versus the Australian average of $1,863, and rents were substantially above the national figure of $375.
Frequently Asked Questions - Housing
Household Composition
Chippendale features high concentrations of group households and lone person households, with a lower-than-average median household size
Family households account for 37.9% of all households, including 5.1% that are couples with children, 27.4% that are couples without children, and 2.7% that are single parent families. Non-family households make up the remaining 62.1%, with lone person households at 46.2% and group households comprising 16.0%. The median household size is 1.8 people, which is smaller than the Greater Sydney average of 1.9.
Frequently Asked Questions - Households
Local Schools & Education
Educational attainment in Chippendale aligns closely with national averages, showing typical qualification patterns and performance metrics
Chippendale's educational attainment is notably higher than national averages. Among residents aged 15+, 63.4% hold university qualifications, compared to Australia's 30.4% and NSW's 32.2%. Bachelor degrees are most prevalent at 40.0%, followed by postgraduate qualifications (21.0%) and graduate diplomas (2.4%). Vocational pathways account for 15.1%, with advanced diplomas at 9.4% and certificates at 5.7%.
Educational participation is high, with 46.2% of residents currently enrolled in formal education. This includes 32.6% in tertiary, 1.3% in primary, and 1.3% in secondary education.
Frequently Asked Questions - Education
Schools Detail
Nearby Services & Amenities
Transport
Transport servicing is high compared to other areas nationally based on assessment of service frequency, route connectivity and accessibility
Chippendale has seven active public transport stops in operation, all of which serve buses. These stops are covered by 42 different routes that together facilitate 11,501 weekly passenger trips. The area's transport accessibility is rated as excellent, with residents typically situated just 143 meters from the nearest stop.
On average, services operate 1,643 times daily across all routes, which translates to approximately 1643 weekly trips per individual stop.
Frequently Asked Questions - Transport
Transport Stops Detail
Health
Chippendale's residents boast exceedingly positive health performance metrics with very low prevalence of common health conditions across all age groups
Chippendale shows excellent health outcomes across all age groups, with a very low prevalence of common health conditions. Private health cover stands at approximately 53%, or about 5077 people, compared to Greater Sydney's 69.7%.
Mental health issues and asthma are the most prevalent conditions, affecting 7.7% and 5.4% respectively. A total of 84.4% report no medical ailments, compared to 77.4% in Greater Sydney. The area has a lower proportion of seniors aged 65 and over at 3.6%, or 343 people, than Greater Sydney's 9.7%. Health outcomes among Chippendale's seniors align with those of the general population.
Frequently Asked Questions - Health
Cultural Diversity
Chippendale is among the most culturally diverse areas in the country based on AreaSearch assessment of a range of language and cultural background related metrics
Chippendale has a highly diverse population, with 57.3% speaking a language other than English at home and 67.3% born overseas. Christianity is the predominant religion in Chippendale, accounting for 21.0%. Buddhism is notably overrepresented, comprising 10.3%, compared to Greater Sydney's average of 7.1%.
In terms of ancestry, Chinese (29.9%) and Other (17.6%) are the most represented groups, while English (13.3%) is lower than the regional average of 19.8%. Spanish (1.1%), Korean (1.8%), and French (0.9%) are also notably overrepresented compared to Greater Sydney's averages.
Frequently Asked Questions - Diversity
Age
Chippendale hosts a very young demographic, ranking in the bottom 10% of areas nationwide
Chippendale's median age is 28, which is lower than Greater Sydney's figure of 37 and Australia's median of 38. The age profile indicates that those aged 25-34 are the most prominent group (39.2%), while those aged 5-14 are relatively small (1.4%) compared to Greater Sydney. This concentration of 25-34 year-olds is significantly higher than the national figure of 14.5%. According to post-2021 Census data, the age group of 15-24 has increased from 28.9% to 30.7%, while the 55-64 cohort has decreased from 4.4% to 3.7%. By 2041, Chippendale's age composition is projected to change significantly, with the 45-54 age group expected to grow by 1,528 people (262%), from 582 to 2,111. Conversely, the number of those aged 25-34 is expected to decrease by 908.
