Chart Color Schemes
This analysis uses ABS Statistical Areas Level 2 (SA2) boundaries, which can materially differ from Suburbs and Localities (SAL) even when sharing similar names.
SA2 boundaries are defined by the Australian Bureau of Statistics and are designed to represent communities for statistical reporting (e.g., census and ERP).
Suburbs and Localities (SAL) represent commonly-used suburb/locality names (postal-style areas) and may use different geographic boundaries. For comprehensive analysis, consider reviewing both boundary types if available.
est. as @ -- *
ABS ERP | -- people | --
2021 Census | -- people
Sales Activity
Curious about local property values? Filter the chart to assess the volume and appreciation (including resales) trends and regional comparisons, or scroll to the map below view this information at an individual property level.
Find a Recent Sale
Sales Detail
Population
Monterey - Brighton-le-Sands - Kyeemagh is positioned among the lower quartile of areas assessed nationally for population growth based on AreaSearch's assessment of recent, and medium term trends
Based on AreaSearch's analysis, Monterey - Brighton-le-Sands - Kyeemagh's population is around 13,657 as of Nov 2025. This reflects a decrease of 239 people (1.7%) since the 2021 Census, which reported a population of 13,896 people. The change is inferred from the estimated resident population of 13,691 from the ABS as of June 2024 and address validation since the Census date. This level of population equates to a density ratio of 4,040 persons per square kilometer, which lies in the top 10% of national locations assessed by AreaSearch, making land in the area a highly-sought resource. Population growth for the area was primarily driven by overseas migration that contributed approximately 86.3% of overall population gains during recent periods.
AreaSearch is adopting ABS/Geoscience Australia projections for each SA2 area, as released in 2024 with 2022 as the base year. For any SA2 areas not covered by this data, AreaSearch is utilising the NSW State Government's SA2 level projections, as released in 2022 with 2021 as the base year. Growth rates by age group from these aggregations are also applied to all areas for years 2032 to 2041. As we examine future population trends, lower quartile growth of statistical areas across the nation is anticipated, with the area expected to expand by 382 persons to 2041 based on the latest annual ERP population numbers, reflecting an increase of 3.0% in total over the 17 years.
Frequently Asked Questions - Population
Development
AreaSearch assessment of residential development drivers sees a low level of activity in Monterey - Brighton-le-Sands - Kyeemagh, placing the area among the bottom 25% of areas assessed nationally
Monterey-Brighton-le-Sands-Kyeemagh averaged approximately 37 new dwelling approvals per year. Between FY21-FY25188 homes were approved, with an additional 14 approved in FY26 so far. This suggests that new supply has likely been keeping pace with demand in the area despite recent population declines.
The average expected construction cost of new homes is $488,000, indicating a focus on premium developments. In FY26, commercial development approvals totalled $30.9 million, reflecting robust local business investment. Compared to Greater Sydney, Monterey-Brighton-le-Sands-Kyeemagh shows significantly reduced construction activity, at 52.0% below the regional average per person. This constrained new construction typically reinforces demand and pricing for existing homes. Nationally, this activity is also below average, suggesting an area of maturity and possible planning constraints. Recent construction comprises 45.0% detached houses and 55.0% townhouses or apartments, favouring higher-density living options which create more affordable entry points suitable for downsizers, investors, and first-home buyers.
The location currently has approximately 434 people per dwelling approval, reflecting its established status. According to the latest AreaSearch quarterly estimate, Monterey-Brighton-le-Sands-Kyeemagh is expected to grow by 415 residents through to 2041. At current development rates, new housing supply should comfortably meet demand, offering good conditions for buyers and potentially supporting population growth beyond current projections.
Frequently Asked Questions - Development
Infrastructure
Monterey - Brighton-le-Sands - Kyeemagh has strong levels of nearby infrastructure activity, ranking in the top 30% nationally
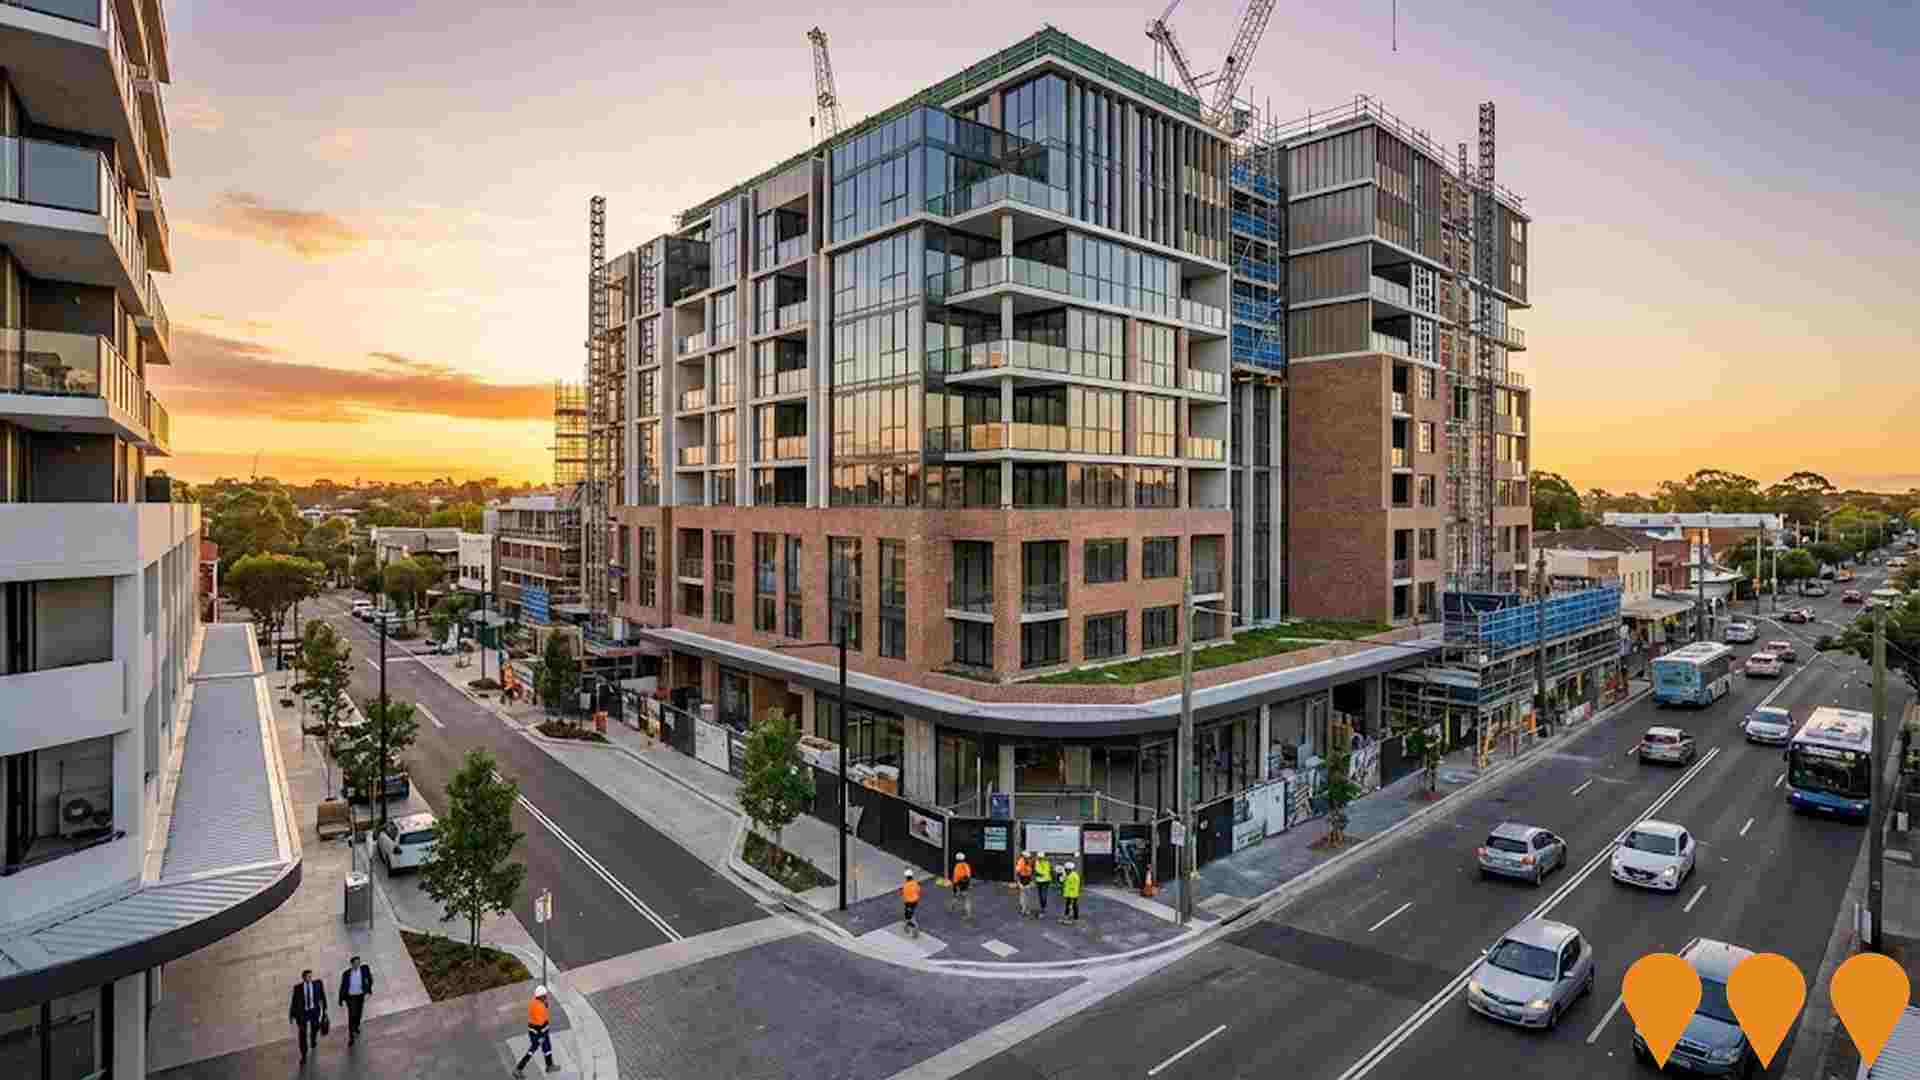
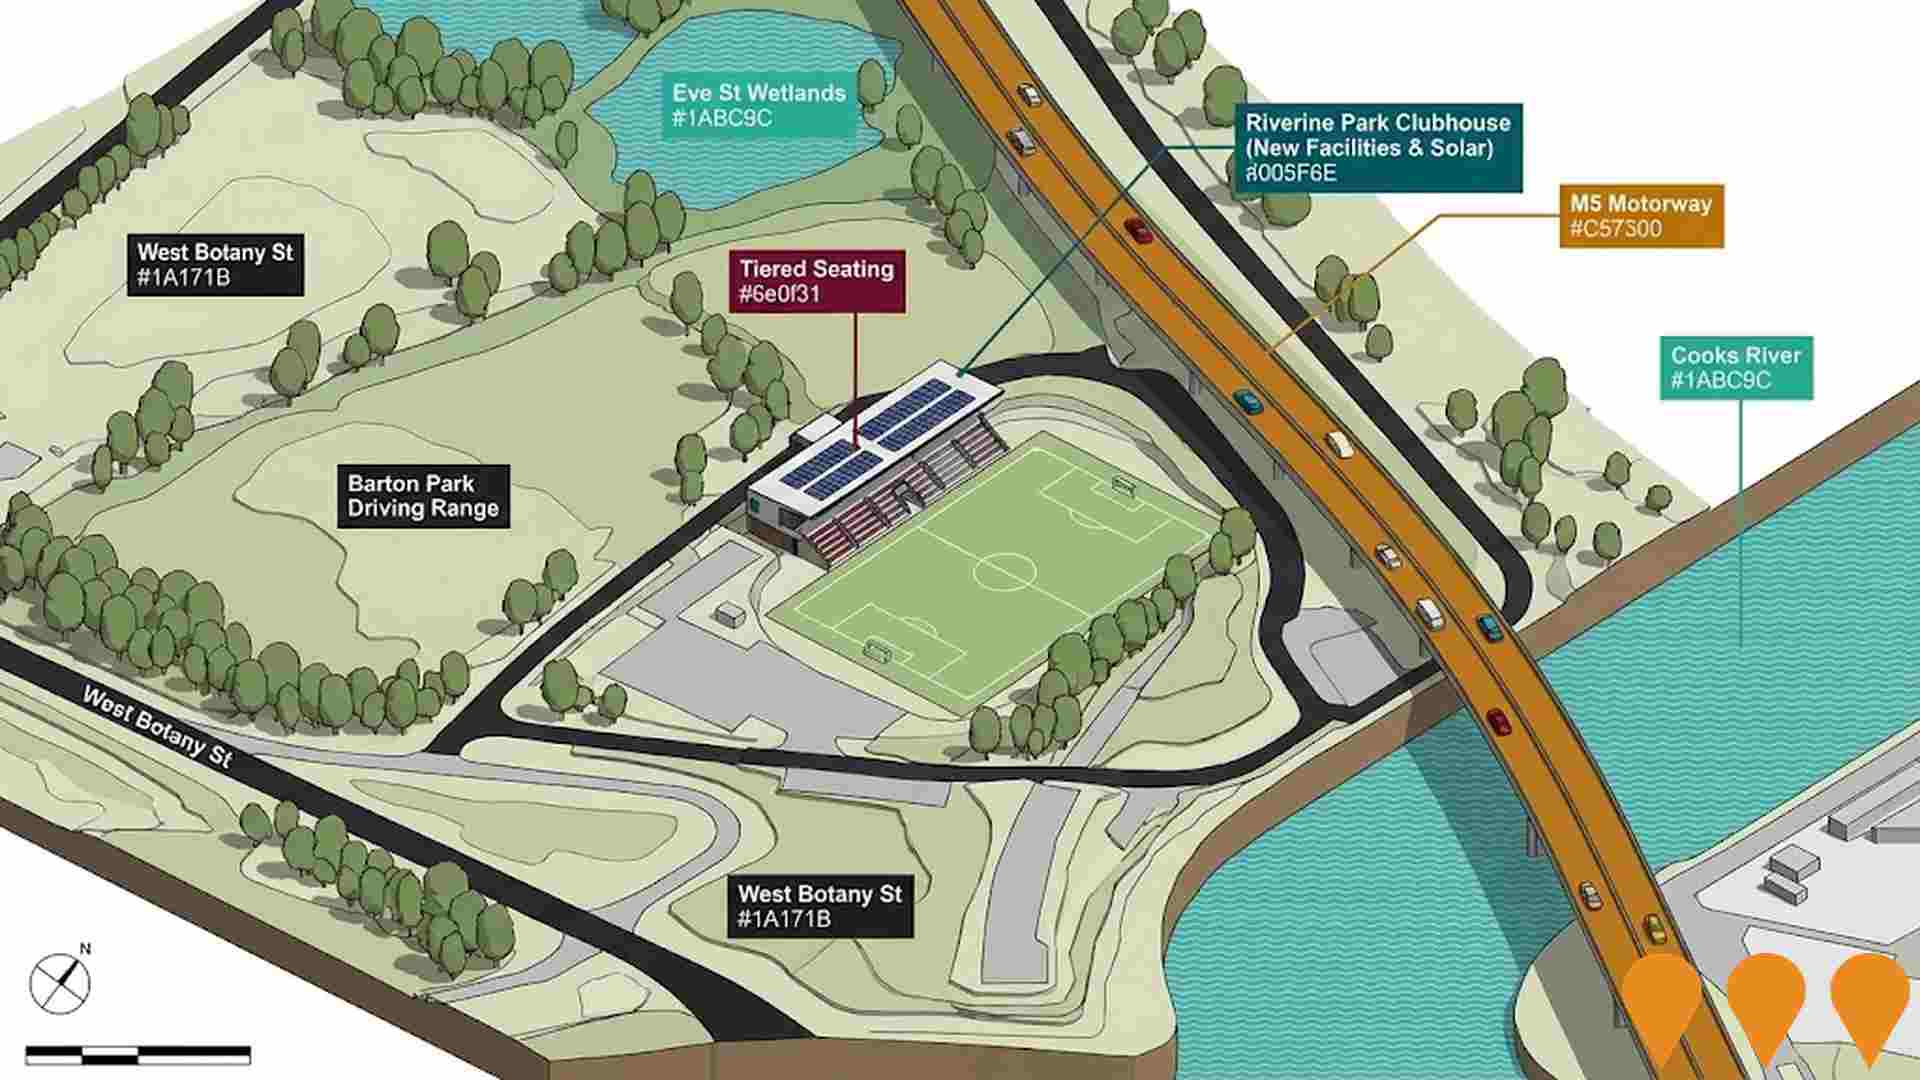
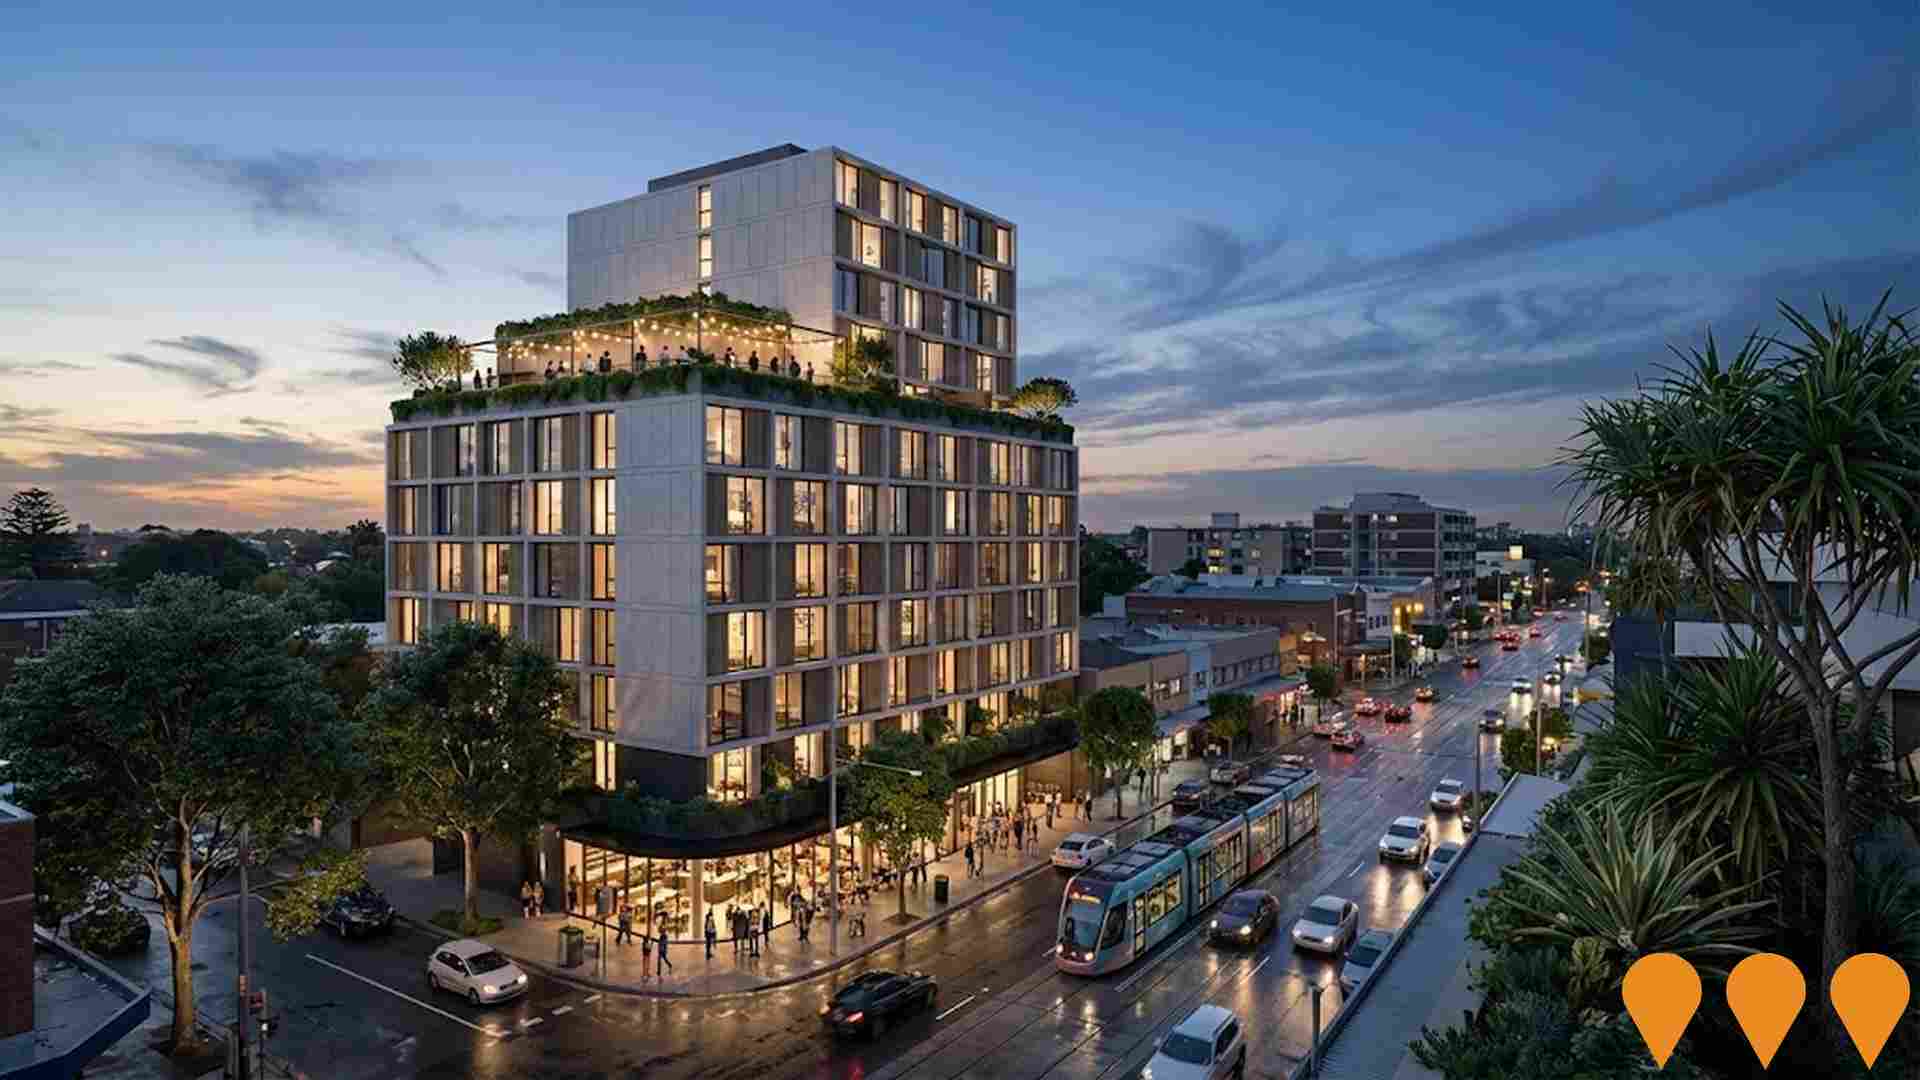
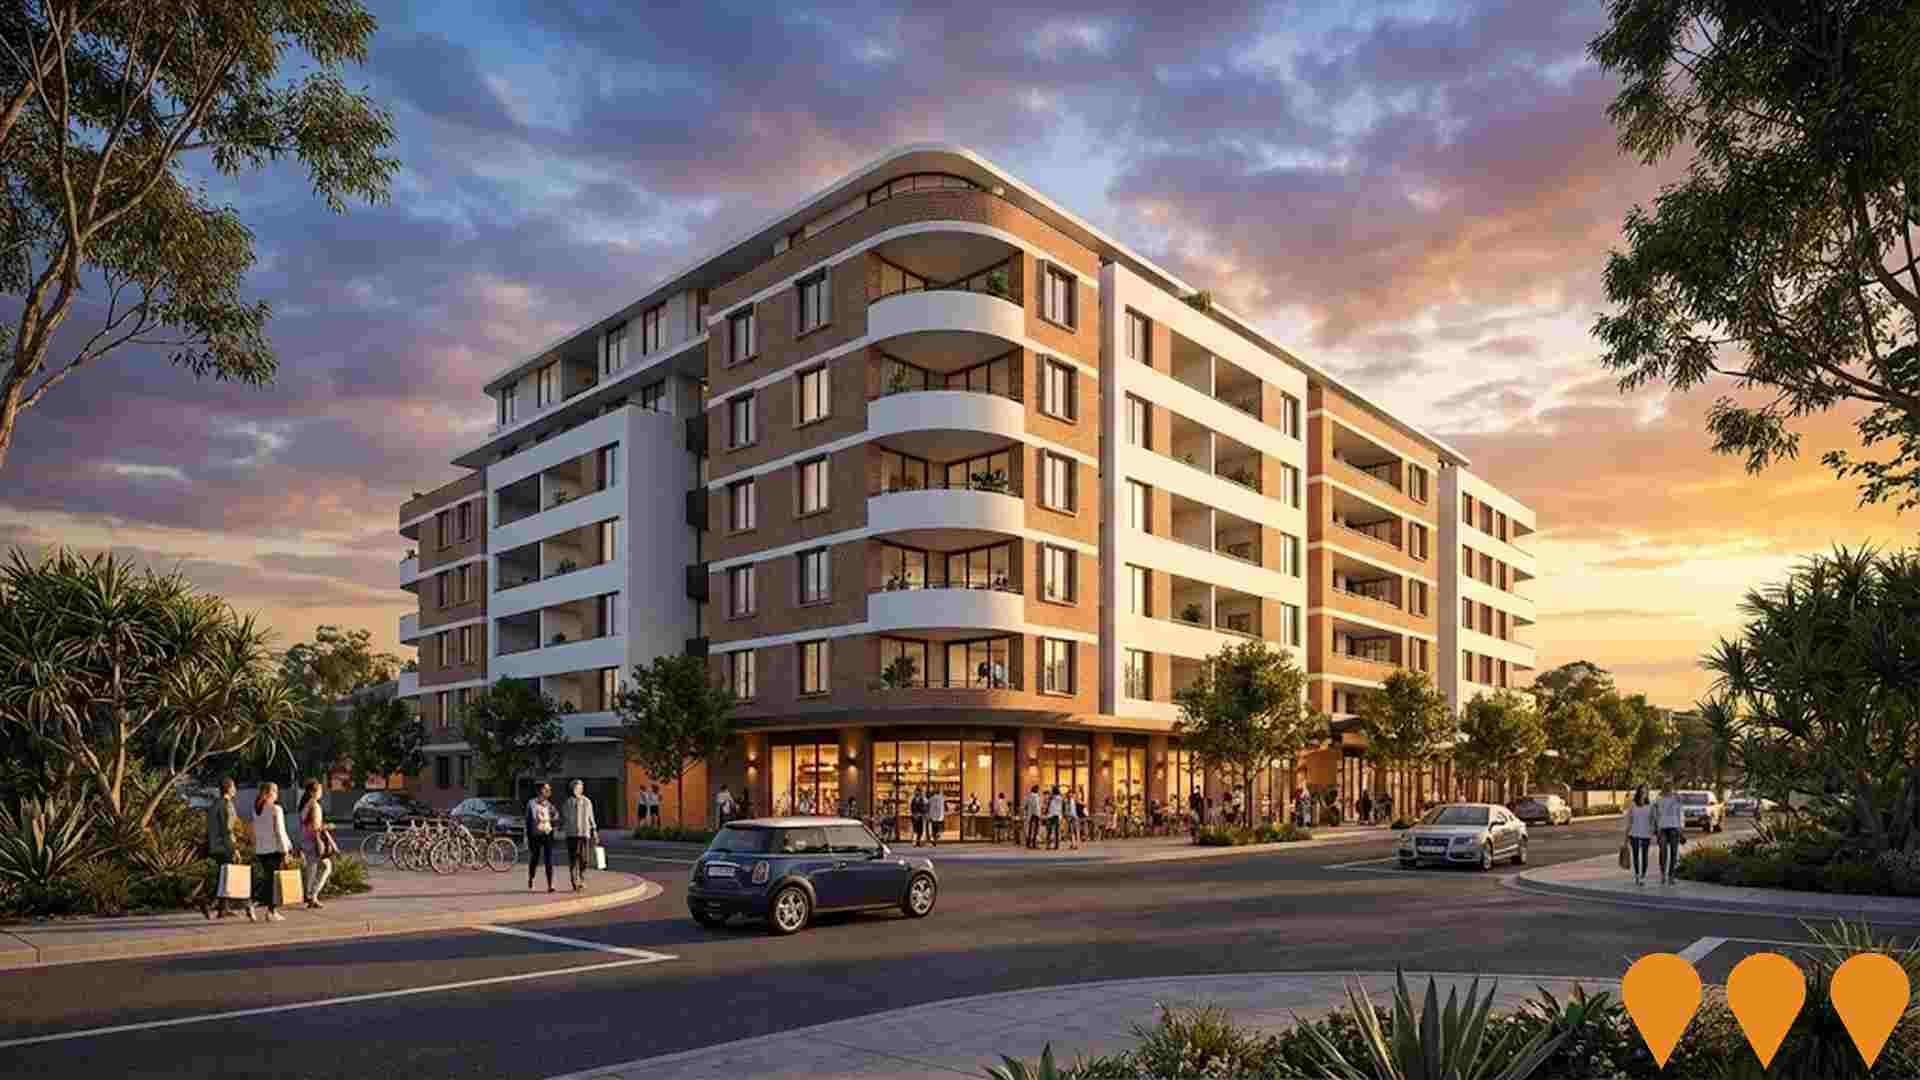
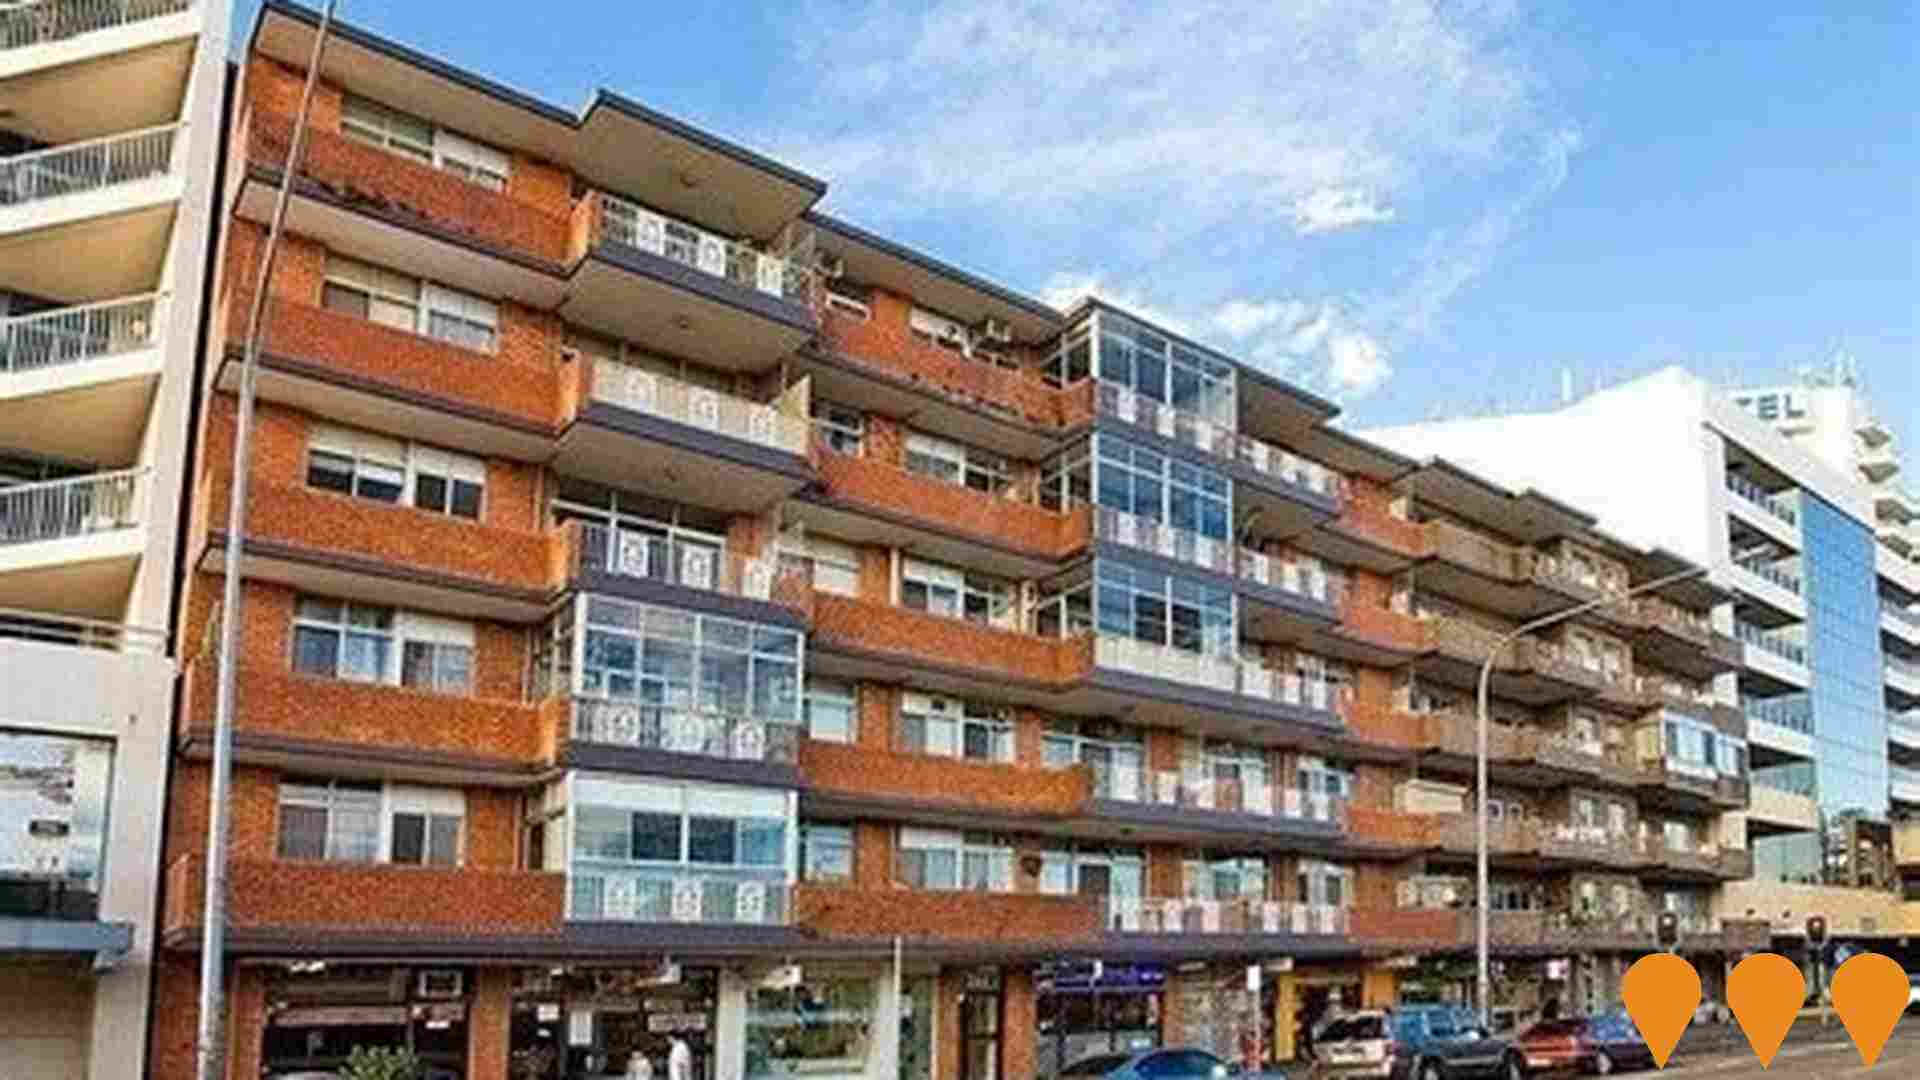
Changes to local infrastructure significantly impact an area's performance. AreaSearch has identified 26 projects likely affecting the area. Notable projects include Moate Avenue Mixed Use Development, Bay Street Mixed-Use Development (271-275 Bay Street), Seychelles Brighton-Le-Sands, and Safety improvements on Bay Street, Brighton-Le-Sands. The following list details those most relevant.
Professional plan users can use the search below to filter and access additional projects.
INFRASTRUCTURE SEARCH
 Denotes AI-based impression for illustrative purposes only, not to be taken as definitive under any circumstances. Please follow links and conduct other investigations from the project's source for actual imagery. Developers and project owners wishing us to use original imagery please Contact Us and we will do so.
Frequently Asked Questions - Infrastructure
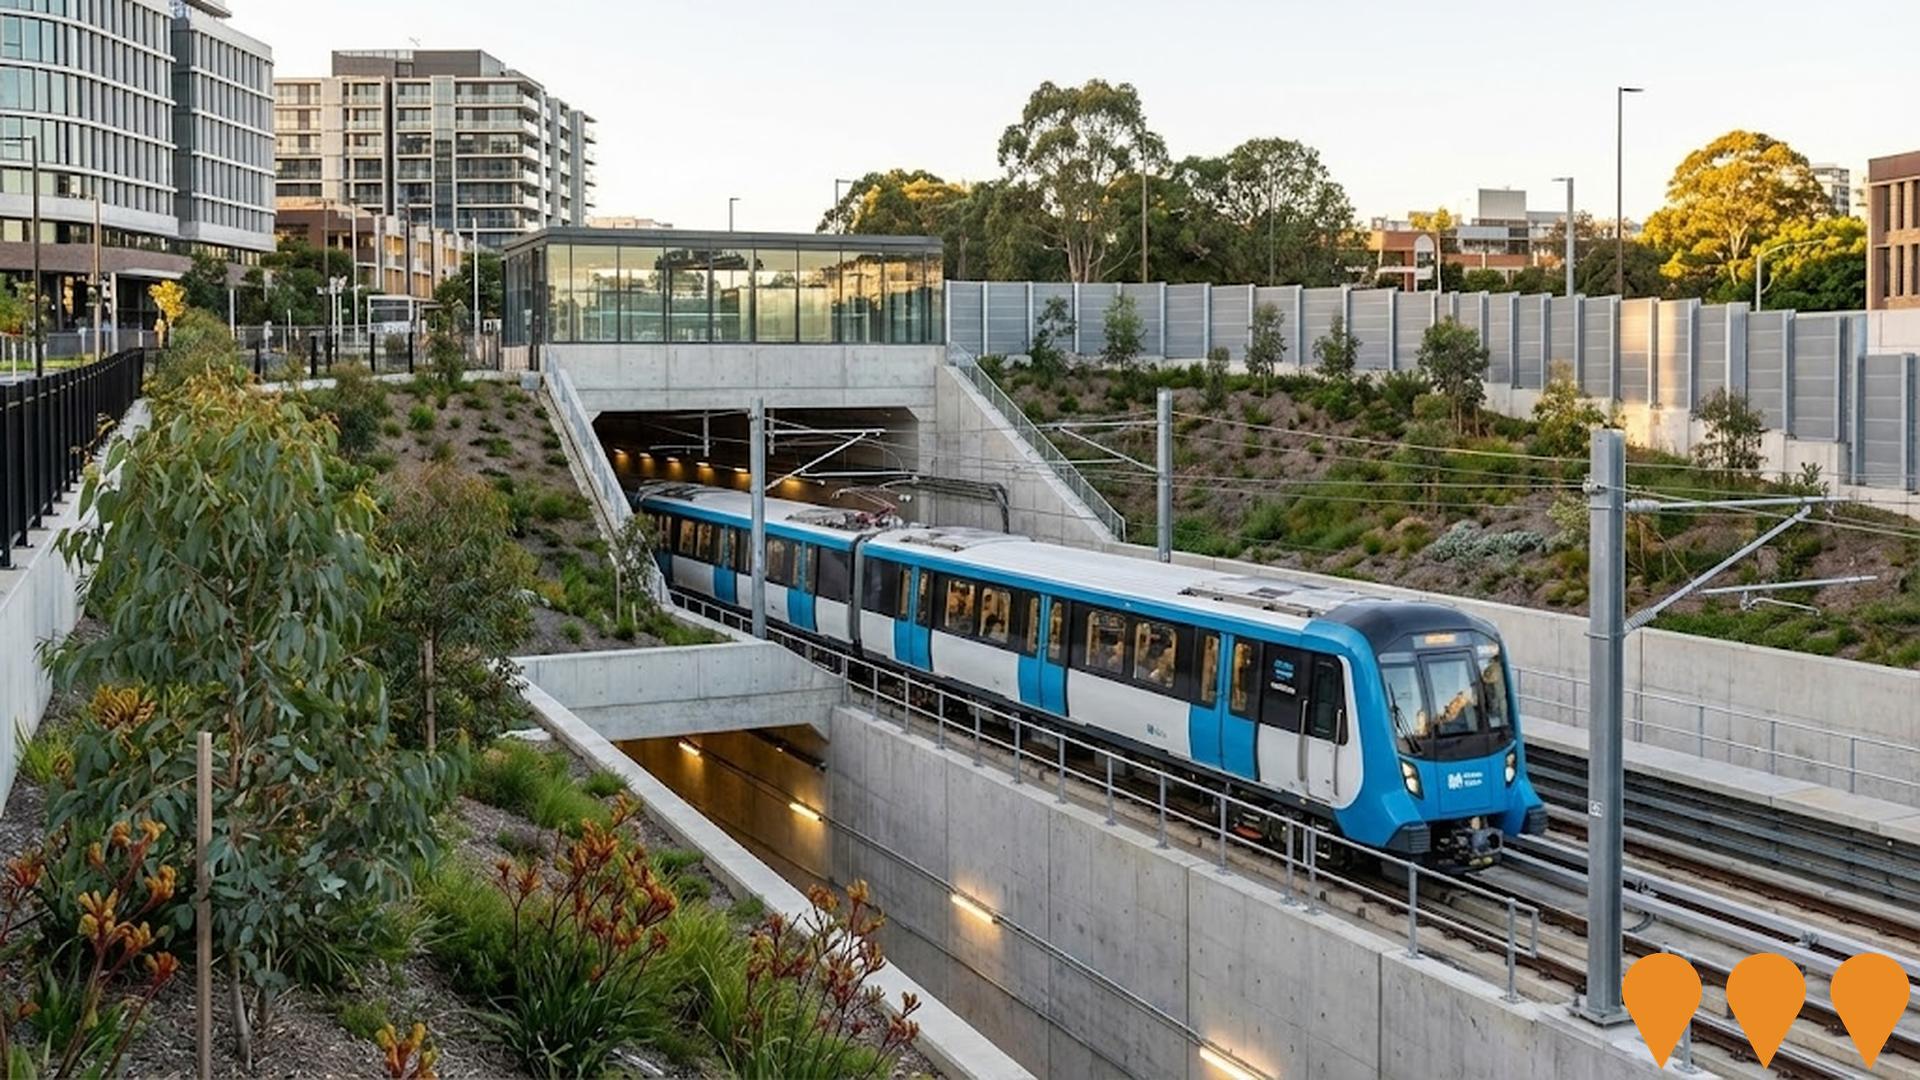
Sydney Metro West
Sydney Metro West is a new 24-kilometre underground metro rail line connecting Greater Parramatta and the Sydney CBD. The project includes nine confirmed stations: Westmead, Parramatta, Sydney Olympic Park, North Strathfield, Burwood North, Five Dock, The Bays, Pyrmont, and Hunter Street. Construction is underway, with tunnelling progressing well, including the completion of the western end (Pyrmont to Westmead). The line will double rail capacity between Parramatta and the Sydney CBD, offering a target travel time of about 20 minutes between the two CBDs and aiming for a 'turn-up-and-go' service.
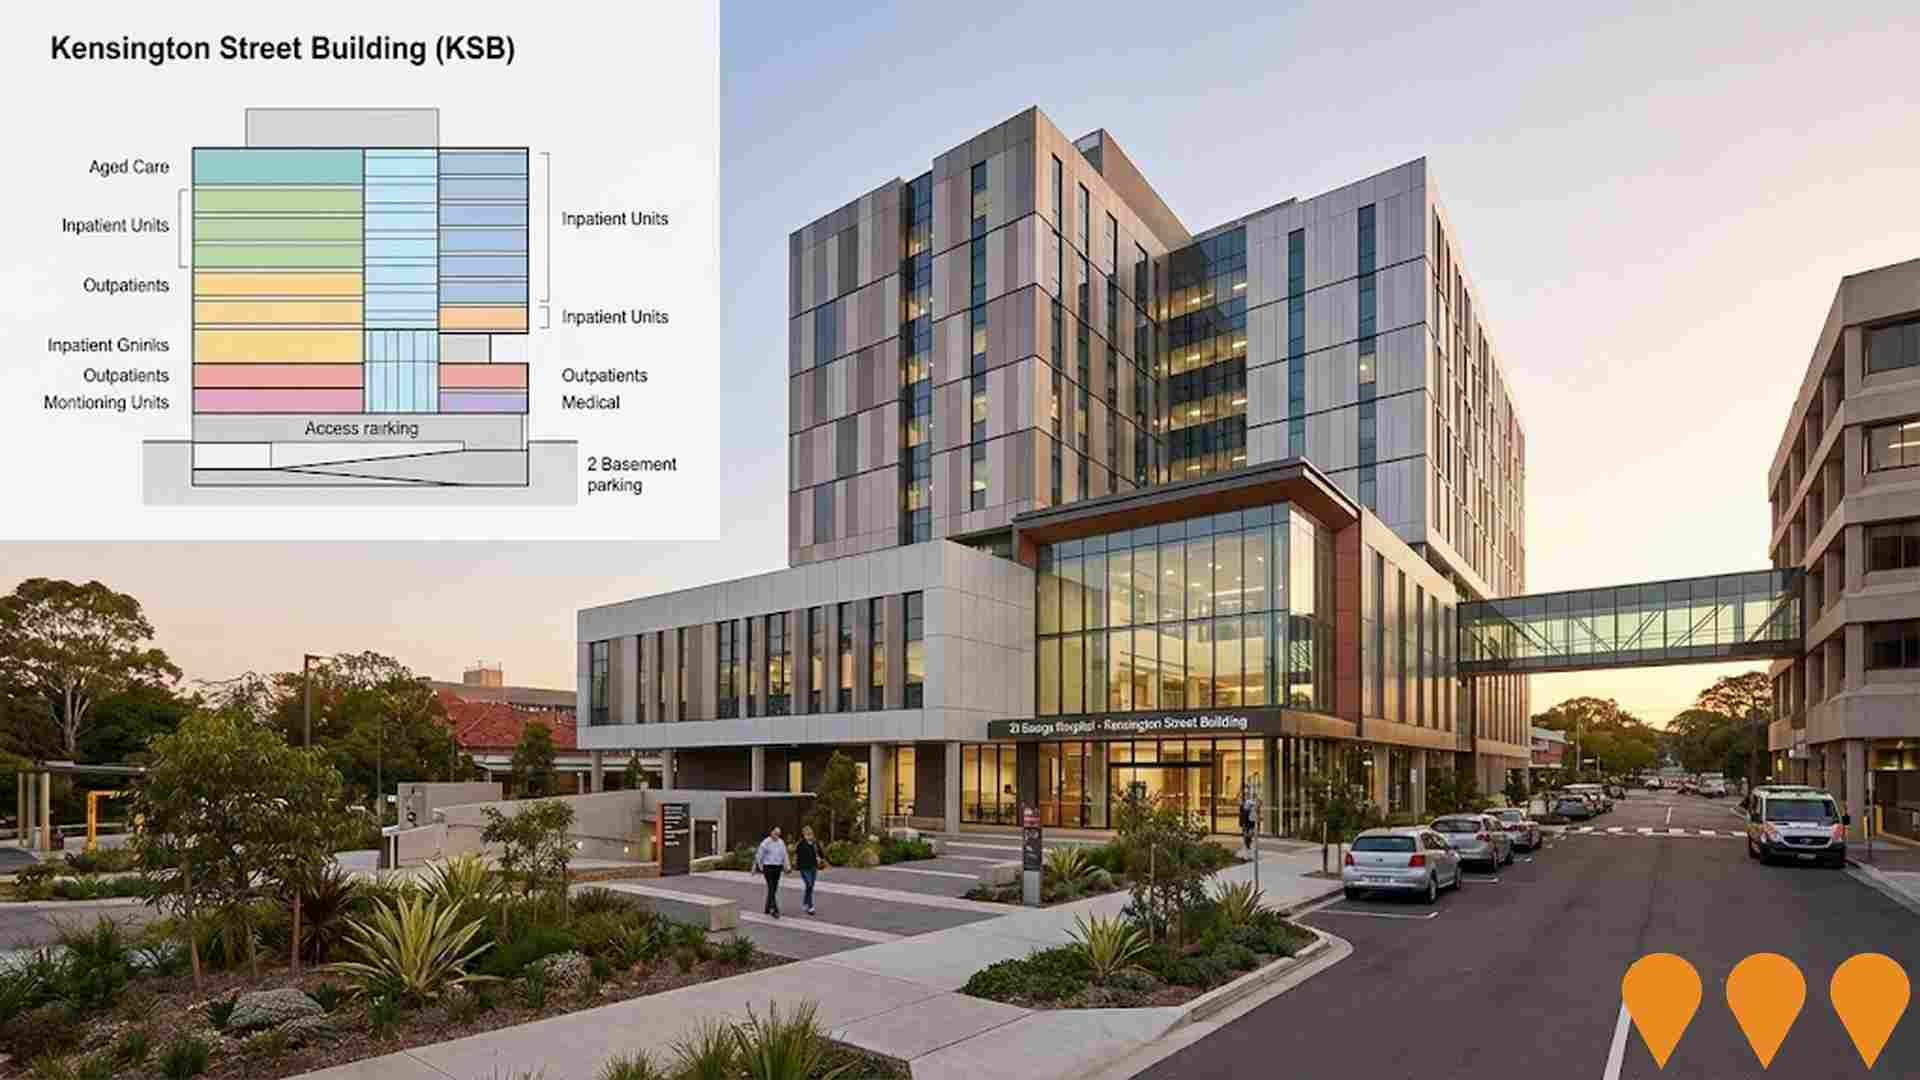
St George Hospital Redevelopment Stage 3
The $411 million St George Hospital Stage 3 redevelopment is delivering a new Integrated Ambulatory Care Precinct, which includes the 9-storey Kensington Street Building (KSB) with two levels of basement car parking. The KSB reached its highest point in December 2024. The facility will consolidate outpatient services, pathology collection, day rehabilitation, sub-acute and rehabilitation inpatient beds, aged care, acquired brain injury unit (Cognitive Transition Unit), palliative care, surgical services with refurbished operating theatres, enhanced diagnostic imaging, clinical skills centre, day infusion centre, outpatient pharmacy, emergency department expansion, modernised clinical facilities, and improved patient access. The name of the new building was changed from the Ambulatory Care Building to the Kensington Street Building (KSB) in January 2024 to avoid confusion with the existing Acute Services Building (ASB).
Northern Georges River Submain Upgrade
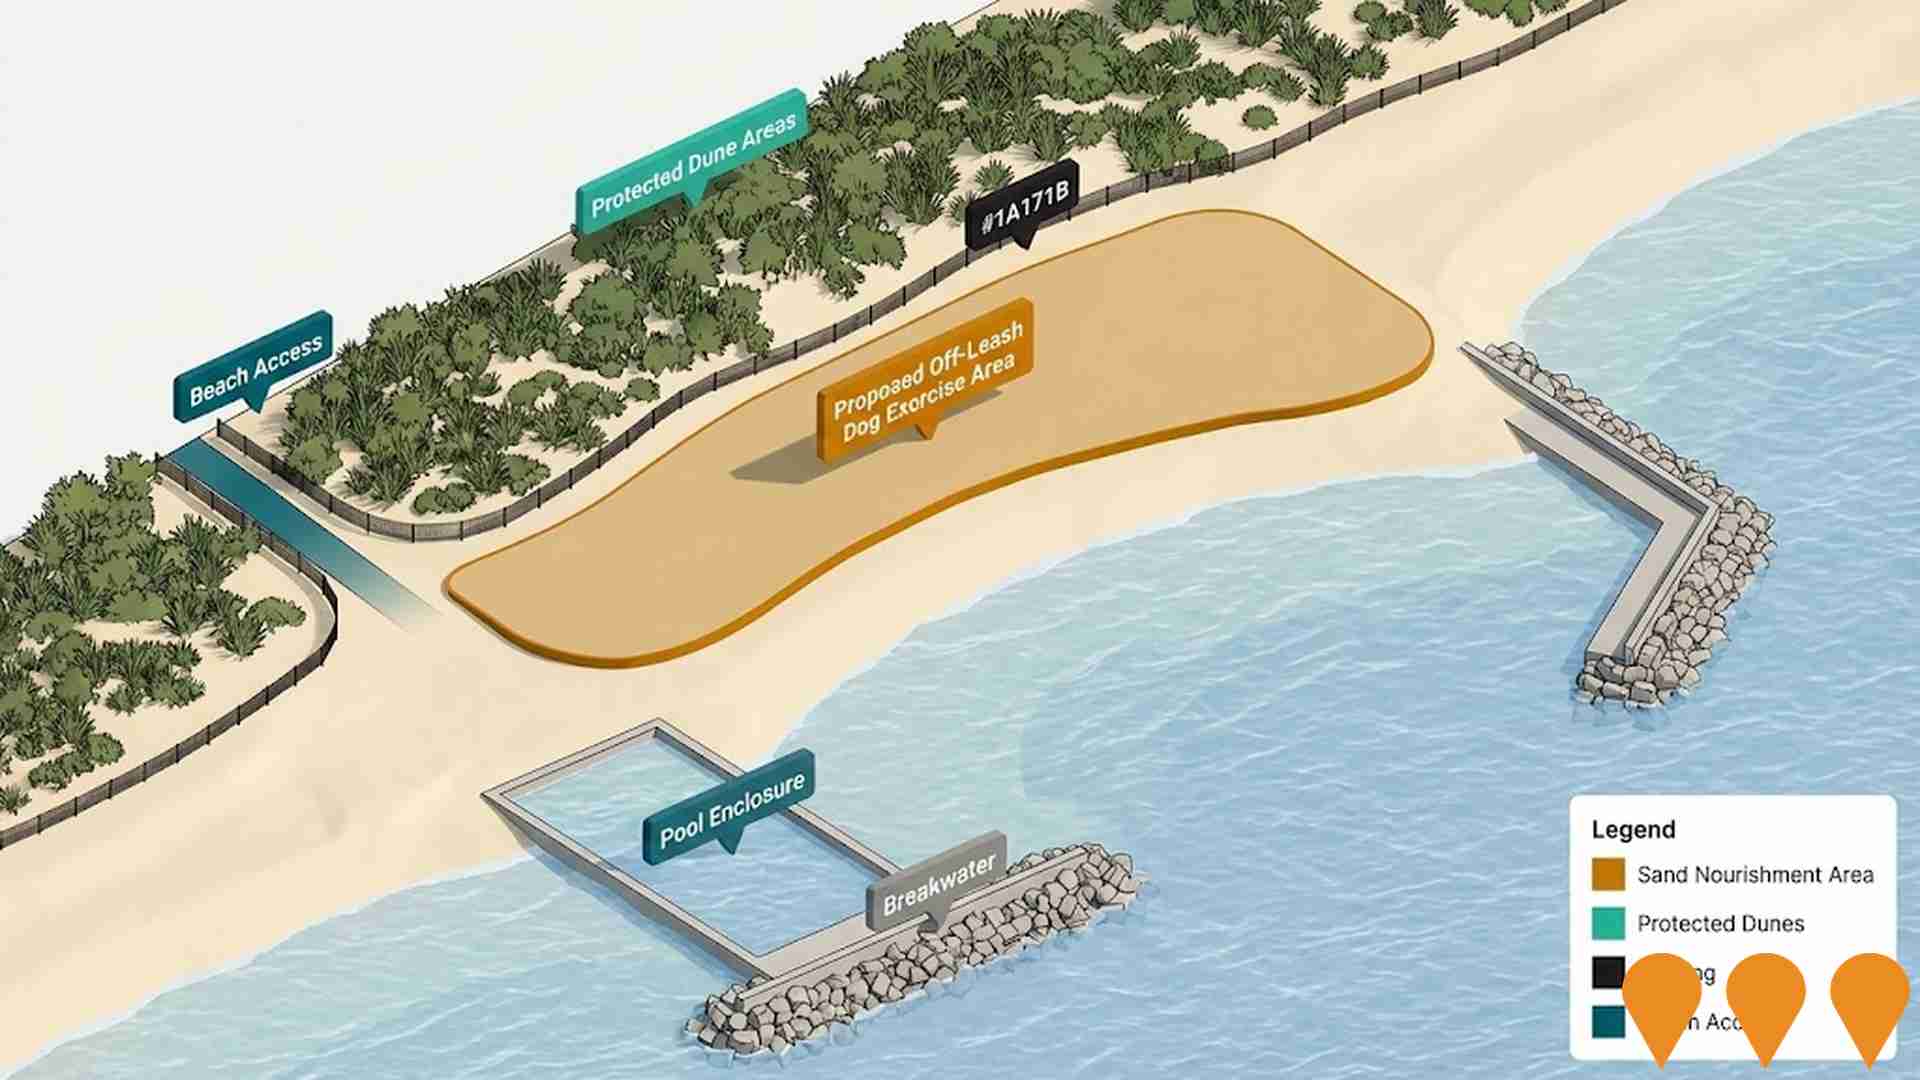
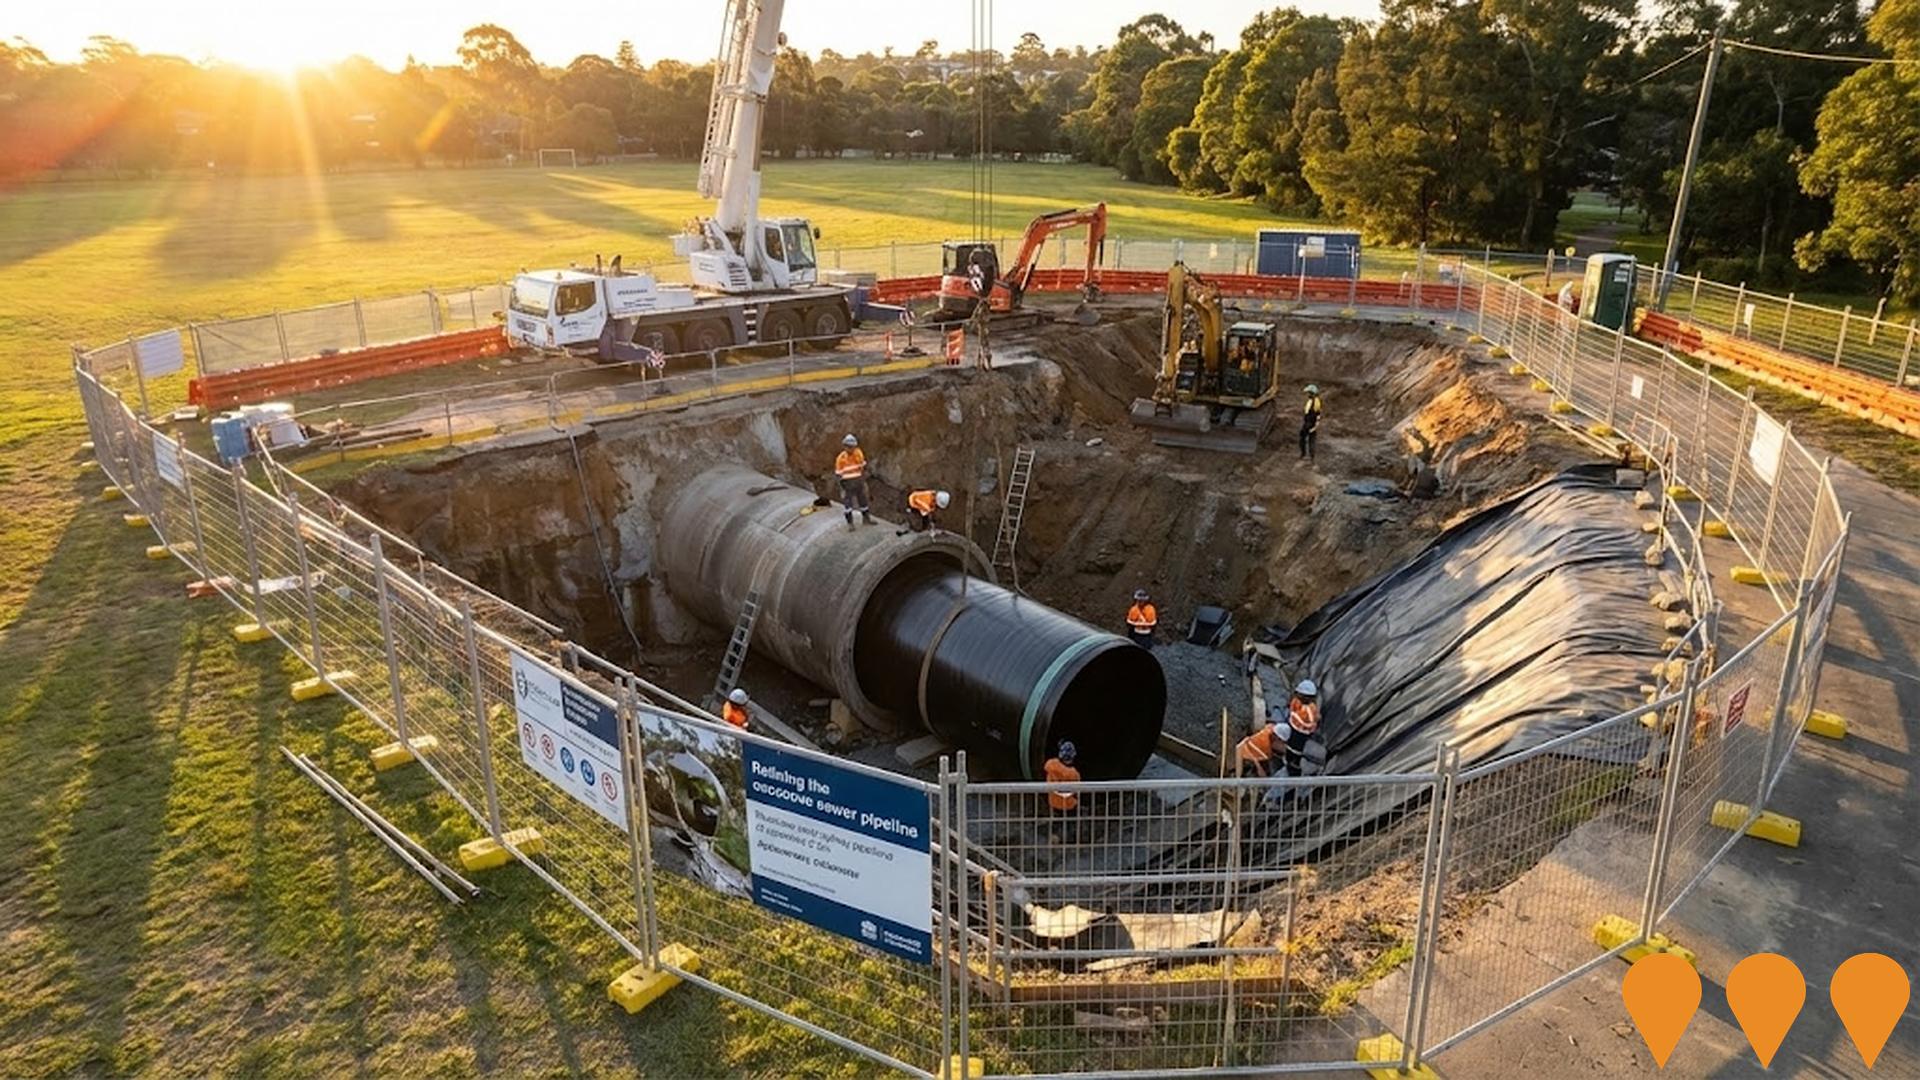
Critical wastewater infrastructure upgrade to the Northern Georges River Submain (NGRS), a major concrete sewer network in Sydney's south west. The work involves relining and renewing sections of the large-diameter pipeline (up to 2.5m in diameter) due to corrosion from sewage gas (H2S attack). This trenchless technology renewal work is part of a broader, long-term program to increase network capacity in the NGRS and Malabar System, improving system resilience and environmental performance by reducing wet weather discharge and odour emissions.
Kogarah Strategic Centre Master Plan
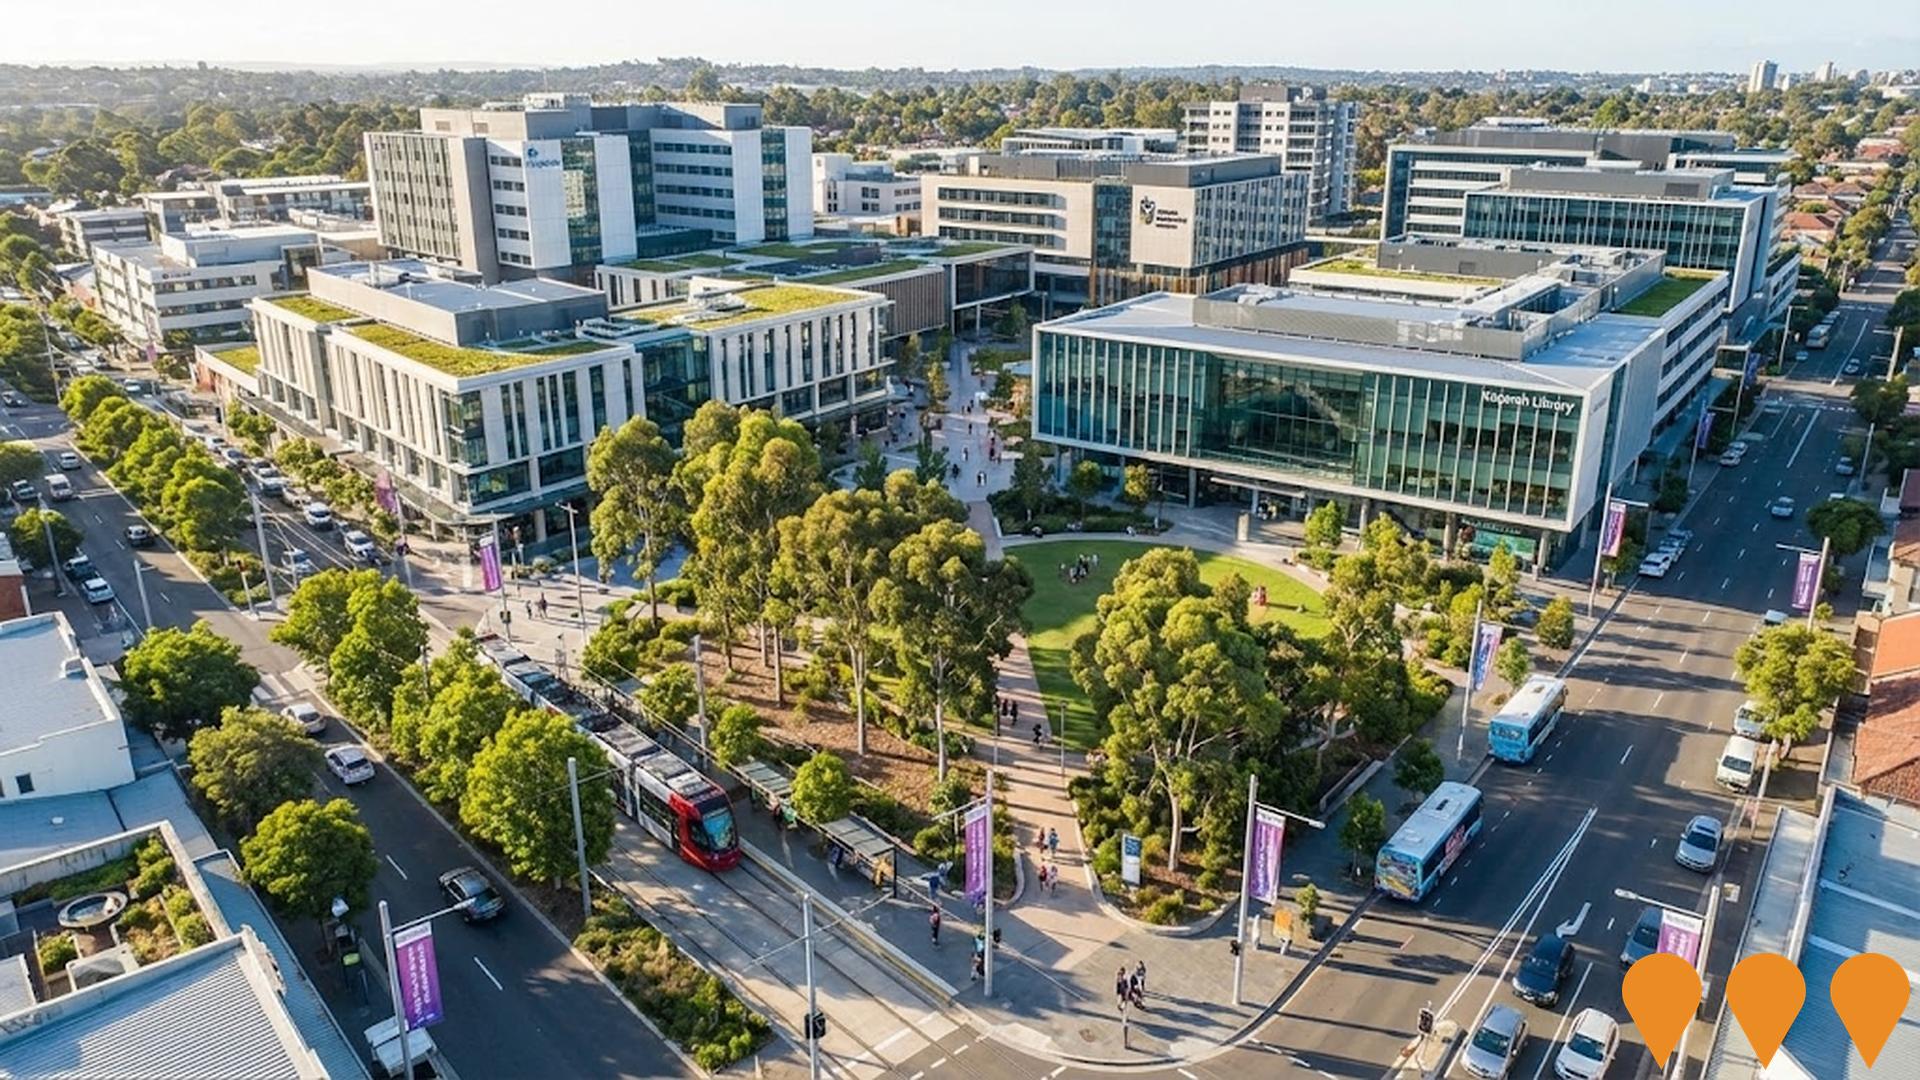
A comprehensive 20-year Master Plan for the Kogarah Strategic Centre, one of two strategic centres in the Georges River LGA. The plan focuses on Kogarah's role as a vibrant hub for health, education, business, and transport. Community consultation was completed in June 2025, with the draft Master Plan currently under development. The plan will guide future development to provide diverse housing types, employment opportunities, improved active transport infrastructure, parks and community spaces, and support the area's role as a major health and education precinct with two hospitals, TAFE campus, schools, and the Clive James Library.
Seychelles Brighton-Le-Sands
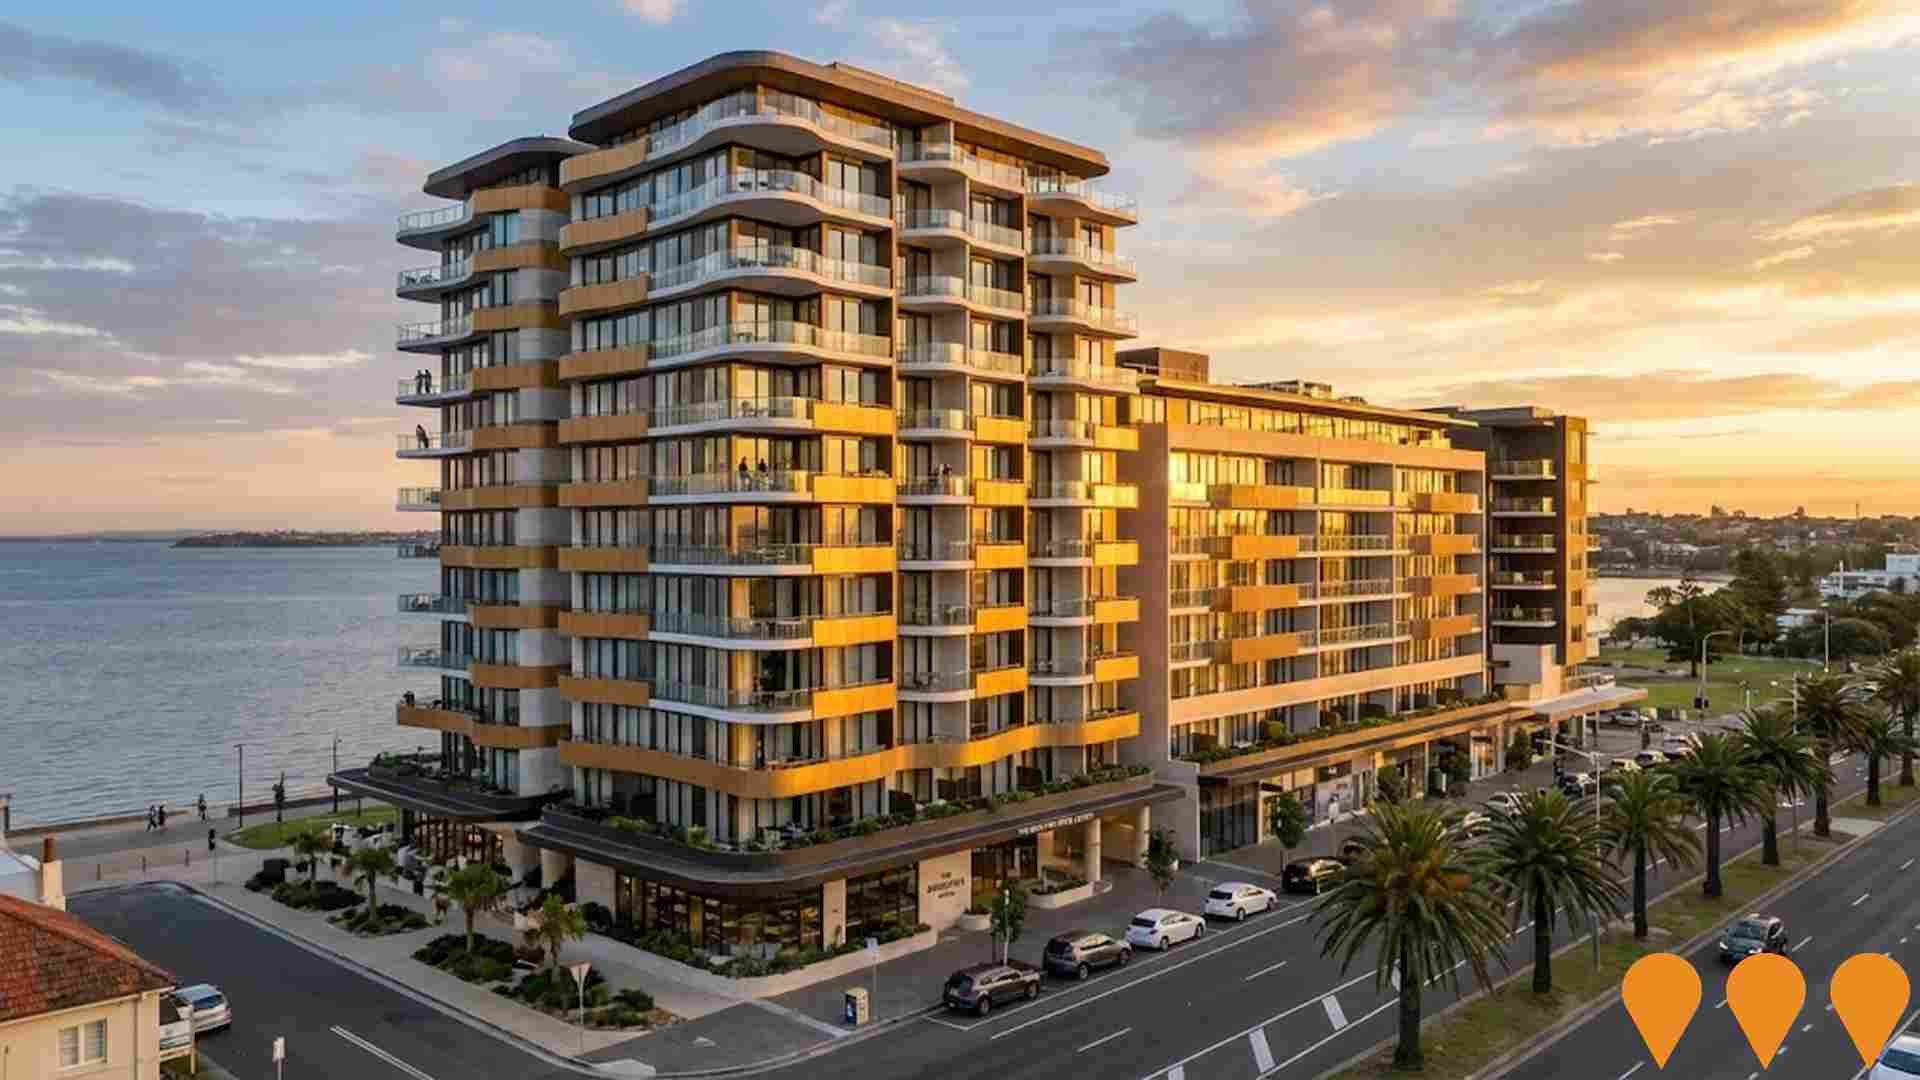
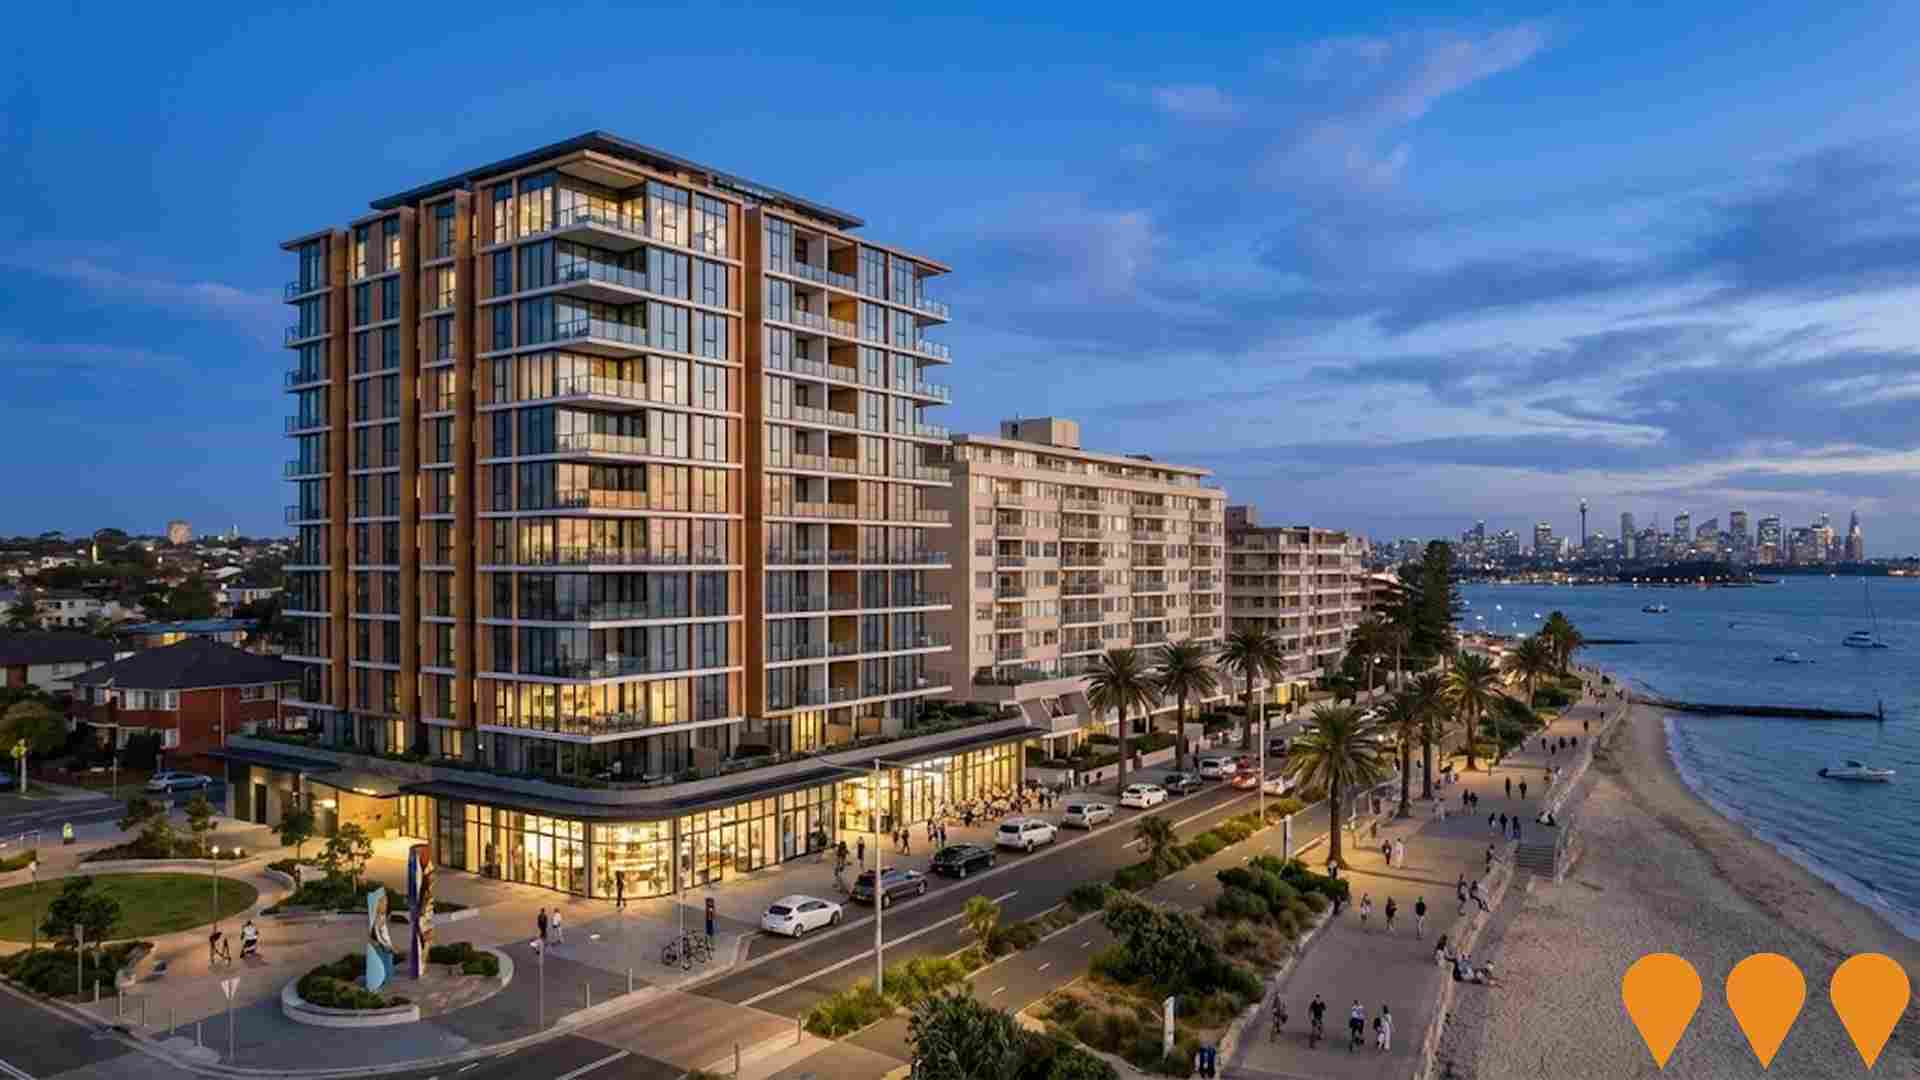
Luxury beachfront development featuring 36 one, two and three-bedroom apartments, two spectacular penthouses, and five meticulously restored heritage-listed terraces originally built in the late 1880s by Thomas Saywell. The 13-storey development by Abadeen Group and JDH Capital is located directly opposite Lady Robinson Beach on The Grand Parade, with three levels of basement parking and panoramic views from Botany Bay to the city skyline.

The Brighton Hotel Sydney Redevelopment
Multi year redevelopment of the former Novotel Sydney Brighton Beach and adjoining Bayside Plaza into The Brighton Hotel Sydney, a 307 room beachfront MGallery hotel with upgraded rooms and suites, new ballrooms, refreshed pool and wellness facilities, and multiple new food and beverage venues including Ammos, Sands Bar, Beach Club and lobby bars. The project delivers a resort style waterfront destination on Botany Bay focused on leisure, events and conferences.
Brighton RSL Memorial Club Redevelopment
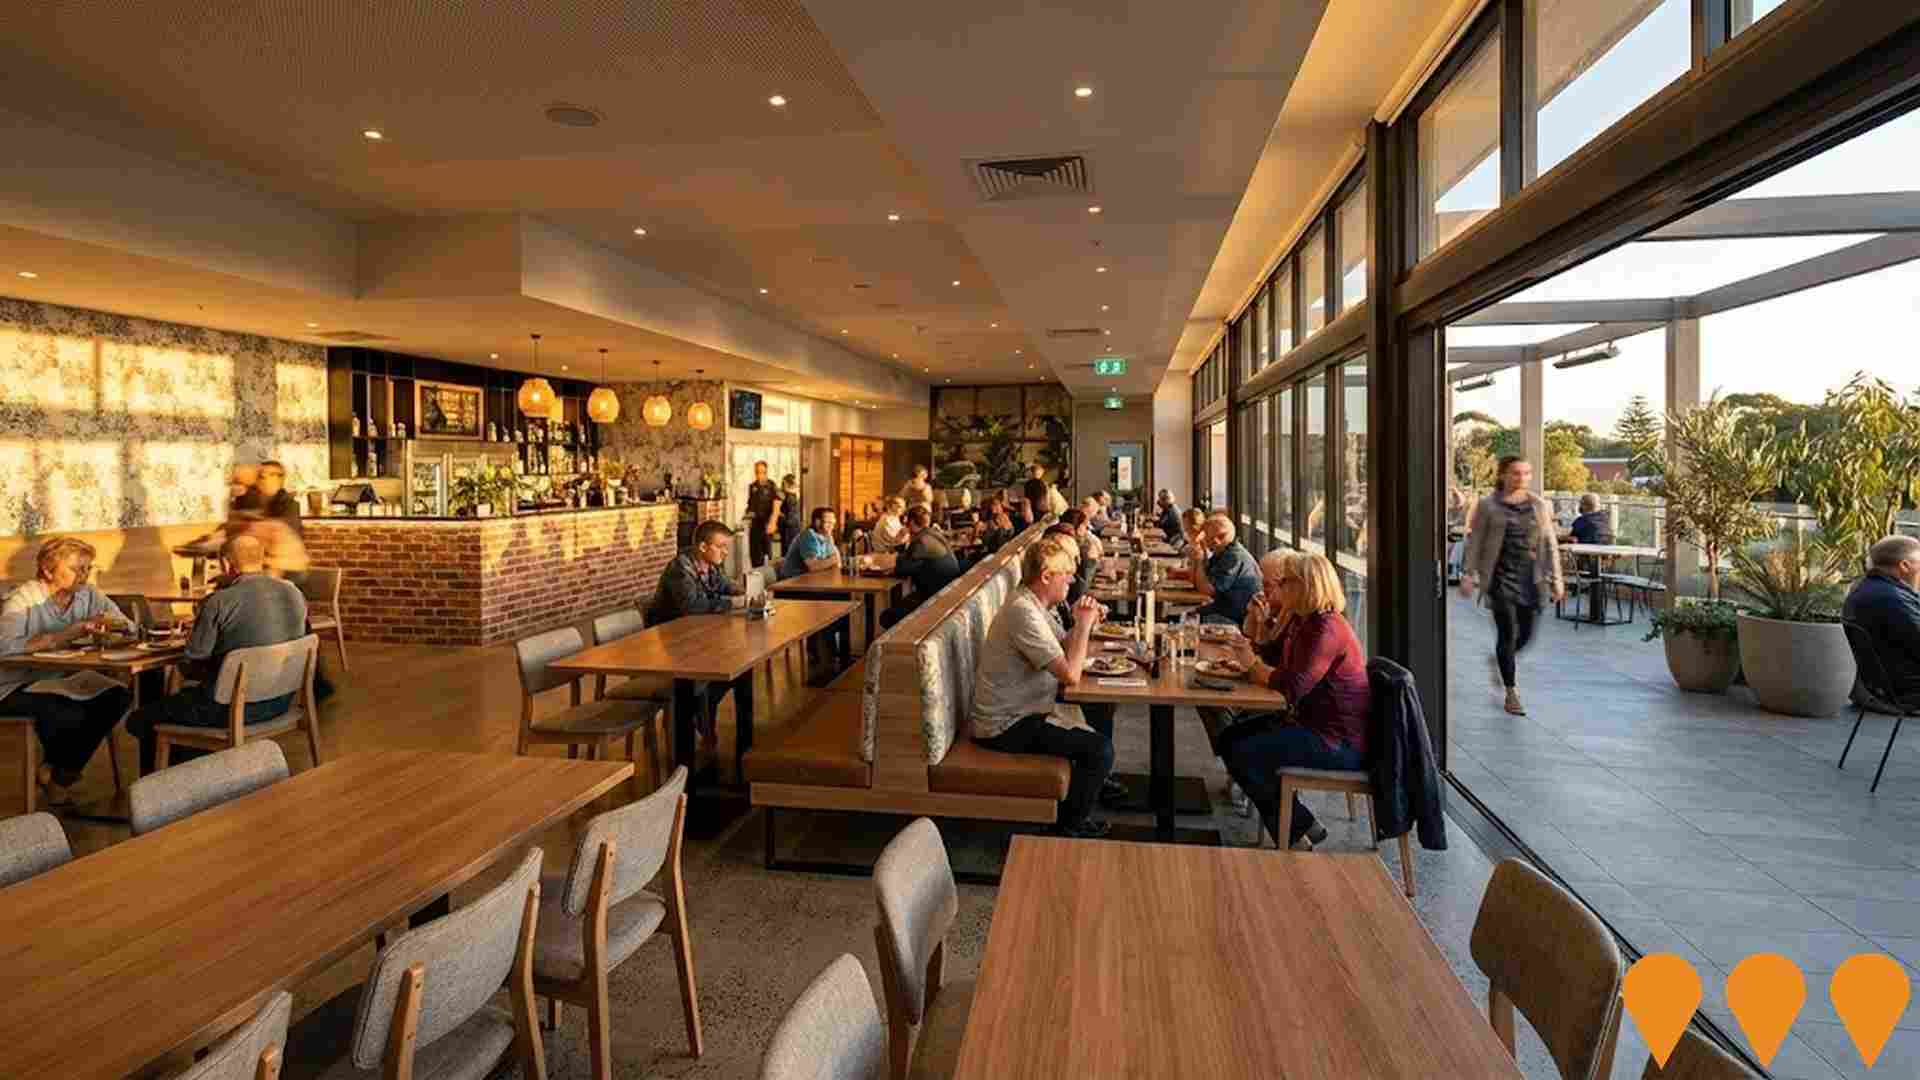
Extensive redevelopment and refurbishment of the Brighton Le Sands RSL Club building and memorial court, delivering a modern community club with upgraded dining spaces, sports lounge, refreshed gaming areas and enhanced memorial facilities while maintaining its role as a social hub for locals and veterans. Sources: club history and refurbishment case studies. :contentReference[oaicite:0]{index=0} :contentReference[oaicite:1]{index=1} :contentReference[oaicite:2]{index=2}
Bay Street Mixed-Use Development (271-275 Bay Street)
130-apartment development on a 4,000sqm amalgamated site comprising four properties. The 15,500sqm development by Vanis Holdings Pty Ltd includes three ground-floor retail premises and will be the second-tallest building in Brighton-Le-Sands at 13 storeys, connecting to existing Brighton Shores apartment complex.
Employment
Employment conditions in Monterey - Brighton-le-Sands - Kyeemagh remain below the national average according to AreaSearch analysis
Monterey - Brighton-le-Sands - Kyeemagh has a well-educated workforce with professional services being strongly represented. The unemployment rate in the area was 3.9% as of September 2025, which is 0.3% lower than Greater Sydney's rate of 4.2%.
Employment growth over the past year was estimated at 3.1%. There were 8,021 residents employed in September 2025, with workforce participation being somewhat below standard at 55.2%, compared to Greater Sydney's 60.0%. The leading employment industries among residents are health care & social assistance, construction, and retail trade. Transport, postal & warehousing shows particularly notable concentration, with employment levels at 1.6 times the regional average.
However, professional & technical employs only 9.1% of local workers, which is below Greater Sydney's 11.5%. The area appears to offer limited employment opportunities locally, as indicated by the count of Census working population vs resident population. In the 12-month period ending in September 2025, employment increased by 3.1%, while labour force increased by 3.8%, causing the unemployment rate to rise by 0.6 percentage points. By comparison, Greater Sydney recorded employment growth of 2.1%, labour force growth of 2.4%, with unemployment rising by 0.2 percentage points. State-level data from 25-Nov shows NSW employment contracted by 0.03% (losing 2,260 jobs), with the state unemployment rate at 3.9%. This compares favourably to the national unemployment rate of 4.3%. Jobs and Skills Australia's national employment forecasts from May-25 suggest that national employment should increase by 6.6% over five years and 13.7% over ten years. Applying these industry-specific projections to Monterey - Brighton-le-Sands - Kyeemagh's employment mix suggests local employment should increase by 6.7% over five years and 13.7% over ten years, based on a simple weighting extrapolation for illustrative purposes.
Frequently Asked Questions - Employment
Income
Income levels align closely with national averages, indicating typical economic conditions for Australian communities according to AreaSearch analysis
The median taxpayer income in Monterey - Brighton-le-Sands - Kyeemagh SA2 was $51,065 and the average was $64,651 according to postcode level ATO data aggregated by AreaSearch for financial year 2022. This is roughly national average, differing from Greater Sydney's median income of $56,994 and average income of $80,856. Assuming a Wage Price Index growth of 12.61%, current estimates would be approximately $57,504 (median) and $72,803 (average) as of September 2025. In the area, incomes ranked modestly according to 2021 Census figures, between the 44th and 52nd percentiles for household, family, and personal incomes. The income bracket of $1,500 - 2,999 dominated with 30.1% of residents (4,110 people), similar to regional levels at 30.9%. Housing affordability was severe, with only 80.2% of income remaining, ranking at the 40th percentile. The area's SEIFA income ranking placed it in the 6th decile.
Frequently Asked Questions - Income
Housing
Monterey - Brighton-le-Sands - Kyeemagh features a more urban dwelling mix with significant apartment living, with above-average rates of outright home ownership
Dwelling structure in Monterey-Brighton-le-Sands-Kyeemagh, as per the latest Census, consisted of 37.2% houses and 62.9% other dwellings (semi-detached, apartments, 'other' dwellings). This compared to Sydney metro's 39.8% houses and 60.3% other dwellings. Home ownership in Monterey-Brighton-le-Sands-Kyeemagh stood at 34.7%, with mortgaged dwellings at 26.4% and rented ones at 38.9%. The median monthly mortgage repayment was $2,484, higher than Sydney metro's $2,383. Median weekly rent was $450, compared to Sydney metro's $480. Nationally, mortgage repayments were significantly higher at $1,863 and rents substantially above the national figure of $375.
Frequently Asked Questions - Housing
Household Composition
Monterey - Brighton-le-Sands - Kyeemagh features high concentrations of lone person households, with a lower-than-average median household size
Family households account for 63.9% of all households, including 27.2% couples with children, 23.4% couples without children, and 12.0% single parent families. Non-family households constitute the remaining 36.1%, with lone person households at 32.7% and group households making up 3.3% of the total. The median household size is 2.3 people, which is smaller than the Greater Sydney average of 2.6.
Frequently Asked Questions - Households
Local Schools & Education
The educational profile of Monterey - Brighton-le-Sands - Kyeemagh exceeds national averages, with above-average qualification levels and academic performance metrics
In Monterey - Brighton-le-Sands - Kyeemagh trail region, 30.9% of residents aged 15 and above hold university degrees, compared to the SA3 area's 38.7%. Bachelor degrees are most common at 21.5%, followed by postgraduate qualifications (7.4%) and graduate diplomas (2.0%). Vocational credentials are held by 31.4% of residents aged 15 and above, with advanced diplomas at 12.7% and certificates at 18.7%. Educational participation is high, with 27.3% of residents currently enrolled in formal education.
This includes 8.2% in primary education, 6.4% in secondary education, and 5.4% pursuing tertiary education.
Frequently Asked Questions - Education
Schools Detail
Nearby Services & Amenities
Transport
Transport servicing is moderate compared to other areas nationally based on assessment of service frequency, route connectivity and accessibility
Monterey-Brighton-le-Sands-Kyeemagh area has 90 active public transport stops. These are served by buses on six different routes, offering a total of 1,112 weekly passenger trips. Residents' average distance to the nearest stop is 121 meters, indicating excellent accessibility.
The service operates at an average frequency of 158 trips per day across all routes, equating to approximately 12 weekly trips per individual stop.
Frequently Asked Questions - Transport
Transport Stops Detail
Health
The level of general health in Monterey - Brighton-le-Sands - Kyeemagh is notably higher than the national average with both young and old age cohorts seeing low prevalence of common health conditions
Monterey-Brighton-le-Sands-Kyeemagh demonstrates above-average health outcomes for both young and old age cohorts.
Common health conditions have low prevalence in this area. Private health cover is approximately 52% of the total population (~7,087 people), which leads that of the average SA2 area. The most common medical conditions are arthritis and diabetes, impacting 7.7 and 5.4% of residents respectively. 73.5% of residents declare themselves completely clear of medical ailments compared to 77.5% across Greater Sydney. The area has 21.9% of residents aged 65 and over (2,993 people), which is higher than the 16.4% in Greater Sydney. Health outcomes among seniors are particularly strong, broadly in line with the general population's health profile.
Frequently Asked Questions - Health
Cultural Diversity
Monterey - Brighton-le-Sands - Kyeemagh is among the most culturally diverse areas in the country based on AreaSearch assessment of a range of language and cultural background related metrics
Monterey-Brighton-le-Sands-Kyeemagh has a high level of cultural diversity with 43.1% of its population born overseas and 51.6% speaking a language other than English at home. Christianity is the predominant religion in Monterey-Brighton-le-Sands-Kyeemagh, making up 68.2% of the population, compared to 51.8% across Greater Sydney. The top three ancestry groups are Other (20.9%), Greek (16.5%), and Australian (12.0%).
Notably, Spanish (1.6%) and Serbian (1.7%) are overrepresented in Monterey-Brighton-le-Sands-Kyeemagh compared to regional averages of 0.9% each.
Frequently Asked Questions - Diversity
Age
Monterey - Brighton-le-Sands - Kyeemagh hosts a notably older demographic compared to the national average
Monterey - Brighton-le-Sands - Kyeemagh has a median age of 44, which is higher than Greater Sydney's figure of 37 and significantly exceeds the national norm of 38. The age group of 55-64 years is strongly represented at 13.4%, compared to Greater Sydney, while the 25-34 cohort is less prevalent at 12.4%. According to the 2021 Census, the 15 to 24 age group has increased from 9.6% to 10.6% of the population. Conversely, the 35 to 44 age group has decreased from 14.8% to 13.8%. Demographic modeling indicates that Monterey - Brighton-le-Sands - Kyeemagh's age profile will change significantly by 2041. The 75 to 84 age group is projected to grow by 31%, reaching 1,459 people from the current 1,111. This growth is primarily driven by an aging population dynamic, with those aged 65 and above comprising 91% of the projected growth. Meanwhile, the 45 to 54 and 15 to 24 age groups are expected to experience population declines.
