Harrington Park
Statistical Area - sa2

Chart Color Schemes
Loading map data ...
0 People

est. as @ -- *

ABS ERP | -- people | --

2021 Census | -- people

Land Area
--
Land Area
Population Density
--
Density
Unemployment Rate
--
Unemployment
Development
--
Resi Approvals
Get My Report

Sales Activity

Table Chart PROFILE FAQ

Curious about local property values? Filter the chart to assess the volume and appreciation (including resales) trends and regional comparisons, or scroll to the map below view this information at an individual property level.

House icon
Median Price
$0
Key icon
1yr Sales Volume
0
Find a Recent Sale
Type Specified (1) | Limit 50

Sales Detail

Population

Table Chart PROFILE FAQ

Population growth drivers in Harrington Park are strong compared to national averages based on AreaSearch's ranking of recent, and medium to long-term trends

Harrington Park's population was 11,241 according to the 2021 Census. As of Aug 2025, it is around 11,441, reflecting a growth of 200 people (1.8%) since the Census. This increase is inferred from ABS estimated resident population data and validated new addresses. The current population density is 1,836 persons per square kilometer. Harrington Park has shown resilient growth over the past decade with a compound annual growth rate of 2%. Natural growth contributed approximately 50.7% of overall population gains during recent periods.

AreaSearch adopts ABS/Geoscience Australia projections for each SA2 area released in 2024 using 2022 as the base year, and NSW State Government's SA2 level projections for areas not covered by this data, released in 2022 with 2021 as the base year. Growth rates by age group are applied to all areas from 2032 to 2041. Future population dynamics anticipate a growth just below the median of statistical areas analysed by AreaSearch, expecting an increase of 740 persons to 2041 based on latest population numbers, reflecting a total increase of 6.5% over the 17 years.

Frequently Asked Questions - Population

What is the latest population estimate for Harrington Park?
Total population for Harrington Park was estimated to be approximately 11,441 as at Aug 25. This is based upon an estimated resident population of 11,441 from the ABS up to June 2024.
How has the population in Harrington Park changed since 2021?
Harrington Park has added approximately 200 people and shown a 1.78% increase from the 11,241 people recorded at the 2021 Census period.
What is the population density in Harrington Park?
The population density in Harrington Park is estimated at 1,836 persons per square kilometer based on the latest population estimate.
How much has the population grown over the past 10 years?
Over the past 10 years, the population has shown a compound annual growth rate of 2.0% per annum.
What are the main drivers of population growth in the area?
Population growth in Harrington Park is driven by: Natural increase (50.7%), Overseas migration (49.3%), Interstate migration (0.0%). The primary driver is Natural increase, contributing 50.7% of overall population gains.

Development

Table Chart PROFILE FAQ

AreaSearch assessment of residential development drivers sees a low level of activity in Harrington Park, placing the area among the bottom 25% of areas assessed nationally

Harrington Park has averaged approximately 13 new dwelling approvals per year. The Australian Bureau of Statistics produces development approval data on a financial year basis, with 66 dwellings approved between the financial years FY21 and FY25, and one so far in FY26. Each dwelling built over these five years has resulted in an average of 2.6 new residents per year, indicating solid demand that supports property values. The average construction cost value for new homes is $416,000, which is under regional levels, suggesting more accessible housing choices for buyers.

This financial year has seen $50,000 in commercial approvals registered, reflecting a predominantly residential focus. Compared to Greater Sydney, Harrington Park has significantly less development activity, with 74.0% below the regional average per person. This scarcity of new dwellings typically strengthens demand and prices for existing properties. Nationally, this is also lower, indicating market maturity and possible development constraints. All new construction in Harrington Park has been detached houses, maintaining the area's traditional suburban character focused on family homes appealing to those seeking space.

The location has approximately 2468 people per dwelling approval, demonstrating an established market. Population forecasts indicate Harrington Park will gain 740 residents by the year 2041. Construction is maintaining a reasonable pace with projected growth, although buyers may encounter growing competition as population increases.

Frequently Asked Questions - Development

How many dwelling approvals have occurred in the Harrington Park area recently?
Dwelling approval activity in the Harrington Park area has seen 13 residential approvals over the past two financial years, based on AreaSearch's SA2 aggregation method. Harrington Park's current population of 11,441 has been supported by 13 approvals on average over recent years.
How does Harrington Park's development activity compare to the broader region?
Harrington Park has seen 0.12 approvals per 100 people in recent years, compared to 0.66 approvals in the broader region. This means that one dwelling has been approved for every 2468 people in Harrington Park, compared to one for every 186 in the broader region.
Is the Harrington Park area keeping up with housing demand?
With the population expected to increase by 740 people by 2041, around 247 new dwellings will be necessary. Recent approval levels may be insufficient to meet these forecasts, considering the census average of 3.0 persons per dwelling. This indicates potential housing shortages if current approval trends continue.
What has been the trend in development approvals over the past five years?
Looking at development activity over the past five years, Harrington Park's approval levels have been significantly below the yearly average of 13, showing a notable downturn in recent development.
How many dwellings will be needed to accommodate future population growth?
The population in Harrington Park is expected to grow by 740 people by 2041, necessitating approximately 247 new dwellings. This calculation is based on the current census average of 3.0 persons per dwelling in the area.
How does recent development compare to population growth in Harrington Park?
Over the past five years, the population in Harrington Park has grown by approximately 8,145 people, while 66 residential approvals were recorded. This equates to a ratio of 123.4 people added for each new dwelling approval. This high ratio suggests strong population growth relative to housing supply, potentially indicating unmet housing demand.
Are there opportunities for residential developers in Harrington Park?
With dwelling approval activity running at an average of 13 approvals per year and a population of 11,441, there appears to be a supply shortfall relative to projected demand, presenting strong opportunities for residential developers. With the population expected to increase by 740 people by 2041, around 247 new dwellings will be necessary. Current approval trends may be insufficient to meet forecast demand, indicating strong development opportunities.

Infrastructure

PROFILE FAQ

Harrington Park has very high levels of nearby infrastructure activity, ranking in the top 20% nationally

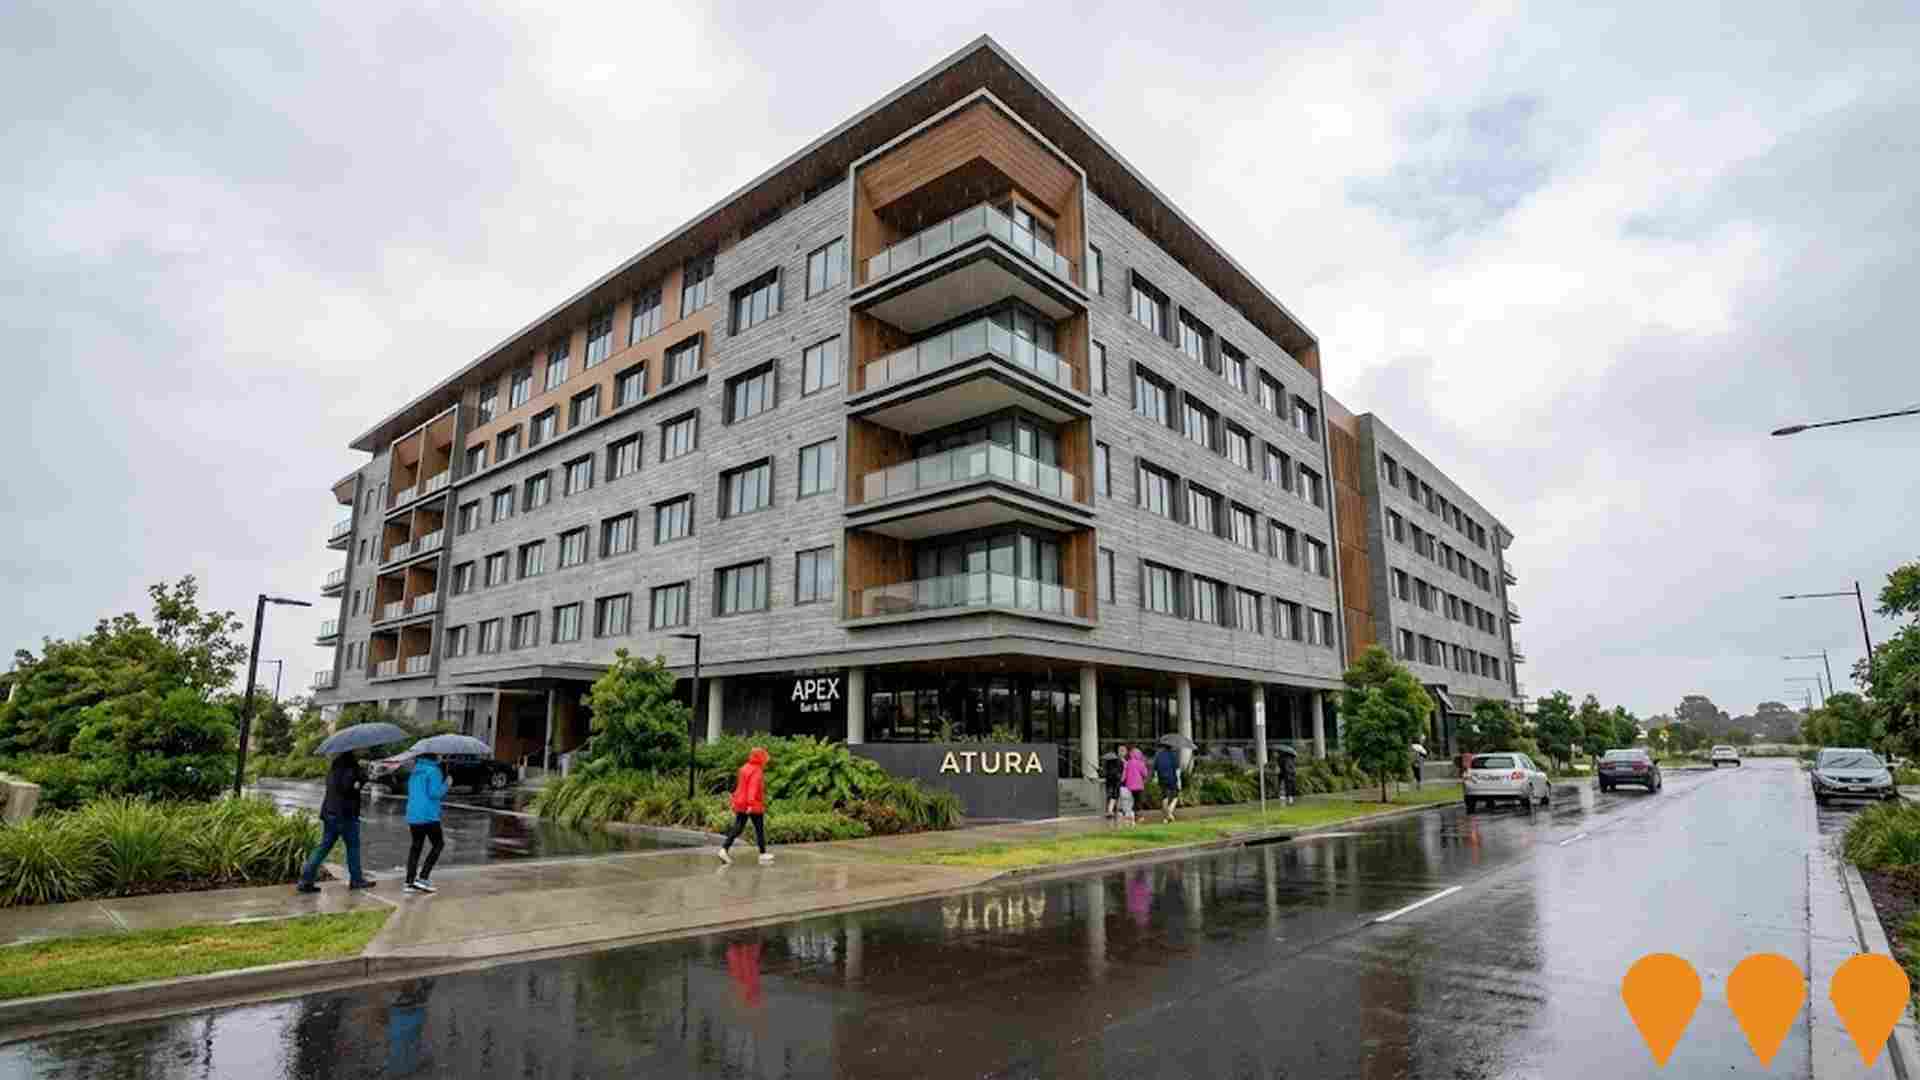
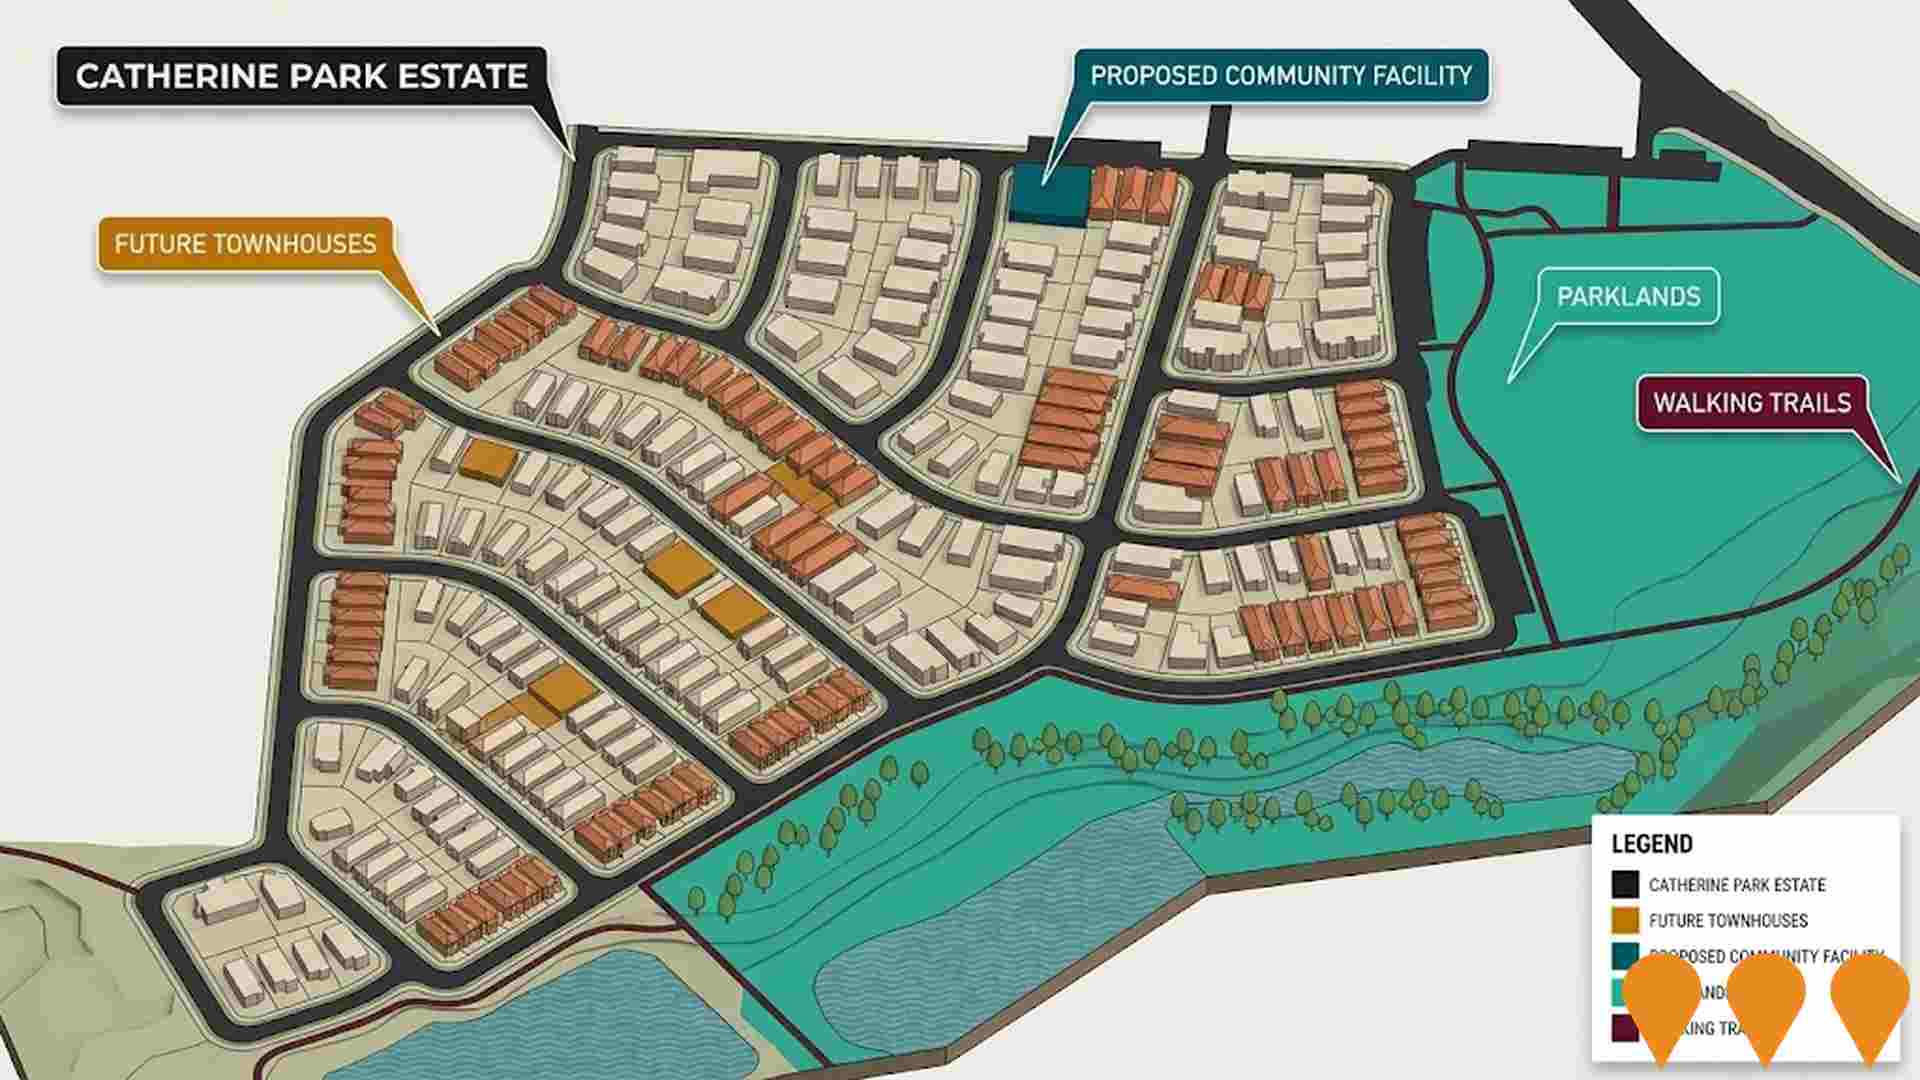
Changes to local infrastructure significantly impact an area's performance. AreaSearch identified 33 projects likely influencing the region. Notable initiatives include Oran Park Hotel (Atura Hotel), Tulich Retirement Tower Oran Park, Catherine Park Estate, and Oran Park Town Development. The following list details those most relevant:.

Professional plan users can use the search below to filter and access additional projects.

INFRASTRUCTURE SEARCH
All Selected

Frequently Asked Questions - Infrastructure

What are some of the major infrastructure and planning changes likely to influence Harrington Park?
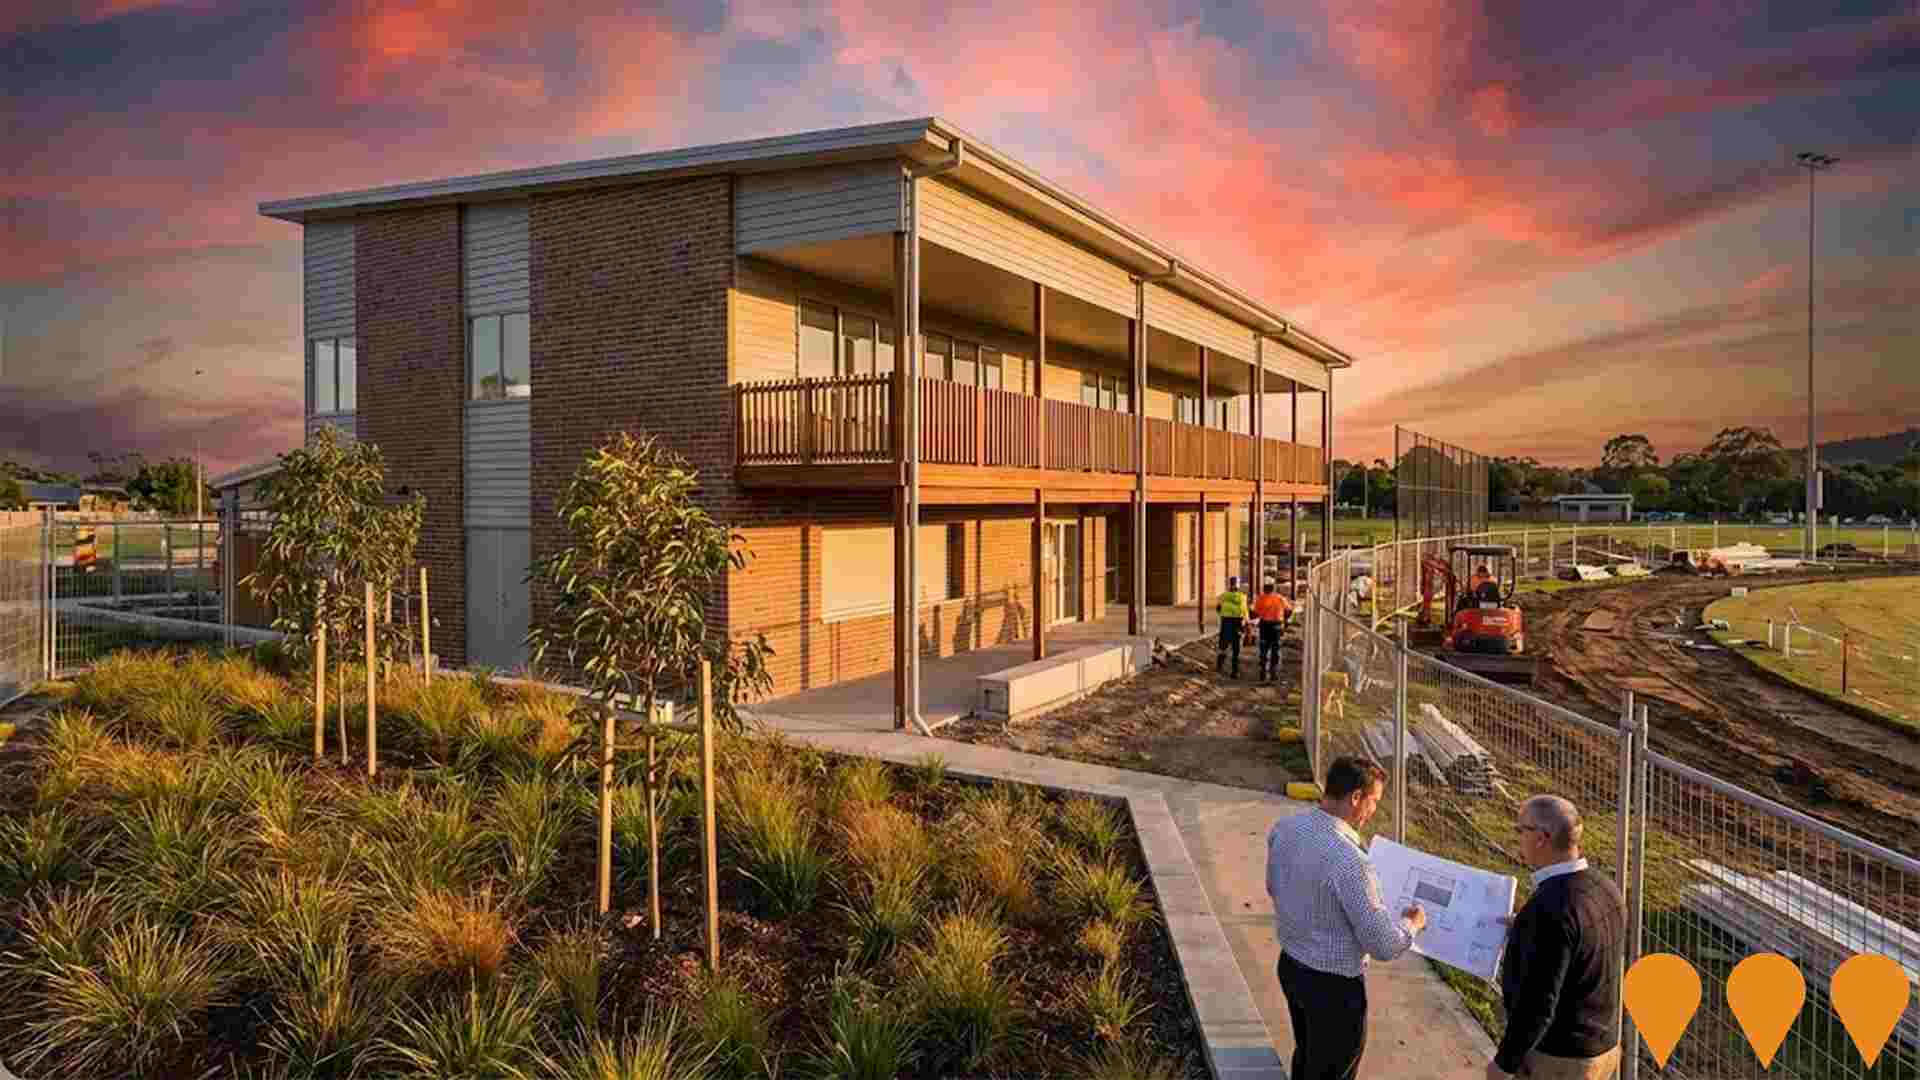
Key infrastructure and planning changes likely to influence Harrington Park include: Oran Park Hotel (Atura Hotel) (Construction); Tulich Retirement Tower Oran Park (Approved); Catherine Park Estate (Construction); Oran Park Town Development (Construction); and Harrington Park Reserve Redevelopment Stage 1 (Construction). These projects represent significant developments that will shape the area's future infrastructure landscape.
What types of infrastructure projects are impacting Harrington Park?
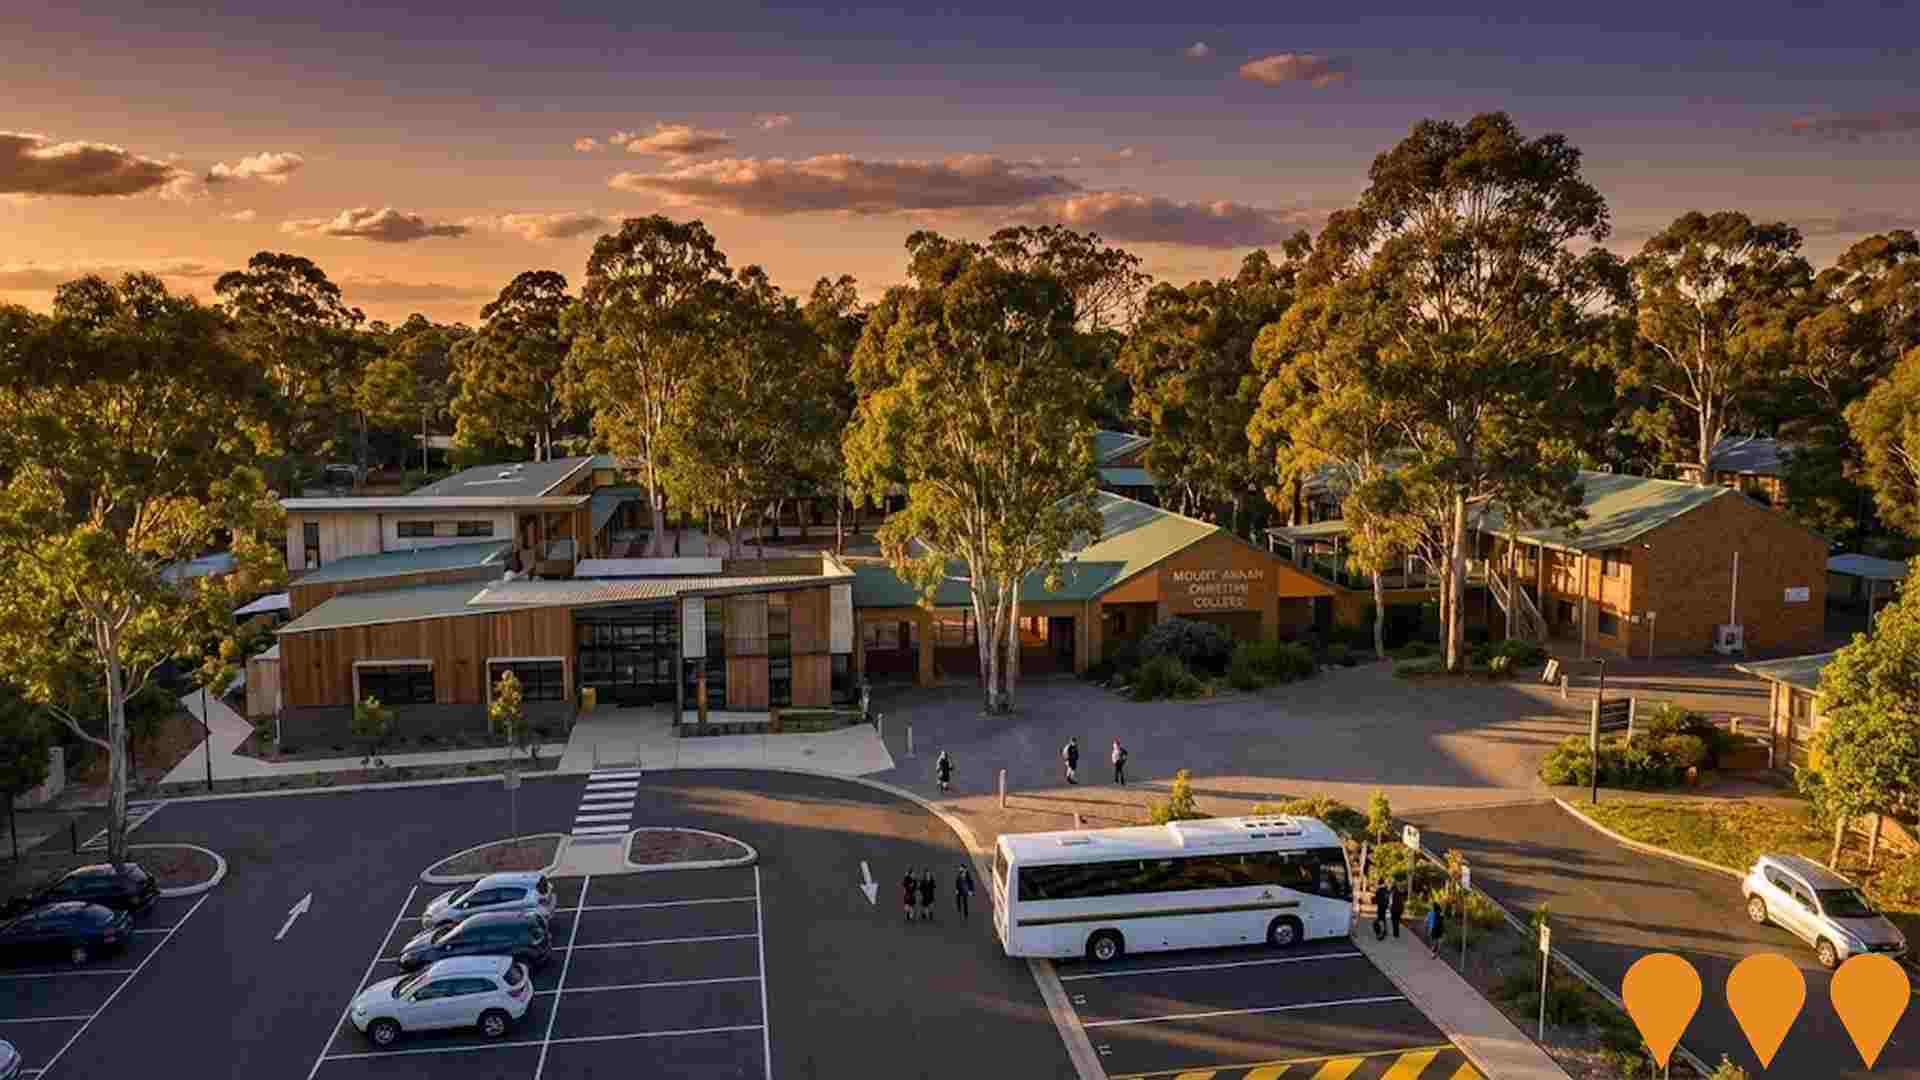
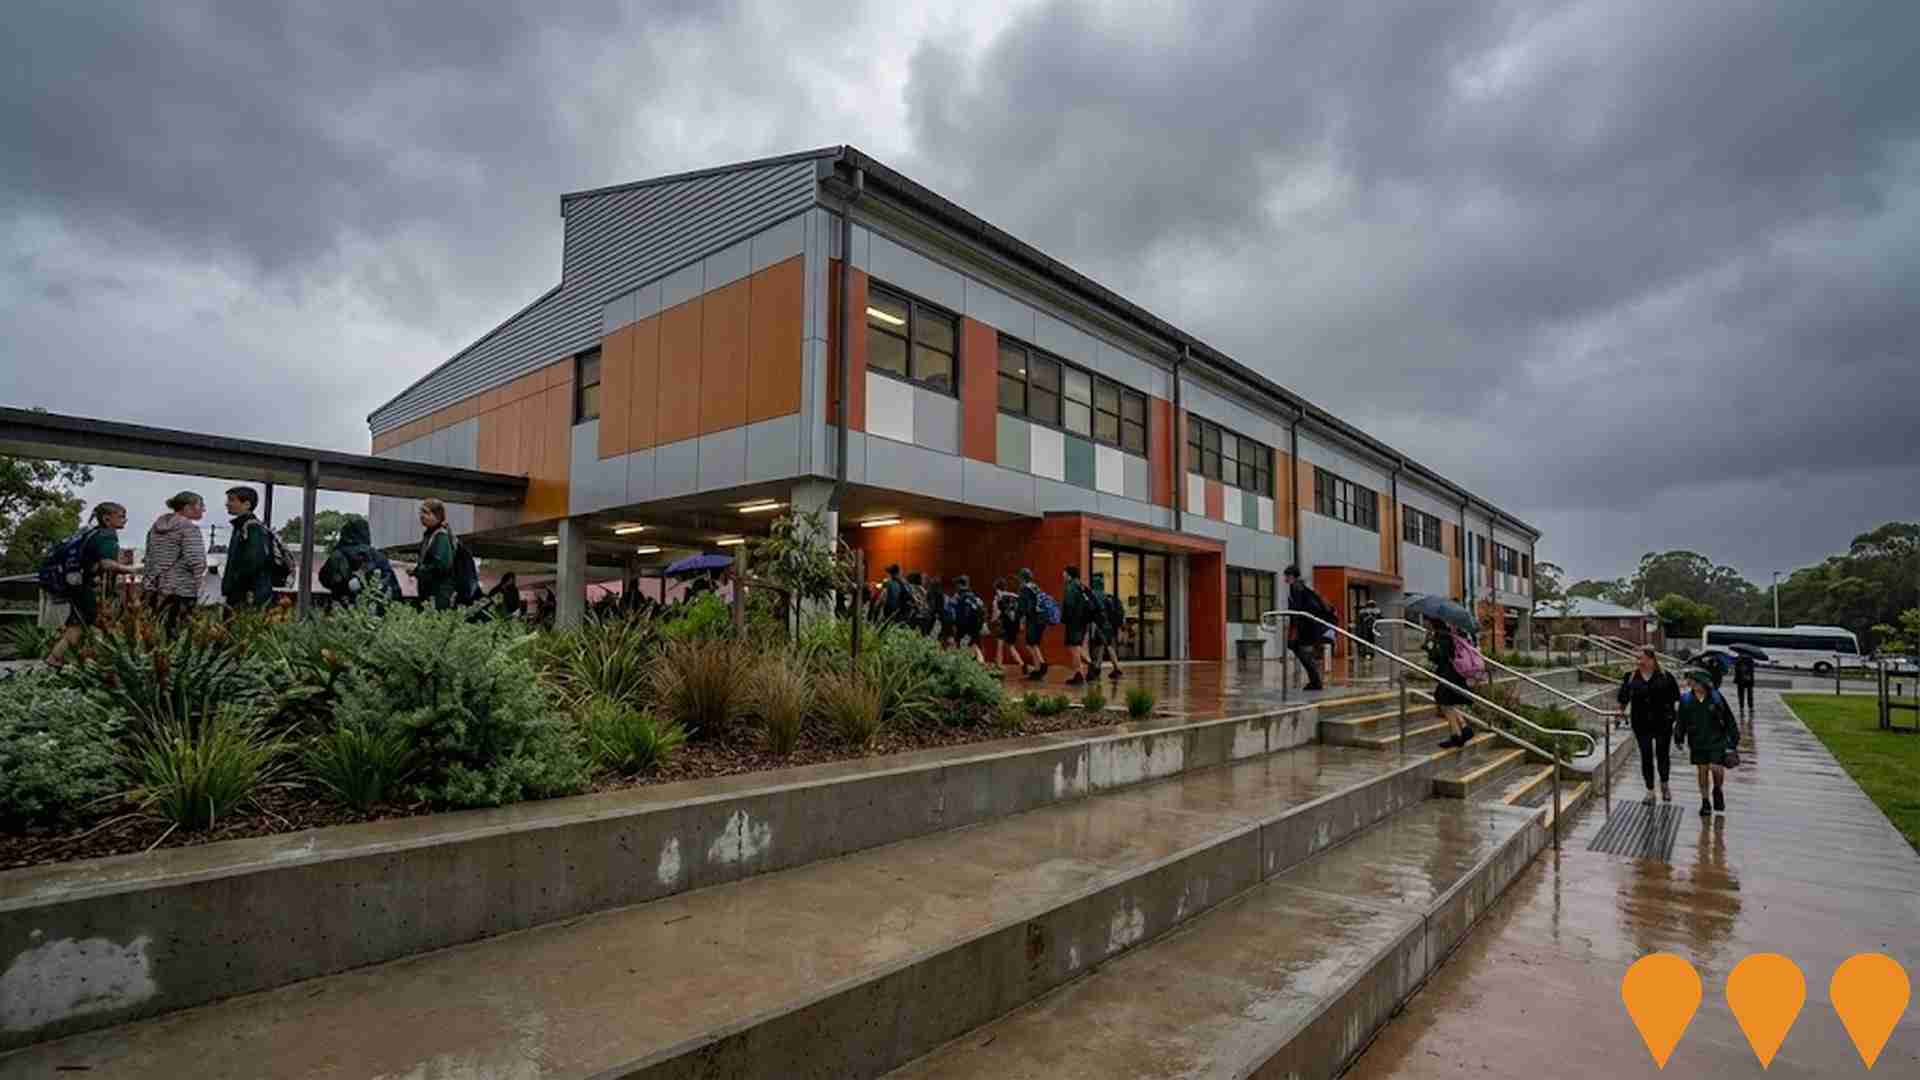
Infrastructure development impacting Harrington Park spans multiple sectors including Communities, Precincts & Urban Renewal, Education & Training, and Health & Medical, among others.
What is the scale of infrastructure investment impacting Harrington Park?
Infrastructure investment analysis indicates substantial capital deployment exceeding $11.2 billion in projects that will impact the extended area, with a notable concentration of investment within the immediate Harrington Park vicinity.
How does Harrington Park's infrastructure development compare to other areas?
Harrington Park ranks in the top 20% nationally for infrastructure development, reflecting exceptional investment activity compared to similar areas across the country.
Sydney Metro Western Sydney Airport Extension
Category: Transport & Logistics
Stage: Planning | Est. Comp: 2047
Source / Links: Link 1   Link 2  

Planned southern extension of the Sydney Metro Western Sydney Airport line from Bradfield to Macarthur via Oran Park and Narellan, providing a passenger rail connection to support population growth, economic development, and connectivity to the Western Sydney International Airport and greater Sydney transport network.

Project Image

Gregory Hills Corporate Park
Category: Health & Medical
Stage: Construction | Est. Comp: 2028
Source / Links: Link 1   Link 2  

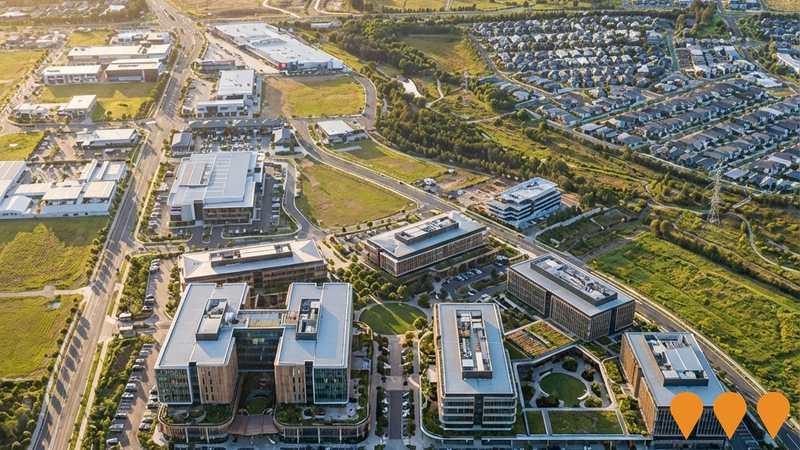
30 hectare master planned development incorporating SOMA Wellness (completed 2018), The George Centre (opened July 2023 - 57-bed private surgical and 26-bed maternity hospital), and the future Camden Medical Campus (473-bed private hospital approved). When fully completed, will be the largest private employer in Camden LGA.

Project Image

Oran Park Town Development
Category: Communities, Precincts & Urban Renewal
Stage: Construction | Est. Comp: 2040
Source / Links: Link 1   Link 2  

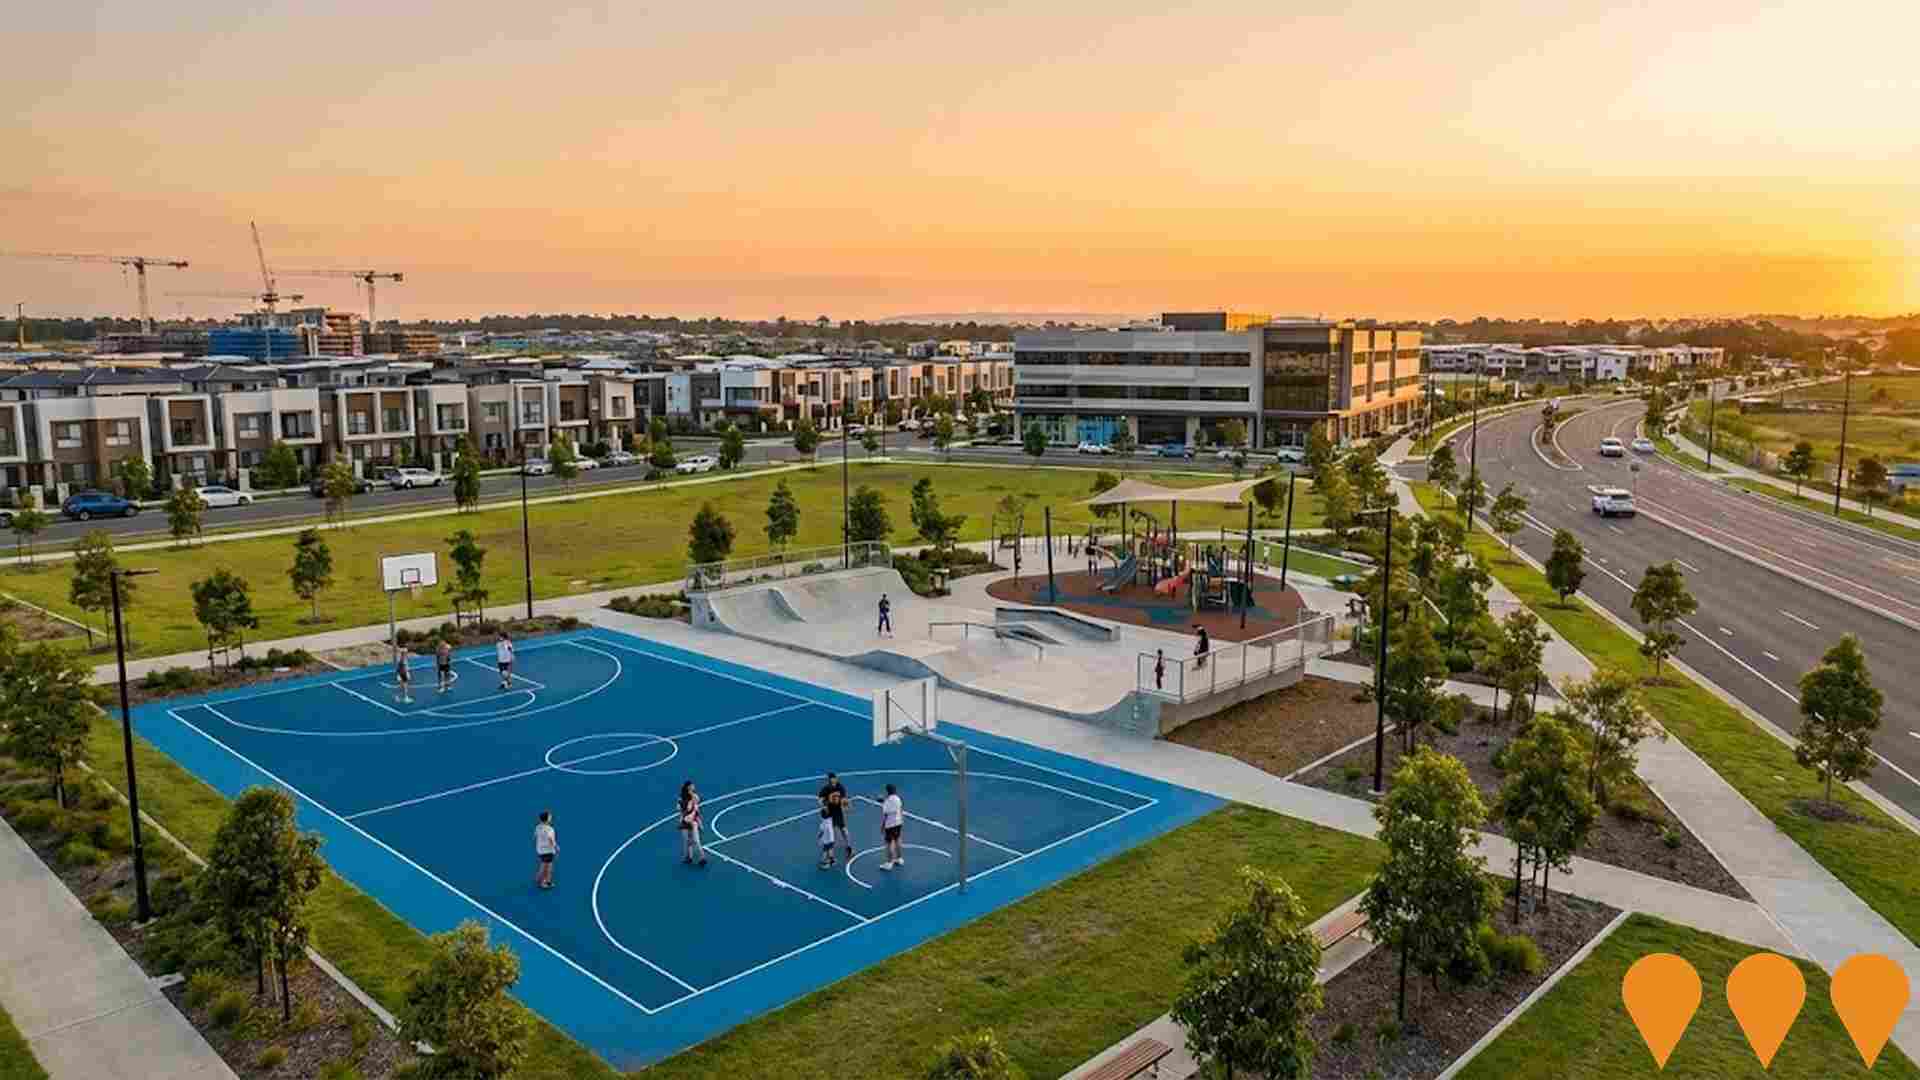
A master-planned community in southwest Sydney being developed by Greenfields Development Company and Landcom. The project will deliver over 10,000 new homes for approximately 35,000 residents upon completion. The development integrates a major town centre, multiple schools, extensive parklands, and various sporting and community facilities. The project is being delivered in stages and is expected to be completed in the early 2040s. The development spans 380 hectares and includes diverse housing options from compact lots to semi-rural lots.

Project Image

Oran Park Film Studios Precinct
Category: Arts & Culture
Stage: Construction | Est. Comp: 2027
Source / Links: Link 1   Link 2  

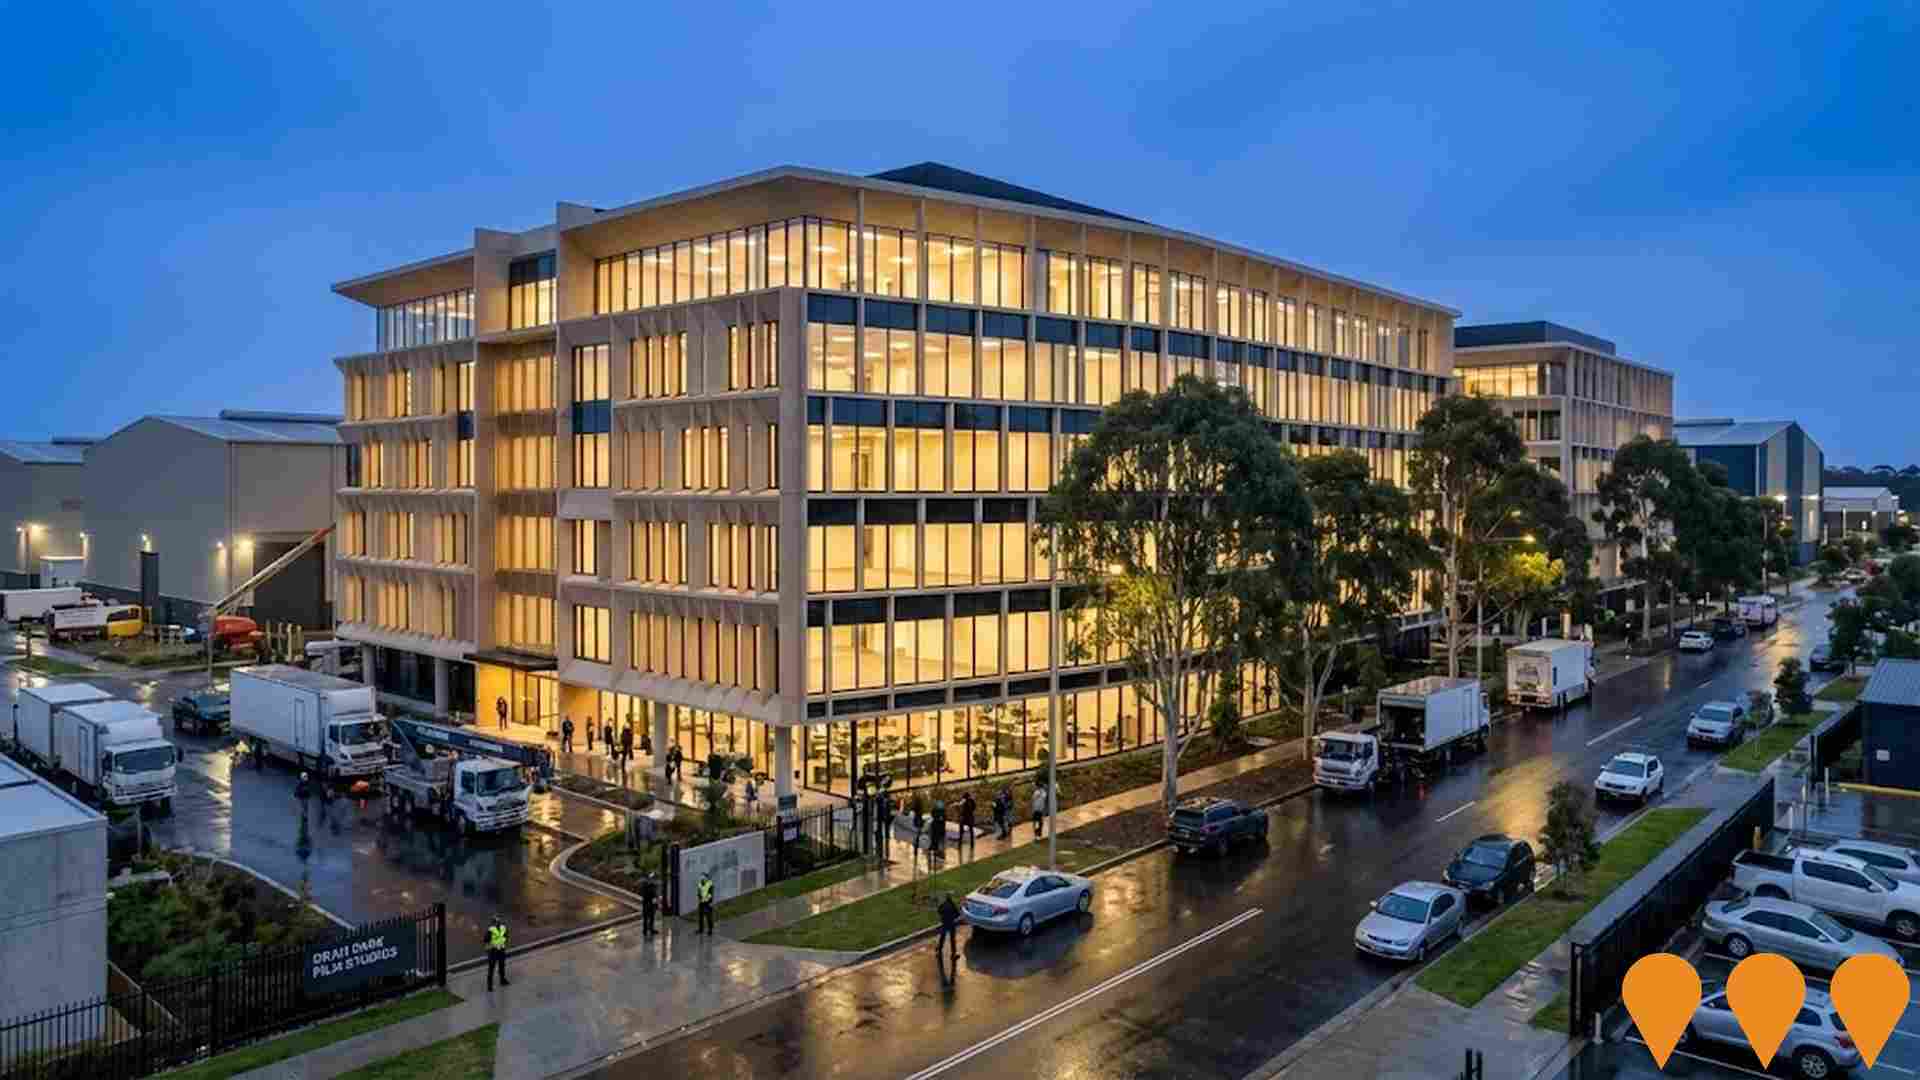
A major film and television studio complex in Western Sydney, featuring three production soundstages, set construction workshops, post-production suites, production offices, and a multideck parking facility. Developed by Greenfields Development Company, the project aims to position NSW as a competitive hub for international and local film productions, addressing a critical shortage of studio space. Expected to create over 1,500 jobs with an estimated project cost of $127 million.

Project Image

Oran Park Podium Shopping Centre Stage 2 Expansion
Category: Retail
Stage: Completed | Est. Comp: 2024
Source / Links: Link 1   Link 2  

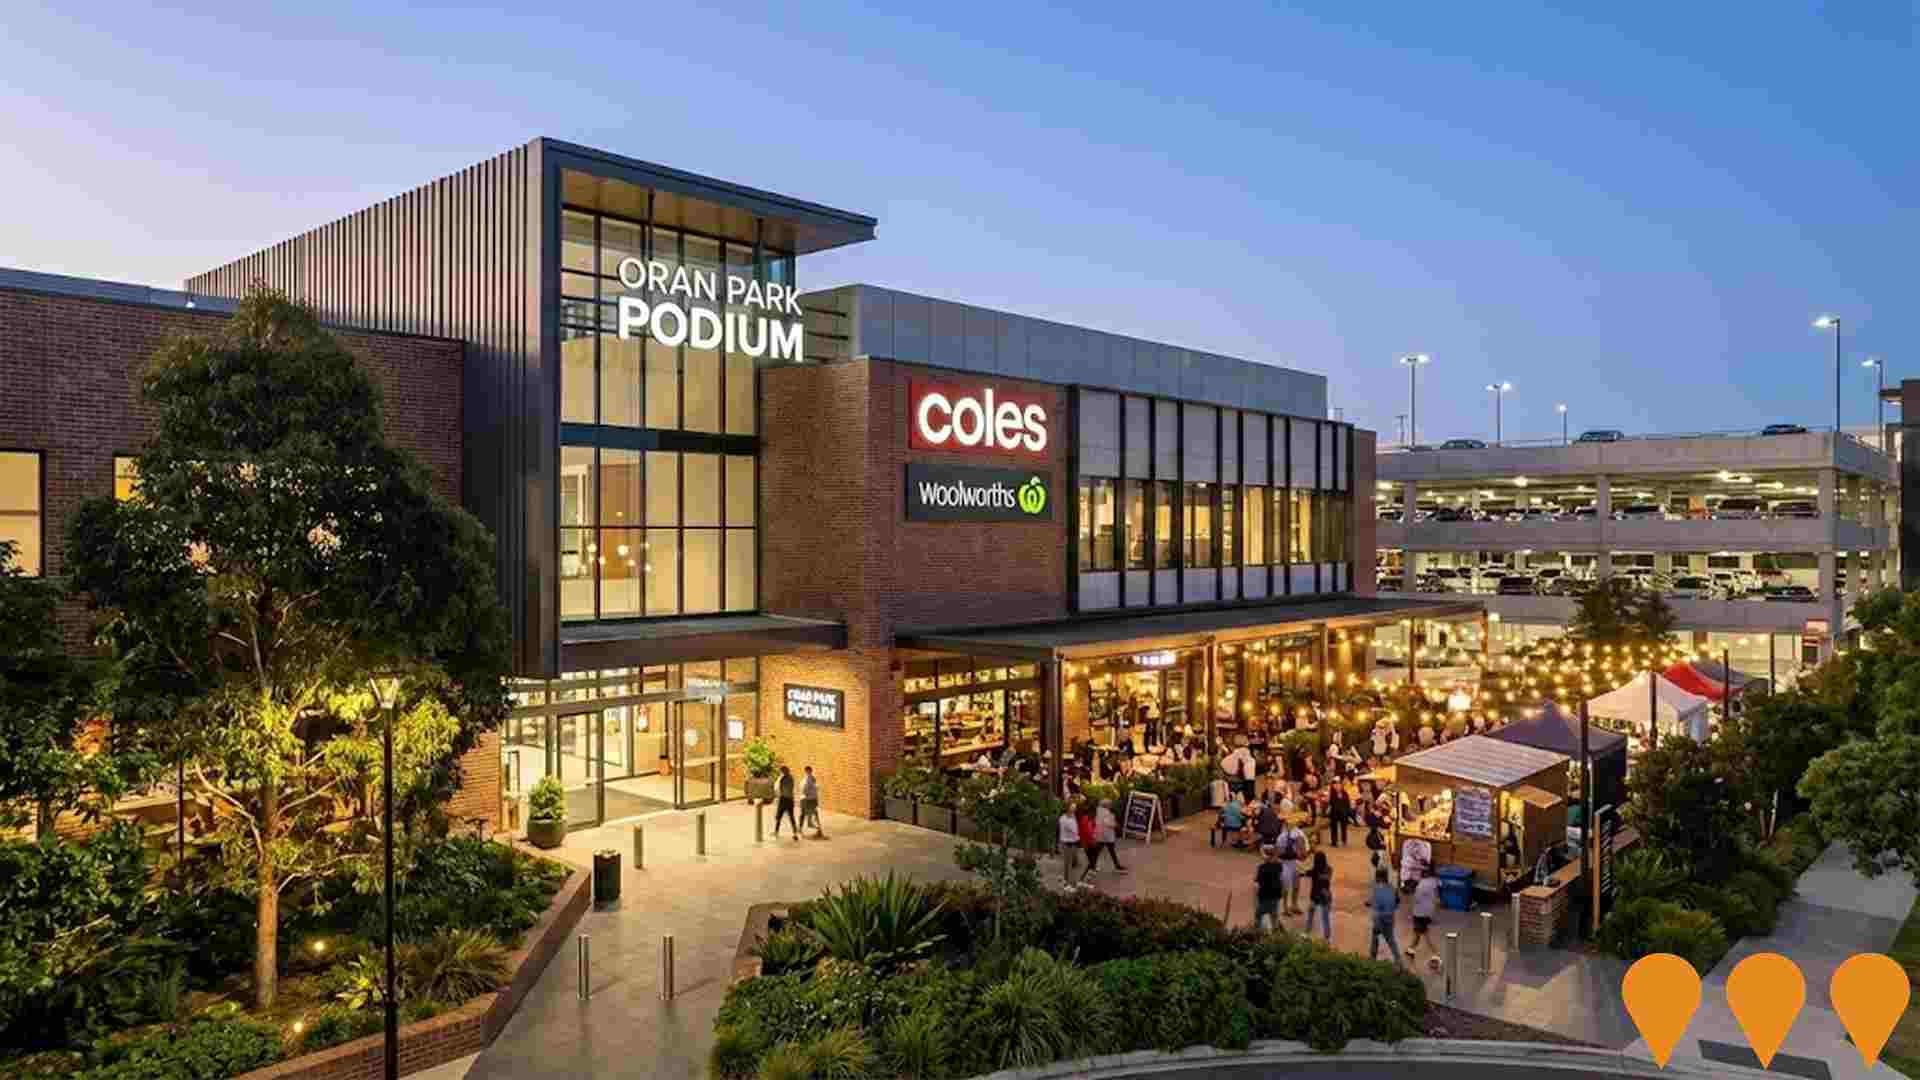
The Stage 2 expansion of Oran Park Podium shopping centre added approximately 16,700 square metres of retail space. The project transformed the Podium into a dual supermarket centre with the addition of a Coles, over 60 new specialty stores, a childcare facility, a new market hall, and an expanded outdoor dining precinct. The development also included over 1,000 additional undercover car spaces.
Project Image

Camden Council Administration Building Oran Park
Category: Communities, Precincts & Urban Renewal
Stage: Completed | Est. Comp: 2018
Source / Links: Link 1   Link 2  

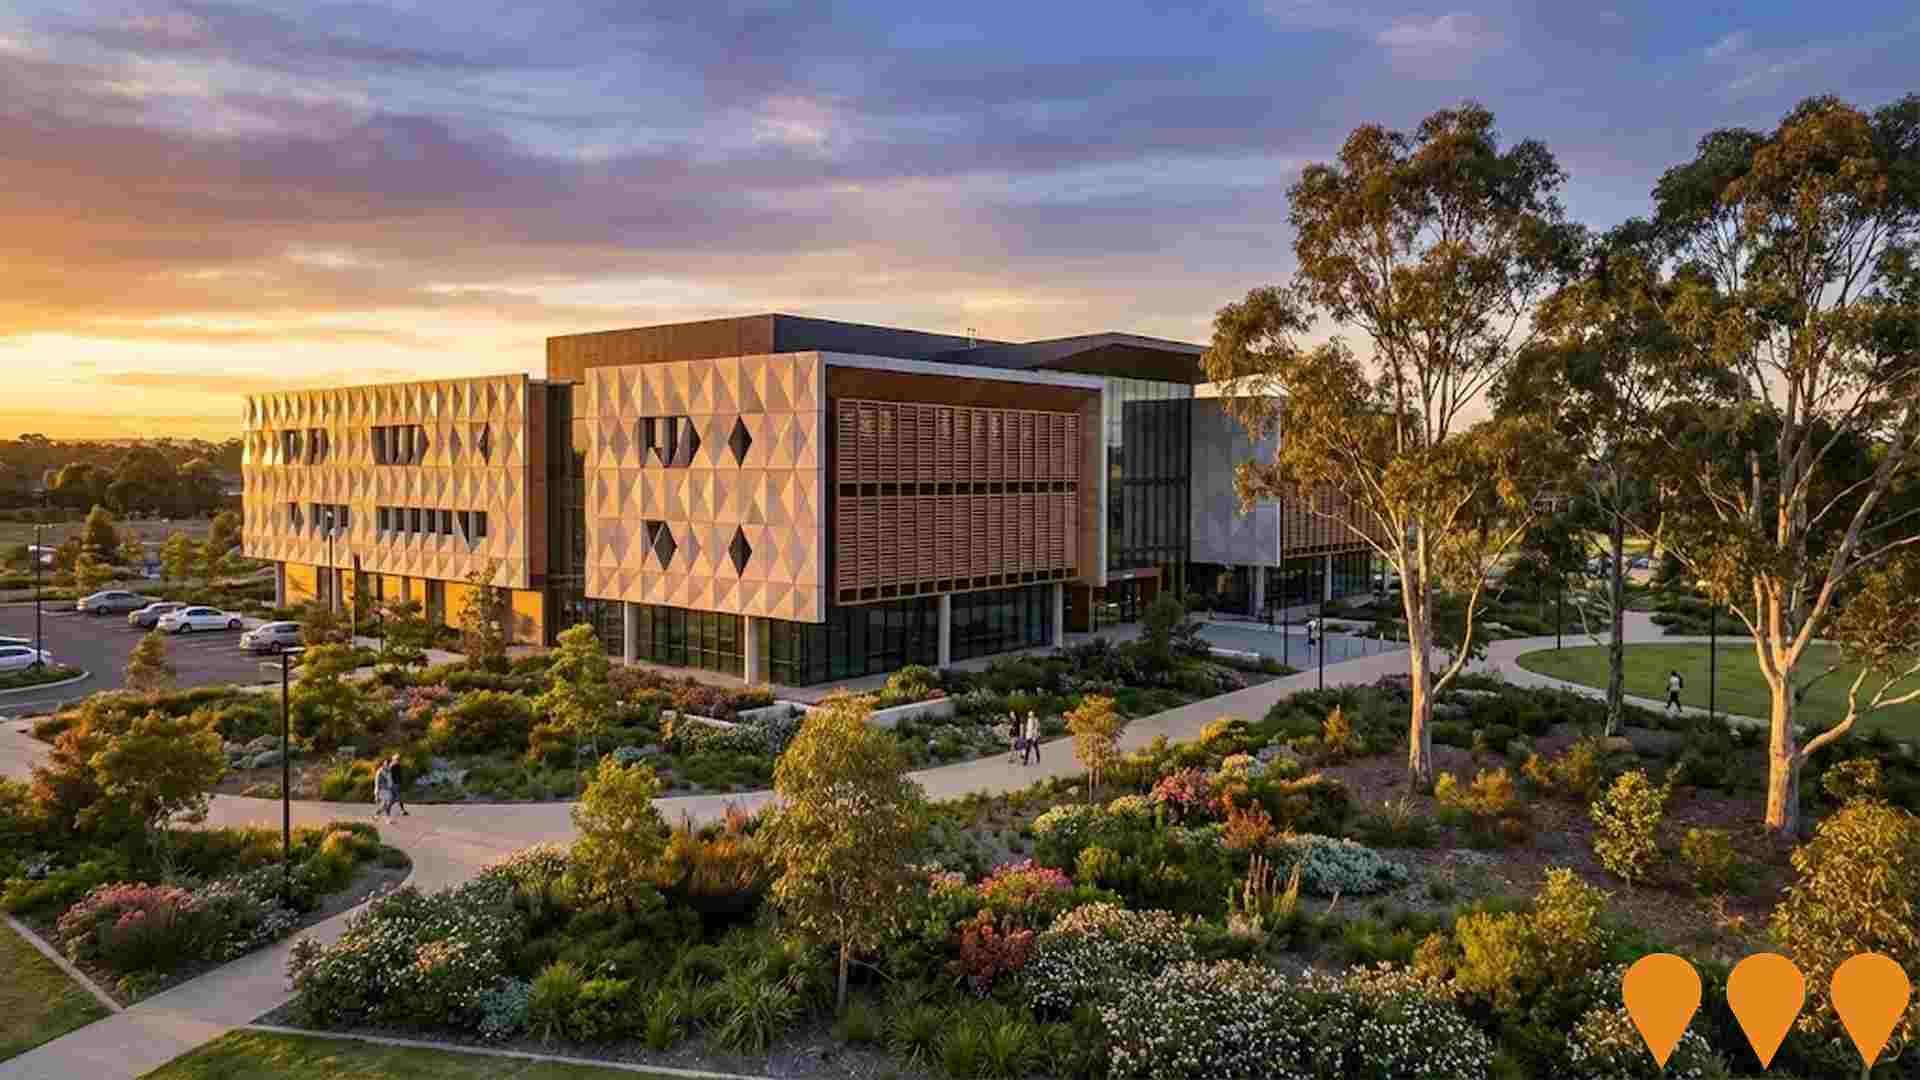
A $35.6 million, 6,000sqm administration building designed by GroupGSA and constructed by ADCO Constructions. Features customer service areas, council chambers, a central atrium, and administration offices, serving as a key civic hub for Camden Council.
Project Image

Gledswood Hills Masterplanned Community
Category: Communities, Precincts & Urban Renewal
Stage: Construction | Est. Comp: 2025
Source / Links: Link 1   Link 2  

A major 320-hectare masterplanned community by Sekisui House featuring over 1,550 contemporary dwellings and 375 apartments. The development includes premium SHAWOOD homes, 40 hectares of landscaped parklands, 50km of cycle paths, Gledswood Hills Primary School, two golf courses including a Greg Norman-designed course, and The Yards retail village. The project incorporates the Japanese 'satoyama' concept with ribbons of green connecting people and nature.

Project Image

Marian's Mana Urban Village
Category: Communities, Precincts & Urban Renewal
Stage: Construction | Est. Comp: 2027
Source / Links: Link 1   Link 2  

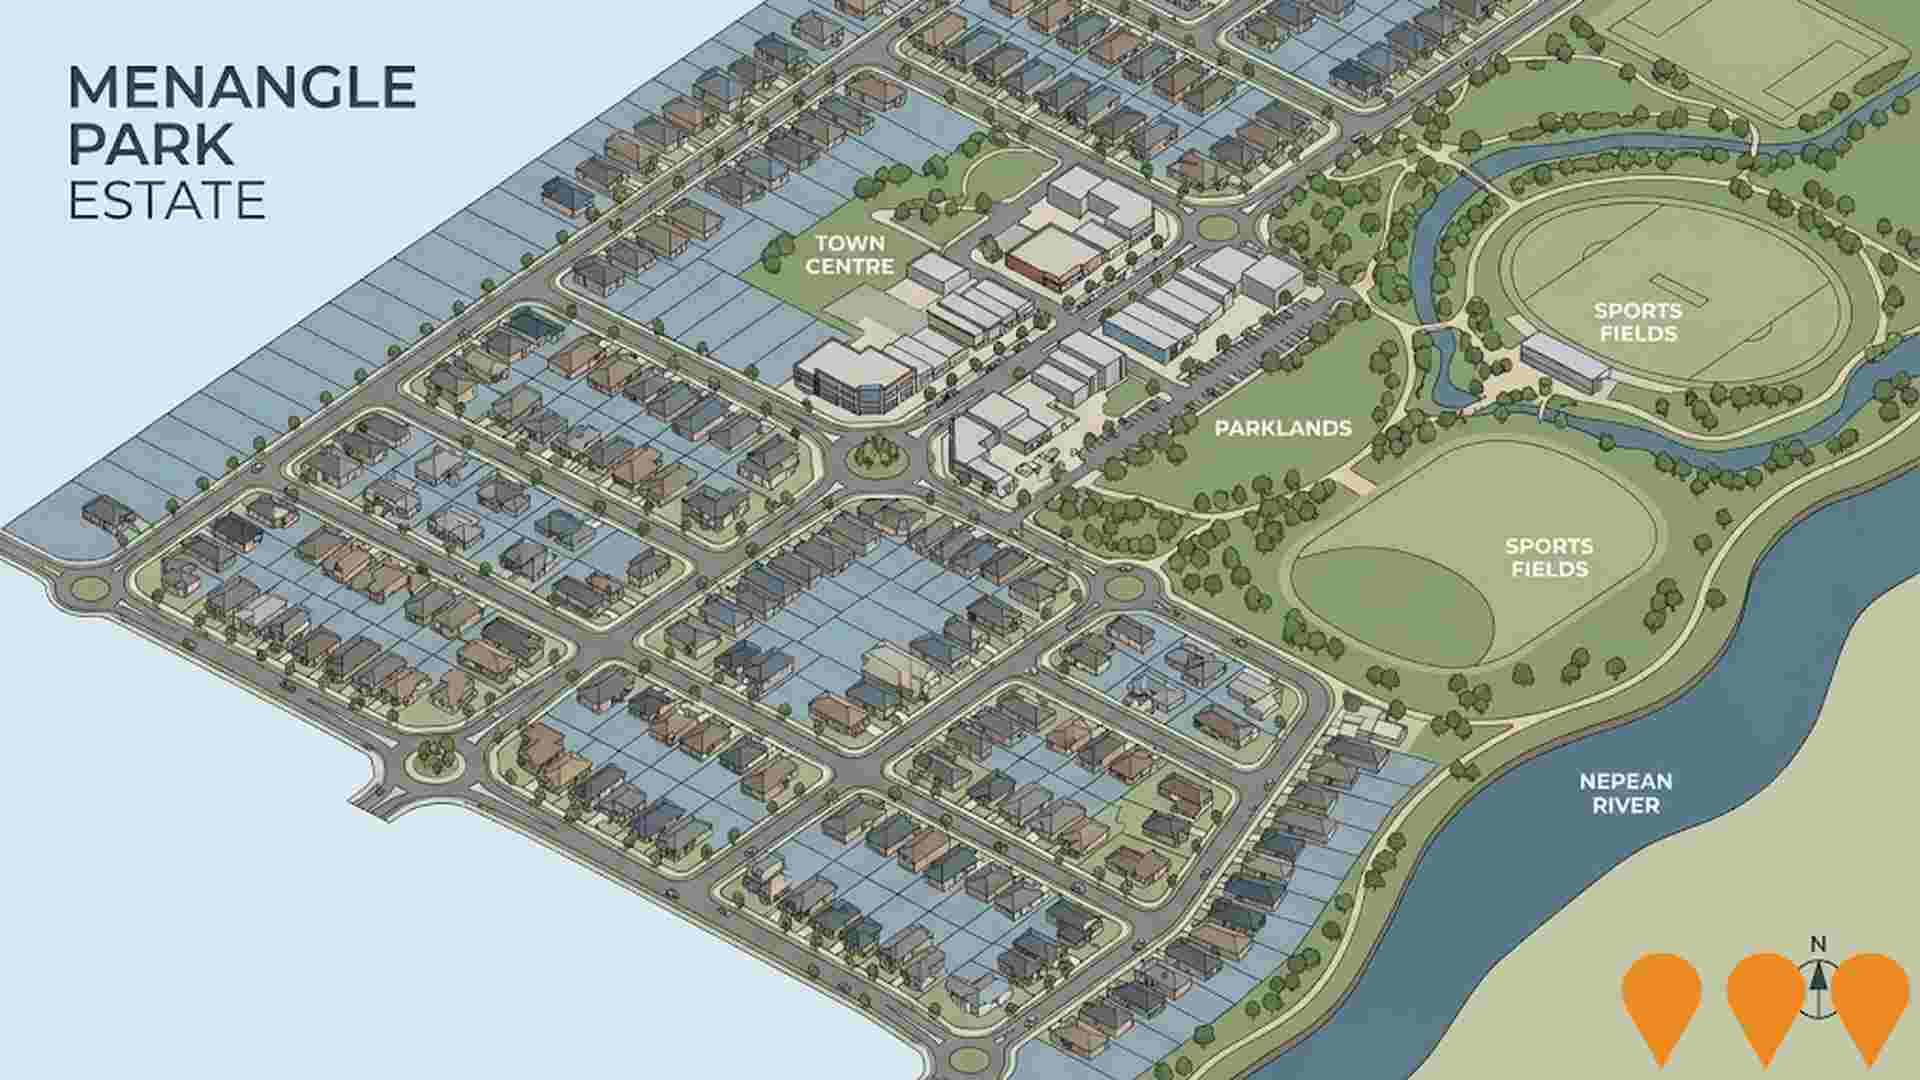
Prestigious master-planned urban village in Oran Park developed by Greenfields Development Company, featuring architecturally designed homes, townhomes, large lots, local retail, community parks, green spaces, and pedestrian pathways. Designed to offer a tranquil lifestyle with walkable access to amenities as part of the broader Oran Park Town masterplanned community.

Project Image

Employment

Table Chart PROFILE FAQ

AreaSearch analysis of employment trends sees Harrington Park performing better than 90% of local markets assessed across Australia

Harrington Park has a skilled workforce with the construction sector being particularly prominent. Its unemployment rate was 1.5% in June 2025.

Employment growth over the past year was estimated at 4.8%. As of June 2025, 7,253 residents were employed while the unemployment rate was 2.7% lower than Greater Sydney's rate of 4.2%. Workforce participation in Harrington Park was 71.0%, compared to Greater Sydney's 60.0%. The leading employment industries among residents include construction, health care & social assistance, and retail trade.

Construction had a notable concentration with employment levels at 1.5 times the regional average. Professional & technical services had limited presence with only 6.0% of employment compared to the regional average of 11.5%. The area appears to offer limited local employment opportunities as indicated by the count of Census working population versus resident population. Between June 2024 and June 2025, employment increased by 4.8% while labour force also increased by 4.8%, keeping the unemployment rate relatively stable at 1.5%. In comparison, Greater Sydney saw employment grow by 2.6%, labour force expand by 2.9%, and unemployment rise by 0.3 percentage points to 4.2%. State-level data from Sep-25 shows NSW employment contracted by 0.41% (losing 19,270 jobs), with the state unemployment rate at 4.3%. This compares favourably to the national unemployment rate of 4.5%, but lags behind the national employment growth of 0.26%. Jobs and Skills Australia's national employment forecasts from May 2025 suggest that Harrington Park's local employment may grow by approximately 6.2% over five years and 12.9% over ten years, based on a simple weighting extrapolation for illustrative purposes.

Frequently Asked Questions - Employment

What is the employment situation in Harrington Park?
As of June 2025, Harrington Park has approximately 7,253 employed residents with an unemployment rate of 1.5%. This very low unemployment rate indicates a tight labour market with strong demand for workers. The area ranks in the top 25% nationally for employment performance, indicating a robust job market.
How does Harrington Park's unemployment rate compare to the broader region?
As of June 2025, the unemployment rate in Harrington Park stands at 1.5%, which is 2.7 percentage points below Greater Sydney's rate of 4.2%. This lower unemployment rate suggests stronger local employment conditions. For comparison, the national unemployment rate is 4.1%.
What are the major employment sectors in Harrington Park?
The employment landscape in Harrington Park is dominated by several key sectors. The largest employers are construction (13.0% of employment), health care & social assistance (11.4%), and retail trade (11.1%). Other significant employers include education & training and manufacturing.
How has employment changed recently in Harrington Park?
Over the past year to June 2025, Harrington Park has experienced employment growth, with total employment increasing while the labour force increased. As a result, the unemployment rate has rise. By comparison, Greater Sydney saw employment increased and its unemployment rate rose.
What is the workforce participation rate in Harrington Park?
The workforce participation rate in Harrington Park is 71.0%, which represents the proportion of working-age residents who are either employed or actively seeking work. This high participation rate indicates strong workforce engagement and economic vitality. The local rate leading the Greater Sydney average of 60.0%, indicating stronger workforce attachment in the local area.
Which industries are over-represented in Harrington Park's employment market?
Harrington Park shows notable specialization in construction, which employs 13.0% of the local workforce compared to 8.6% regionally. This concentration suggests the area has developed competitive advantages in this sector.
What are the employment growth prospects for Harrington Park?
Based on Jobs and Skills Australia projections applied to Harrington Park's industry mix, employment is expected to grow by 6.2% over the next five years and 12.9% over ten years. This compares to national growth expectations of 6.6% over five years. Steady growth is anticipated across multiple sectors, providing diverse employment opportunities.
How does the job market in Harrington Park compare nationally?
Harrington Park's employment market shows strong performance nationally, ranking in the top 25% of areas assessed by AreaSearch. This indicates robust employment conditions and economic vitality compared to other regions. Recent job advertisement trends show the broader employment region saw a 13.1% decline, ranking 19.0th out of 37 regions nationally.
What employment opportunities exist for skilled workers in Harrington Park?
Skilled workers will find good opportunities in Harrington Park, with skilled sectors accounting for 34.1% of employment. Key sectors for skilled workers include health care & social assistance (11.4%), education & training (10.9%), and professional & technical (6.0%). With projected employment growth of 6.2% over five years, demand for skilled workers is expected to remain strong.

Income

Table Chart PROFILE FAQ

Income metrics indicate excellent economic conditions, with the area achieving higher performance than 75% of national locations assessed by AreaSearch

Harrington Park's income level is above the national average according to the latest ATO data aggregated by AreaSearch for financial year 2022. Harrington Park's median income among taxpayers was $59,590 and the average income stood at $71,131. This compares to figures for Greater Sydney of $56,994 and $80,856 respectively. Based on Wage Price Index growth of 10.6% since financial year 2022, current estimates would be approximately $65,907 (median) and $78,671 (average) as of March 2025. According to the 2021 Census, household incomes ranked exceptionally at the 96th percentile ($2,913 weekly). Income analysis revealed that 29.9% of the population (3,420 individuals) fell within the $4000+ income range, differing from patterns across the region where $1,500 - 2,999 dominated with 30.9%. A significant 48.6% earned above $3,000 weekly. Housing accounted for 14.8% of income while strong earnings ranked residents within the 96th percentile for disposable income and the area's SEIFA income ranking placed it in the 8th decile.

Frequently Asked Questions - Income

What is the median taxable income in Harrington Park?
Based on Wage Price Index adjustments to March 2025, the estimated median taxable income in Harrington Park is approximately $65,907. The official ATO data from FY-22 recorded a median of $59,590.
What is the average taxable income in Harrington Park?
Based on Wage Price Index adjustments to March 2025, the estimated average taxable income in Harrington Park is approximately $78,671. The official ATO data from FY-22 recorded an average of $71,131.
How does the median taxable income in Harrington Park compare to the region?
Based on Wage Price Index adjustments to March 2025, the estimated median taxable income in Harrington Park is approximately $65,907 compared to $63,035 in Greater Sydney. The official ATO data from FY-22 shows $59,590 and $56,994 respectively.
How does the average taxable income in Harrington Park compare to the region?
Based on Wage Price Index adjustments to March 2025, the estimated average taxable income in Harrington Park is approximately $78,671 compared to $89,427 in Greater Sydney. The official ATO data from FY-22 shows $71,131 and $80,856 respectively.
What are the main income cohorts in Harrington Park according to the 2021 Census?
As per the 2021 Census, the income bracket containing the largest proportion (~29.9% / 3,420 persons) of Harrington Park's population is the $4000+ cohort.
How do the main income cohorts in Harrington Park compare to the region?
The largest income cohort in Harrington Park is the $4000+ group, representing about 29.9% of the population. In comparison, Greater Sydney's largest income cohort is the $1,500 - 2,999 group, representing 30.9% of its population, according to the 2021 Census.
What is the median household income in Harrington Park according to the 2021 Census?
The 2021 Census data indicates that the median household income in Harrington Park is $2,913/wk.
What is the median family income in Harrington Park according to the 2021 Census?
According to the 2021 Census, the median family income in Harrington Park is $2,948/wk.
What is the median personal income in Harrington Park according to the 2021 Census?
The 2021 Census shows that the median personal income in Harrington Park is $974/wk.
How does Harrington Park's income rank nationally?
Harrington Park shows a median taxpayer income of $59,590 and an average of $71,131 according to the latest postcode level ATO data aggregated by AreaSearch for FY-22. This is above the national average, contrasting with Greater Sydney's median income of $56,994 and average income of $80,856. Based on Wage Price Index growth of 10.6% since FY-22, current estimates would be approximately $65,907 (median) and $78,671 (average) as of March 2025.
What is the disposable income in Harrington Park?
The estimated disposable income in Harrington Park is $10,761 per year according to AreaSearch analysis.
How does Harrington Park's disposable income compare to the region?
Harrington Park's disposable income is $10,761 compared to $7,412 for Greater Sydney, based on AreaSearch analysis.

Housing

Table Chart PROFILE FAQ

Harrington Park is characterized by a predominantly suburban housing profile, with above-average rates of outright home ownership

Harrington Park's dwellings were 98.3% houses and 1.7% other types at the latest Census. This compares to Sydney metro's 92.7% houses and 7.3% others. Home ownership in Harrington Park was 27.2%, with mortgaged dwellings at 58.8% and rented at 14.0%. The median monthly mortgage repayment in the area was $2,600, higher than Sydney metro's $2,383. Median weekly rent in Harrington Park was $550, compared to Sydney metro's $480. Nationally, Harrington Park's mortgage repayments were significantly higher at $2,600 versus Australia's average of $1,863, and rents were substantially above the national figure of $375.

Frequently Asked Questions - Housing

What percentage of homes are owned vs rented in Harrington Park?
In Harrington Park, 27.2% of homes are owned outright, 58.8% are owned with a mortgage, and 14.0% are rented.
What percentage of dwellings in Harrington Park are houses?
According to the latest data, 98.3% of dwellings in Harrington Park are houses.
What percentage of dwellings in Harrington Park are apartments or units?
In Harrington Park, 0.0% of dwellings are apartments or units, with an additional 1.7% being semi-detached dwellings.
What is the level of outright home ownership in Harrington Park?
Outright home ownership in Harrington Park stands at 27.2%, compared to 24.6% in Greater Sydney.
What is the median monthly mortgage repayment in Harrington Park?
The median monthly mortgage repayment in Harrington Park is $2,600, compared to $2,383 in Greater Sydney.
What is the median weekly rent in Harrington Park?
The median weekly rent in Harrington Park is $550, compared to $480 in Greater Sydney.
What is the distribution of rental prices in Harrington Park?
In Harrington Park, 0.0% of rentals are $0-149/week, 6.2% are $150-349/week, 74.1% are $350-649/week, 18.8% are $650-949/week, and 0.9% are $950+/week.
What is the average monthly housing cost in Harrington Park?
The aggregate monthly housing cost in Harrington Park is $1,862, which represents the average monthly cost across all housing types.
What percentage of income do residents spend on housing?
In Harrington Park, households with mortgages typically spend 20.6% of their income on mortgage repayments, while renters spend 18.9% of their income on rent.
How crowded are homes in Harrington Park?
The average persons per bedroom ratio in Harrington Park is 0.8, indicating the level of household density.
How does housing affordability in Harrington Park compare to the region?
Housing affordability in Harrington Park shows mortgage holders spending 20.6% of income on repayments (vs 23.6% regionally), while renters spend 18.9% of income on rent (vs 20.6% regionally).
What types of dwellings are most common in Harrington Park?
The dwelling mix in Harrington Park consists of 98.3% detached houses, 1.7% semi-detached dwellings, 0.0% apartments, and 0.0% other dwelling types.
What is the weighted average housing cost based on tenure mix in Harrington Park?
Factoring in the ownership distribution, the weighted average monthly housing cost is approximately $1,862. This accounts for outright owners paying no housing costs, mortgage holders paying $2,600.0/month, and renters paying $2,382/month.
How affordable is housing in Harrington Park relative to local incomes?
Housing in Harrington Park consumes approximately 14.8% of median household income ($12,613 monthly), indicating costs are highly affordable. The generally accepted benchmark is that housing should not exceed 30% of household income.
How do proposed developments compare to existing housing types in Harrington Park?
Recent development applications in Harrington Park show attached dwellings contributing 14% of approvals compared to 2% of existing stock, while detached houses represent 86% of applications versus 98% of current dwellings. This suggests increasing densification. Density increases remain below national trends.

Household Composition

Table Chart PROFILE FAQ

Harrington Park features high concentrations of family households, with a higher-than-average median household size

Family households comprise 89.6% of all households, including 58.9% couples with children, 20.4% couples without children, and 9.3% single parent families. Non-family households account for the remaining 10.4%, with lone person households at 9.3% and group households making up 1.1%. The median household size is 3.4 people, larger than the Greater Sydney average of 3.0.

Frequently Asked Questions - Households

How many households are in Harrington Park?
As of the 2021 Census, Harrington Park had 3,228 households. Based on population growth patterns, this has grown by approximately 1.8% to an estimated 3,285 households today.
What is the typical household size?
The median household size in Harrington Park is 3.4 people. This compares to 3.0 in Greater Sydney and reflects the area's household composition mix.
What types of households are most common?
Family households dominate at 89.6% of all households. The remaining households consist of lone person households (9.3%), group households (1.1%), and other household types (0.0%).
How are families structured in the area?
Among the 2,892 family households, 58.9% are couples with children, 20.4% are couples without children at home, and 9.3% are single parent families. This mix shapes local demand for schools, family services, and housing types.
How does Harrington Park compare to regional household patterns?
Compared to Greater Sydney, Harrington Park shows distinct household patterns. Family households are notably over-represented at 89.6% (versus 83.2% regionally). Conversely, lone person households are under-represented at 9.3% compared to the regional 15.2%. This family-oriented profile influences local demand for family homes, schools, and children's services.
What is the average family size?
Families in Harrington Park have an average of 1.7 children, matching the Greater Sydney average of 1.7. This influences local demand for child-related services and larger family homes.
What are the marriage patterns in Harrington Park?
Marriage patterns reveal 57.2% of the adult population are currently married, while 31.6% have never married. This compares to 51.7% married and 33.2% never married across Greater Sydney.
How significant are single-person households?
Single-person households represent 9.3% of all households in Harrington Park, notably lower than the regional average of 15.2%. This affects demand for smaller dwellings and single-person accommodation.
Are shared living arrangements common?
Group households (unrelated people sharing) account for 1.1% of households, well below the Greater Sydney average of 1.5%. This low rate suggests limited student or young professional shared accommodation.
Loading household composition data...

Local Schools & Education

Table Chart PROFILE FAQ

The educational profile of Harrington Park exceeds national averages, with above-average qualification levels and academic performance metrics

The area faces educational challenges, with university qualification rates at 22.1%, significantly lower than the Greater Sydney average of 38.0%. This presents both a challenge and an opportunity for targeted educational initiatives. Bachelor degrees are the most common, at 14.7%, followed by postgraduate qualifications (5.4%) and graduate diplomas (2.0%). Trade and technical skills are prominent, with 37.8% of residents aged 15+ holding vocational credentials - advanced diplomas (12.6%) and certificates (25.2%).

Educational participation is high, with 33.9% of residents currently enrolled in formal education, including 12.1% in primary, 10.7% in secondary, and 4.8% in tertiary education. Harrington Park Public School serves the local area, with an enrollment of 673 students as of a recent report. The school demonstrates typical Australian school conditions (ICSEA: 1033) and offers balanced educational opportunities, focusing exclusively on primary education. Secondary options are available in surrounding areas due to limited local school capacity (5.9 places per 100 residents compared to the regional average of 16.9), leading many families to travel for schooling.

Frequently Asked Questions - Education

What percentage of people in Harrington Park have university qualifications?
22.1% of people aged 15 and over in Harrington Park have university qualifications, compared to 21.1% in the broader region.
What percentage of people in Harrington Park have no formal qualifications?
40.2% of people aged 15 and over in Harrington Park have no formal qualifications, compared to 39.0% regionally.
How does Harrington Park's education level compare to national averages?
Harrington Park ranks in the 62th percentile nationally for education based on AreaSearch's analysis of qualification and performance metrics.
What types of qualifications are most common in Harrington Park?
The most common qualifications in Harrington Park are: Certificate (25.2%), Bachelor Degree (14.7%), Advanced Diploma (12.6%).
What proportion of Harrington Park's population is currently attending educational institutions?
33.9% of the population in Harrington Park is currently engaged in formal education, with 12.1% in primary school, 10.7% in secondary school, 4.8% at university.
What is the ICSEA score for schools in Harrington Park?
The average ICSEA (Index of Community Socio-Educational Advantage) score for schools in Harrington Park is 1033, indicating average socio-educational advantage (national average is 1000).
How many schools are located within Harrington Park?
There are 1 schools within Harrington Park, with a combined enrollment of approximately 673 students.
What types of schools are available in Harrington Park?
Harrington Park includes 1 primary school.

Schools Detail

Nearby Services & Amenities

PROFILE FAQ

Transport

Table Chart PROFILE FAQ

Transport servicing is moderate compared to other areas nationally based on assessment of service frequency, route connectivity and accessibility

Transport analysis shows 44 active stops operating in Harrington Park, served by buses. These stops are covered by 76 routes, offering 2,603 weekly passenger trips. Transport access is rated good, with residents typically located 238 meters from the nearest stop.

Service frequency averages 371 trips per day across all routes, equating to approximately 59 weekly trips per individual stop.

Frequently Asked Questions - Transport

How many public transport stops are in Harrington Park?
There are 44 public transport stops within Harrington Park.
How frequent are the transport services in Harrington Park?
Harrington Park has 2,603 weekly trips across 76 routes, averaging 371 trips per day.
How far are residents from public transport in Harrington Park?
On average, residential properties are 238 meters from the nearest transport stop.

Transport Stops Detail

Health

Table Chart PROFILE FAQ

Harrington Park's residents boast exceedingly positive health performance metrics with younger cohorts in particular seeing very low prevalence of common health conditions

Harrington Park's health outcomes show exceptional results, particularly for younger age groups with low prevalence of common health issues.

Approximately 65% of its total population (~6,292 people) have private health cover, indicating a high rate. The most prevalent medical conditions are asthma (7.0%) and arthritis (6.2%). Notably, 74.9% of residents report no medical ailments, higher than Greater Sydney's 71.6%. Harrington Park has fewer seniors, with 11.4% aged 65 or over (1,309 people), compared to Greater Sydney's 12.9%. However, health outcomes among the elderly require more focus due to these challenges.

Frequently Asked Questions - Health

How many people in Harrington Park have private health insurance?
Around 55.0% of people in Harrington Park are covered by private health insurance, which compares to 55.2% in the broader region of Greater Sydney.
What percentage of the population requires ongoing medical assistance in Harrington Park?
In Harrington Park, 4.0% of the population is identified as requiring ongoing medical assistance. This figure is slightly different from the regional average, where 5.2% of people in Greater Sydney require similar assistance.
How prevalent is asthma in Harrington Park?
7.0% of people in Harrington Park are diagnosed with asthma. In comparison, 7.8% of the population across Greater Sydney is affected by asthma.
What percentage of people have diabetes in Harrington Park?
Diabetes affects 4.2% of the Harrington Park population, while in the surrounding region, 4.0% of people are diagnosed with diabetes.
What is the percentage of people with heart disease in Harrington Park?
2.6% of people in Harrington Park have heart disease. Across the region of Greater Sydney, 3.1% of the population is affected by heart disease.
How does Harrington Park compare to the region in terms of overall private health coverage?
In Harrington Park, 55.0% of the population are estimated to have private health insurance. Comparatively, Greater Sydney sees an estimated private health coverage rate of 55.2%.

Cultural Diversity

Table Chart PROFILE FAQ

The level of cultural diversity witnessed in Harrington Park was found to be above average when compared nationally for a number of language and cultural background related metrics

Harrington Park, when assessed for cultural diversity in the year 2021, showed above average figures with 20.6% of its residents born overseas and 18.5% using a language other than English at home. Christianity was found to be the predominant religion, accounting for 69.5% of the population, compared to 64.3% in Greater Sydney overall. Regarding ancestry, Australians made up 24.2%, English 22.6%, and Other groups 10.5%.

Notable differences were observed in the representation of certain ethnicities: Croatian at 1.7% (vs regional 0.9%), Maltese at 2.2% (vs 1.8%), and Serbian at 0.8% (vs 0.5%).

Frequently Asked Questions - Diversity

What is the level of cultural diversity in Harrington Park?
Harrington Park was found to be above average in terms of cultural diversity, with 20.6% of its population born overseas and 18.5% speaking a language other than English at home.
What is the most common religion in Harrington Park?
The main religion in Harrington Park was found to be Christianity, which makes up 69.5% of people in Harrington Park. This compares to 64.3% across Greater Sydney.
What are the top countries of origin in Harrington Park?
In terms of ancestry (country of birth of parents), the top three represented groups in Harrington Park are Australian, comprising 24.2% of the population, English, comprising 22.6% of the population, and Other, comprising 10.5% of the population. Additionally, there are notable divergences in the representation of certain other ethnic groups: Croatian is notably overrepresented at 1.7% of Harrington Park (vs 0.9% regionally), Maltese at 2.2% (vs 1.8%) and Serbian at 0.8% (vs 0.5%).
How does the percentage of people born overseas compare to the regional average?
20.6% of the Harrington Park population was born overseas, compared to 17.3% regionally.
What percentage of the Harrington Park population speaks a language other than English at home?
18.5% of the population in Harrington Park speaks a language other than English at home, compared to 13.2% in the wider region.
How many people in Harrington Park identify as Australian Aboriginal?
2.0% of the Harrington Park population identifies as Australian Aboriginal, compared to 2.6% in the region.
What is the citizenship status of the population in Harrington Park?
92.9% of the Harrington Park population holds citizenship, compared to 92.6% in the wider region.

Age

Table Chart PROFILE FAQ

Harrington Park's population is slightly younger than the national pattern

Harrington Park's median age is nearly 36 years, closely matching Greater Sydney's average of 37 years, which is slightly below Australia's median age of 38. Compared to Greater Sydney, Harrington Park has a higher proportion of residents aged 15-24 (18.0%), but fewer residents aged 25-34 (8.6%). This concentration of 15-24 year-olds is significantly higher than the national average of 12.5%. Between the 2021 Census and now, the proportion of residents aged 15 to 24 has increased from 16.0% to 18.0%, while the proportion of those aged 65 to 74 has risen from 6.0% to 7.1%. Conversely, the proportions of residents aged 5-14 and 35-44 have decreased, from 17.5% to 15.6% and from 14.6% to 13.1%, respectively. By 2041, demographic modeling suggests Harrington Park's age profile will change significantly. The 65 to 74 age group is projected to grow by 74%, adding 599 residents to reach a total of 1,407. Residents aged 65 and above are expected to drive 81% of population growth, highlighting the trend of demographic aging. Meanwhile, the 35-44 and 0-4 age groups are projected to experience population declines.

Frequently Asked Questions - Age

What is the median age in Harrington Park?
According to the latest data, the median age in Harrington Park is 36 years.
How does Harrington Park's median age compare to broader areas?
At 36 years, Harrington Park is comparable to the Greater Sydney average (37 years) and 2 years younger than the national average (38 years).
What age groups are over-represented in Harrington Park?
The most over-represented age group in Harrington Park compared to the Greater Sydney region is the 15 - 24 group, making up 18.0% of the population.
What age groups are under-represented in Harrington Park?
The most under-represented age group in Harrington Park compared to the Greater Sydney region is the 25 - 34 group, making up 8.6% of the population.
Are there age groups with notable population variances?
Yes, certain age groups in Harrington Park show significant variance compared to the Greater Sydney region. The most over-represented age groups are 45-54 year-olds (17.1% vs 12.2%) and 15-24 year-olds (18.0% vs 13.0%). The most under-represented age groups are 85+ year-olds (1.0% vs 2.0%) and 25-34 year-olds (8.6% vs 15.9%).
What is the percentage of children (0-14 years) in Harrington Park?
The percentage of children aged 0-14 years in Harrington Park is 21.1%.
What is the percentage of older people (65+ years) in Harrington Park?
The percentage of people aged 65 and over in Harrington Park is 11.4%.

Nearby Areas