Chart Color Schemes
This analysis uses ABS Statistical Areas Level 2 (SA2) boundaries, which can materially differ from Suburbs and Localities (SAL) even when sharing similar names.
SA2 boundaries are defined by the Australian Bureau of Statistics and are designed to represent communities for statistical reporting (e.g., census and ERP).
Suburbs and Localities (SAL) represent commonly-used suburb/locality names (postal-style areas) and may use different geographic boundaries. For comprehensive analysis, consider reviewing both boundary types if available.
est. as @ -- *
ABS ERP | -- people | --
2021 Census | -- people
Sales Activity
Curious about local property values? Filter the chart to assess the volume and appreciation (including resales) trends and regional comparisons, or scroll to the map below view this information at an individual property level.
Find a Recent Sale
Sales Detail
Population
An assessment of population growth drivers in Tanunda reveals an overall ranking slightly below national averages considering recent, and medium term trends
Tanunda's population was around 4,977 as of November 2025. This figure reflects an increase of 311 people since the 2021 Census, which reported a population of 4,666 people. The change is inferred from the estimated resident population of 4,743 in June 2024 and an additional 133 validated new addresses since the Census date. This results in a density ratio of 287 persons per square kilometer. Tanunda's growth rate of 6.7% since the census is close to that of non-metro areas (6.8%), indicating competitive growth fundamentals. Overseas migration contributed approximately 65.8% of overall population gains during recent periods.
AreaSearch uses ABS/Geoscience Australia projections for each SA2 area, released in 2024 with a base year of 2022. For areas not covered by this data and years post-2032, the SA State Government's Regional/LGA projections are adopted, based on 2021 data and adjusted using weighted aggregation methods. Based on demographic trends, Australia's regional areas are projected to have above median population growth. Tanunda is expected to grow by 745 persons to 2041, reflecting a total gain of 10.3% over the 17 years.
Frequently Asked Questions - Population
Development
AreaSearch analysis of residential development drivers sees Tanunda recording a relatively average level of approval activity when compared to local markets analysed countrywide
Tanunda averaged approximately 31 new dwelling approvals annually over the past five financial years, totalling 159 homes. As of FY-26 so far, 35 approvals have been recorded. The population decline in recent years has not affected housing supply adequacy relative to demand, maintaining a balanced market with good buyer choice. New homes are being constructed at an average value of $322,000.
This year, $8.5 million in commercial approvals have been registered, indicating the area's residential character. Compared to the rest of South Australia, Tanunda has similar development levels per person, supporting market stability aligned with regional patterns. All recent developments have consisted of standalone homes, preserving the area's traditional low-density character focused on family homes appealing to those seeking space.
The location currently has approximately 166 people per dwelling approval, suggesting an expanding market. According to AreaSearch's latest quarterly estimate, Tanunda is projected to grow by 511 residents by 2041. With current construction levels, housing supply should meet demand adequately, creating favourable conditions for buyers while potentially enabling growth that exceeds current forecasts.
Frequently Asked Questions - Development
Infrastructure
Tanunda has limited levels of nearby infrastructure activity, ranking in the 9thth percentile nationally
The performance of a region is significantly influenced by changes in local infrastructure projects and planning initiatives. AreaSearch has identified eight projects that are expected to impact this area. Notable projects include the Barossa Growth and Infrastructure Investment Strategy, La Vida Homes' development at Gembrook Estate Tanunda, the New Water Infrastructure project for Barossa (Barossa New Water), and Sovereign Estate. The following list outlines those projects deemed most relevant:.
Professional plan users can use the search below to filter and access additional projects.
INFRASTRUCTURE SEARCH
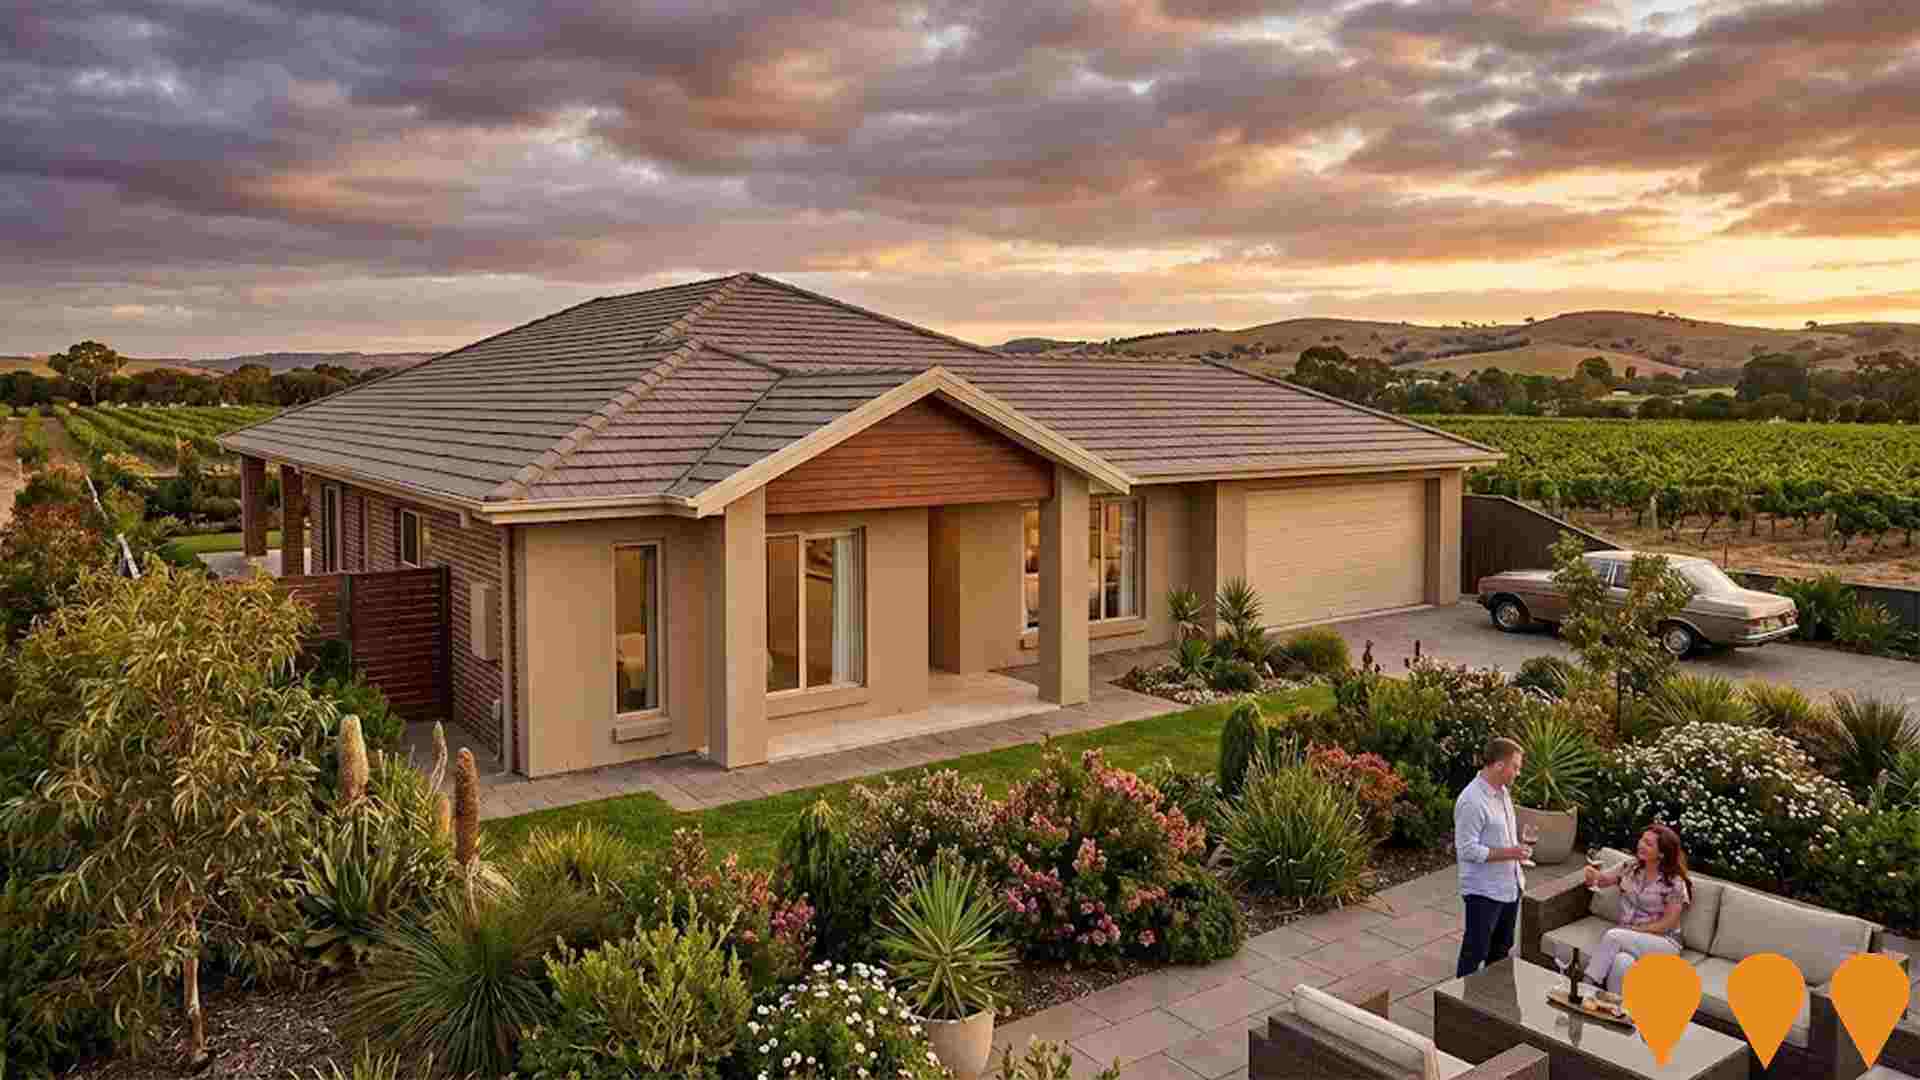
 Denotes AI-based impression for illustrative purposes only, not to be taken as definitive under any circumstances. Please follow links and conduct other investigations from the project's source for actual imagery. Developers and project owners wishing us to use original imagery please Contact Us and we will do so.
Frequently Asked Questions - Infrastructure
Barossa Growth and Infrastructure Investment Strategy
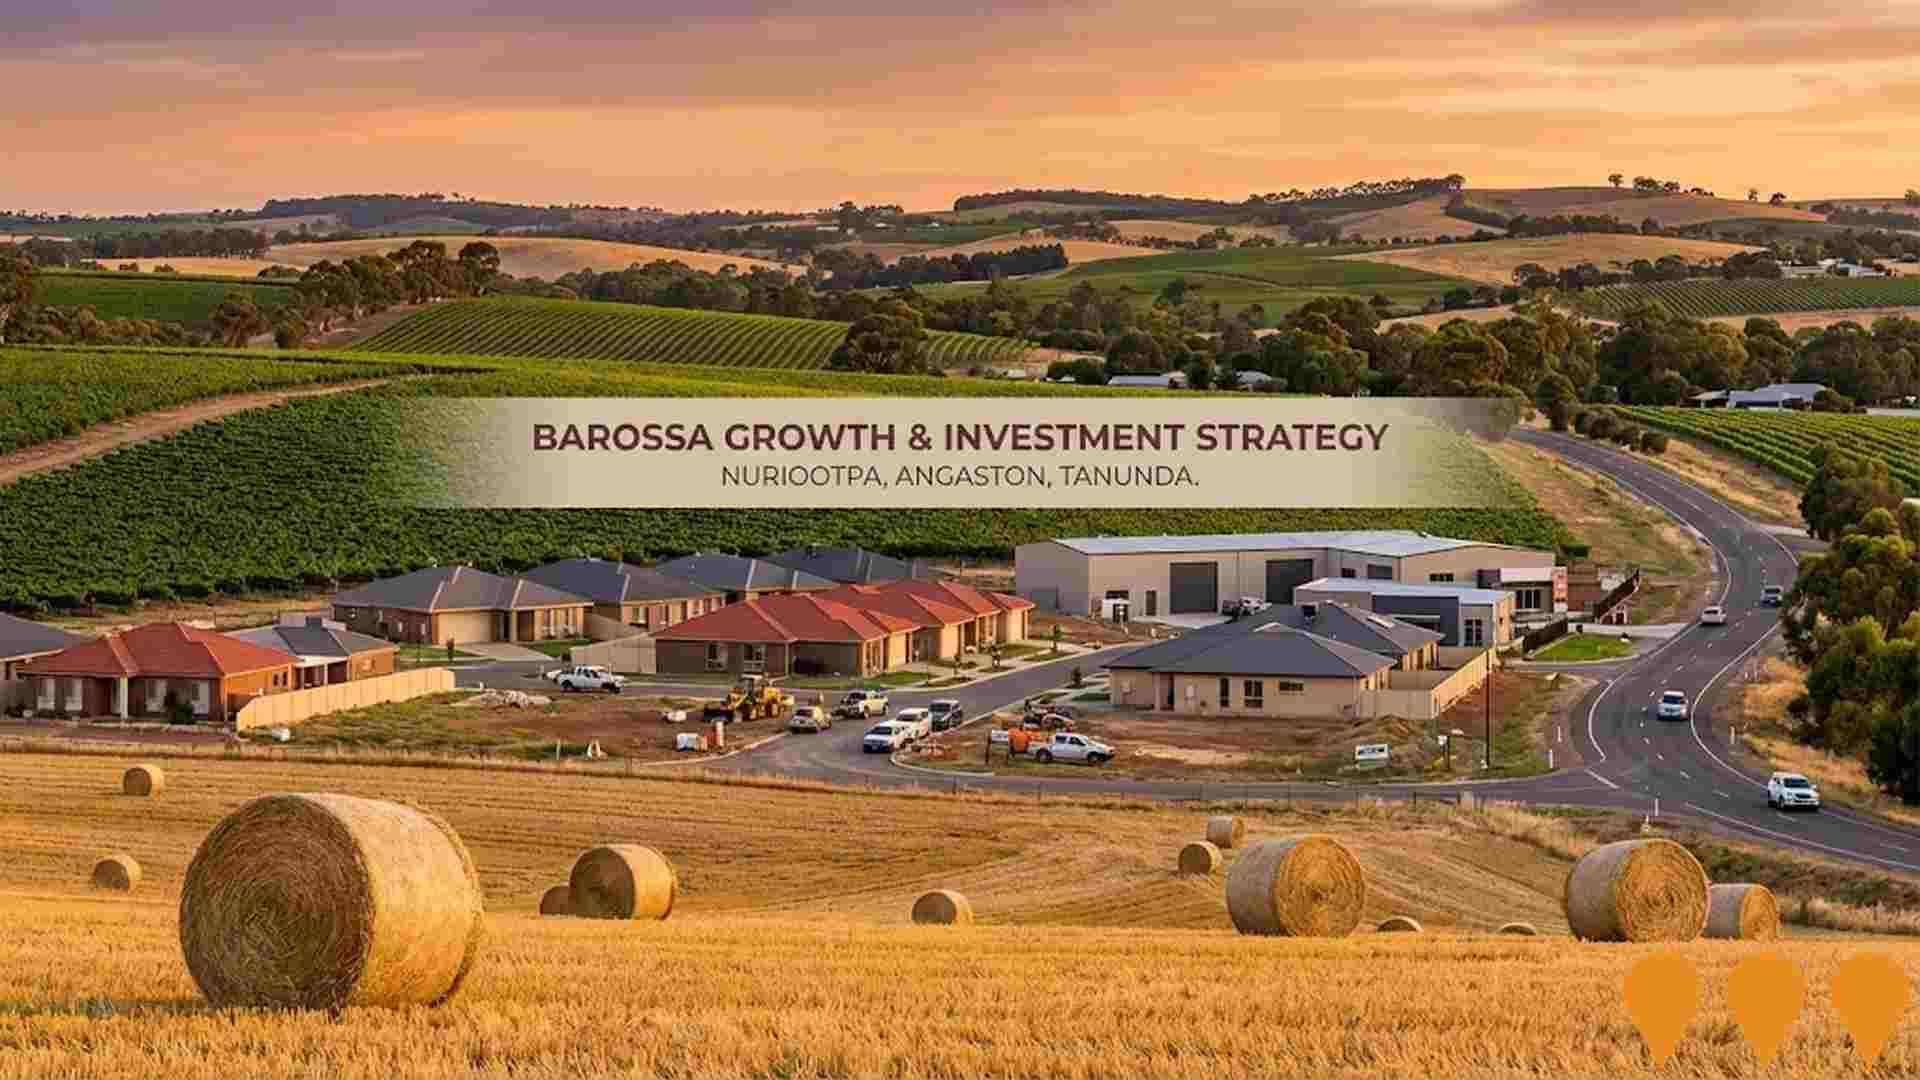
A strategic plan by The Barossa Council to guide future growth and investment in the Barossa region. It includes proposals for new employment land at Nuriootpa, residential infill in Nuriootpa, Angaston, and Tanunda, and further investigation into tourism development rezoning at Kroemer Crossing.
Tanunda Recreation Park Redevelopment
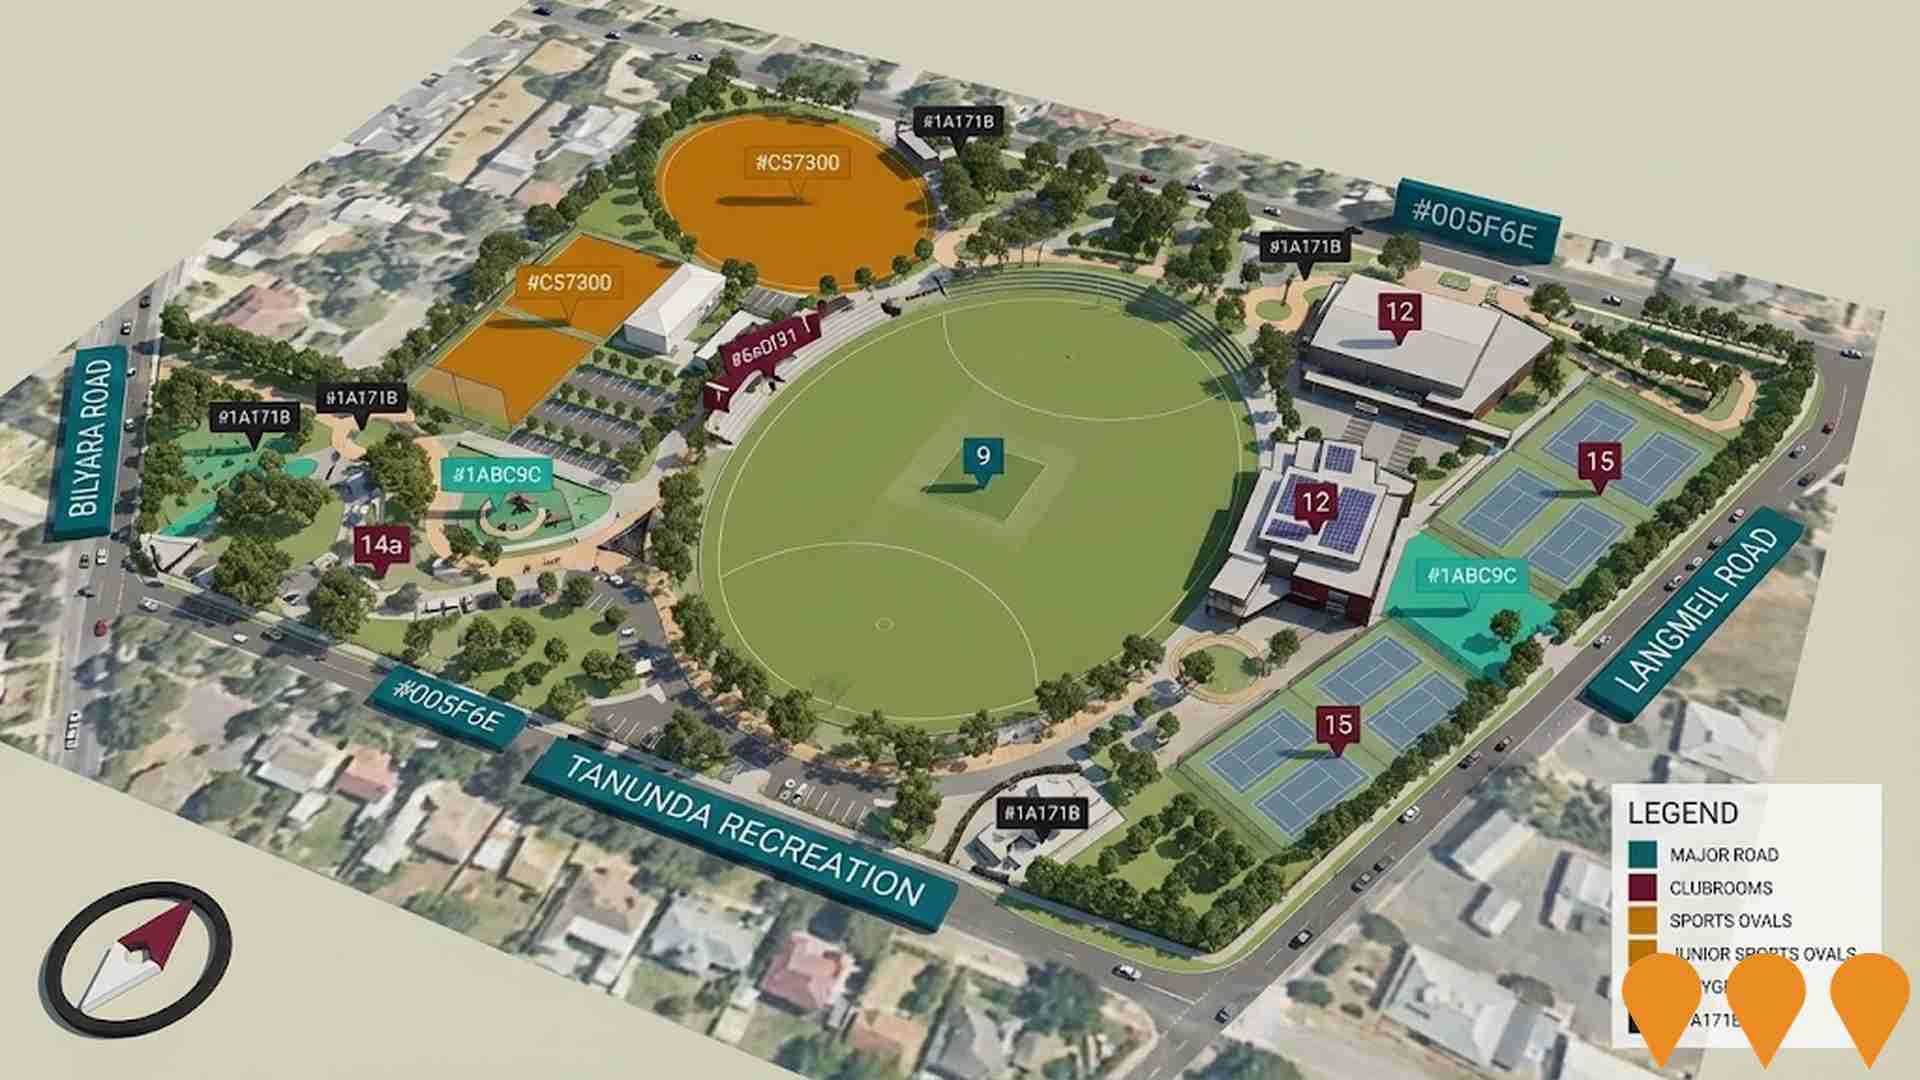
Comprehensive redevelopment of Tanunda Recreation Park completed in March 2024 as part of The Big Project. The $10.6 million precinct redevelopment includes new 300-seat multi-purpose clubrooms with bar and spectator viewing, six gender-neutral changerooms, junior sports oval, cricket training nets, inclusive playground, LED sports lighting, widened main oval with improved playing surface, and extensive landscaping. Winner of the 2024 SANFL Football Facility of the Year award, the facility serves as a regional-level venue for football, cricket, netball, tennis and community events. The park hosted the 2024 Barossa, Light and Gawler Football and Netball grand finals and will host the 2025 Australian Country Cricket Championships.
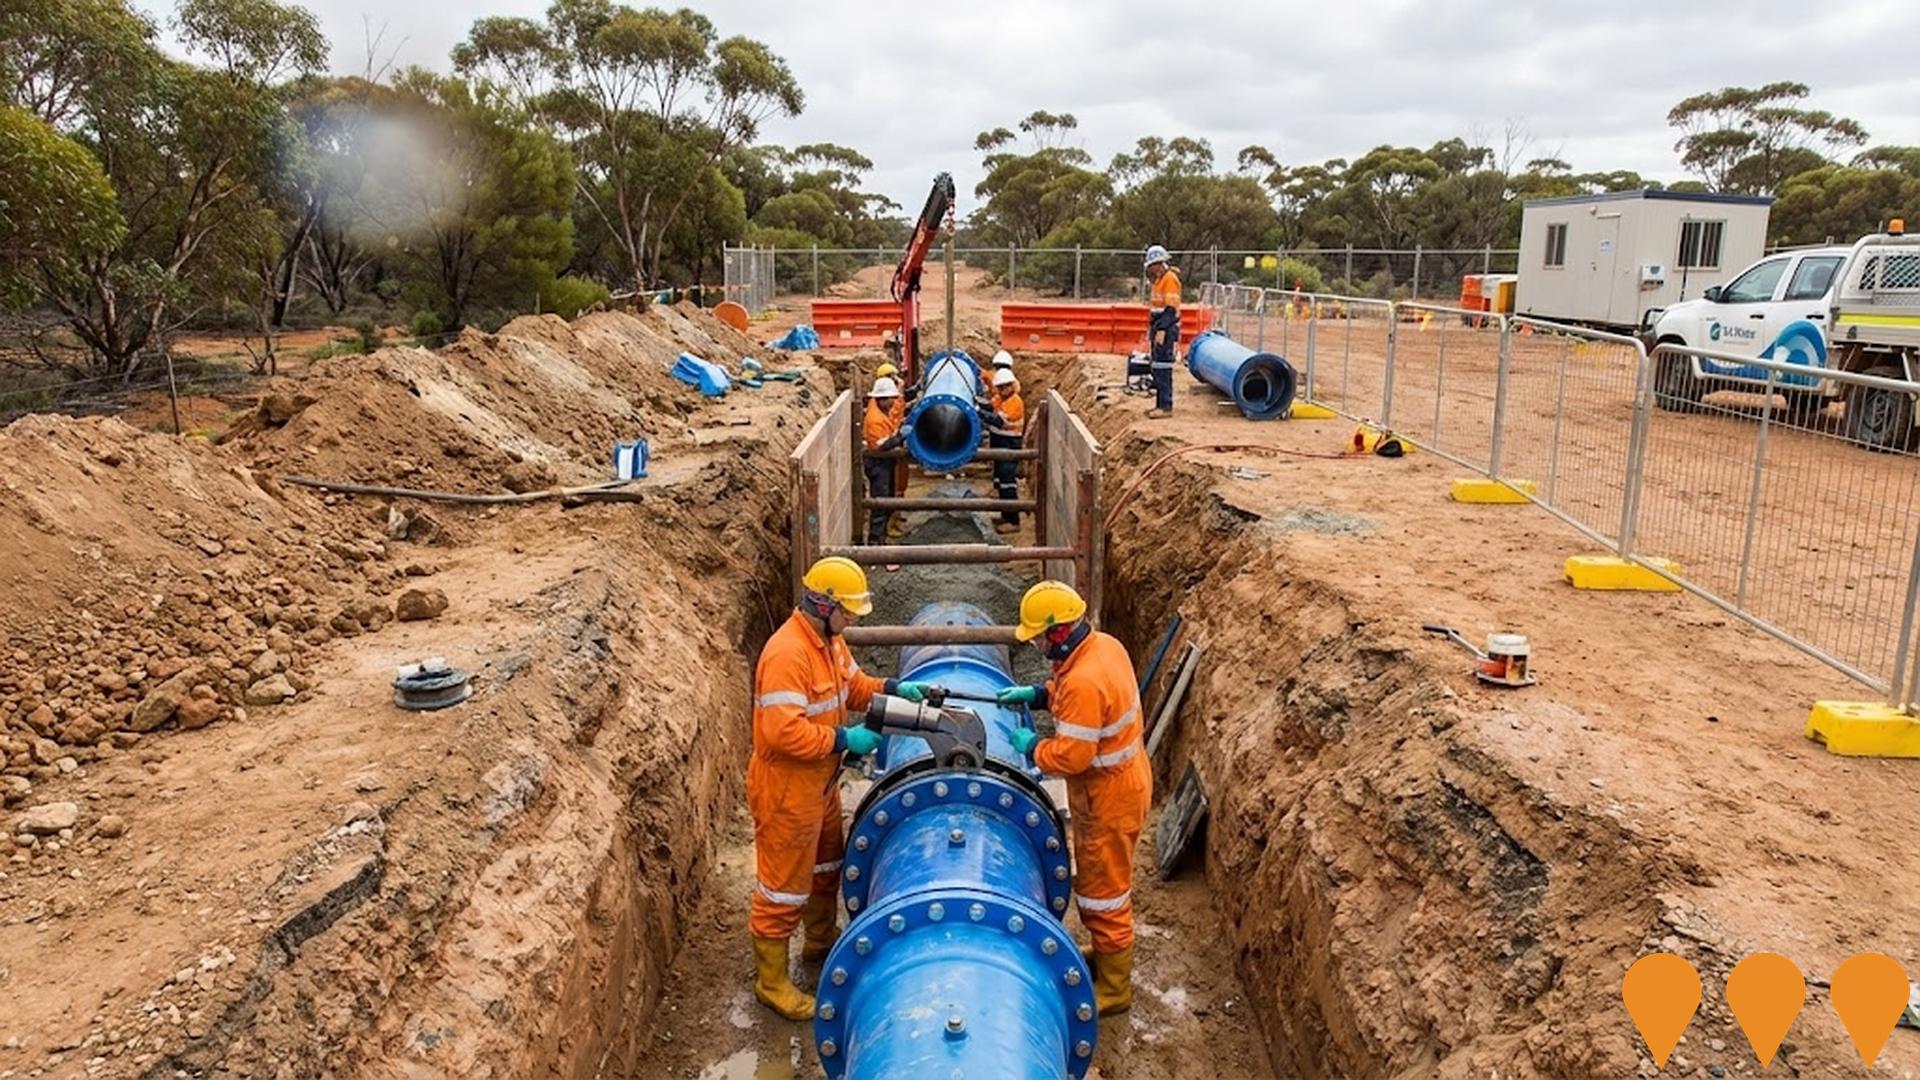
New Water Infrastructure to Barossa (Barossa New Water)
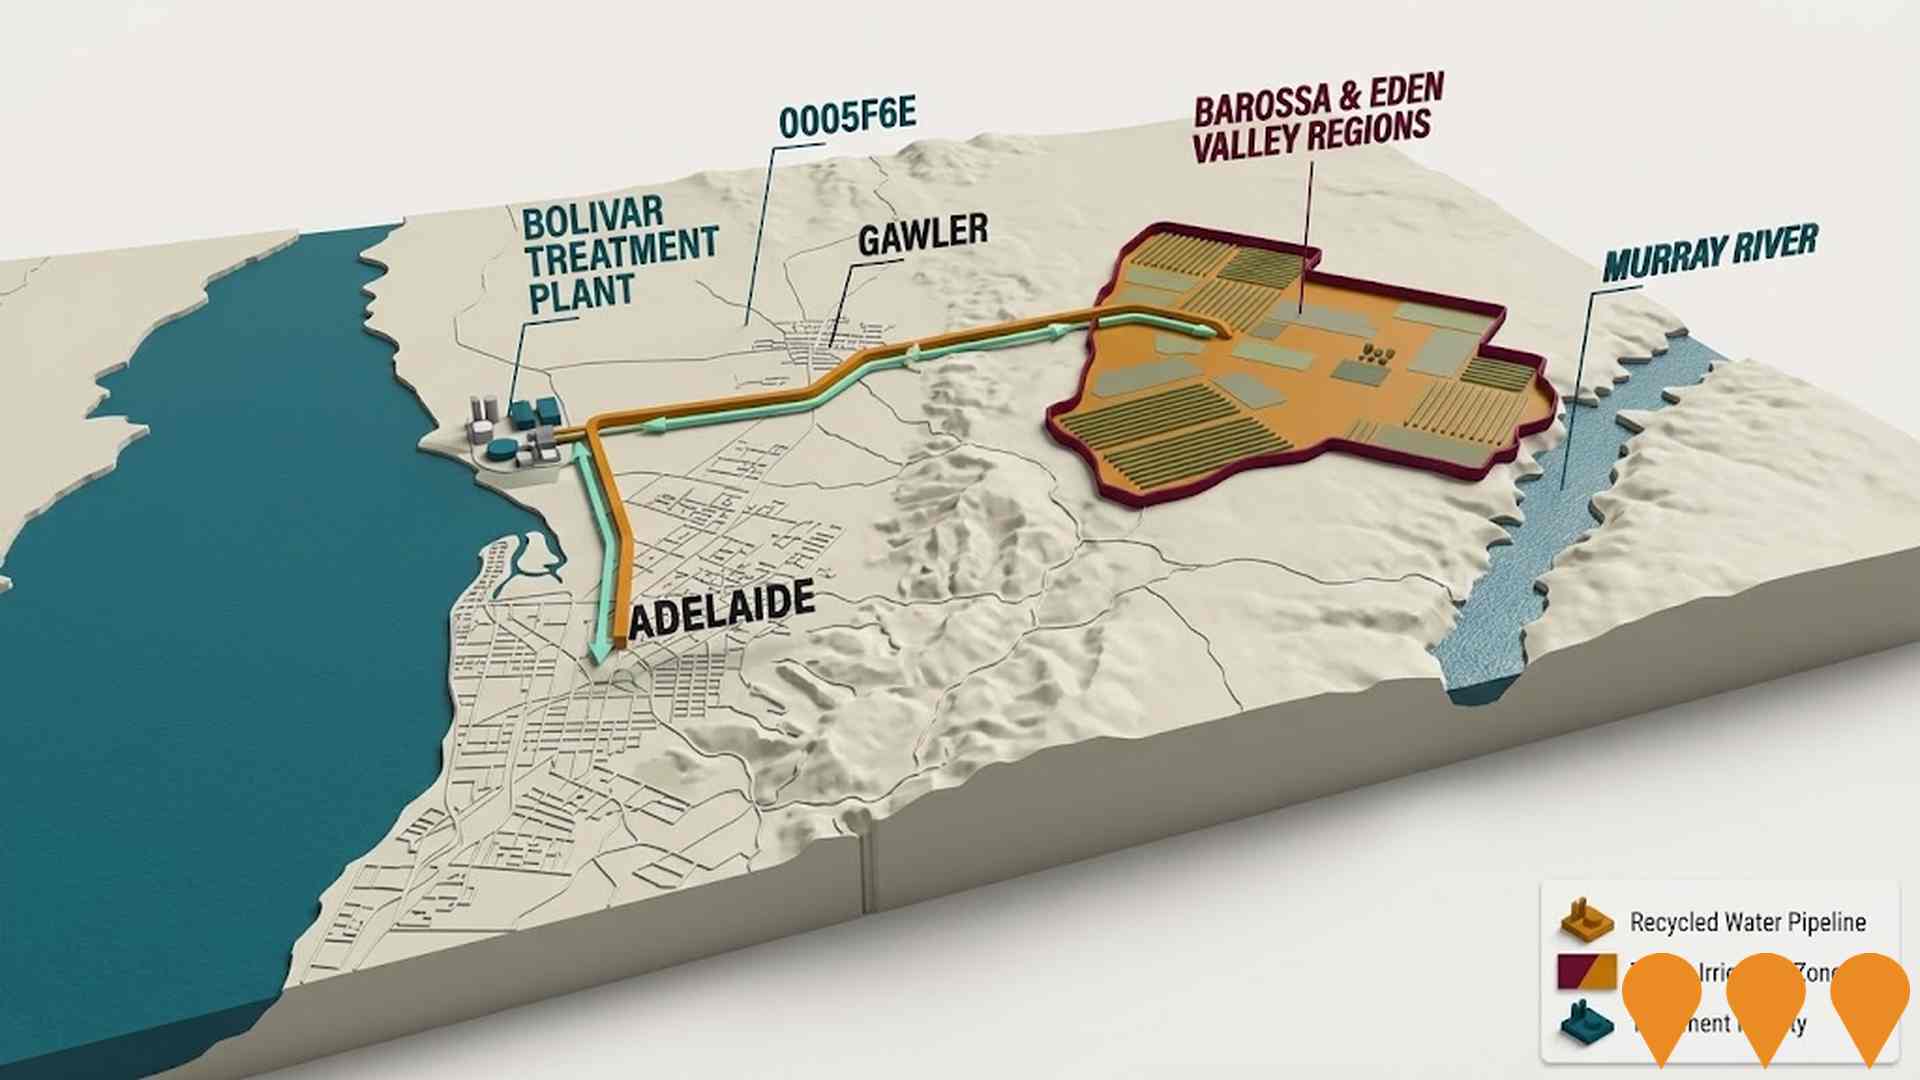
Program investigating delivery of up to ~13 GL per year of climate independent recycled water from the Bolivar Wastewater Treatment Plant to Barossa and Eden Valleys to improve water security for viticulture and agriculture. The detailed business case (completed Nov 2022) identified a preferred option using a direct pipeline from Bolivar and set up further work on affordability, demand commitments and governance. Since Oct 2023 the SA Government, Barossa Infrastructure Limited and Barossa Australia have been progressing a new direction focused on confirming demand volumes (including substitution of River Murray water) and exploring short term solutions for Eden Valley.
Kroemer Crossing Roundabout Upgrade
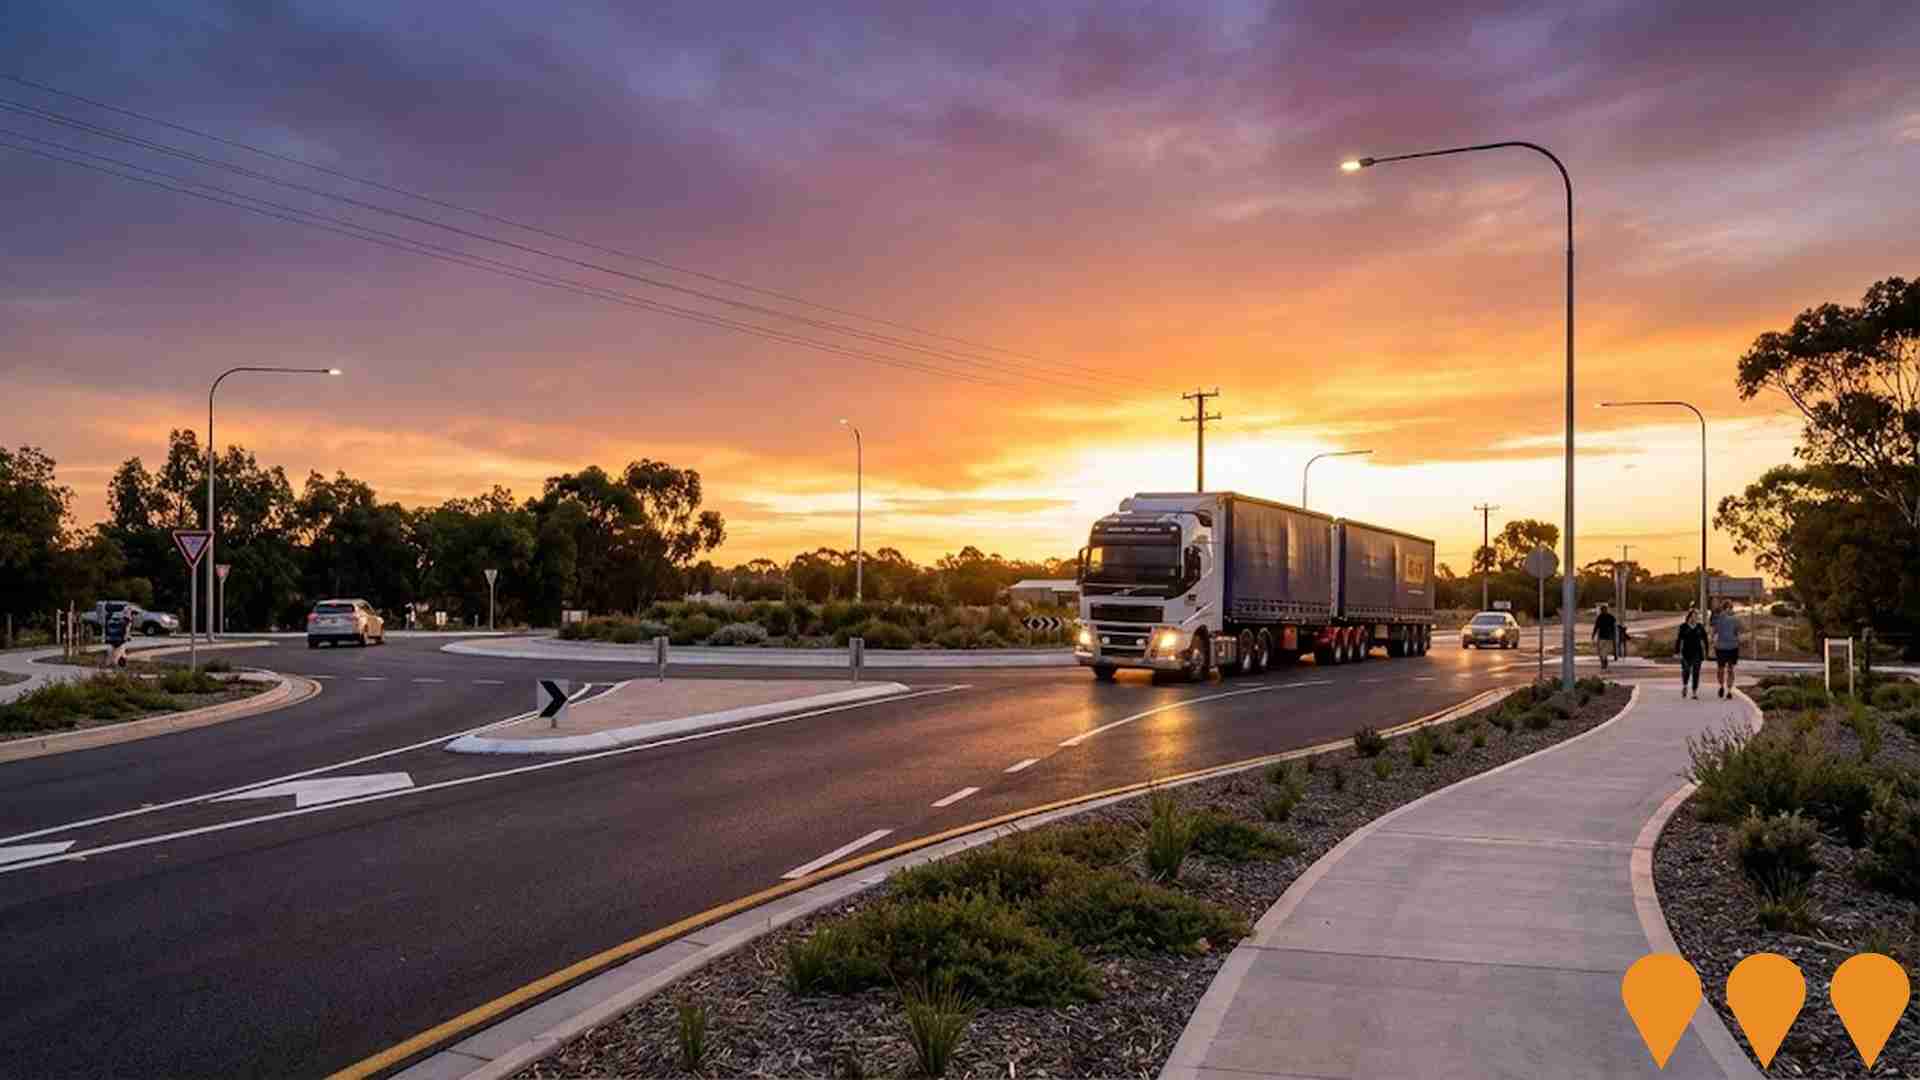
Improvement of safety and access at Kroemer's Crossing, Tanunda, by installing a roundabout to improve safety for all road users and allow greater freight access to surrounding businesses. This $6 million project was funded by the Australian and South Australian Governments, The Barossa Council, and Pernod Ricard Winemakers Pty Ltd.
EnergyConnect
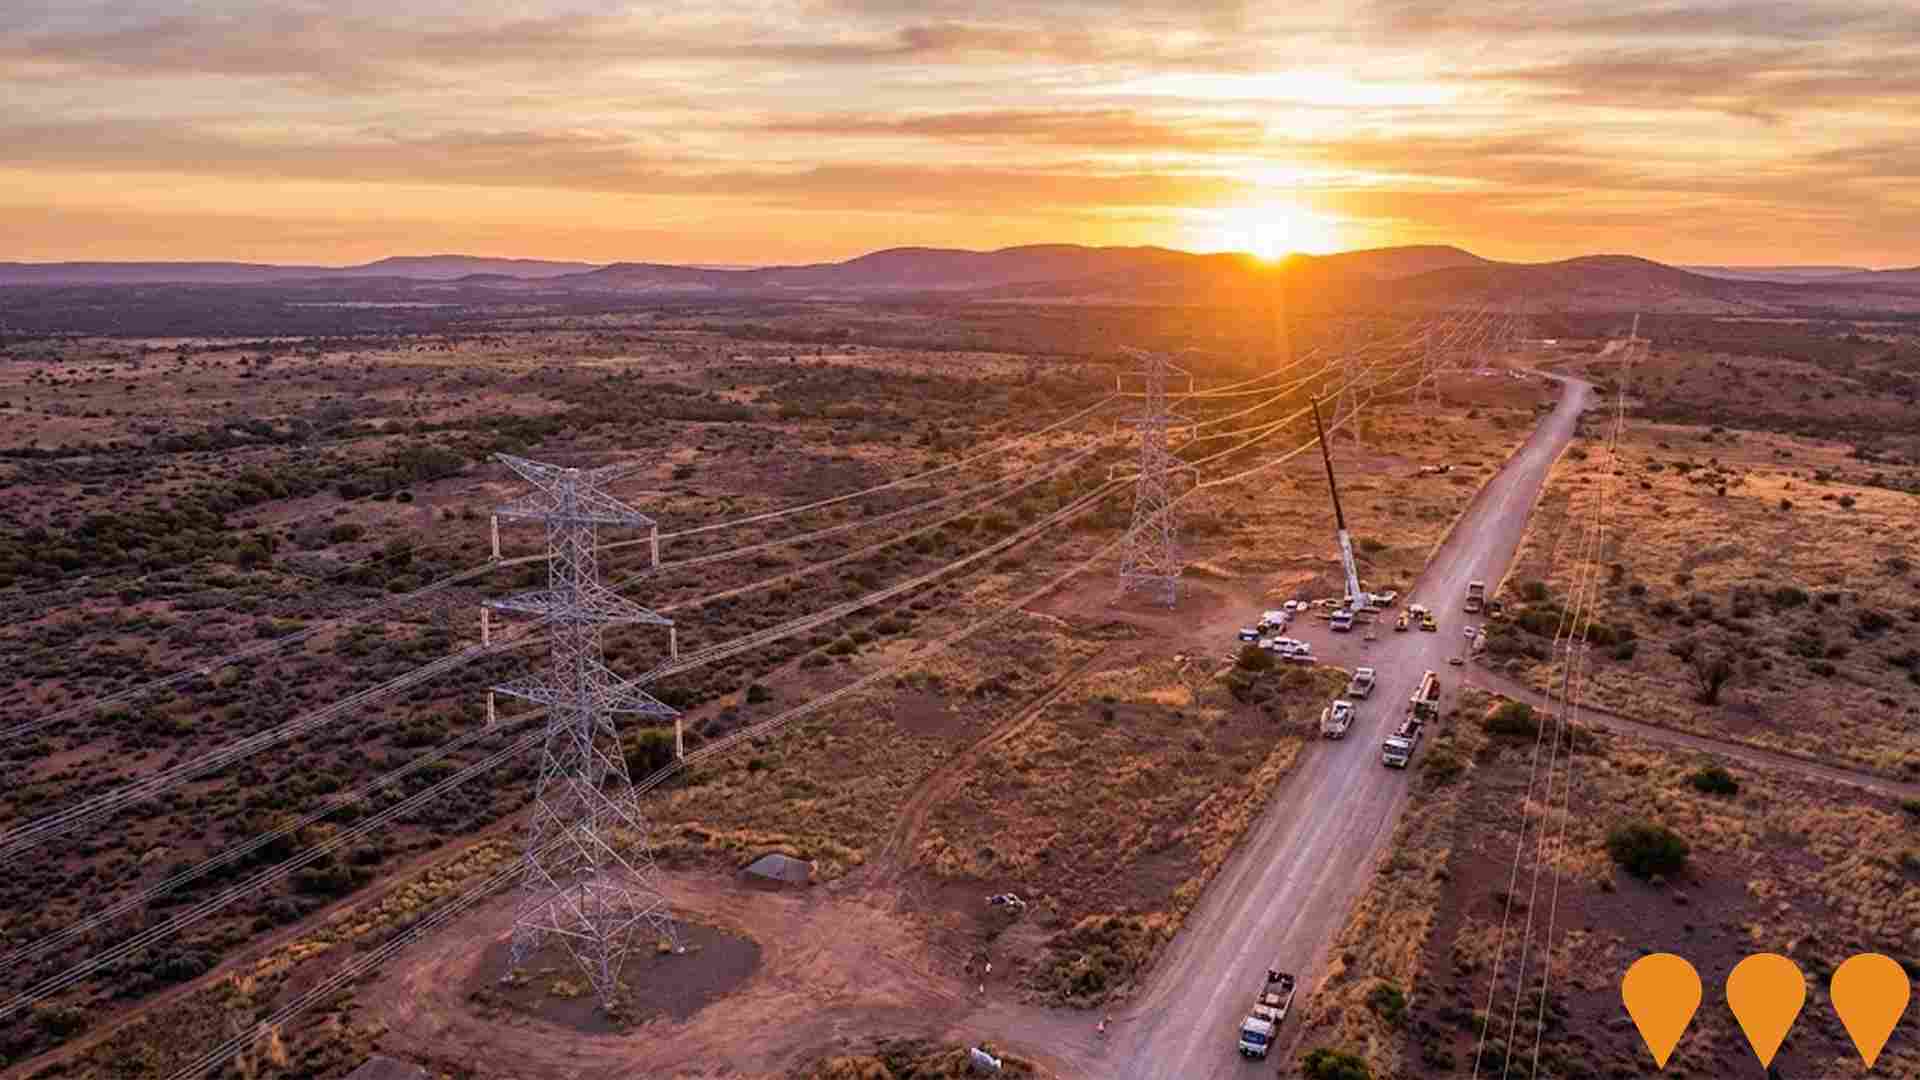
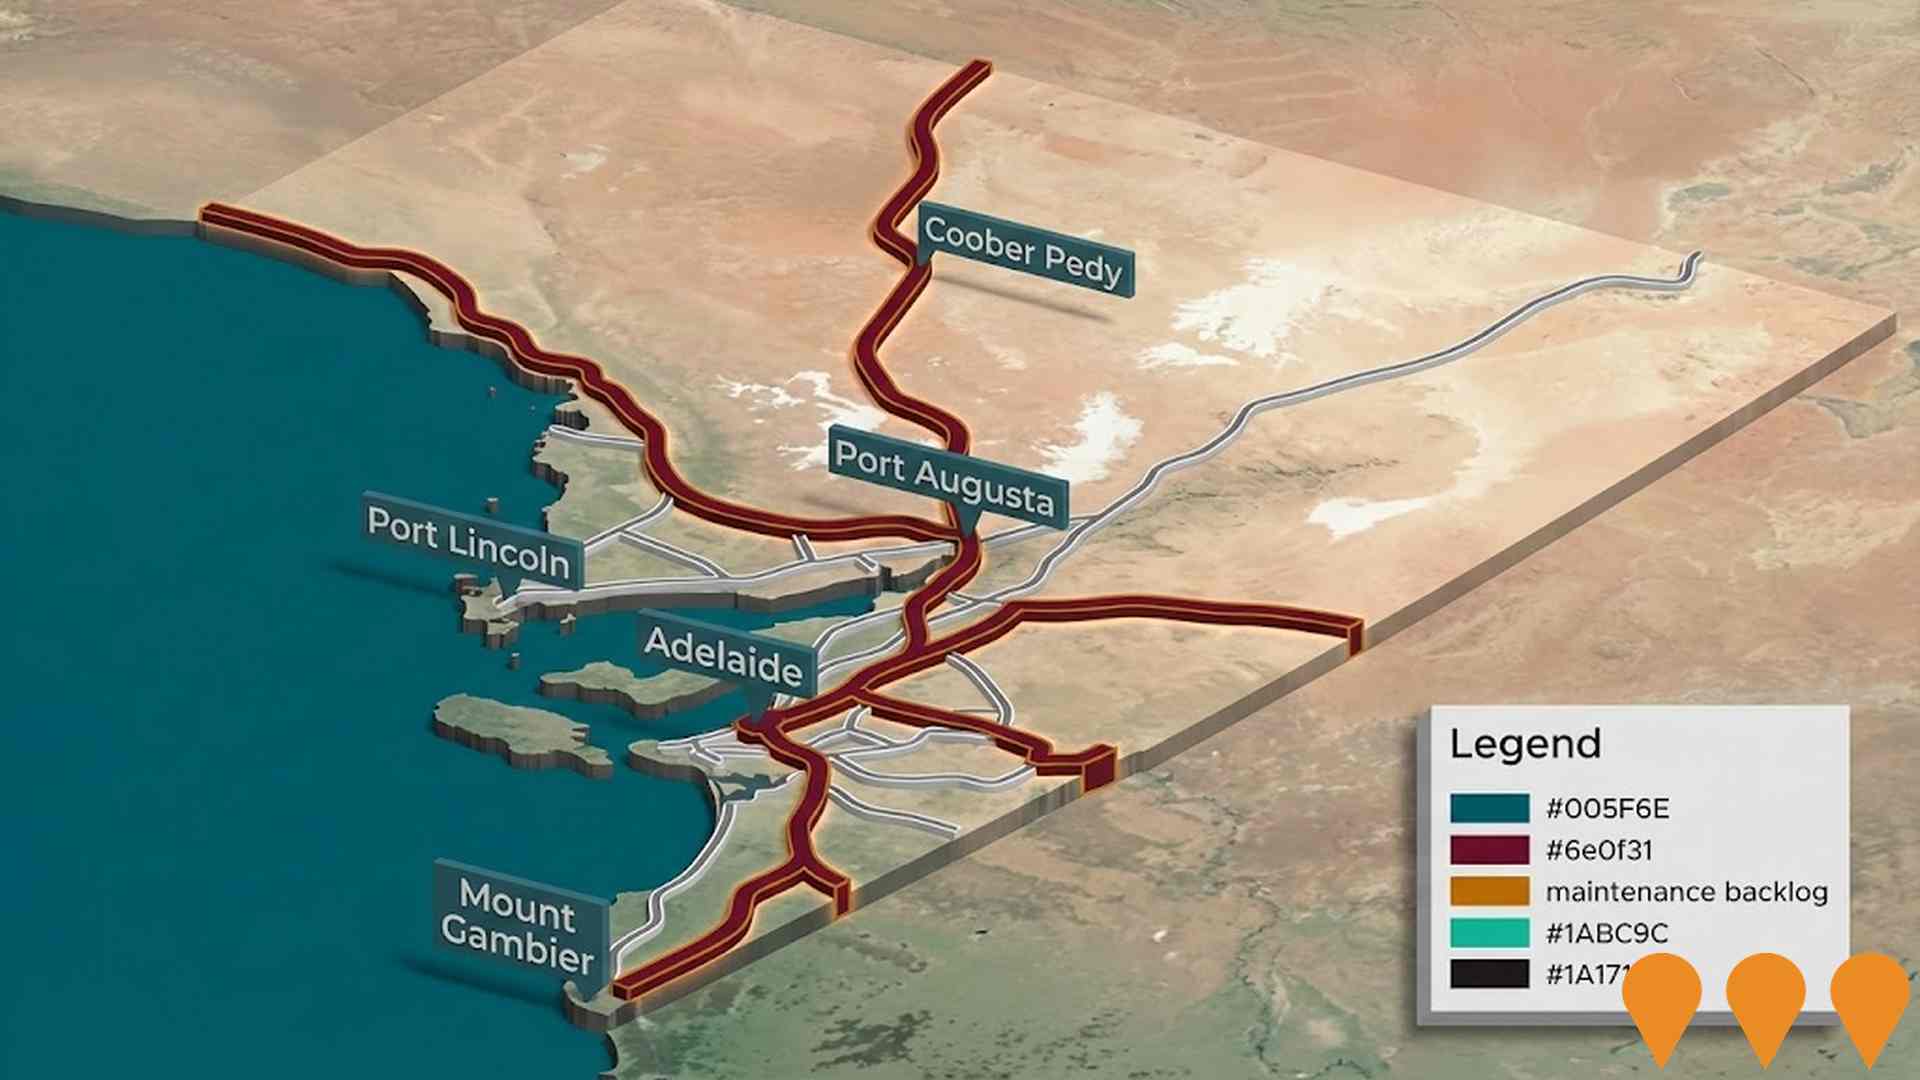
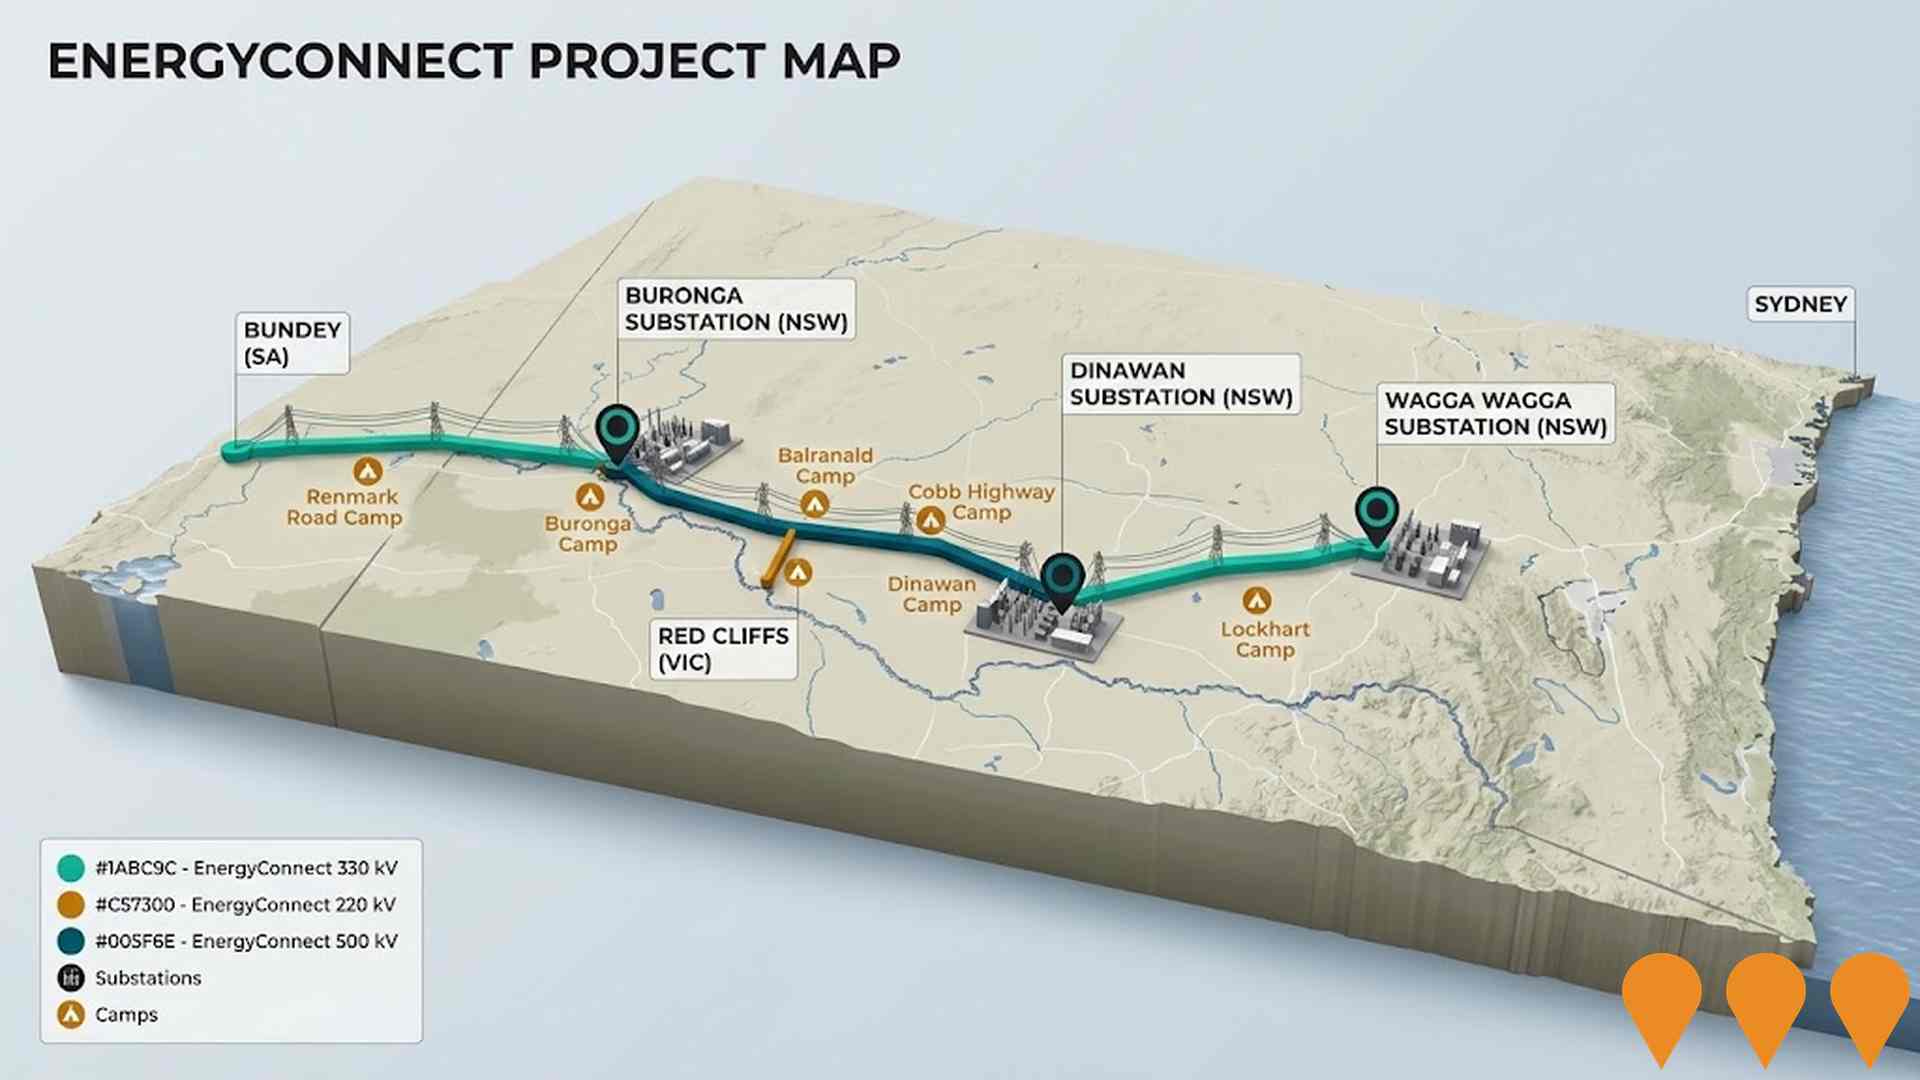
Australia's largest energy transmission project. A new ~900km interconnector linking the NSW, SA and VIC grids. NSW-West (Buronga to SA border and Red Cliffs spur) was energised in 2024-2025, connecting the three states via the expanded Buronga substation. NSW-East (Buronga-Dinawan-Wagga Wagga) is under active construction with substation upgrades at Wagga Wagga completed in June 2025 and works well advanced at Dinawan and Buronga. Full 800MW transfer capability is targeted after completion of the eastern section and inter-network testing, expected by late 2027.
Barossa Rugby Precinct
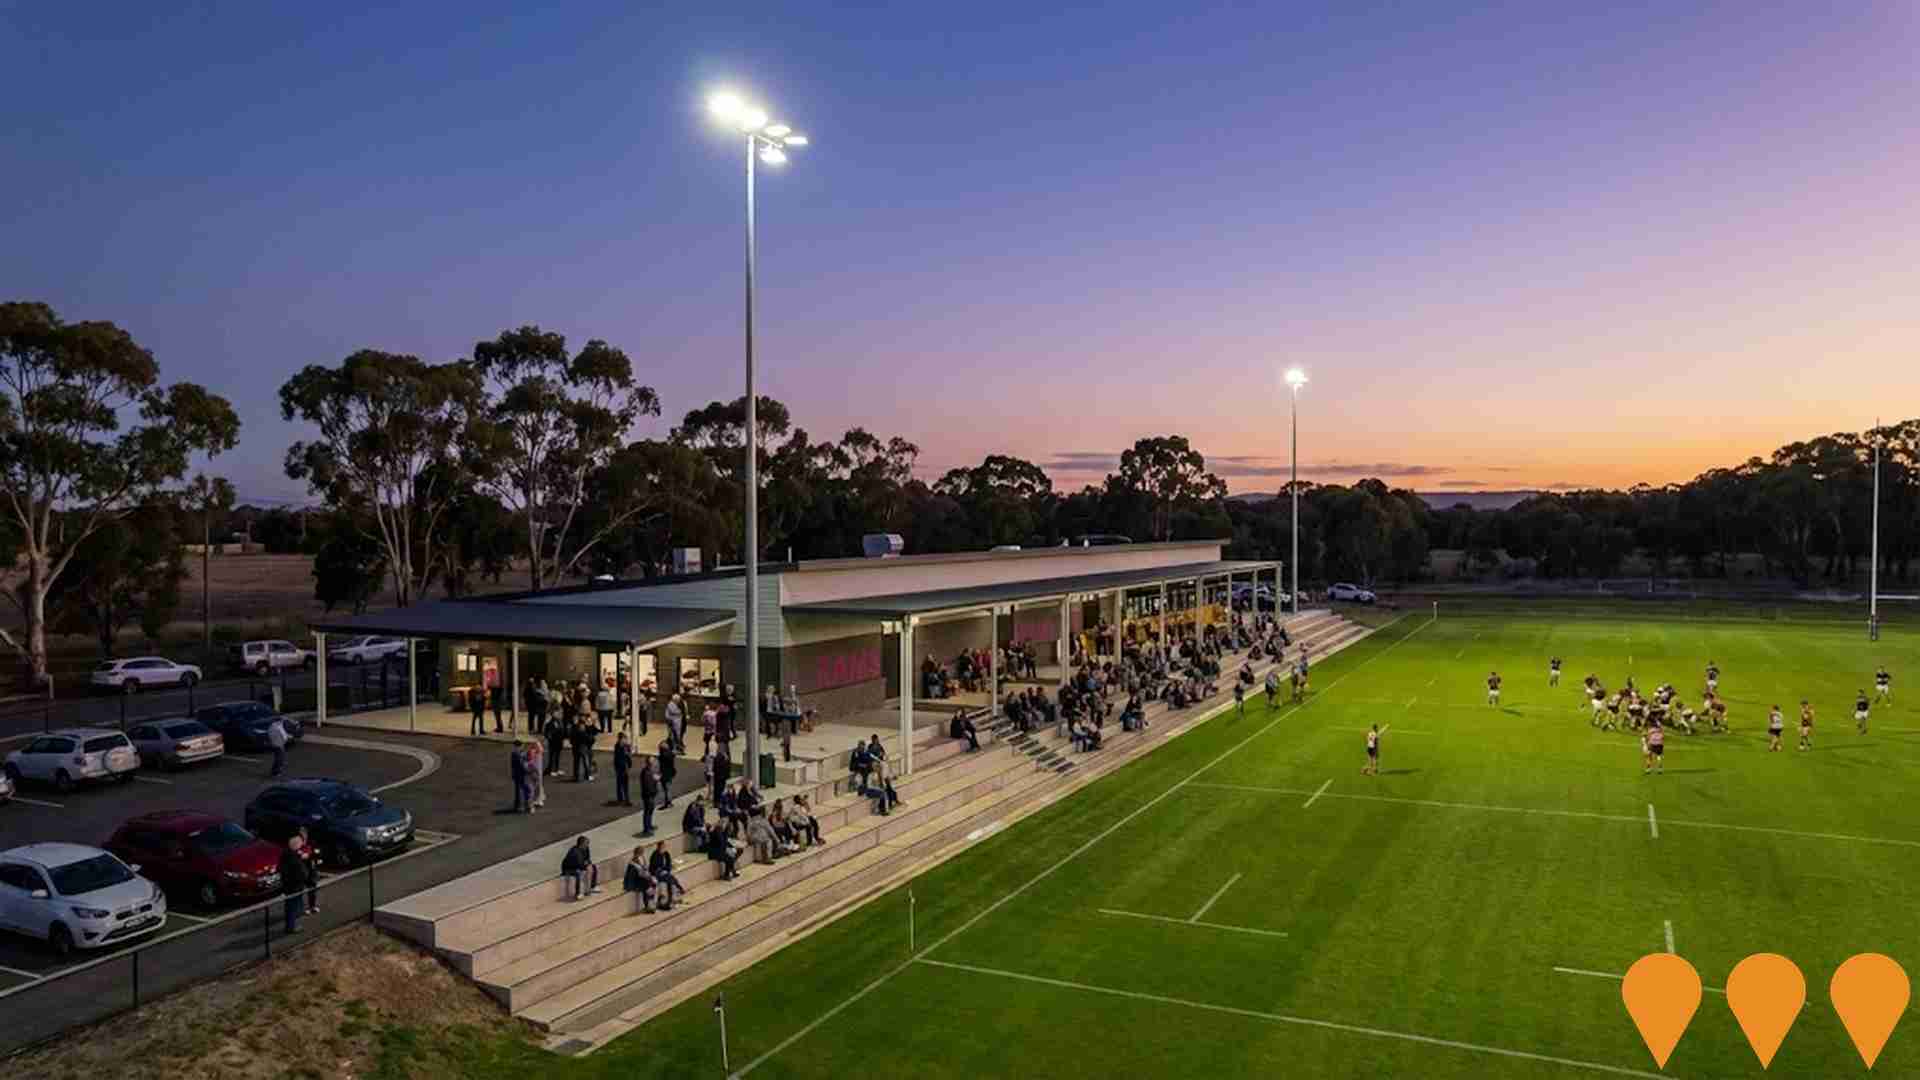
A $5.166 million purpose-built rugby facility featuring gender-neutral changerooms, clubroom, dedicated rugby pitch with LED lighting providing 100 lux, commercial kitchen, bar space for 150 people, sheltered viewing deck, car parking, and internal roads. The facility supports rugby union, touch football, and primary school sporting programs. Officially opened in June 2024, the precinct accommodates three touch football pitches and has become the best rugby playing surface in South Australia. Designed by Dash Architects and built by Bishop Building.
Sovereign Estate
A land release development in Tanunda, offering various sized allotments for new homes. It is located within walking distance to the town centre and surrounded by vineyards. Multiple stages have been released, with the 'Kindler Release' being the newest.
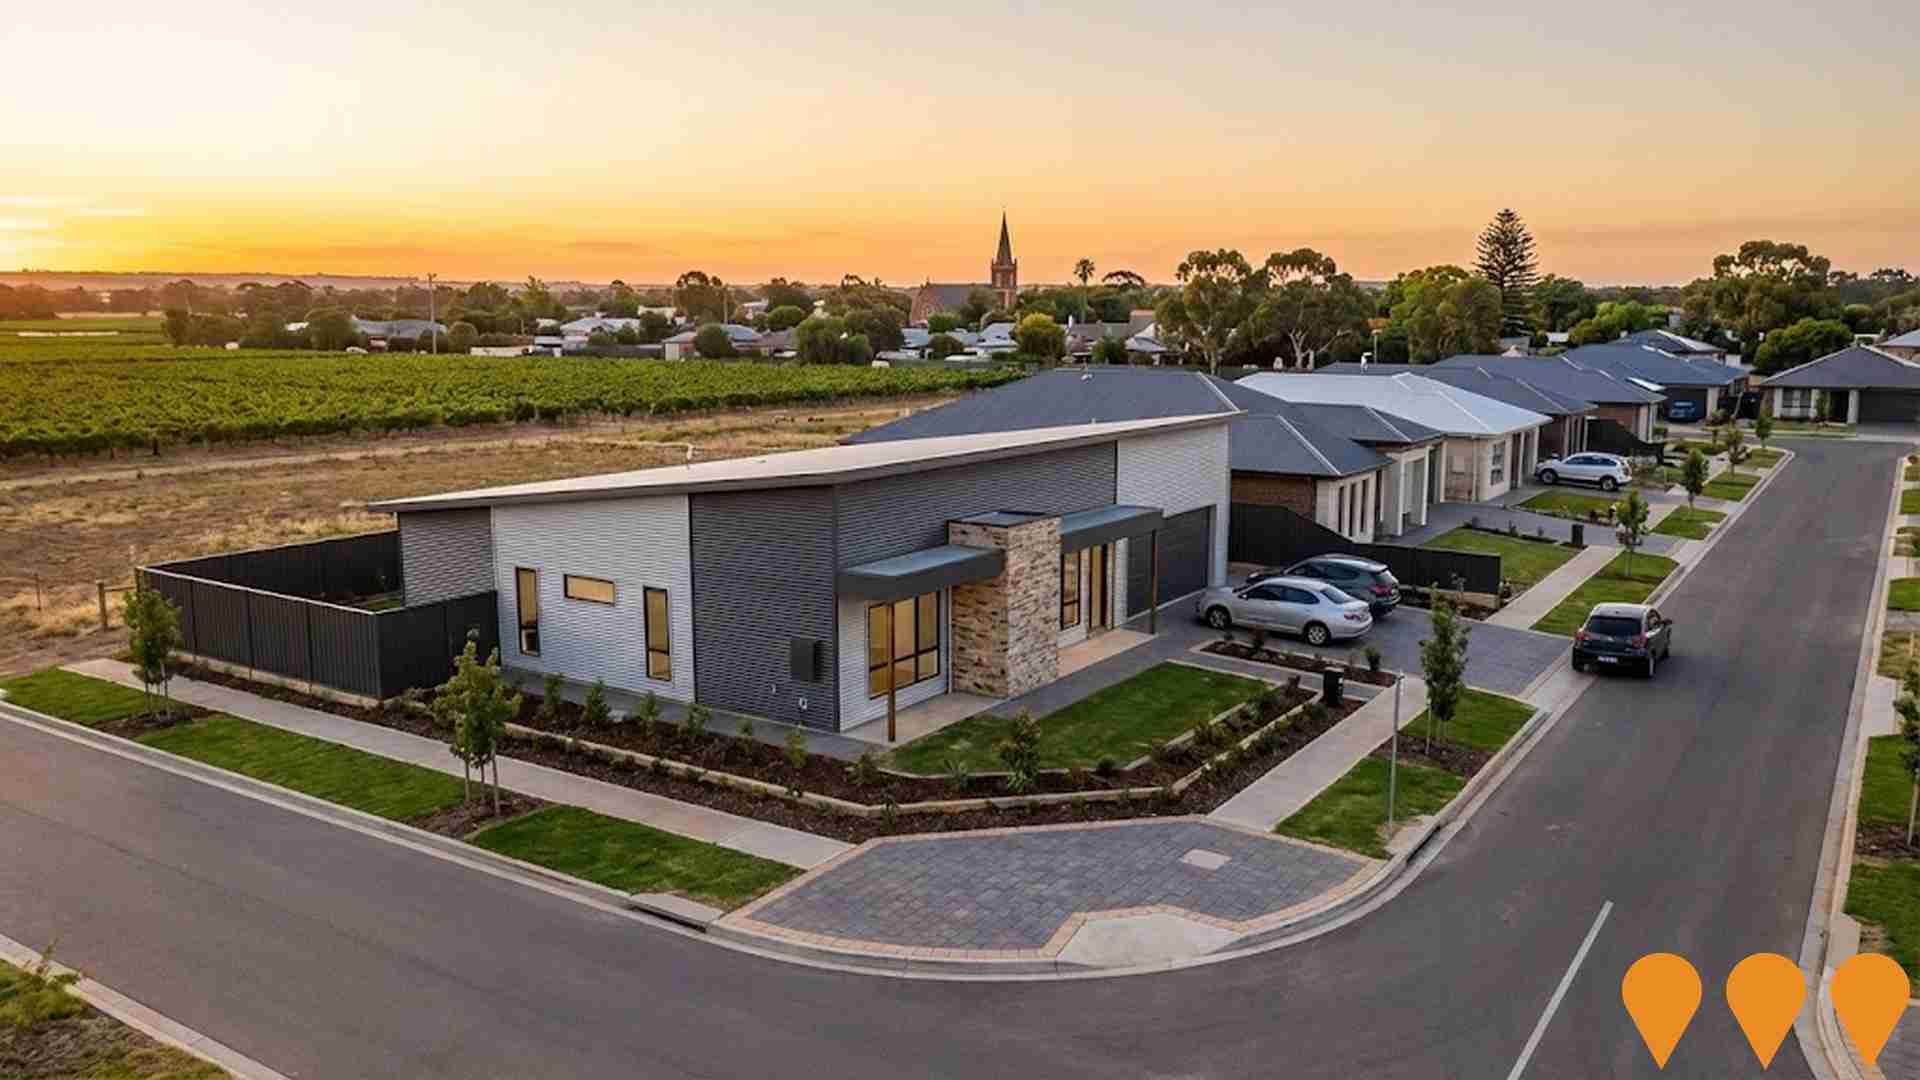
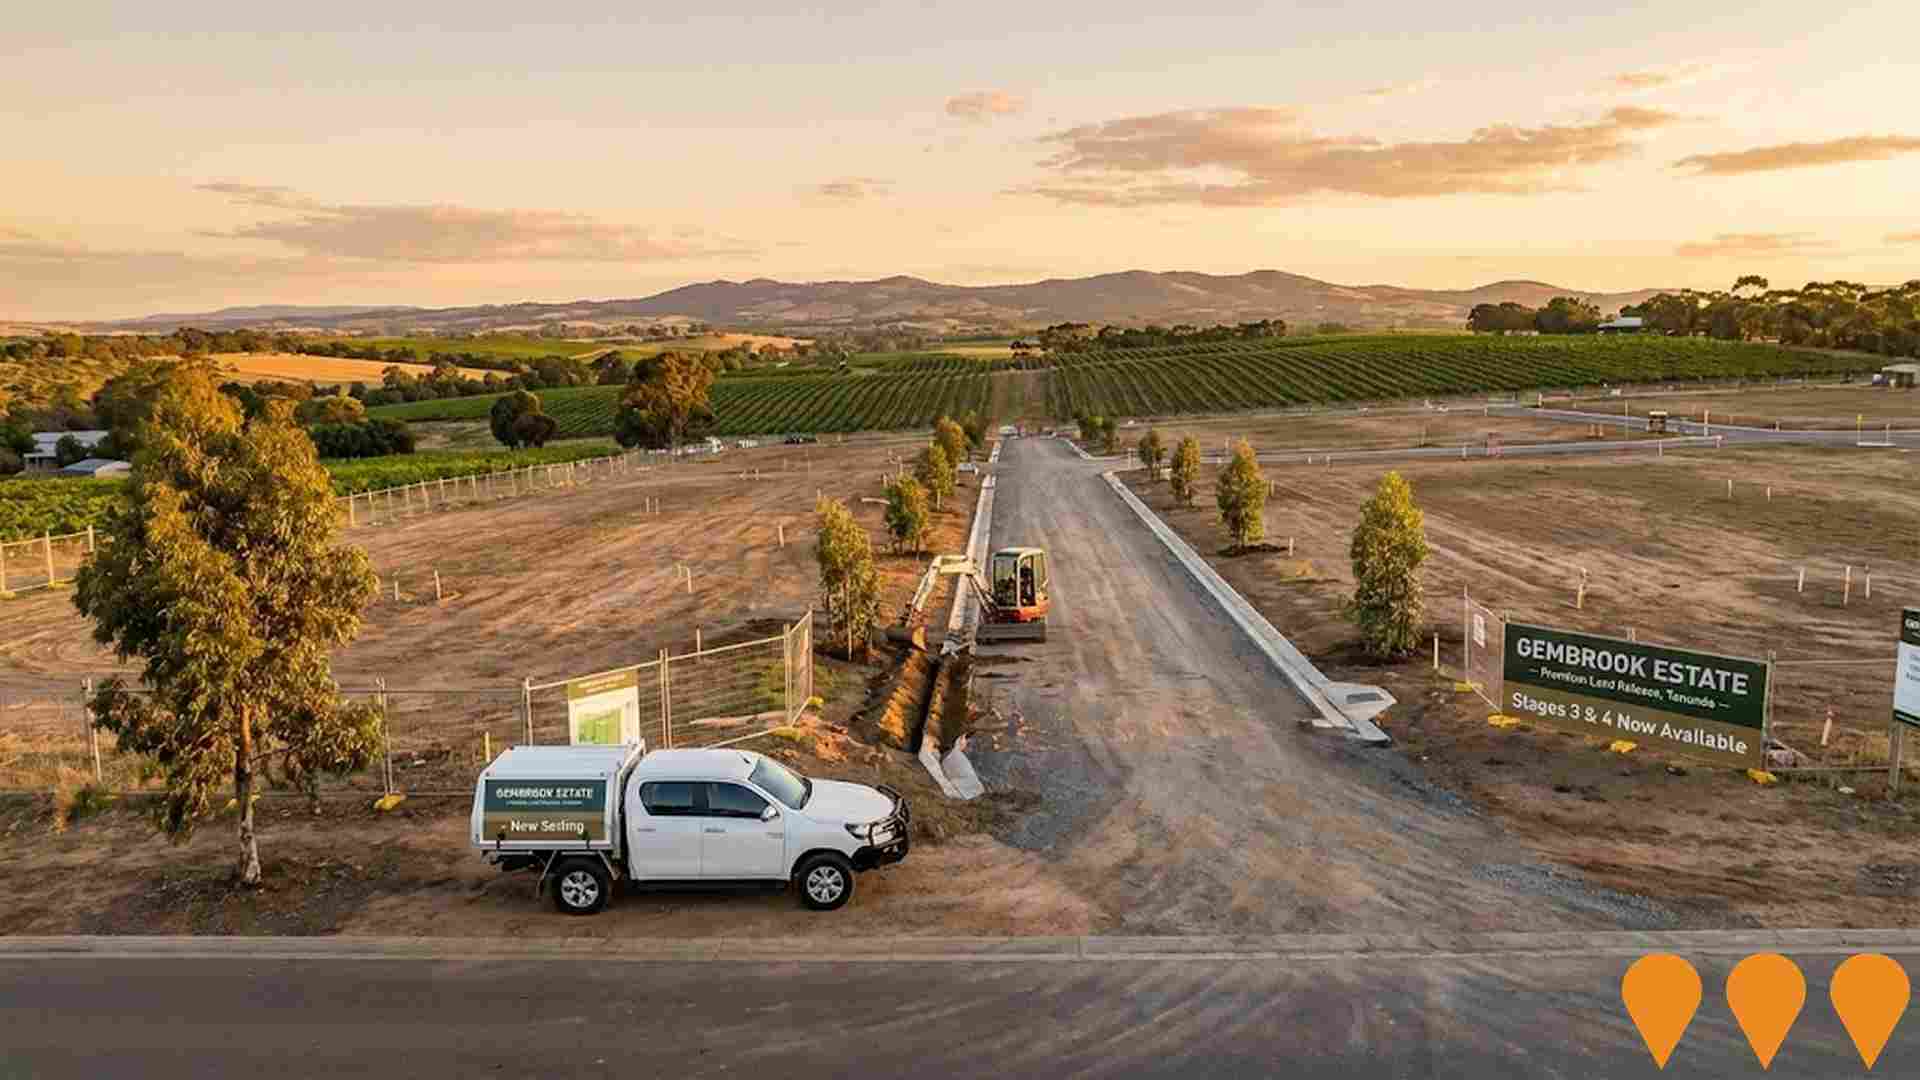
La Vida Homes - Gembrook Estate Tanunda
Fixed-price, turn-key house and land packages by La Vida Homes within the Gembrook Estate master-planned community. Located on the outskirts of Tanunda in the heart of the Barossa Valley, offering 3-4 bedroom homes with modern open-plan living, built-in wardrobes, and outdoor entertaining spaces. Quality building with fixtures suited for families and investors seeking lifestyle and community in a premium wine region.
Employment
Tanunda ranks among the top 25% of areas assessed nationally for overall employment performance
Tanunda has a skilled labour force with prominent manufacturing and industrial sectors. Its unemployment rate was 2.0% in the past year, with an estimated employment growth of 1.1%.
As of September 2025, 2,312 residents are employed, with an unemployment rate of 3.4%, below Rest of SA's 5.3%. Workforce participation is 57.6%, similar to the regional average of 54.1%. Key industries include manufacturing, health care & social assistance, and retail trade. Manufacturing is particularly strong, with an employment share 2.5 times the regional level, while agriculture, forestry & fishing has limited presence at 5.3% compared to 14.5% regionally.
Many residents commute elsewhere for work based on census data. In the year ending September 2025, employment increased by 1.1%, labour force by 1.8%, and unemployment rose by 0.7 percentage points. This contrasts with Rest of SA's employment growth of 0.3%, labour force expansion of 2.3%, and unemployment rise of 1.9%. Jobs and Skills Australia projects national employment to grow by 6.6% over five years and 13.7% over ten years, with varying rates across sectors. Applying these projections to Tanunda's employment mix suggests local employment should increase by 4.9% over five years and 11.5% over ten years.
Frequently Asked Questions - Employment
Income
The area's income profile falls below national averages based on AreaSearch analysis
AreaSearch's latest postcode level ATO data for financial year 2022 shows that Tanunda SA2 has median income of $53,007 and average income of $64,241. This compares to Rest of SA's median income of $46,889 and average income of $56,582. Based on Wage Price Index growth of 12.83% from financial year 2022 to September 2025, estimated median income is approximately $59,808 and average income is around $72,483. Census data indicates that incomes in Tanunda rank modestly, between the 32nd and 43rd percentiles for household, family, and personal incomes. Income distribution shows that 30.1% of Tanunda's population (1,498 individuals) fall within the $1,500 - 2,999 income range, similar to metropolitan regions at 27.5%. Housing costs allow for retention of 87.3%, but disposable income is below average at the 36th percentile. Tanunda's SEIFA income ranking places it in the 5th decile.
Frequently Asked Questions - Income
Housing
Tanunda is characterized by a predominantly suburban housing profile, with above-average rates of outright home ownership
Tanunda's dwelling structure, as per the latest Census, consisted of 90.2% houses and 9.7% other dwellings (semi-detached, apartments, 'other' dwellings). This compares to Non-Metro SA's 94.6% houses and 5.4% other dwellings. Home ownership in Tanunda was at 42.7%, with mortgaged dwellings at 35.5% and rented ones at 21.8%. The median monthly mortgage repayment was $1,452, higher than Non-Metro SA's average of $1,400. The median weekly rent in Tanunda was $300, compared to Non-Metro SA's $285. Nationally, Tanunda's mortgage repayments were lower at $1,452 versus Australia's average of $1,863, and rents were substantially below the national figure of $375.
Frequently Asked Questions - Housing
Household Composition
Tanunda has a typical household mix, with a lower-than-average median household size
Family households constitute 69.6% of all households, including 25.9% couples with children, 34.9% couples without children, and 8.4% single parent families. Non-family households account for the remaining 30.4%, with lone person households at 28.9% and group households comprising 1.6%. The median household size is 2.3 people, smaller than the Rest of SA average of 2.5.
Frequently Asked Questions - Households
Local Schools & Education
Educational attainment in Tanunda aligns closely with national averages, showing typical qualification patterns and performance metrics
Tanunda's educational qualifications trail regional benchmarks, with 21.6% of residents aged 15+ holding university degrees compared to Australia's 30.4%. This gap suggests potential for educational development and skill enhancement. Bachelor degrees are the most common at 14.8%, followed by postgraduate qualifications (4.0%) and graduate diplomas (2.8%). Trade and technical skills are prominent, with 36.6% of residents aged 15+ holding vocational credentials – advanced diplomas at 11.7% and certificates at 24.9%.
A substantial 23.7% of the population is actively pursuing formal education, including 9.9% in primary education, 6.1% in secondary education, and 2.9% pursuing tertiary education.
Frequently Asked Questions - Education
Schools Detail
Nearby Services & Amenities
Transport
No public transport data available for this catchment area.
Frequently Asked Questions - Transport
Transport Stops Detail
Health
Health performance in Tanunda is well below average with prevalence of common health conditions notable across both younger and older age cohorts
Tanunda faces significant health challenges, with common conditions prevalent across both younger and older age groups. Private health cover stands at approximately 52% (~2,583 people), higher than the average SA2 area's 49.8%.
The most common conditions are arthritis (10.8%) and mental health issues (8.2%). About 63.0% report no medical ailments, compared to 64.6% in Rest of SA. Tanunda has a higher proportion of seniors aged 65 and over at 29.9% (1,488 people), compared to Rest of SA's 22.8%. Senior health outcomes are above average and better than the general population in health metrics.
Frequently Asked Questions - Health
Cultural Diversity
Tanunda is considerably less culturally diverse than average when assessed alongside AreaSearch's national rankings for language and cultural background related metrics
Tanunda's cultural diversity was found to be below average, with 88.3% of its population born in Australia, 93.1% being citizens, and 96.6% speaking English only at home. The dominant religion in Tanunda was Christianity, comprising 56.6% of the population, compared to 47.1% across Rest of SA. The top three ancestry groups were Australian (28.9%), English (28.1%), and German (20.9%), with German being substantially higher than the regional average of 14.2%.
Notably, Welsh was overrepresented at 0.6%, Dutch at 1.4%, and Serbian at 0.2% compared to their respective regional averages of 0.5%, 1.3%, and 0.1%.
Frequently Asked Questions - Diversity
Age
Tanunda hosts an older demographic, ranking in the top quartile nationwide
The median age in Tanunda is 48 years, similar to the Rest of South Australia's average of 47, which is well above the national norm of 38. Compared to the Rest of SA average, the 35-44 cohort is notably over-represented at 12.8% locally, while the 25-34 age group is under-represented at 6.7%. From 2021 to present, the 75-84 age group has grown from 8.7% to 10.5%, and the 15-24 cohort increased from 8.1% to 9.3%. Conversely, the 25-34 cohort has declined from 9.3% to 6.7%. Population forecasts for 2041 indicate substantial demographic changes in Tanunda. The 75-84 age group is projected to grow by 47%, adding 248 residents to reach 772. Senior residents aged 65 and above will drive 83% of population growth, highlighting demographic aging trends. Conversely, both the 35-44 and 25-34 age groups are expected to decrease in numbers.
