Chart Color Schemes
This analysis uses ABS Statistical Areas Level 2 (SA2) boundaries, which can materially differ from Suburbs and Localities (SAL) even when sharing similar names.
SA2 boundaries are defined by the Australian Bureau of Statistics and are designed to represent communities for statistical reporting (e.g., census and ERP).
Suburbs and Localities (SAL) represent commonly-used suburb/locality names (postal-style areas) and may use different geographic boundaries. For comprehensive analysis, consider reviewing both boundary types if available.
est. as @ -- *
ABS ERP | -- people | --
2021 Census | -- people
Sales Activity
Curious about local property values? Filter the chart to assess the volume and appreciation (including resales) trends and regional comparisons, or scroll to the map below view this information at an individual property level.
Find a Recent Sale
Sales Detail
Population
Craigmore - Blakeview lies within the top quartile of areas nationally for population growth performance according to AreaSearch analysis of recent, and medium to long-term trends
Craigmore-Blakeview's population was around 21,402 as of November 2025. This figure reflects an increase of 1,482 people since the 2021 Census which reported a population of 19,920. The growth is inferred from ABS data showing an estimated resident population of 21,159 in June 2024 and 202 validated new addresses since the Census date. This results in a population density ratio of 1,801 persons per square kilometer, higher than average national levels assessed by AreaSearch. Craigmore-Blakeview's growth rate of 7.4% since the 2021 census exceeded the state's average of 7.1%. Interstate migration contributed approximately 49.0% to overall population gains during recent periods.
AreaSearch uses ABS/Geoscience Australia projections for each SA2 area, released in 2024 with a base year of 2022. For areas not covered by this data and years post-2032, the SA State Government's Regional/LGA projections are adopted with adjustments made using weighted aggregation methods. Future population projections indicate significant growth for Craigmore-Blakeview, with an expected increase of 7,106 persons to reach a total population of 28,508 by 2041, reflecting a 32.1% increase over the 17-year period.
Frequently Asked Questions - Population
Development
Recent residential development output has been above average within Craigmore - Blakeview when compared nationally
Craigmore - Blakeview has averaged approximately 57 new dwelling approvals annually over recent years. From FY-21 to FY-25, a total of 288 homes were approved, with an additional 39 approved so far in FY-26. On average, about 5.8 new residents arrived per year for each dwelling constructed during these five financial years.
This significant demand outpaces supply, which typically drives price growth and increased buyer competition. The average construction value of new properties is $209,000, below the regional average, indicating more affordable housing options. In FY-26, commercial approvals totaled $17.1 million, suggesting balanced commercial development activity in the area. Compared to Greater Adelaide, Craigmore - Blakeview has considerably less development activity, at 84.0% below the regional average per person. This scarcity of new homes tends to strengthen demand and prices for existing properties.
Additionally, recent building activity consists solely of detached houses, preserving the area's suburban identity with a concentration of family homes appealing to buyers seeking space. With approximately 677 people per dwelling approval, Craigmore - Blakeview reflects a highly mature market. According to AreaSearch's latest quarterly estimate, the area is projected to grow by 6,863 residents by 2041. At current development rates, housing supply may struggle to keep pace with population growth, potentially intensifying buyer competition and supporting price increases.
Frequently Asked Questions - Development
Infrastructure
Craigmore - Blakeview has emerging levels of nearby infrastructure activity, ranking in the 35thth percentile nationally
Changes in local infrastructure significantly affect an area's performance. AreaSearch has identified 18 projects likely to impact the region. Notable initiatives include Playford Alive Urban Renewal Project, Bentley Road Affordable Housing Development, Catherine McAuley School Upgrade, and Angle Vale Residential Growth Area. The following list details those most relevant.
Professional plan users can use the search below to filter and access additional projects.
INFRASTRUCTURE SEARCH
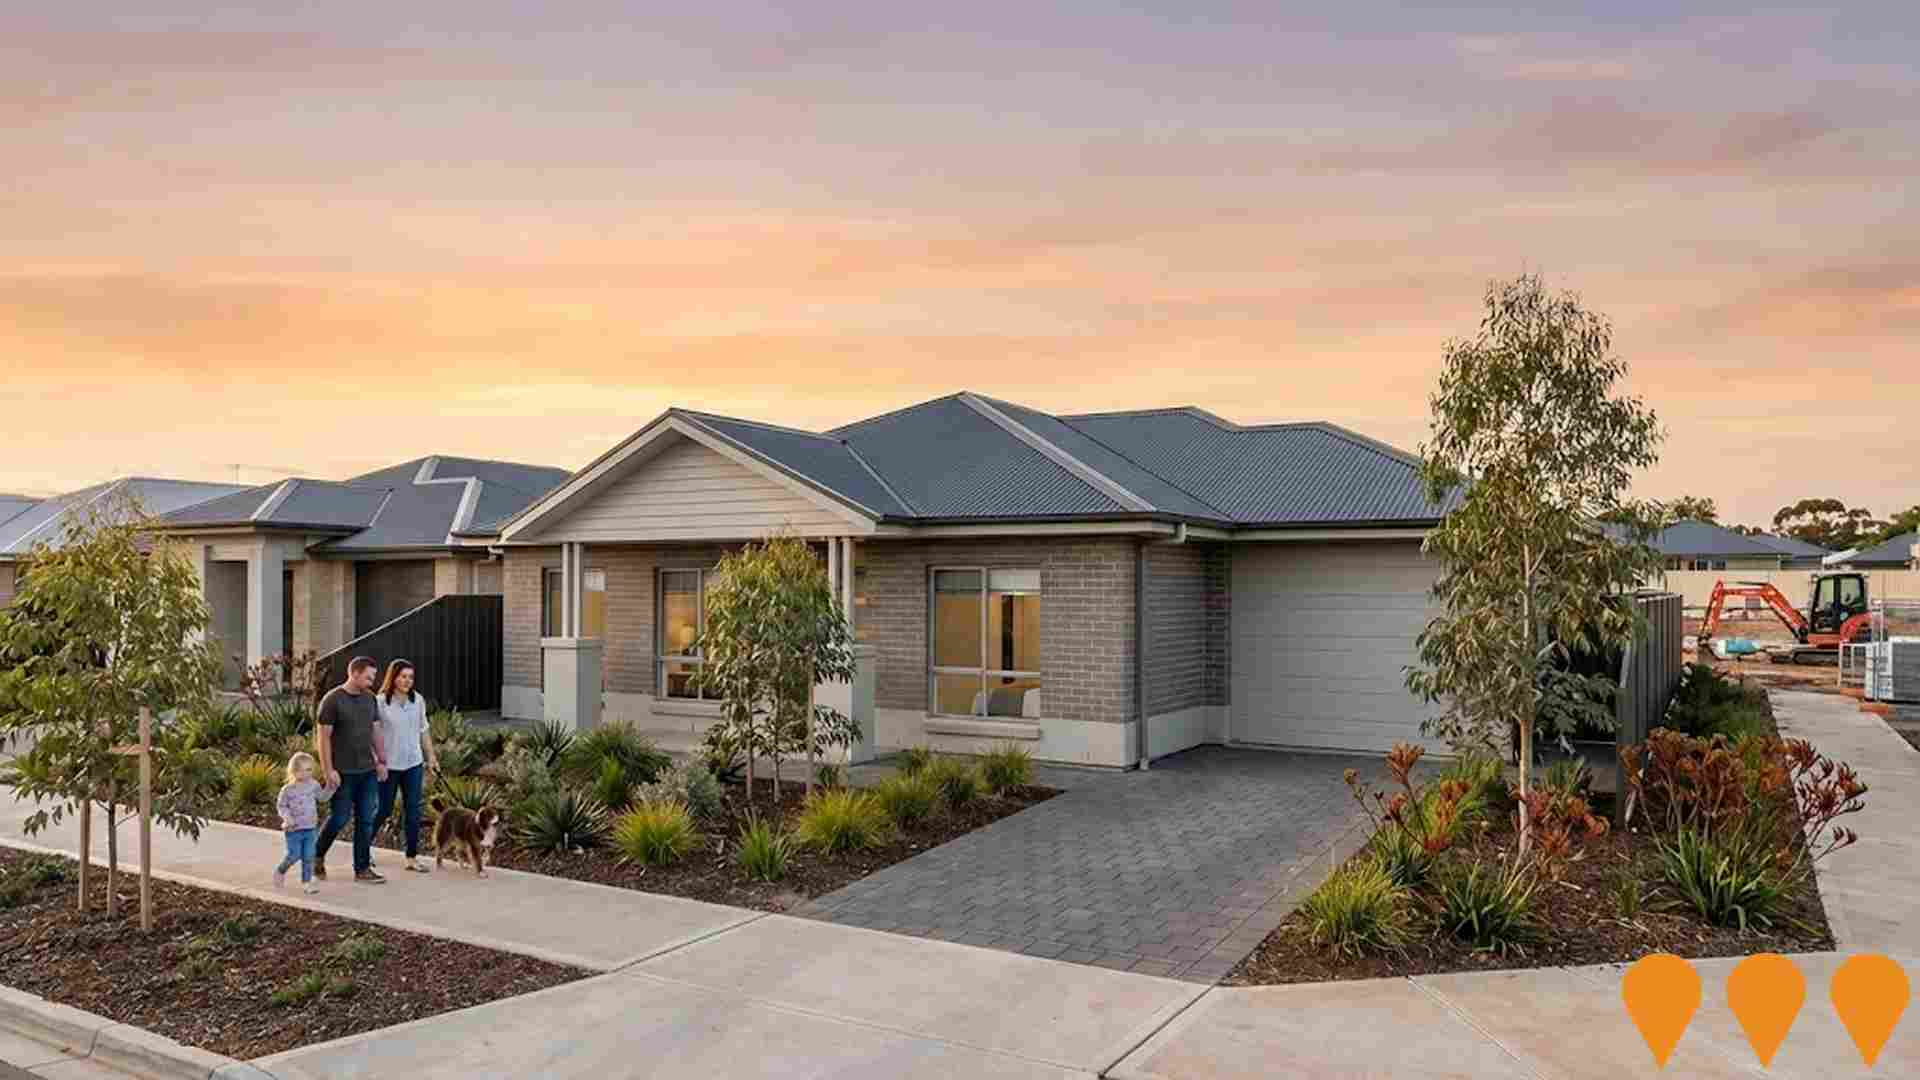
 Denotes AI-based impression for illustrative purposes only, not to be taken as definitive under any circumstances. Please follow links and conduct other investigations from the project's source for actual imagery. Developers and project owners wishing us to use original imagery please Contact Us and we will do so.
Frequently Asked Questions - Infrastructure
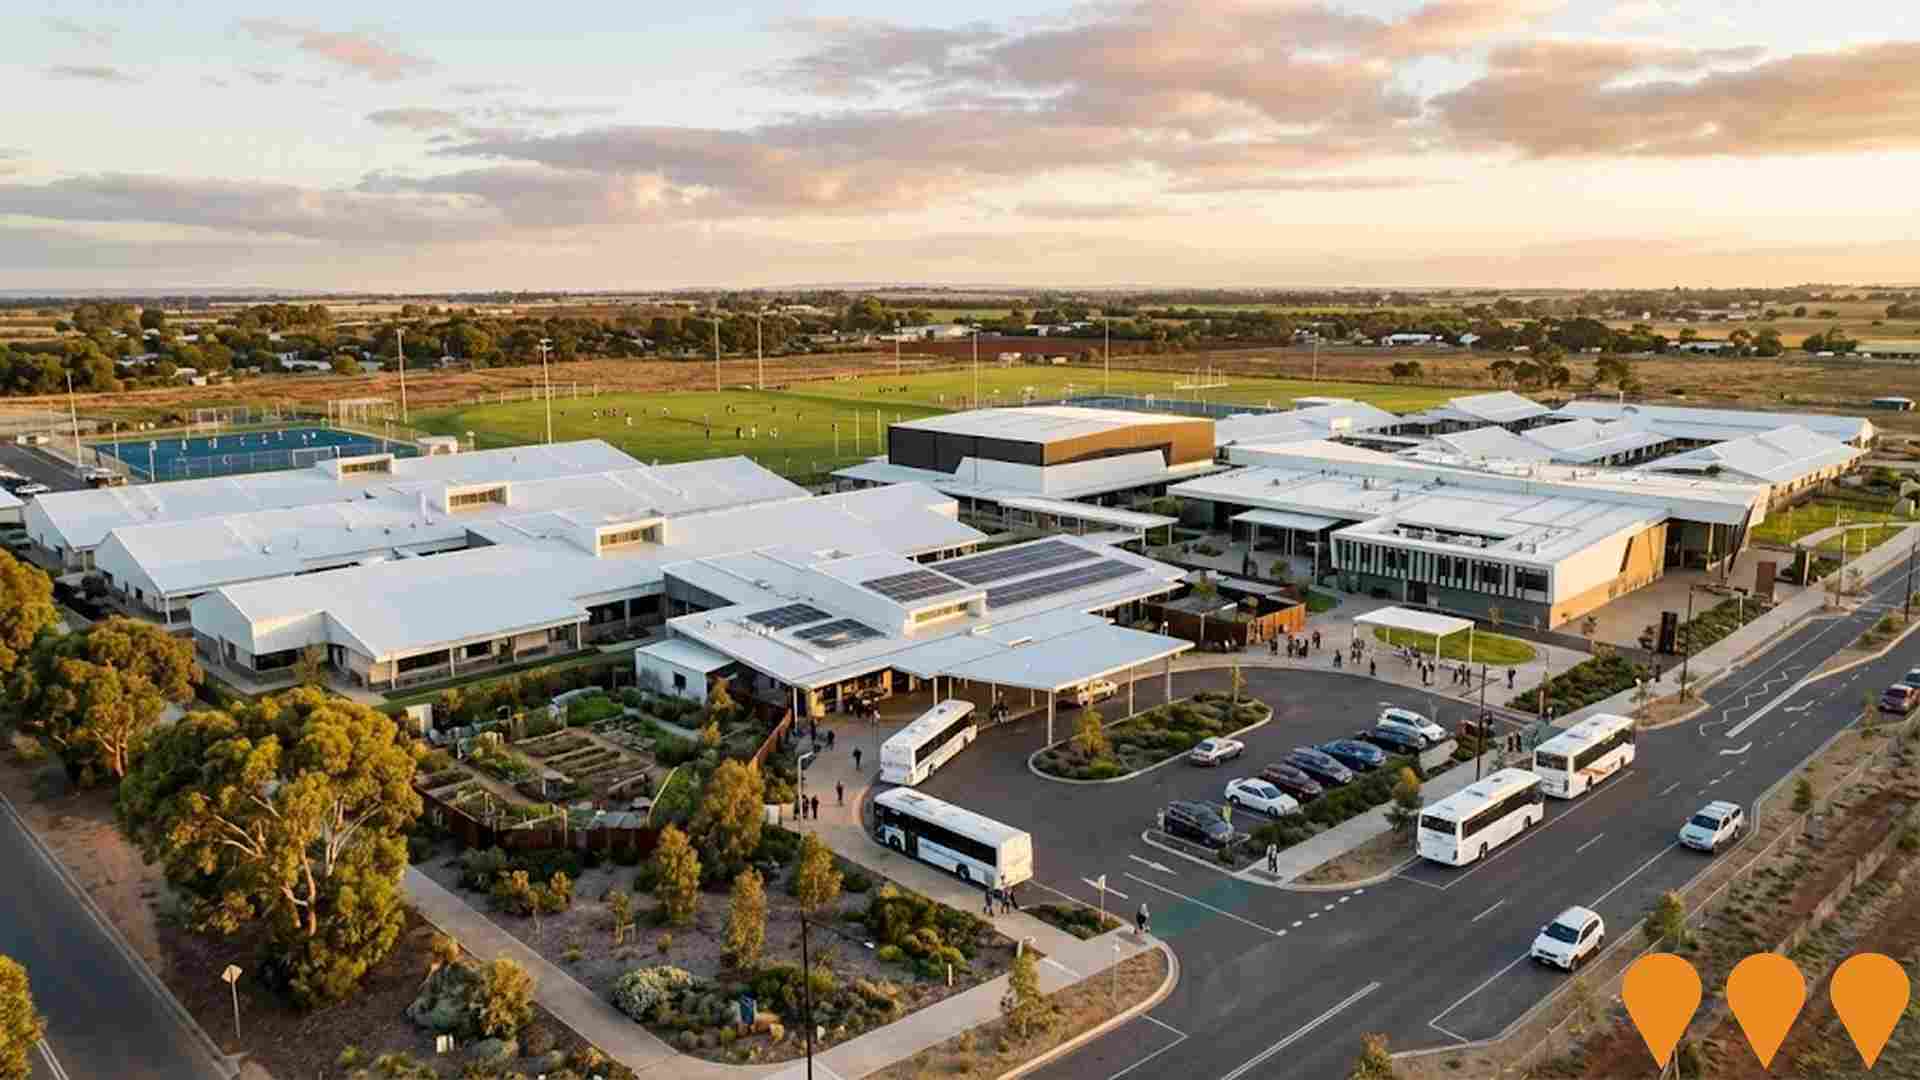
Mark Oliphant College Community Facility
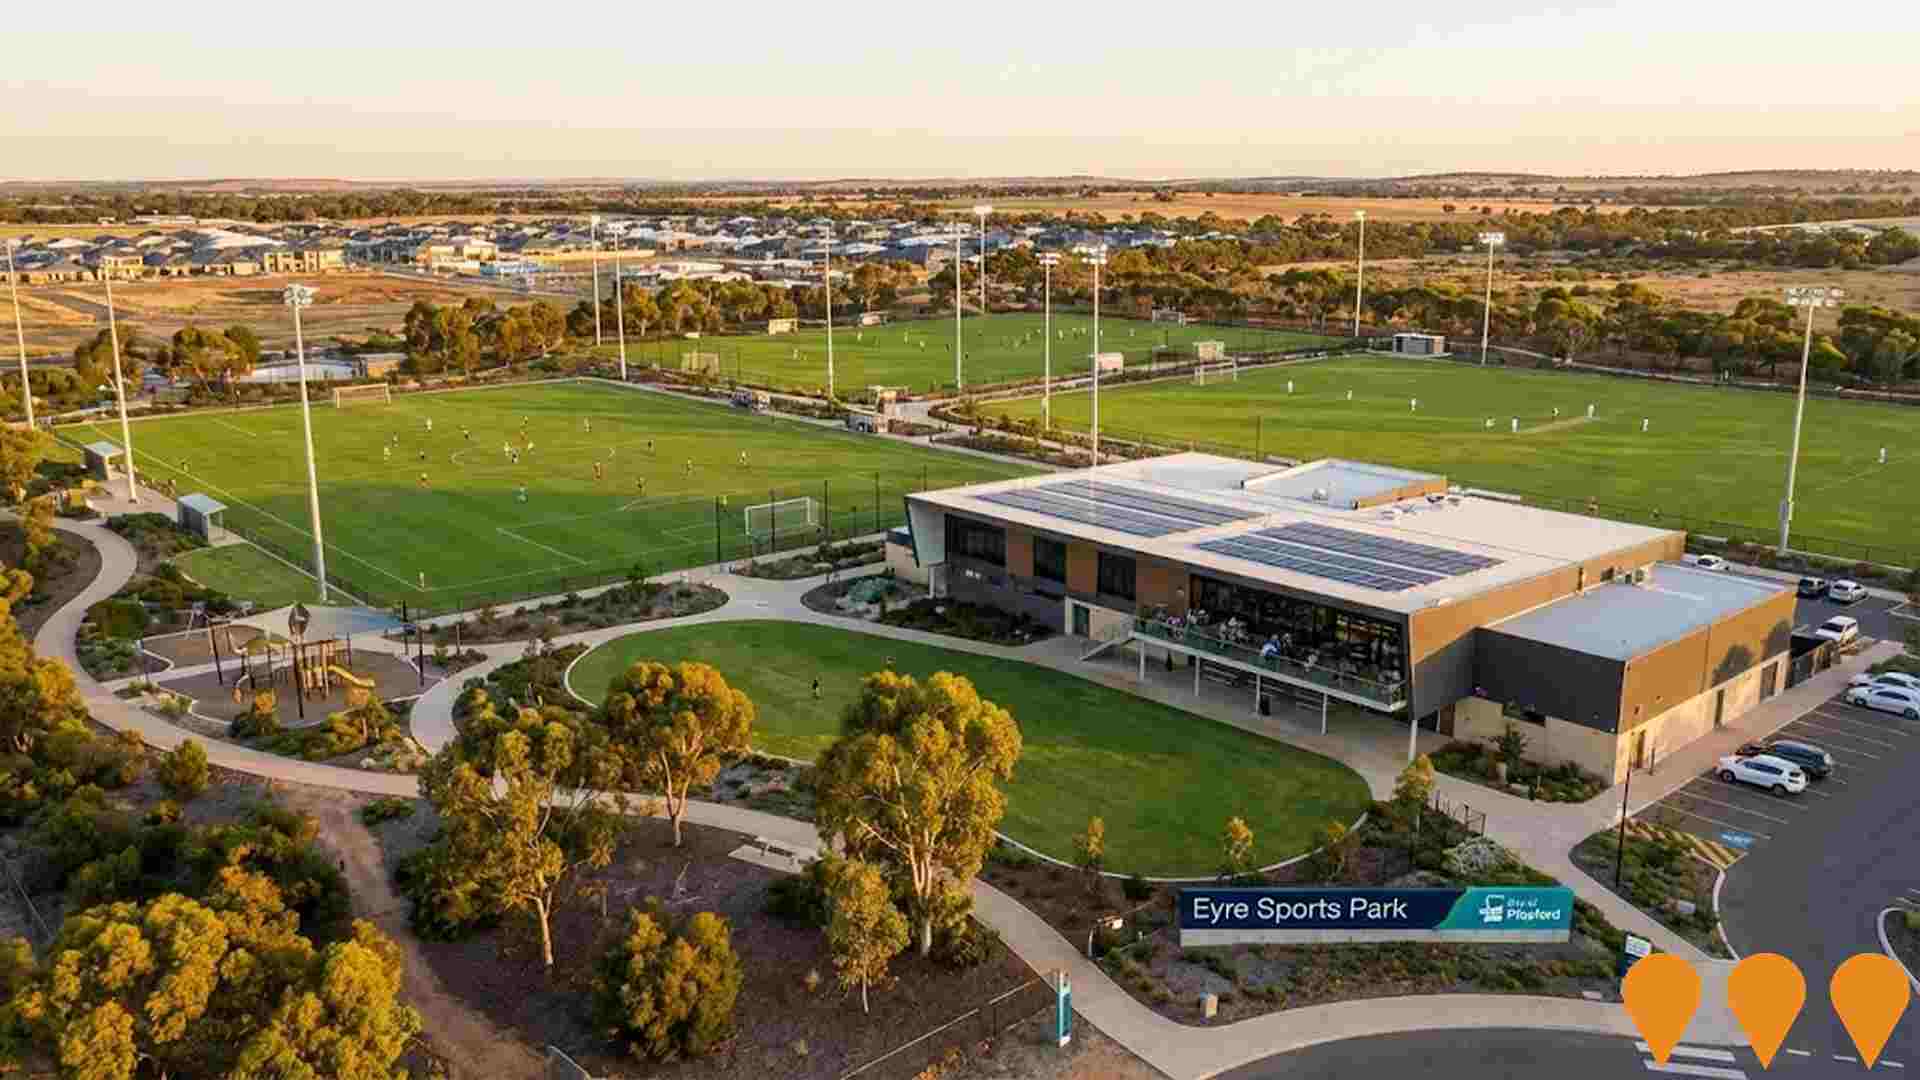
Integrated community facility at Mark Oliphant College delivering a purpose-built kiss 'n' drop (approx. 400 m kerbside zone) with new parking and access upgrades, and a regional-level soccer sportsground featuring a FIFA-quality synthetic pitch, natural pitch, six changerooms, function room and semi-commercial kitchen. Elizabeth Grove Soccer Club is the selected anchor tenant. Jointly funded and delivered by City of Playford and the SA Department for Education.

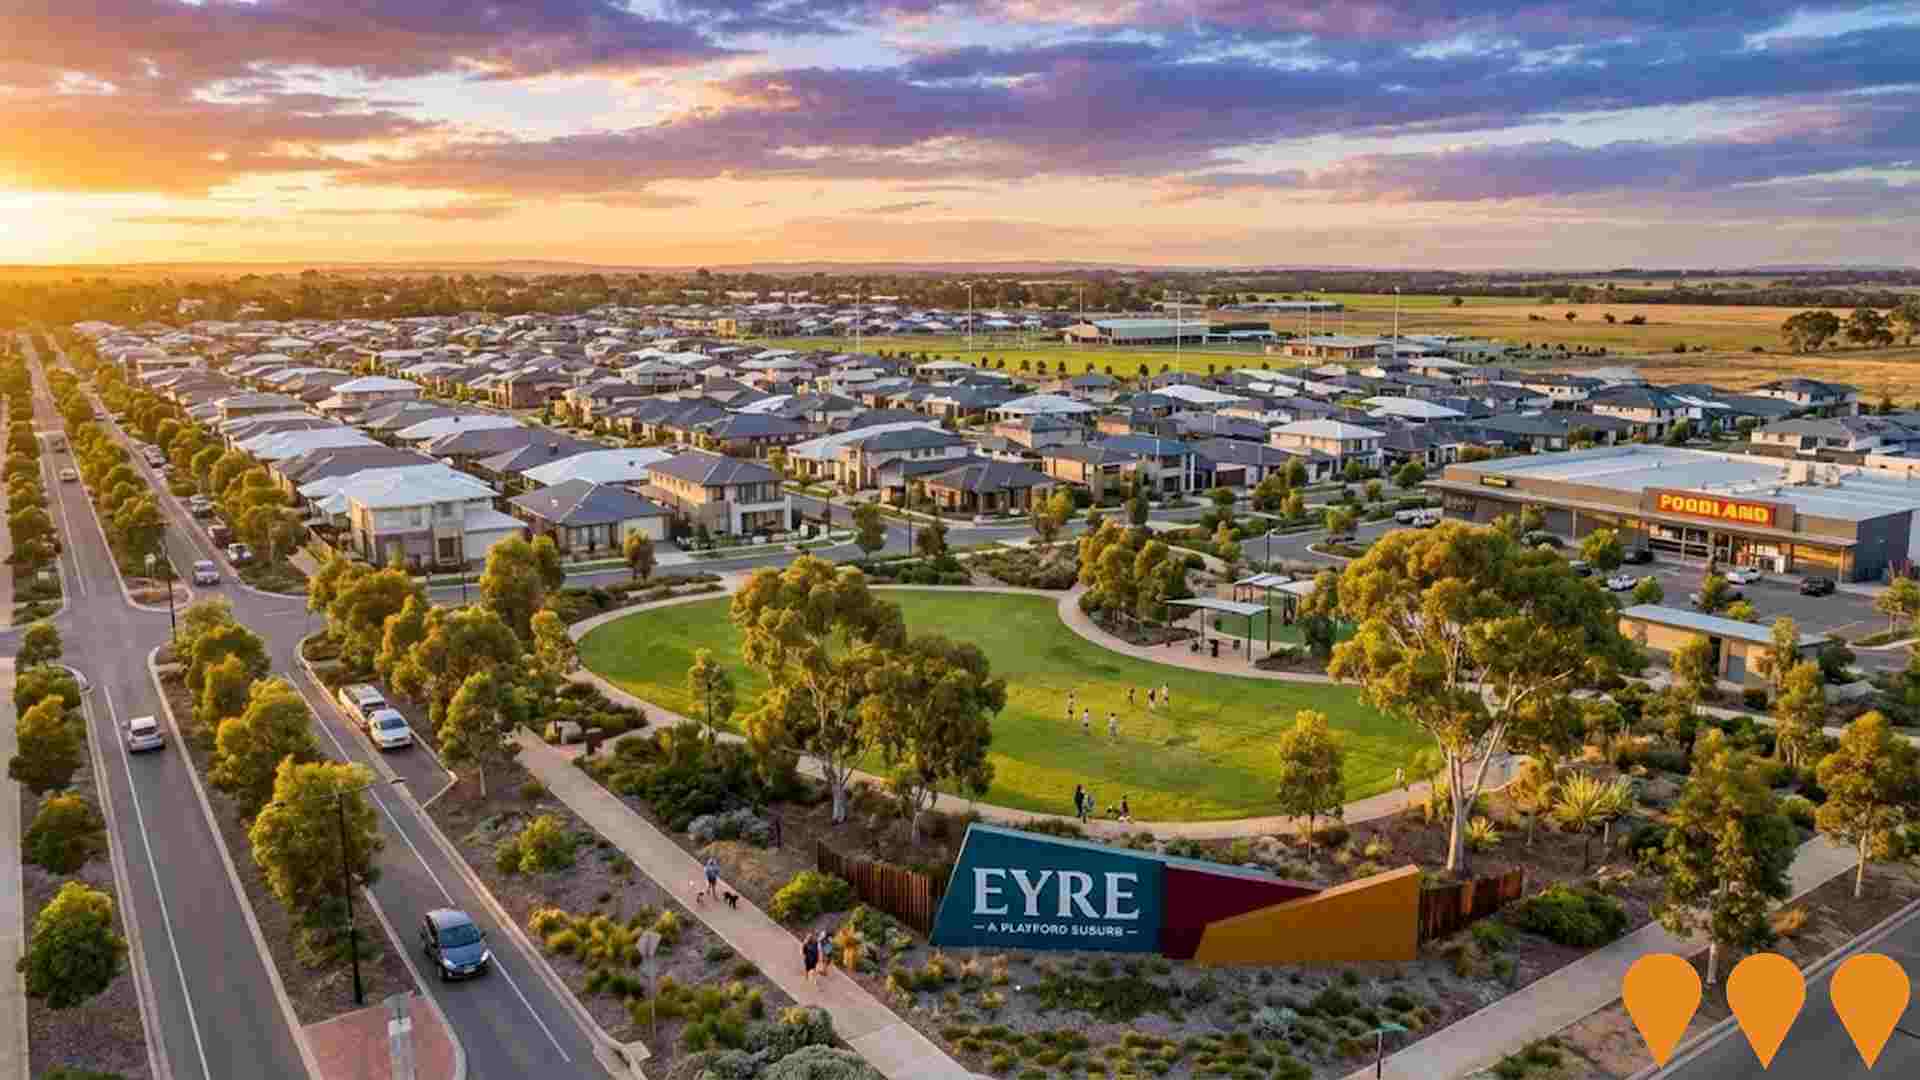
Playford Alive Urban Renewal Project
One of Australia's largest urban renewal projects spanning over 1,000 hectares. Partnership between Renewal SA, SA Housing Trust, City of Playford and community. Features new housing for over 40,000 residents, schools, medical centre, railway station, wetlands, parklands and $250 million town centre. Recent 2025 expansion adds 1,300 additional homes with project timeline extended beyond 2028. Includes retail, commercial, civic and community facilities serving the growing northern Adelaide region.

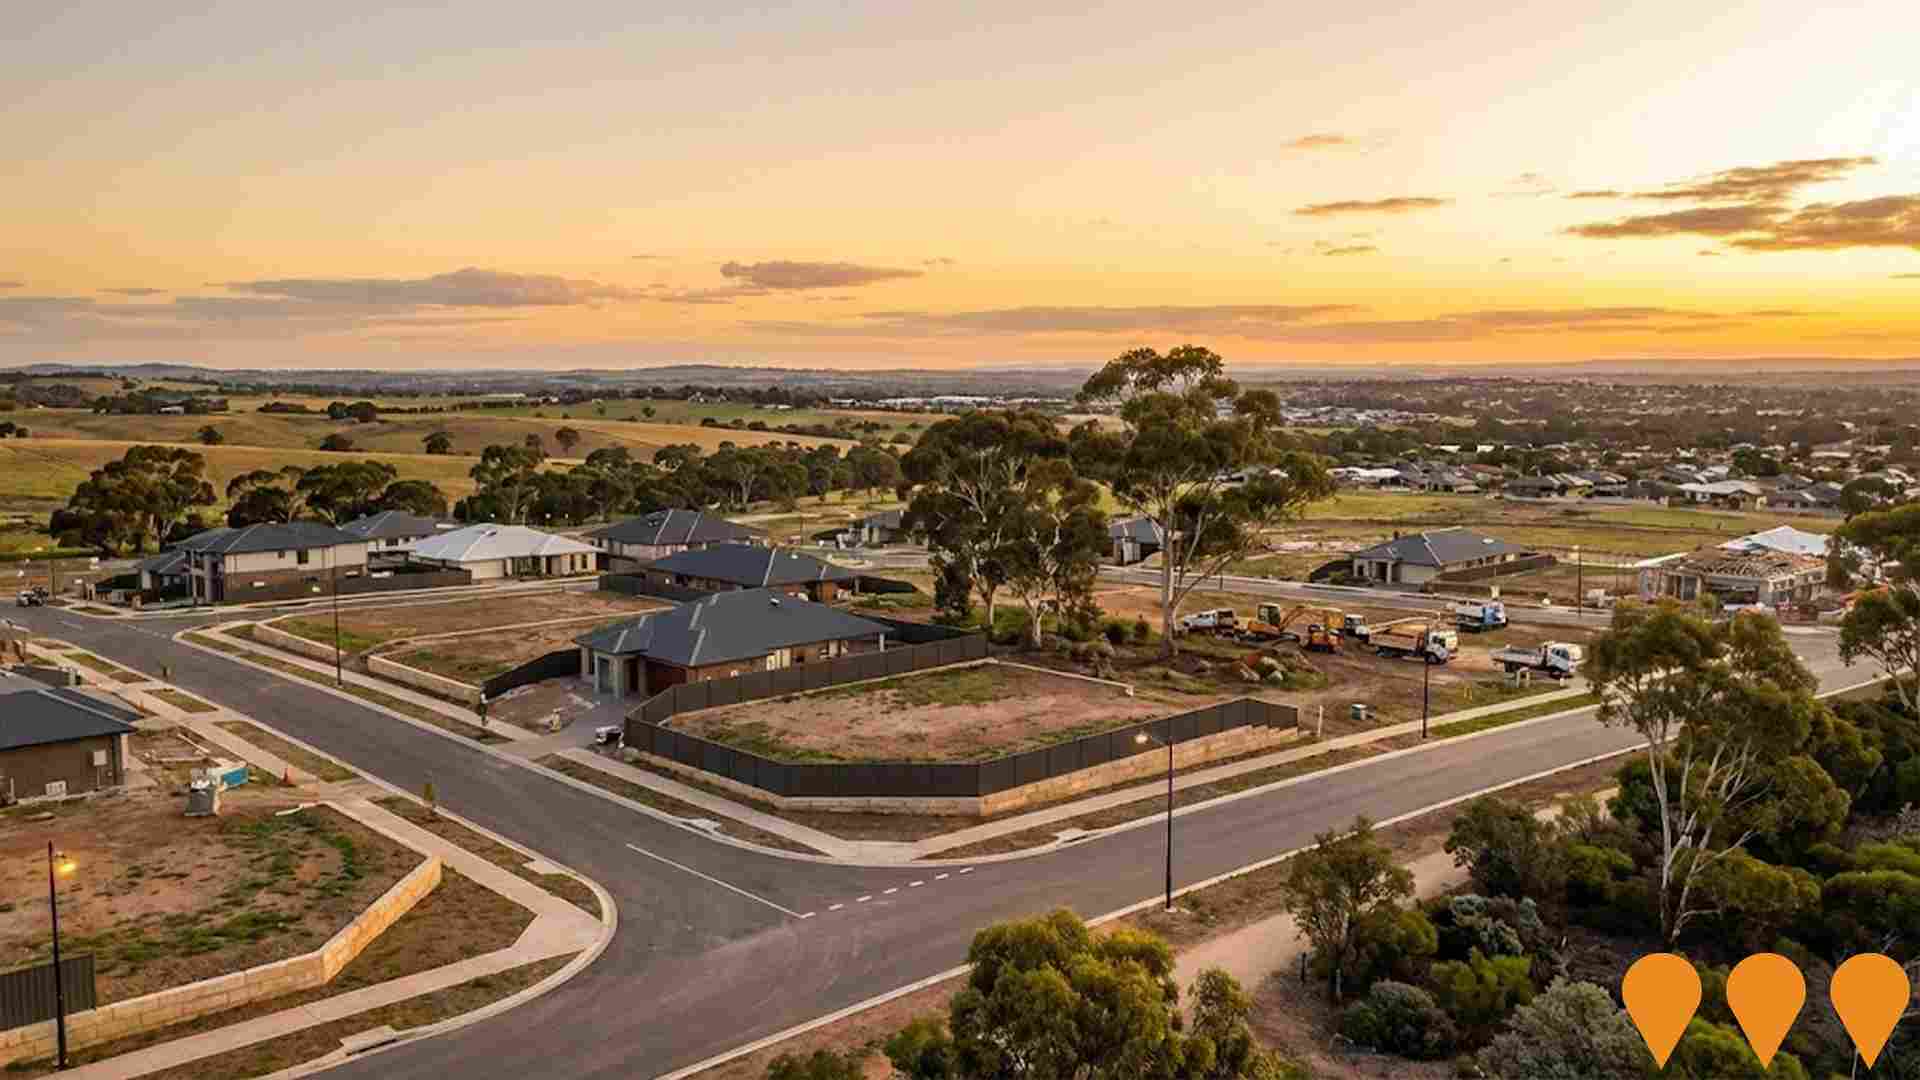
Angle Vale Residential Growth Area
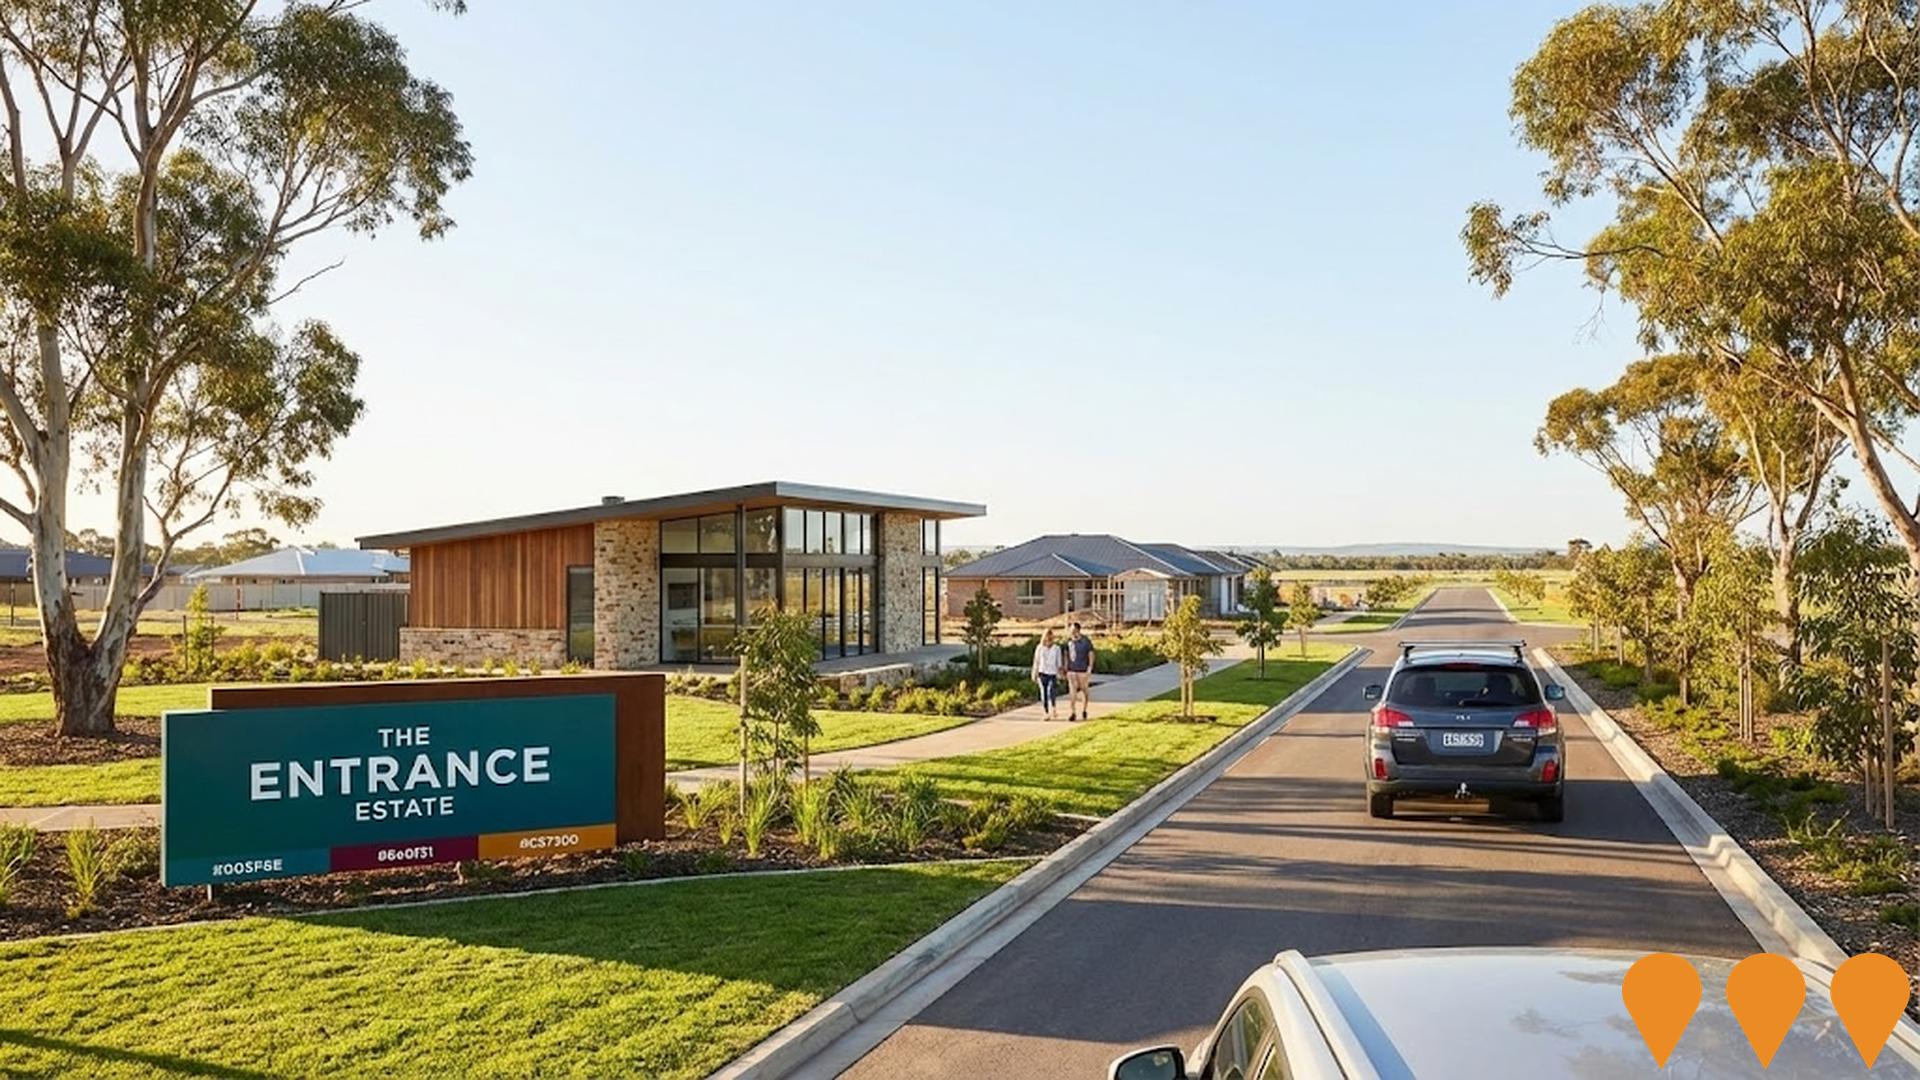
Major residential growth area with multiple developments including Miravale Estate and The Entrance Estate. Key growth corridor supported by new water infrastructure investments.

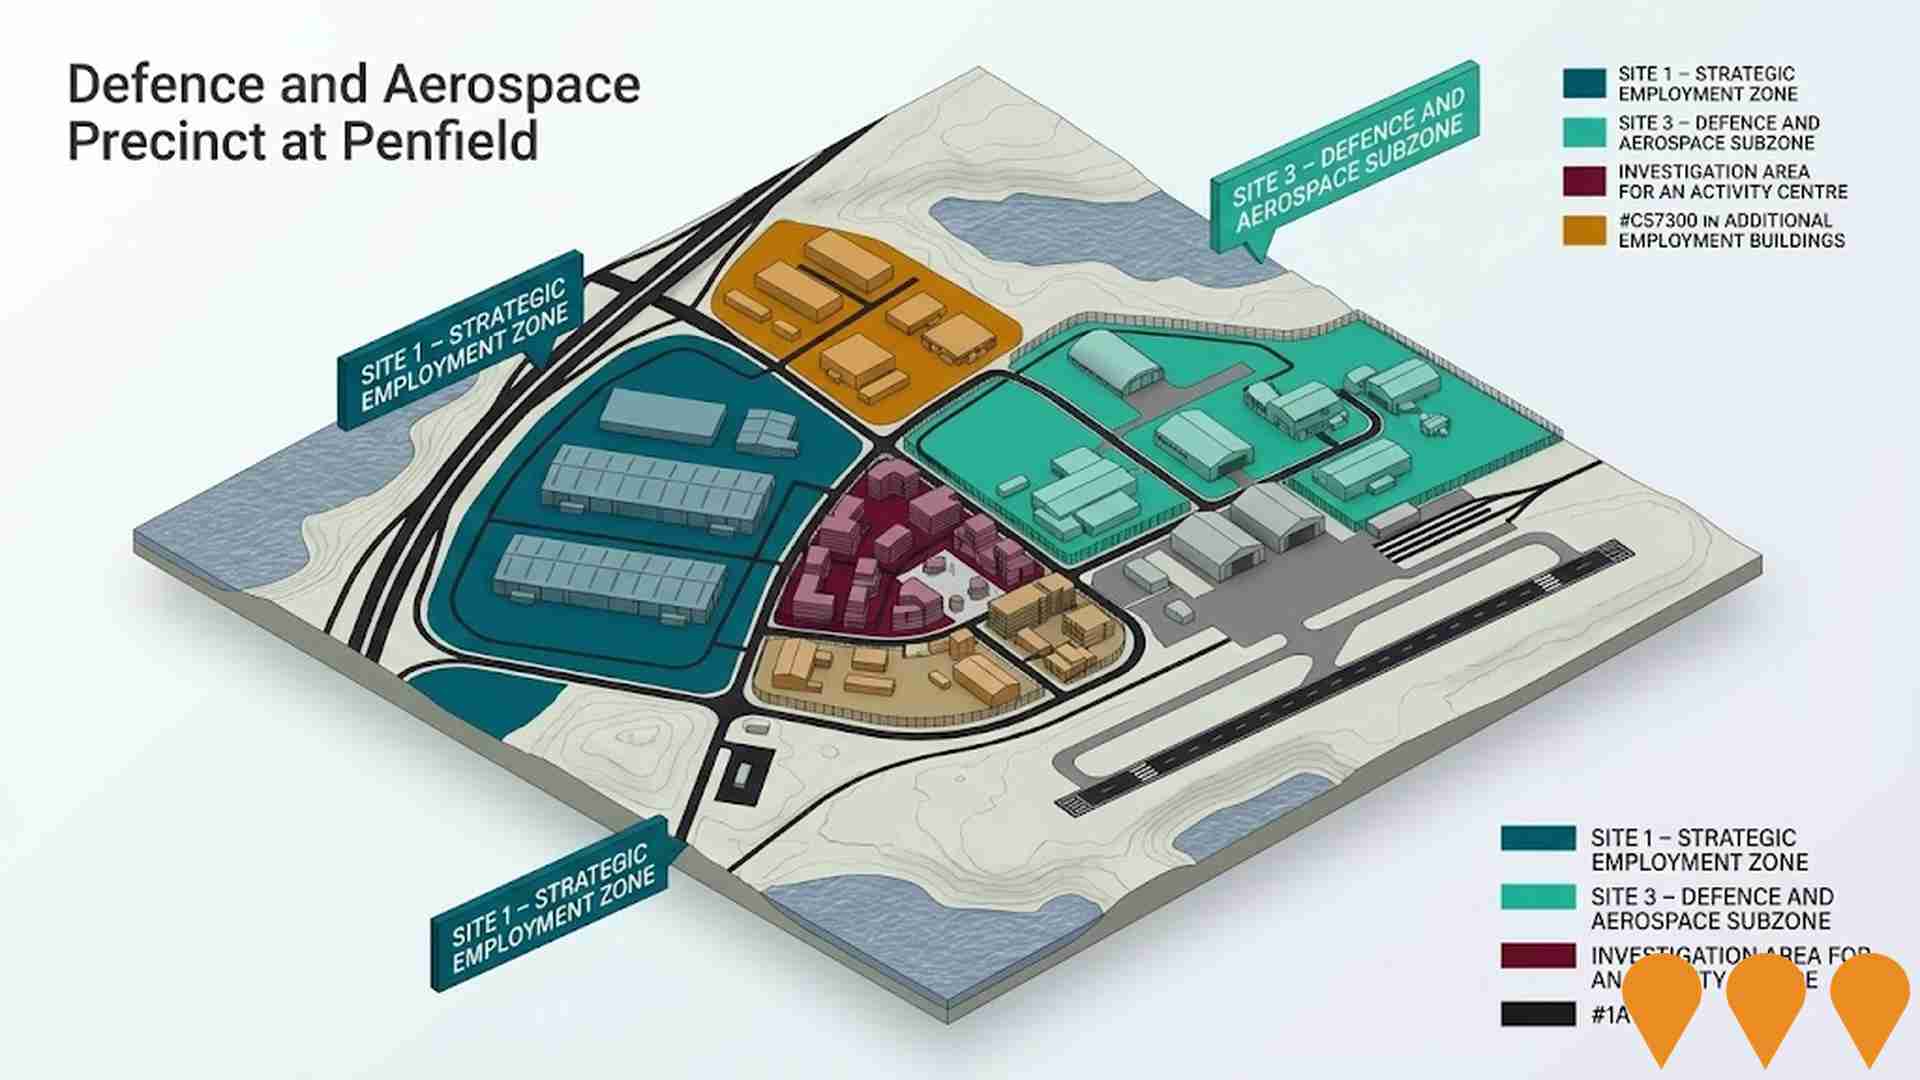
Defence and Aerospace Precinct at Penfield
Specialized defence and aerospace manufacturing precinct leveraging proximity to RAAF Base Edinburgh. Designed to support advanced manufacturing, research and development, and defence industry supply chains. Features secure facilities and specialized infrastructure for aerospace technologies.
Edinburgh Central Mixed Use Development
Premier Defence, Innovation and Technology Hub in northern Adelaide. 3-hectare corner site featuring 8 retail tenancies (Stage 1 complete), 140-place purpose-built childcare centre, 15 mixed use warehouse/office units and 2 commercial buildings (Stage 2 under construction). Located in Edinburgh Defence Precinct near BAE Systems, Defence Science Technology Group and RAAF Base Edinburgh with Zone 3/4 defence compatibility.

Blakes Crossing
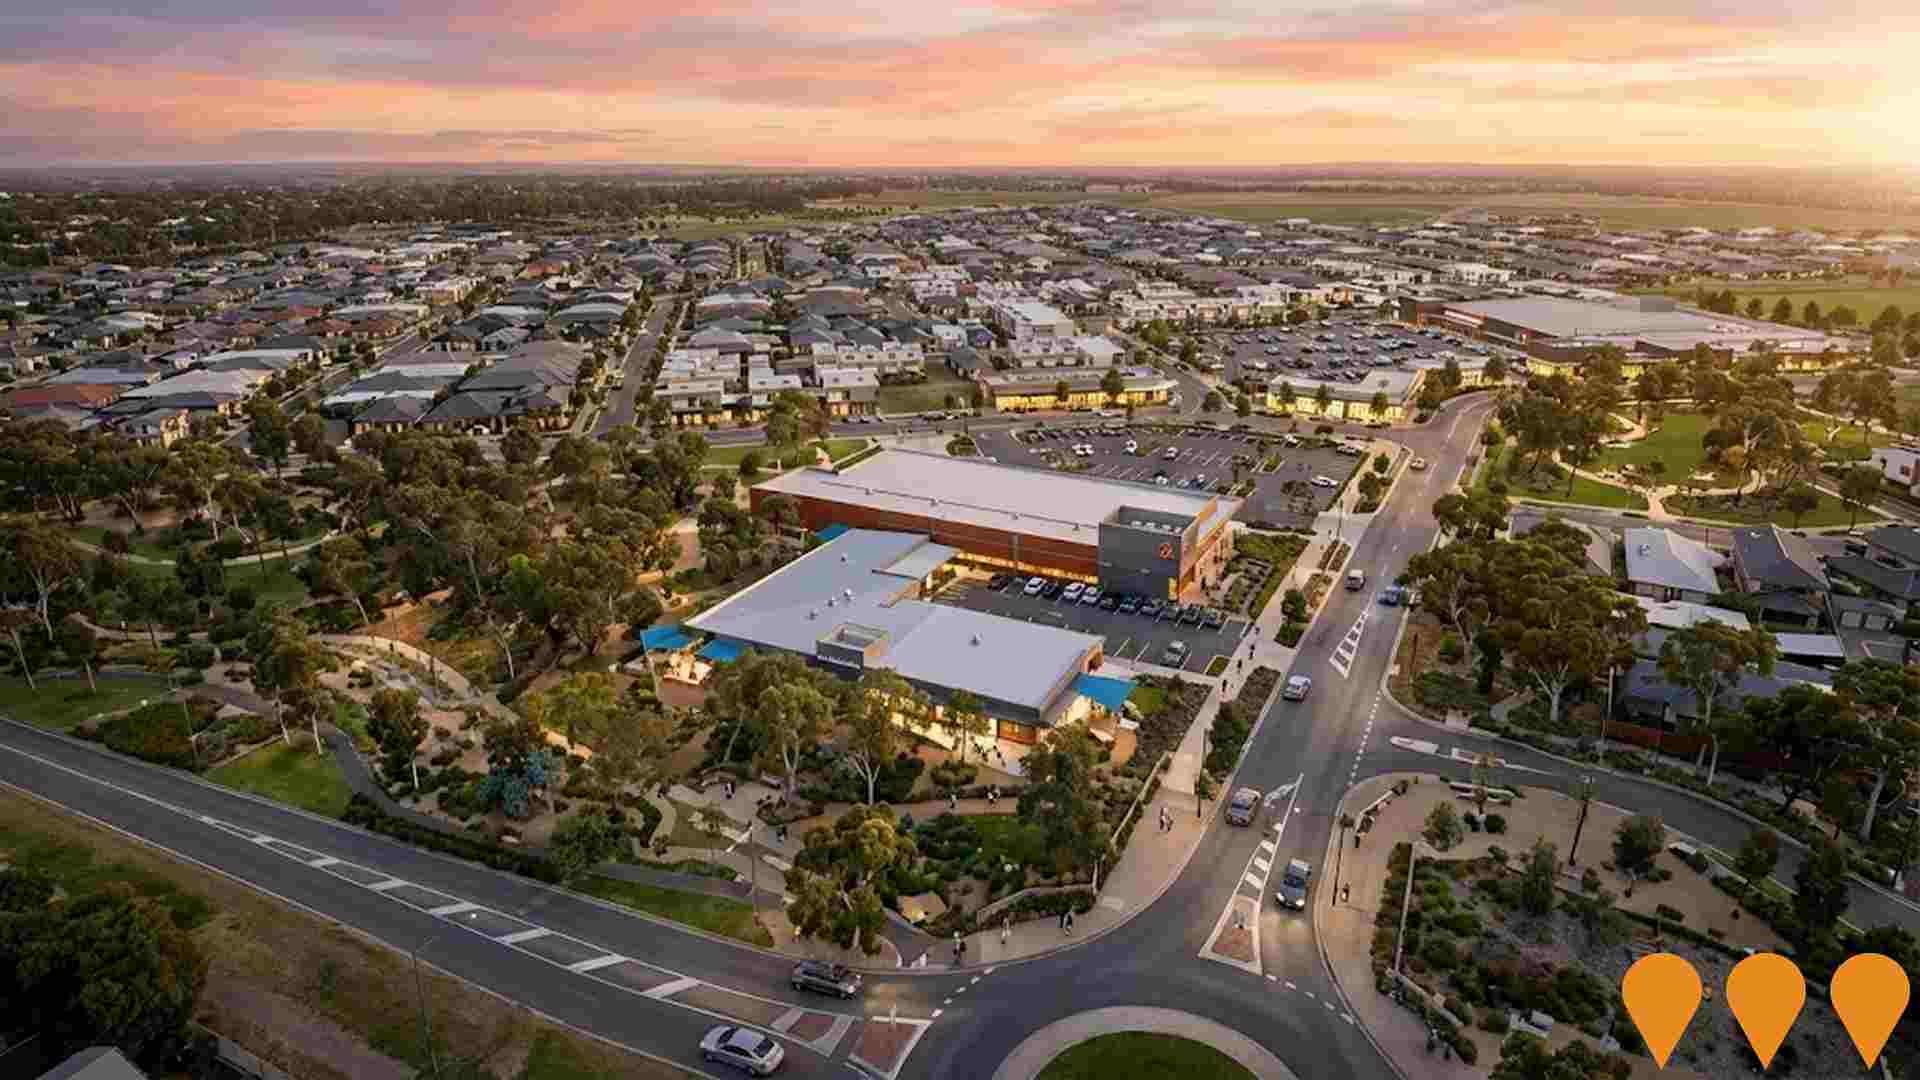
90-hectare master-planned community development by Lendlease Group creating home for approximately 4,000 residents. Premium location offering country tranquility with urban convenience. Features town centre, medical facilities, schools, and extensive recreational amenities. Award-winning urban design and sustainable development practices by one of Australia's leading developers.
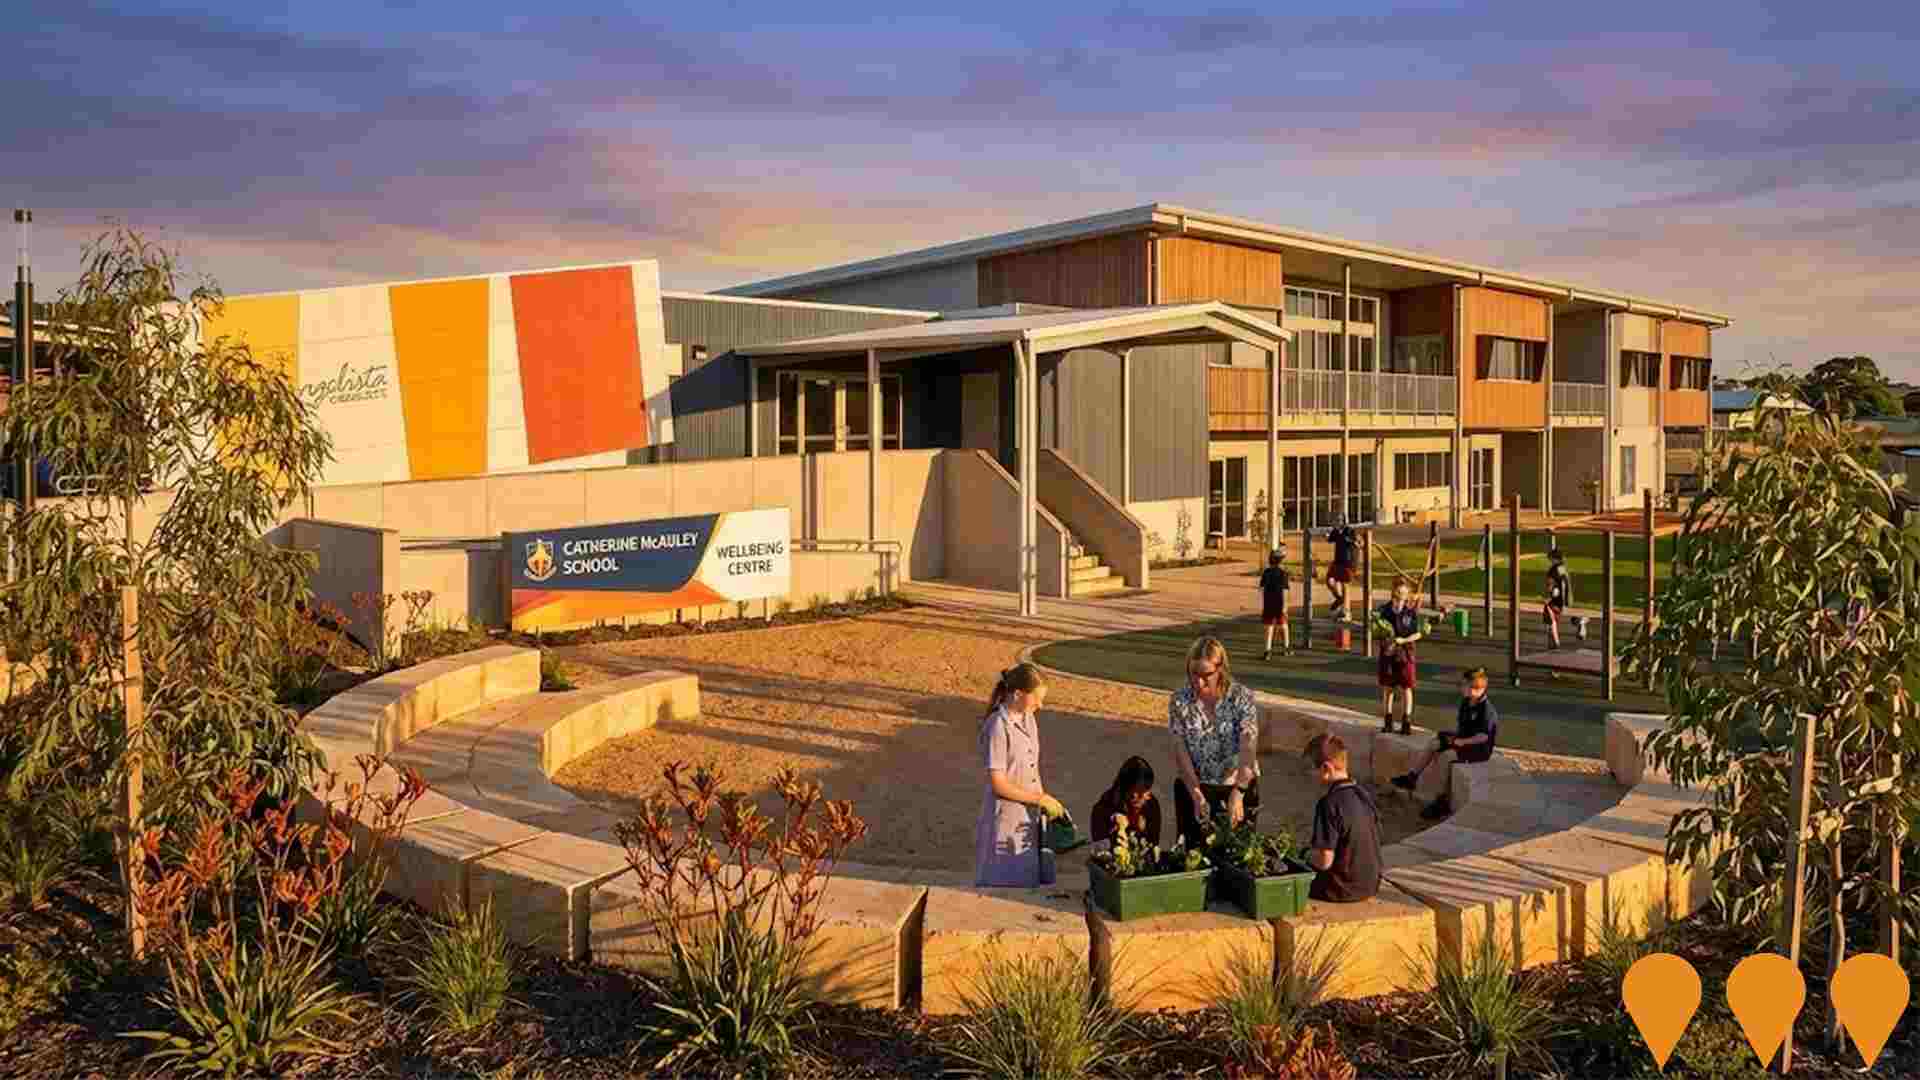
Catherine McAuley School Upgrade
Multimillion-dollar two-storey building upgrade at this Reception to Year 6 Catholic primary school. The development includes three modern classrooms, a wellbeing centre with therapy consultation spaces, a new student services hub, a dedicated playgroup space for young learners, and revitalized outdoor areas featuring a mini amphitheatre, green spaces, and native gardens. Construction commenced in September 2025, with the facility expected to be ready for Reception 2027 students. The upgrade responds to steadily increasing enrollment over the past three years and strengthens the school's commitment to holistic student wellbeing and community growth.
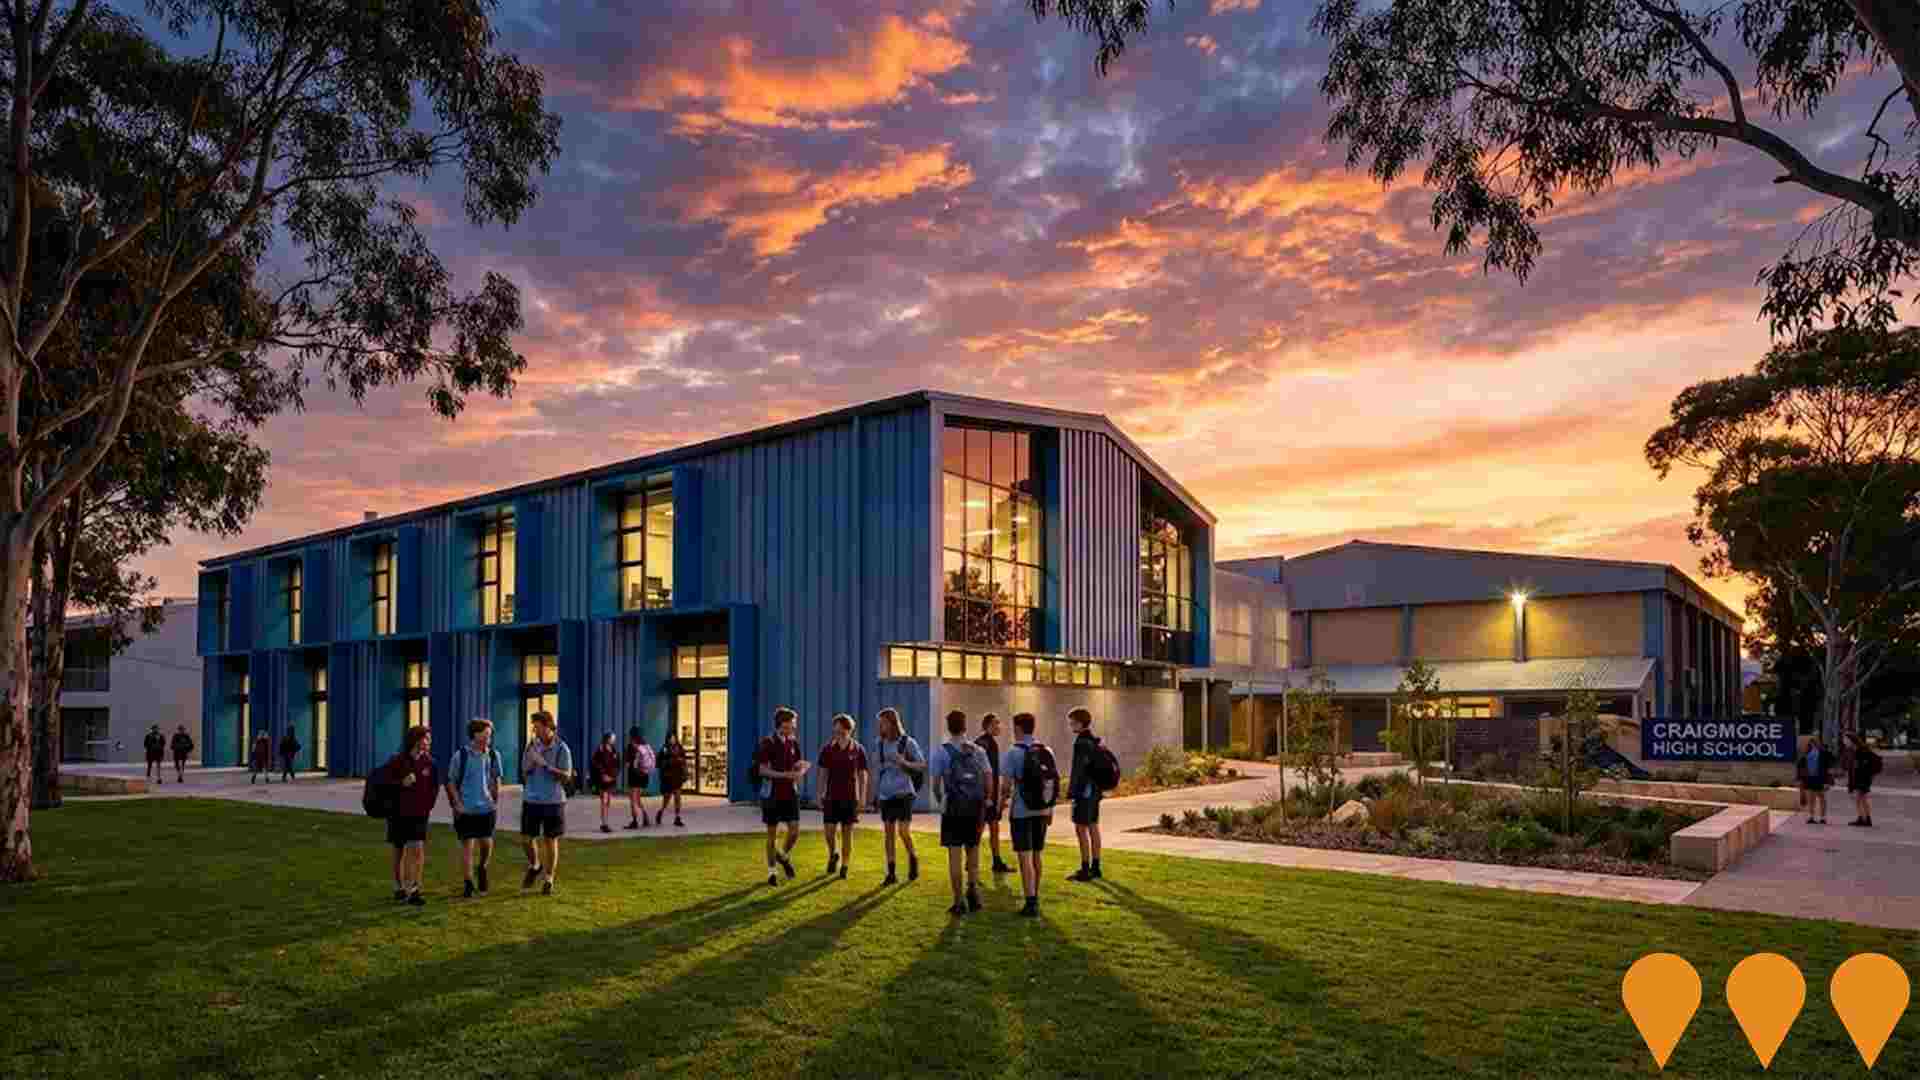
Craigmore High School Major Upgrades
Major facility upgrade including a new 2-storey learning centre with general learning areas, dance studio, visual arts and music rooms, breakout spaces and staff preparation areas. The project also included an upgrade and extension of the existing gymnasium with air conditioning and 3 new learning spaces, a new modular building with 2 general learning areas, art space, food tech space and additional facilities, provision of additional toilets, and refurbishment of existing toilet and change room facilities. The upgrade provided world-class facilities to support the transition of Year 7 students into high school.
Employment
Craigmore - Blakeview has seen below average employment performance when compared to national benchmarks
Craigmore - Blakeview has a balanced workforce with white and blue collar jobs, prominent essential services sectors, an unemployment rate of 4.8%, and estimated employment growth of 1.3% in the past year as of September 2025. In this period, 10,761 residents were employed while the unemployment rate was 0.9% higher than Greater Adelaide's rate of 3.9%.
Workforce participation was at 65.1%, similar to Greater Adelaide's 61.7%. Major employment industries included health care & social assistance, retail trade, and manufacturing, with manufacturing particularly notable at 1.5 times the regional average. Professional & technical services had limited presence with 2.8% employment compared to 7.3% regionally. The area appears to offer limited local employment opportunities based on Census data comparisons.
Between September 2024 and September 2025, employment levels increased by 1.3% and labour force grew by 1.4%, with unemployment remaining essentially unchanged. In contrast, Greater Adelaide saw employment rise by 3.0%, labour force grow by 2.9%, and unemployment fall by 0.1 percentage points. State-level data to 25-Nov-25 shows SA employment grew by 1.19% year-on-year, adding 10,710 jobs, with the state unemployment rate at 4.0%. This compares favourably to the national unemployment rate of 4.3%, with SA's employment growth outpacing the national average of 0.14%. National employment forecasts from May-25 project a 6.6% increase over five years and 13.7% over ten years. Applying these projections to Craigmore - Blakeview's employment mix suggests local employment should increase by 6.0% over five years and 12.9% over ten years, though this is a simplified extrapolation for illustrative purposes and does not account for localised population projections.
Frequently Asked Questions - Employment
Income
Income levels sit below national averages according to AreaSearch assessment
Craigmore - Blakeview SA2's median income among taxpayers was $50,809 in financial year 2022, according to latest ATO data aggregated by AreaSearch. The average income stood at $55,687 during the same period. These figures are lower than those for Greater Adelaide, which were $52,592 and $64,886 respectively. By September 2025, estimates based on Wage Price Index growth of 12.83% suggest median income will be approximately $57,328, with average income at around $62,832. The 2021 Census shows household, family and personal incomes in Craigmore - Blakeview rank modestly, between the 39th and 41st percentiles. Most locals (38.9%, or 8,325 people) fall into the $1,500 - $2,999 income category, similar to surrounding regions where 31.8% occupy this range. After housing expenses, 85.0% of income remains for other expenditures.
Frequently Asked Questions - Income
Housing
Craigmore - Blakeview is characterized by a predominantly suburban housing profile, with above-average rates of outright home ownership
Craigmore-Blakeview's dwelling structure, as per the latest Census, had 98.5% houses and 1.5% other dwellings (semi-detached, apartments, 'other' dwellings), contrasting with Adelaide metro's 83.7% houses and 16.2% other dwellings. Home ownership in Craigmore-Blakeview was higher than Adelaide metro at 22.2%, with the rest mortgaged (51.9%) or rented (25.9%). The median monthly mortgage repayment was $1,337, above Adelaide metro's average of $1,300, while median weekly rent was $310 compared to Adelaide metro's $265. Nationally, Craigmore-Blakeview's mortgage repayments were lower at $1,337 than the Australian average of $1,863, and rents were substantially below the national figure of $375.
Frequently Asked Questions - Housing
Household Composition
Craigmore - Blakeview features high concentrations of family households, with a higher-than-average median household size
Family households account for 77.9% of all households, including 35.0% couples with children, 25.4% couples without children, and 16.5% single parent families. Non-family households constitute the remaining 22.1%, with lone person households at 19.7% and group households making up 2.4%. The median household size is 2.8 people, larger than the Greater Adelaide average of 2.6.
Frequently Asked Questions - Households
Local Schools & Education
Craigmore - Blakeview faces educational challenges, with performance metrics placing it in the bottom quartile of areas assessed nationally
The area's university qualification rate is 11.6%, significantly lower than the Australian average of 30.4%. This disparity presents both a challenge and an opportunity for targeted educational initiatives. Bachelor degrees are most common at 8.5%, followed by postgraduate qualifications (1.6%) and graduate diplomas (1.5%). Vocational credentials are prevalent, with 40.4% of residents aged 15+ holding them, including advanced diplomas (9.6%) and certificates (30.8%).
Educational participation is high, with 30.2% of residents currently enrolled in formal education. This includes primary education (12.8%), secondary education (7.7%), and tertiary education (3.7%).
Frequently Asked Questions - Education
Schools Detail
Nearby Services & Amenities
Transport
Transport servicing is low compared to other areas nationally based on assessment of service frequency, route connectivity and accessibility
Craigmore-Blakeview has 73 active public transport stops, all bus routes. These are serviced by 11 different routes, offering a total of 744 weekly passenger trips. Residents have good accessibility to these stops, with an average distance of 250 meters to the nearest one.
The service frequency is 106 trips per day across all routes, which amounts to about 10 weekly trips per stop.
Frequently Asked Questions - Transport
Transport Stops Detail
Health
Health performance in Craigmore - Blakeview is lower than average with common health conditions somewhat prevalent across the board, though to a considerably higher degree among older age cohorts
Craigmore-Blakeview faces significant health challenges with common health conditions prevalent among its population. Mental health issues impact 10.5% of residents, while asthma affects 9.5%.
Approximately 64.7% of residents declare themselves completely clear of medical ailments, compared to 63.4% across Greater Adelaide. The area has a low rate of private health cover at approximately 48%, with the national average being 55.3%. This is based on data from ~10,187 people. The population aged 65 and over stands at 13.8% (2,942 people). Health outcomes among seniors require more attention than those of the broader population.
Frequently Asked Questions - Health
Cultural Diversity
In terms of cultural diversity, Craigmore - Blakeview records figures broadly comparable to the national average, as found in AreaSearch's assessment of a number of language and cultural background related metrics
Craigmore-Blakeview has a higher than average cultural diversity, with 21.3% of its population born overseas and 11.5% speaking a language other than English at home. Christianity is the predominant religion in Craigmore-Blakeview, accounting for 38.6% of its population. The category 'Other' comprises 1.1%, slightly higher than Greater Adelaide's 1.3%.
In terms of ancestry, the top three groups are English (34.5%), Australian (27.9%), and Other (8.4%). Notably, German ancestry is overrepresented at 4.6% compared to the regional average of 4.4%, while Russian and Welsh ancestries are also higher than the regional averages at 0.4% and 0.6% respectively.
Frequently Asked Questions - Diversity
Age
Craigmore - Blakeview hosts a young demographic, positioning it in the bottom quartile nationwide
Craigmore-Blakeview has a median age of 34 years, which is lower than Greater Adelaide's average of 39 and Australia's median of 38. Compared to Greater Adelaide, Craigmore-Blakeview has a higher proportion of residents aged 5-14 (15.1%) but fewer residents aged 75-84 (4.4%). Between the 2021 Census and now, the population aged 65-74 has increased from 6.8% to 7.8%, while the 45-54 age group has decreased from 12.3% to 11.4%. By 2041, demographic modeling predicts significant changes in Craigmore-Blakeview's age profile. The 45-54 age cohort is projected to grow by 45%, adding 1,098 residents to reach a total of 3,538.
