Chart Color Schemes
This analysis uses ABS Statistical Areas Level 2 (SA2) boundaries, which can materially differ from Suburbs and Localities (SAL) even when sharing similar names.
SA2 boundaries are defined by the Australian Bureau of Statistics and are designed to represent communities for statistical reporting (e.g., census and ERP).
Suburbs and Localities (SAL) represent commonly-used suburb/locality names (postal-style areas) and may use different geographic boundaries. For comprehensive analysis, consider reviewing both boundary types if available.
est. as @ -- *
ABS ERP | -- people | --
2021 Census | -- people
Sales Activity
Curious about local property values? Filter the chart to assess the volume and appreciation (including resales) trends and regional comparisons, or scroll to the map below view this information at an individual property level.
Find a Recent Sale
Sales Detail
Population
Population growth drivers in Elizabeth are above average based on AreaSearch's ranking of recent, and medium to long-term trends
Elizabeth's population was approximately 11,513 as of November 2025. This figure represents an increase of 684 people, a 6.3% rise from the 2021 Census count of 10,829 individuals. The growth is inferred from the Australian Bureau of Statistics' estimated resident population of 11,461 in June 2024 and an additional 58 validated new addresses since the Census date. This results in a population density of 1,243 persons per square kilometer, higher than the average across national locations assessed by AreaSearch. Elizabeth's growth rate of 6.3% since the census is within 0.8 percentage points of the state's growth rate of 7.1%, indicating competitive growth fundamentals. The population growth was primarily driven by overseas migration, contributing approximately 85.0% of overall population gains during recent periods.
AreaSearch adopts ABS/Geoscience Australia projections for each SA2 area, released in 2024 with a base year of 2022. For areas not covered and years post-2032, the SA State Government's Regional/LGA projections by age category are used, based on 2021 data and released in 2023, with adjustments made employing a method of weighted aggregation of population growth from LGA to SA2 levels. Future demographic trends anticipate a significant population increase in the top quartile of statistical areas analysed by AreaSearch, with an expected increase of 3,888 persons to 2041 based on the latest annual ERP population numbers, reflecting a total increase of 33.3% over the 17-year period.
Frequently Asked Questions - Population
Development
Recent residential development output has been above average within Elizabeth when compared nationally
Elizabeth has recorded approximately 28 residential properties granted approval annually. Over the past five financial years, from FY-21 to FY-25143 homes were approved, with a further 30 approved in FY-26. On average, about four people have moved to the area each year for every dwelling built during these years.
This has resulted in supply lagging demand, leading to heightened buyer competition and pricing pressures. The average construction cost value of new homes being built is around $230,000, which is below regional norms, offering more affordable housing options. In FY-26, there have been $217.0 million worth of commercial approvals, indicating robust local business investment. However, compared to Greater Adelaide, Elizabeth has significantly less development activity, 86.0% below the regional average per person. This limited new supply generally supports stronger demand and values for established homes.
Despite this, building activity has accelerated in recent years, though it remains below national averages, which may reflect the area's maturity or possible planning constraints. New developments consist of approximately 85.0% detached houses and 15.0% townhouses or apartments, maintaining Elizabeth's traditional suburban character with a focus on family homes appealing to those seeking space. Interestingly, developers are building more traditional houses than the current mix suggests (52.0% at Census), indicating continued strong demand for family homes despite density pressures. With around 322 people per dwelling approval, Elizabeth shows a developing market. According to the latest AreaSearch quarterly estimate, the area is projected to add approximately 3,836 residents by 2041. If current development rates continue, housing supply may struggle to match population growth, potentially heightening buyer competition and supporting price increases.
Frequently Asked Questions - Development
Infrastructure
Elizabeth has emerging levels of nearby infrastructure activity, ranking in the 36thth percentile nationally
Changes to local infrastructure significantly impact an area's performance. AreaSearch identified 21 projects that could affect this region. Notable ones are Playford Health Hub, Lionsgate Business Park, Northern Adelaide Transport Study, and Northern Suburbs Primary School. The following list details the most relevant projects.
Professional plan users can use the search below to filter and access additional projects.
INFRASTRUCTURE SEARCH
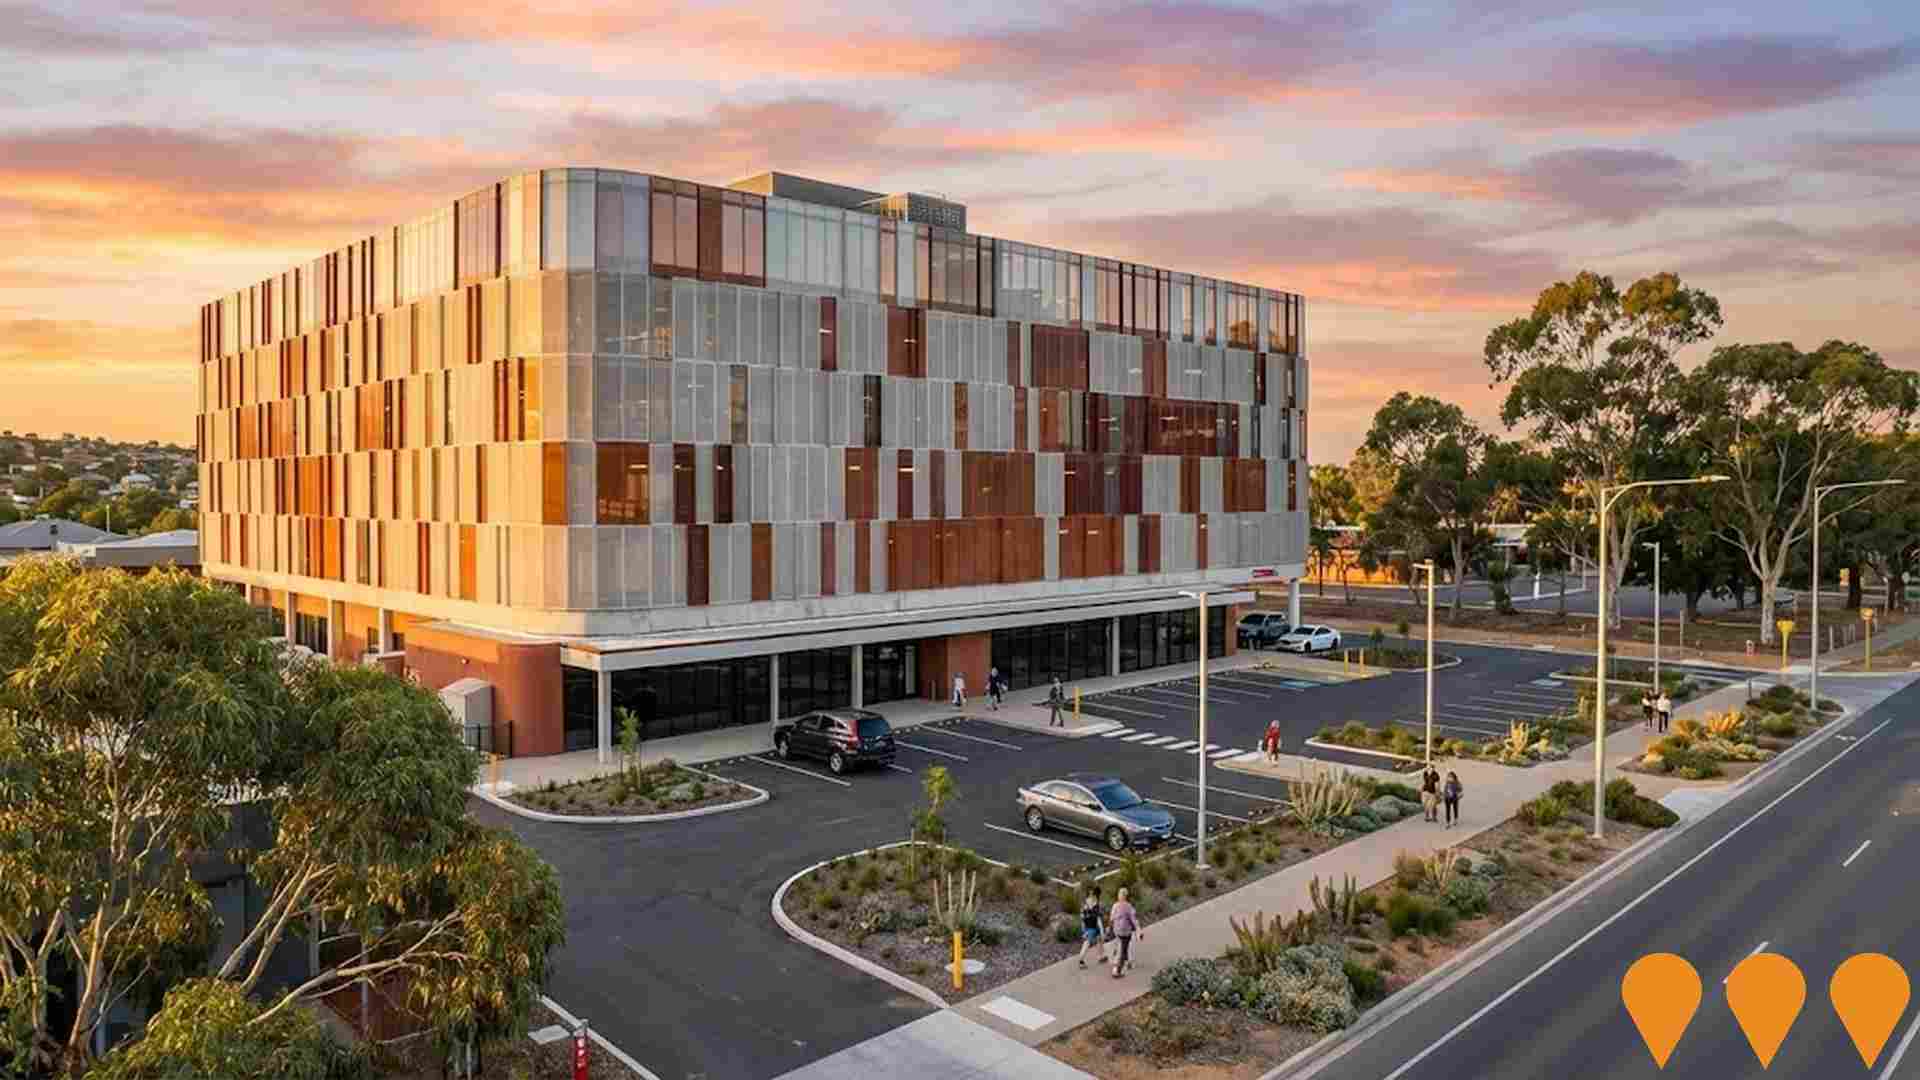
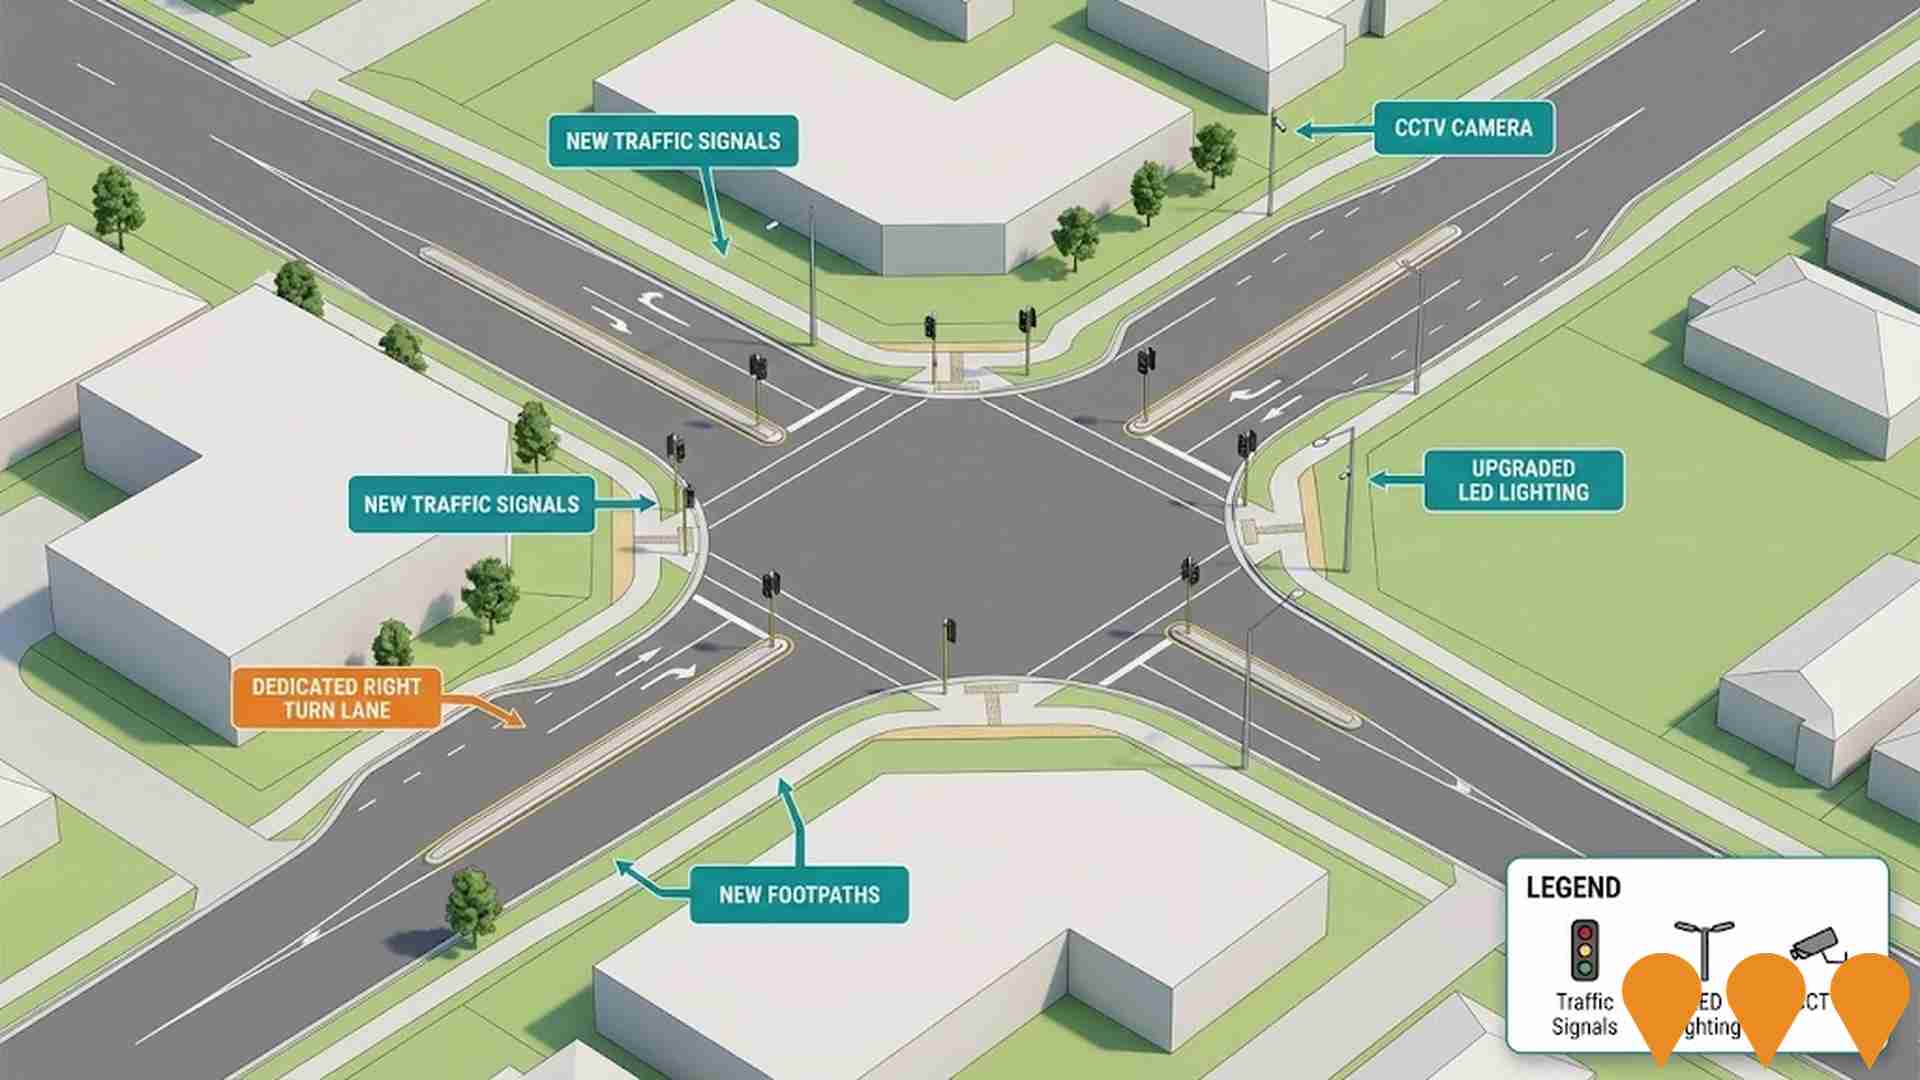
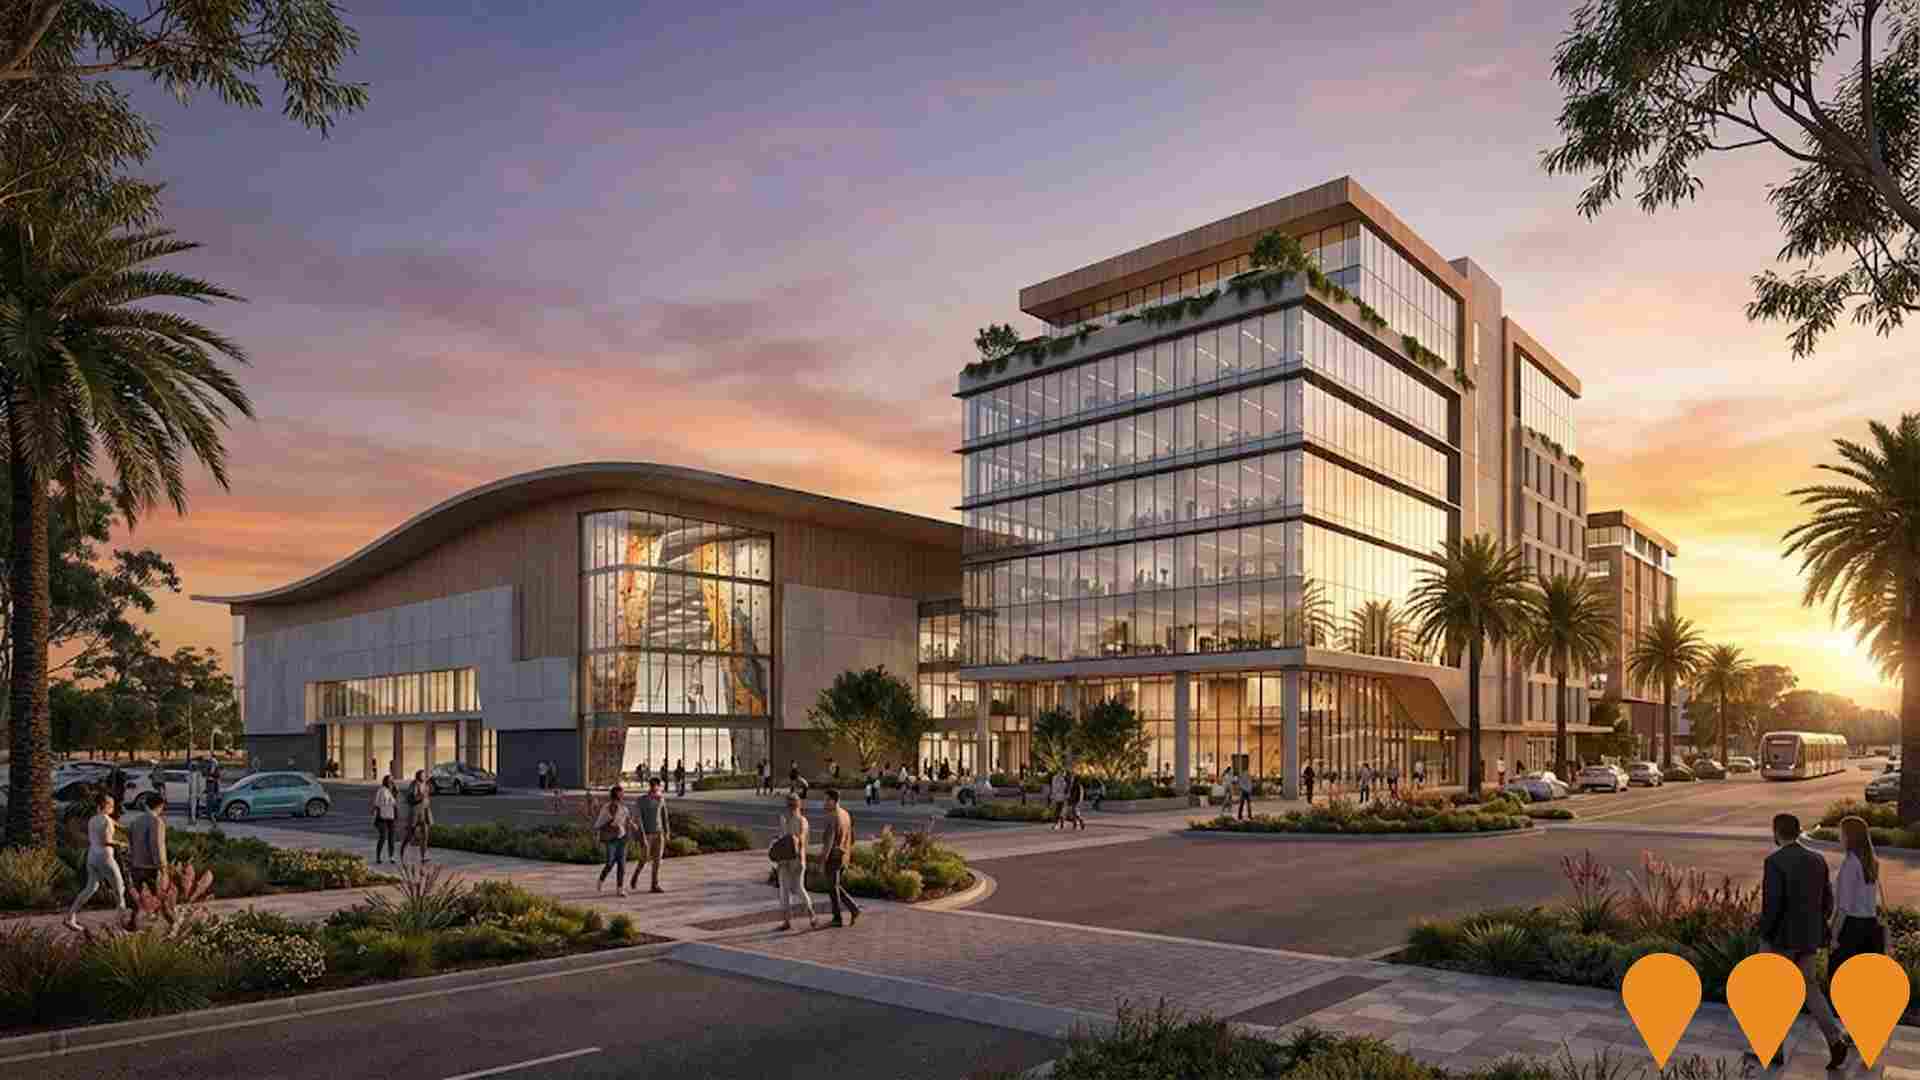
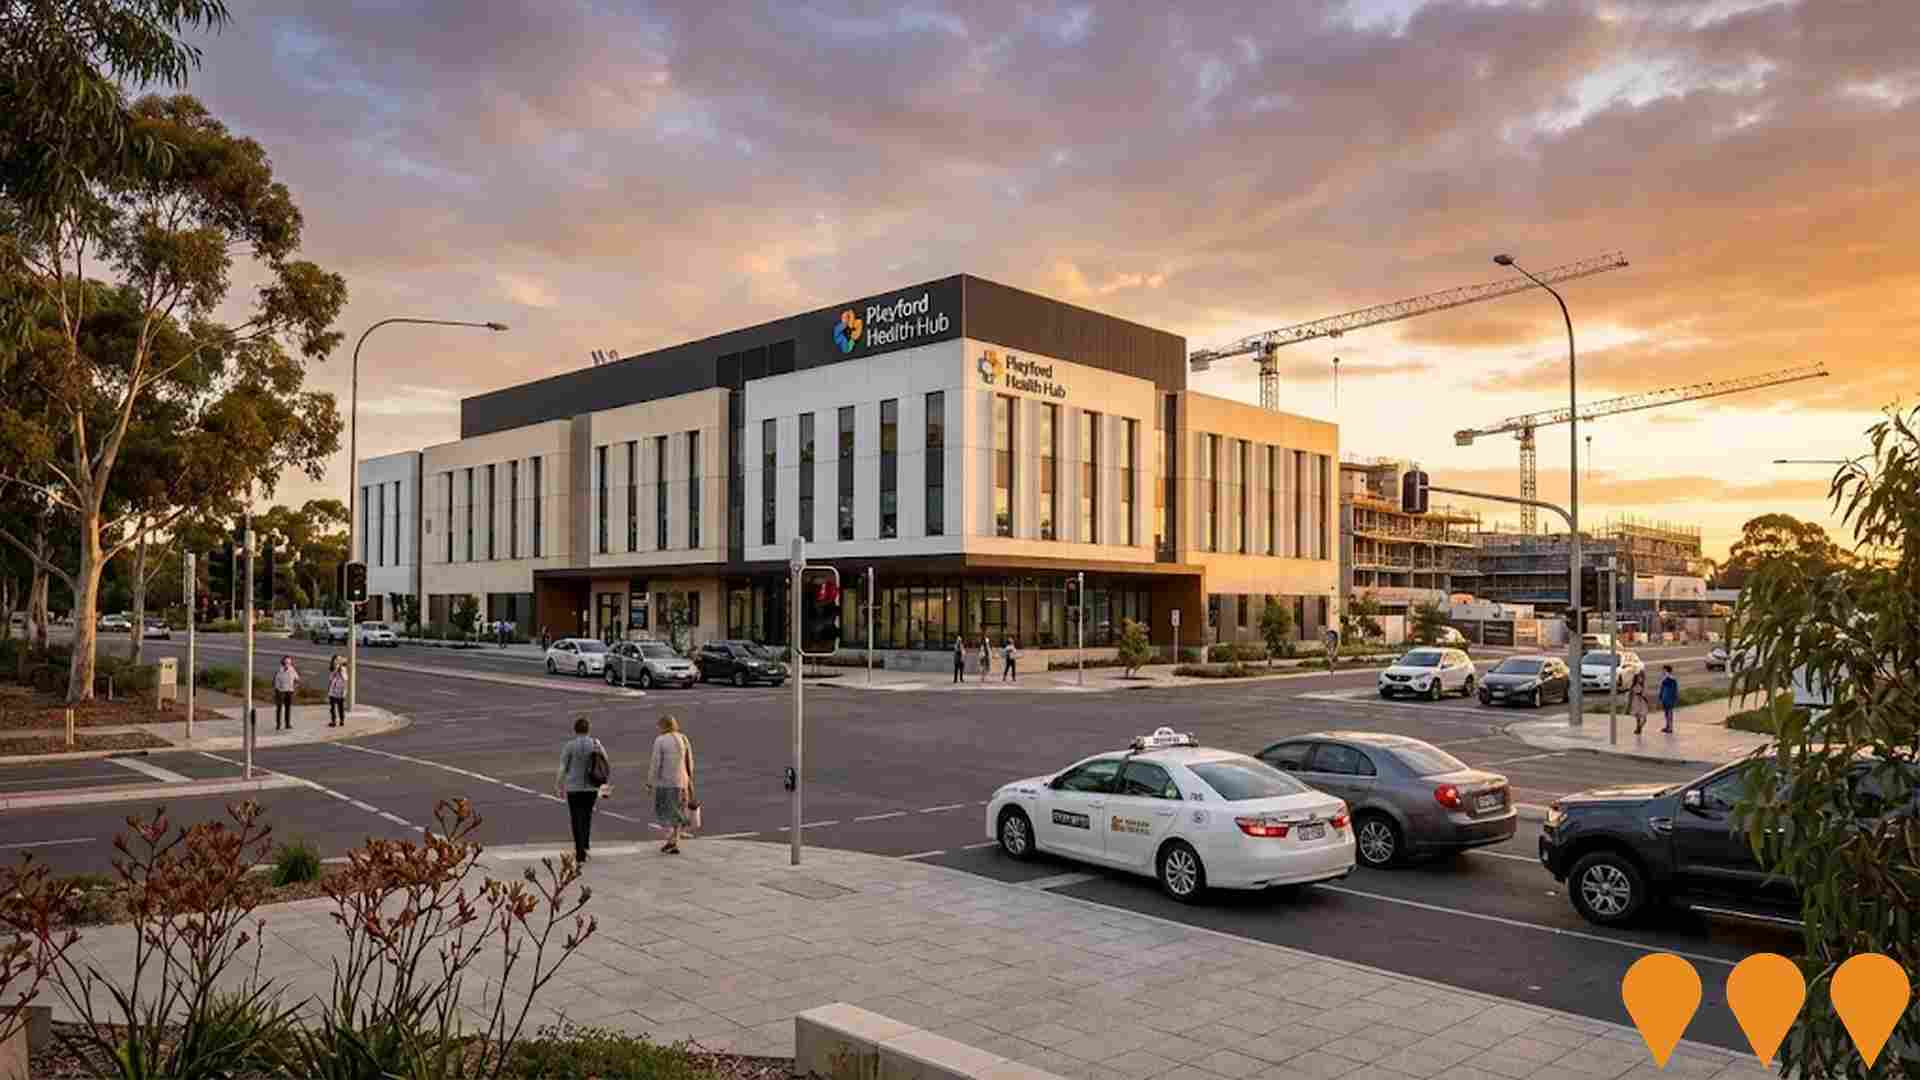
 Denotes AI-based impression for illustrative purposes only, not to be taken as definitive under any circumstances. Please follow links and conduct other investigations from the project's source for actual imagery. Developers and project owners wishing us to use original imagery please Contact Us and we will do so.
Frequently Asked Questions - Infrastructure
Playford Health Hub
Major health precinct opposite Lyell McEwin Hospital in northern Adelaide. Stage 1 (retail and 450-bay multi-deck car park) completed 2021. Stage 2 (specialist medical consulting, oncology, imaging and allied health) completed 2024. Stage 3 is a new 10-theatre, 120-bed private hospital operated by Calvary Adelaide Hospital. Construction commenced in Q4 2024 with practical completion expected mid-2027.
Northern Adelaide Transport Study
A comprehensive transport study for Northern Adelaide's inner and outer suburbs to inform future transport planning and investment. The study considers key issues and opportunities for road safety, efficiency, public transport, active transport, and strategic road corridors to support strong projected population and economic growth in the region. The study area extends from Prospect to Roseworthy and Buckland Park to Humbug Scrub/One Tree Hill.
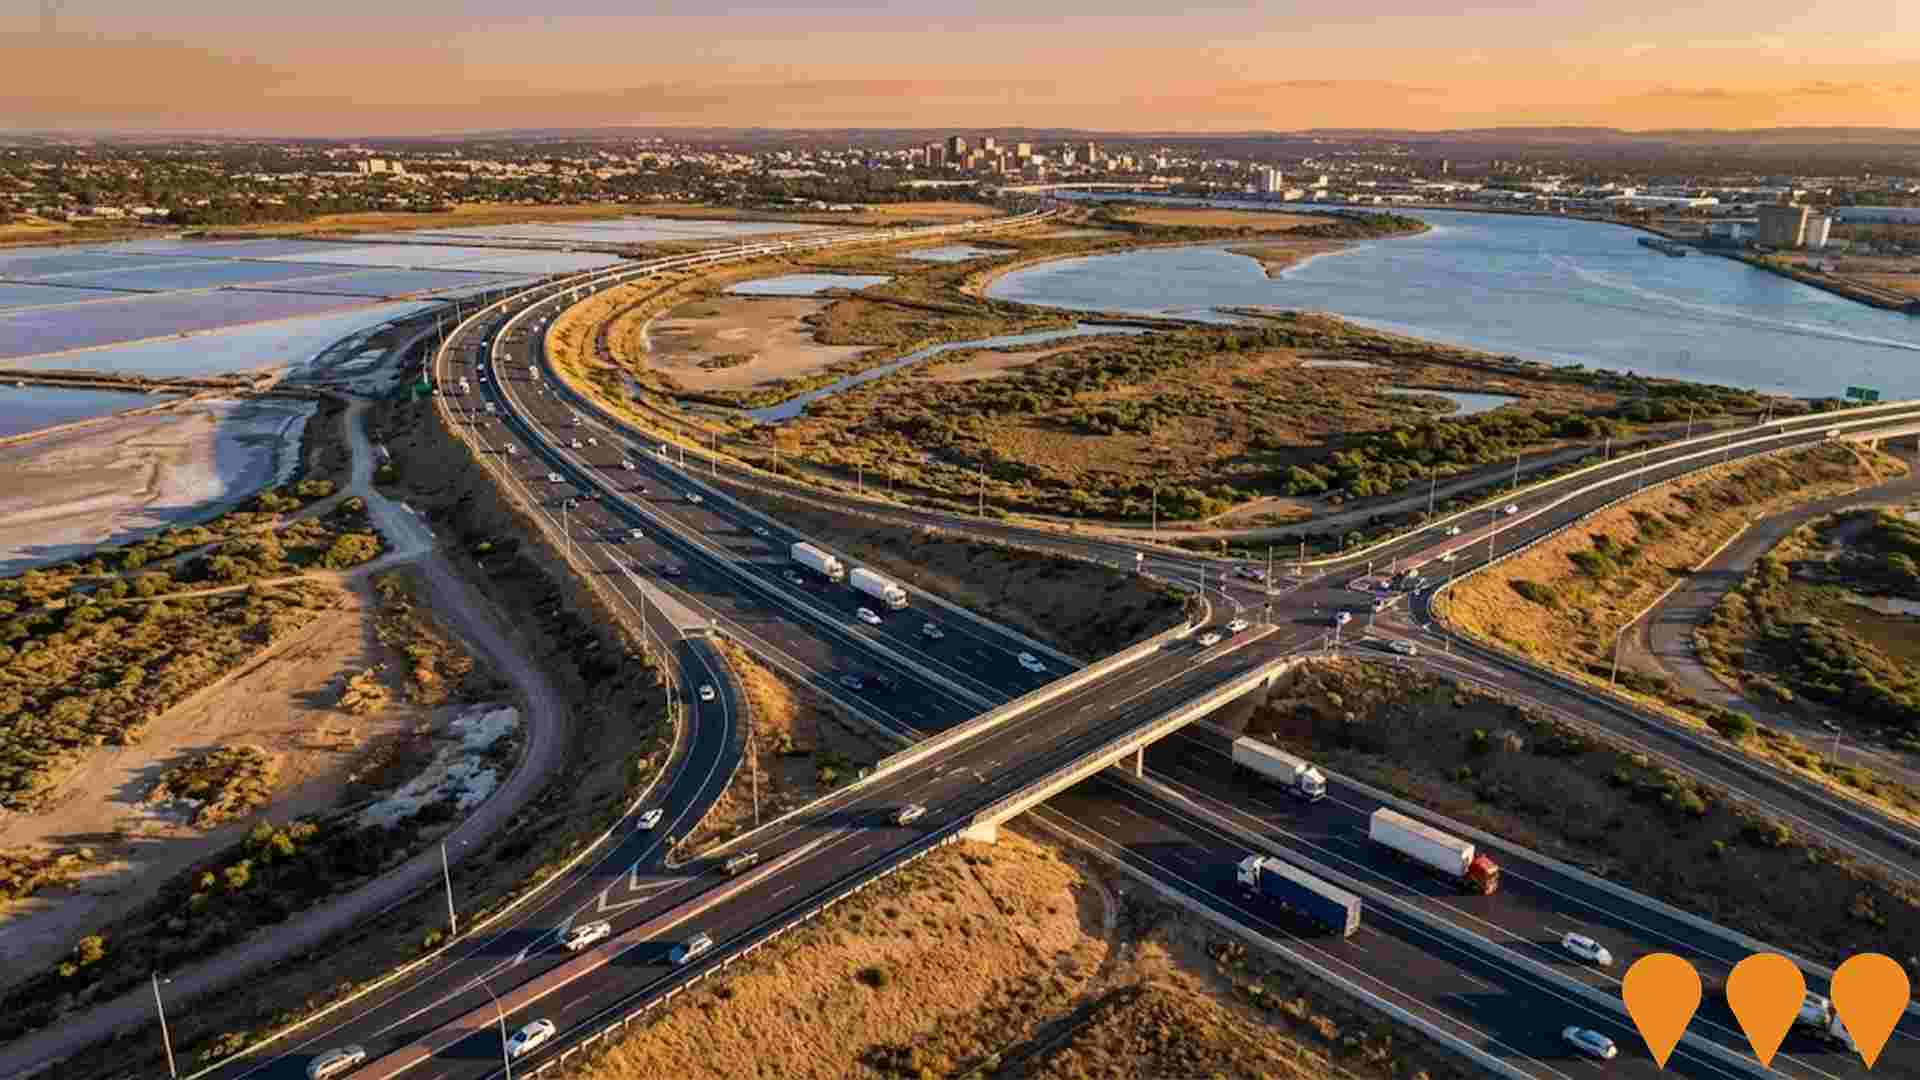
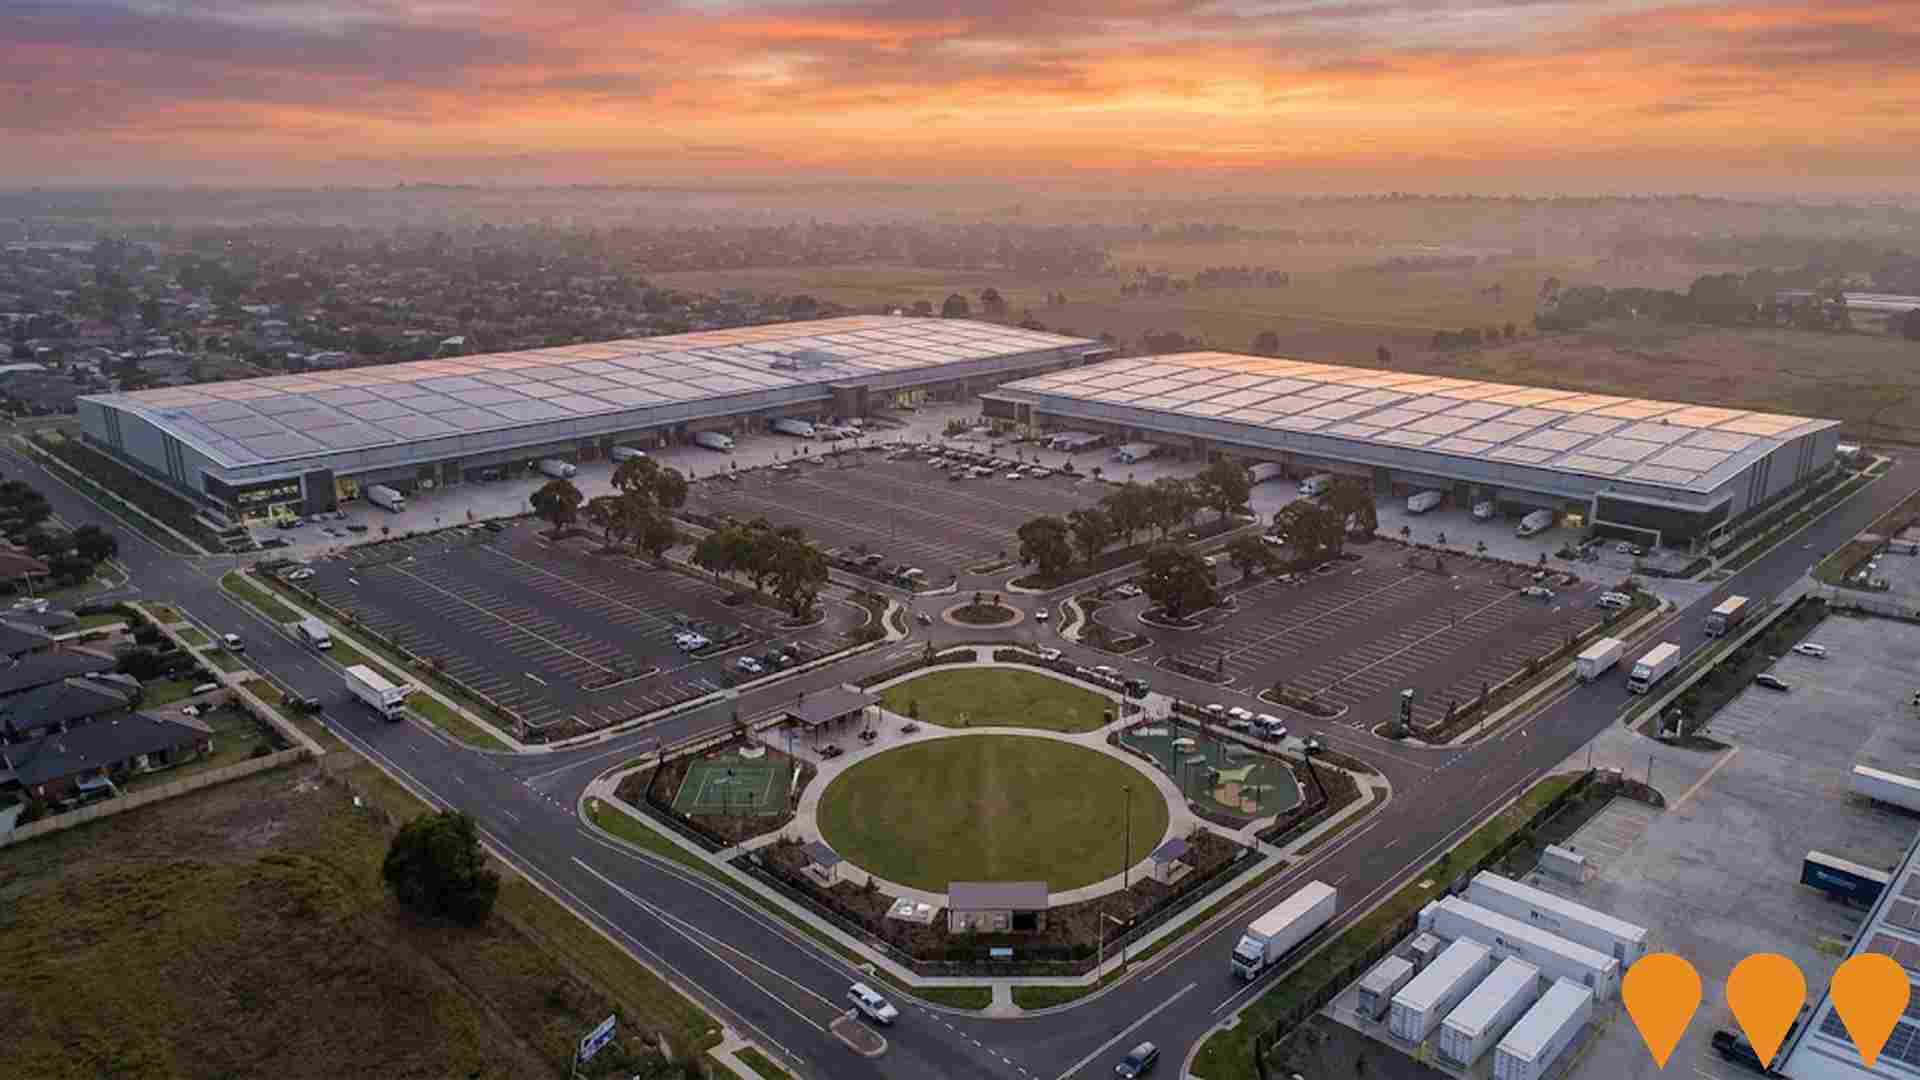
Lionsgate Business Park
123ha multi-purpose business precinct redevelopment of the former Holden site into a hub for industrial, manufacturing, construction, engineering, automotive, and commercial uses, including a focus on sustainability with an on-site rooftop solar (up to 24MW) and a 150MW battery storage facility (Lionsgate Energy Storage System). It offers flexible tenancies and features a central park and sports/recreational facilities.
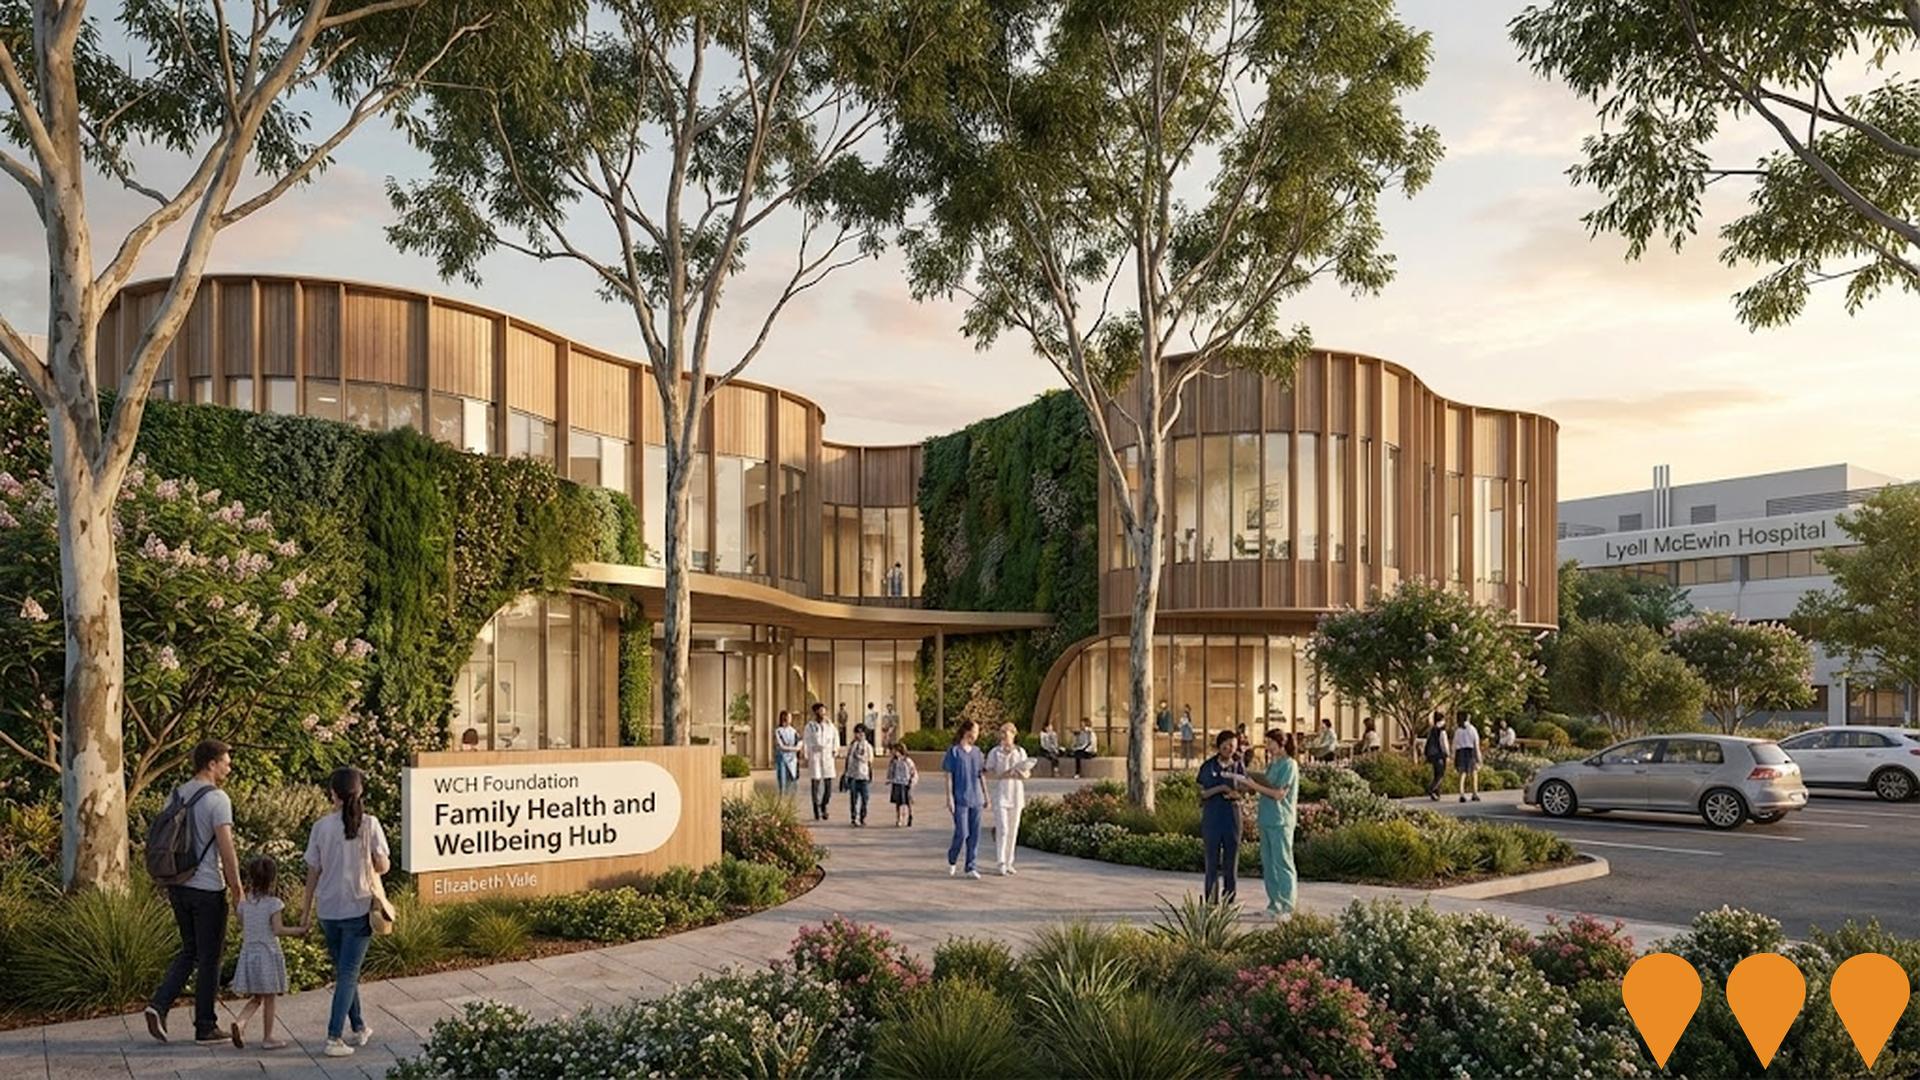
Elizabeth Vale Family Health and Wellbeing Hub
The WCH Foundation Family Health and Wellbeing Hub is a multipurpose community health facility featuring early parenting programs, perinatal and adolescent mental health support, student-led allied health clinics, and short-term residential accommodation for new mothers adjacent to the Lyell McEwin Hospital. Designed by Studio Nine Architects to create a welcoming, non-institutional environment with curved facades, extensive landscaping, and green walls. Part of the Playford Health and Wellbeing Precinct serving one of South Australia's fastest-growing communities.
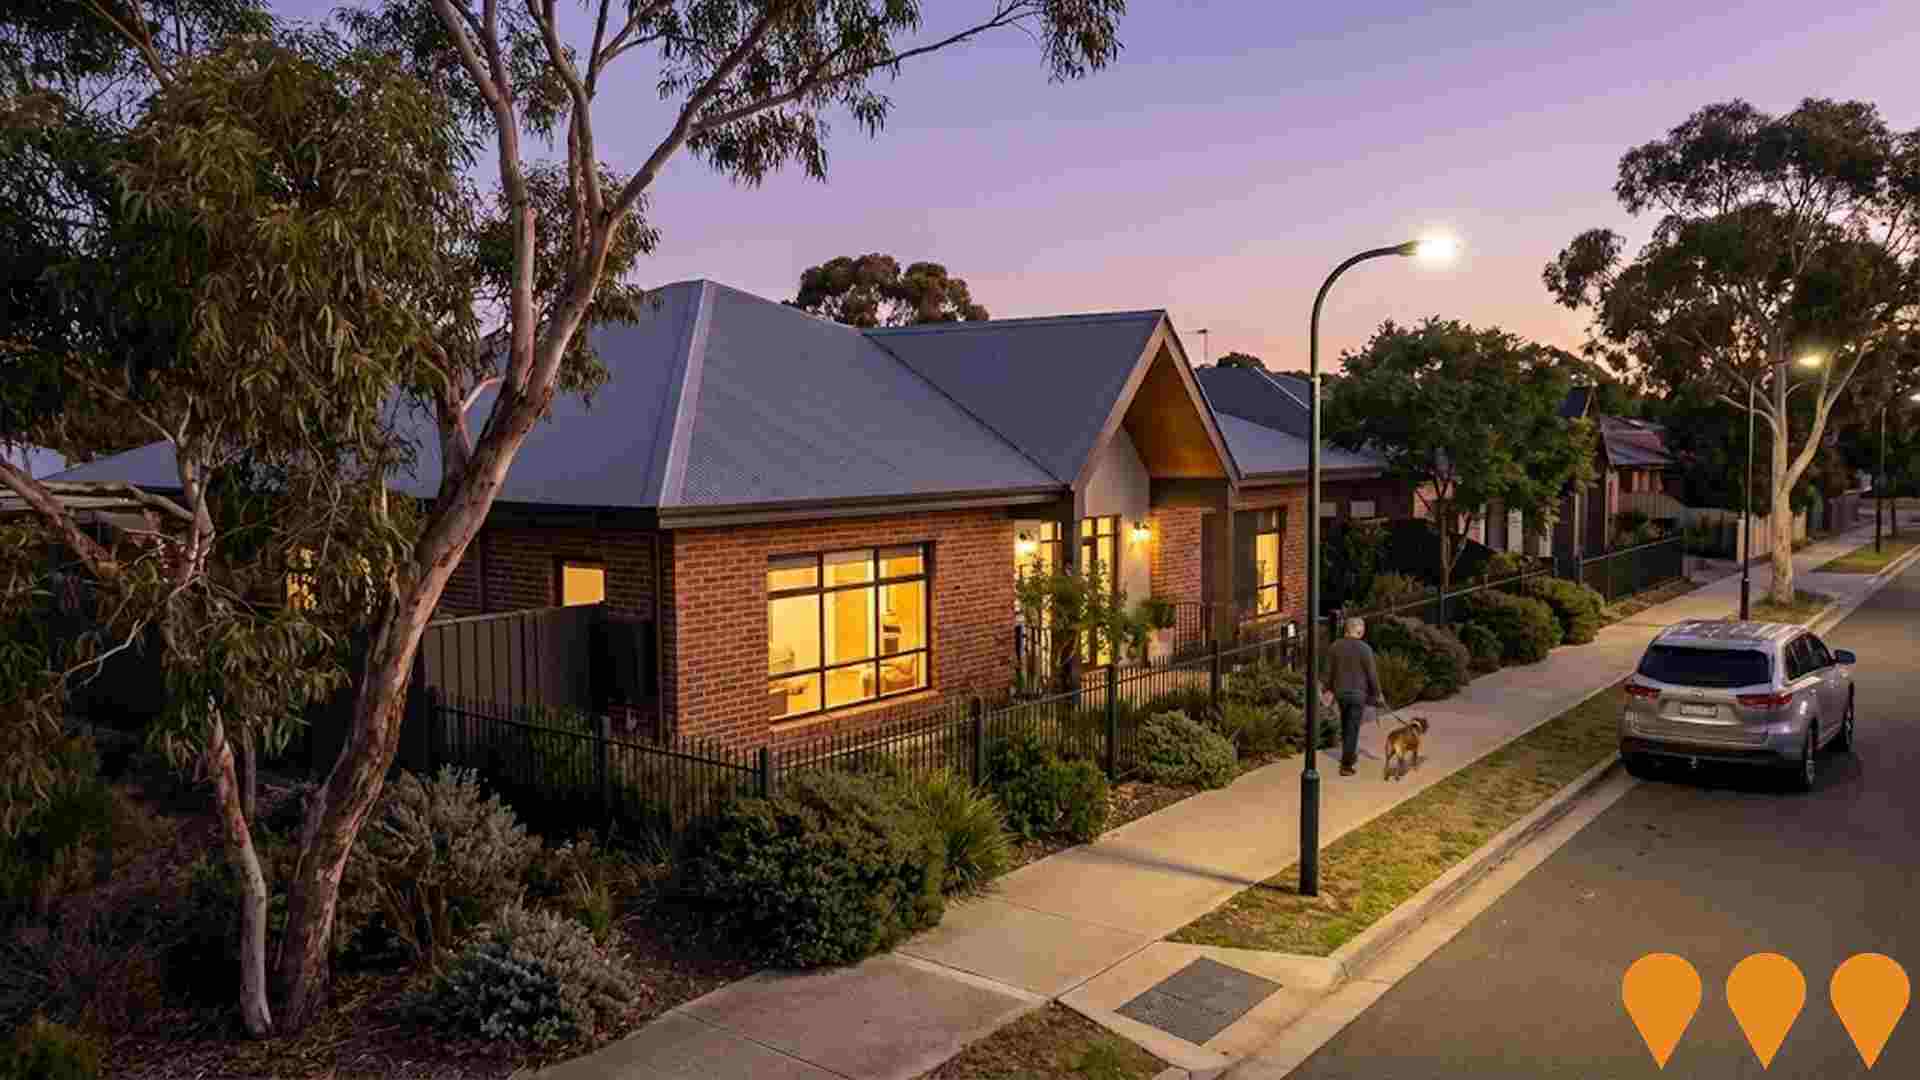
Healthia Aged Care Development
96-place residential care home comprising 8 small-scale homes with 12 private rooms each. Australia's first residential care home built to limit infectious virus spread. Partnership between ACH Group, NALHN, UniSA, and City of Playford.
Lyell McEwin Hospital Expansion
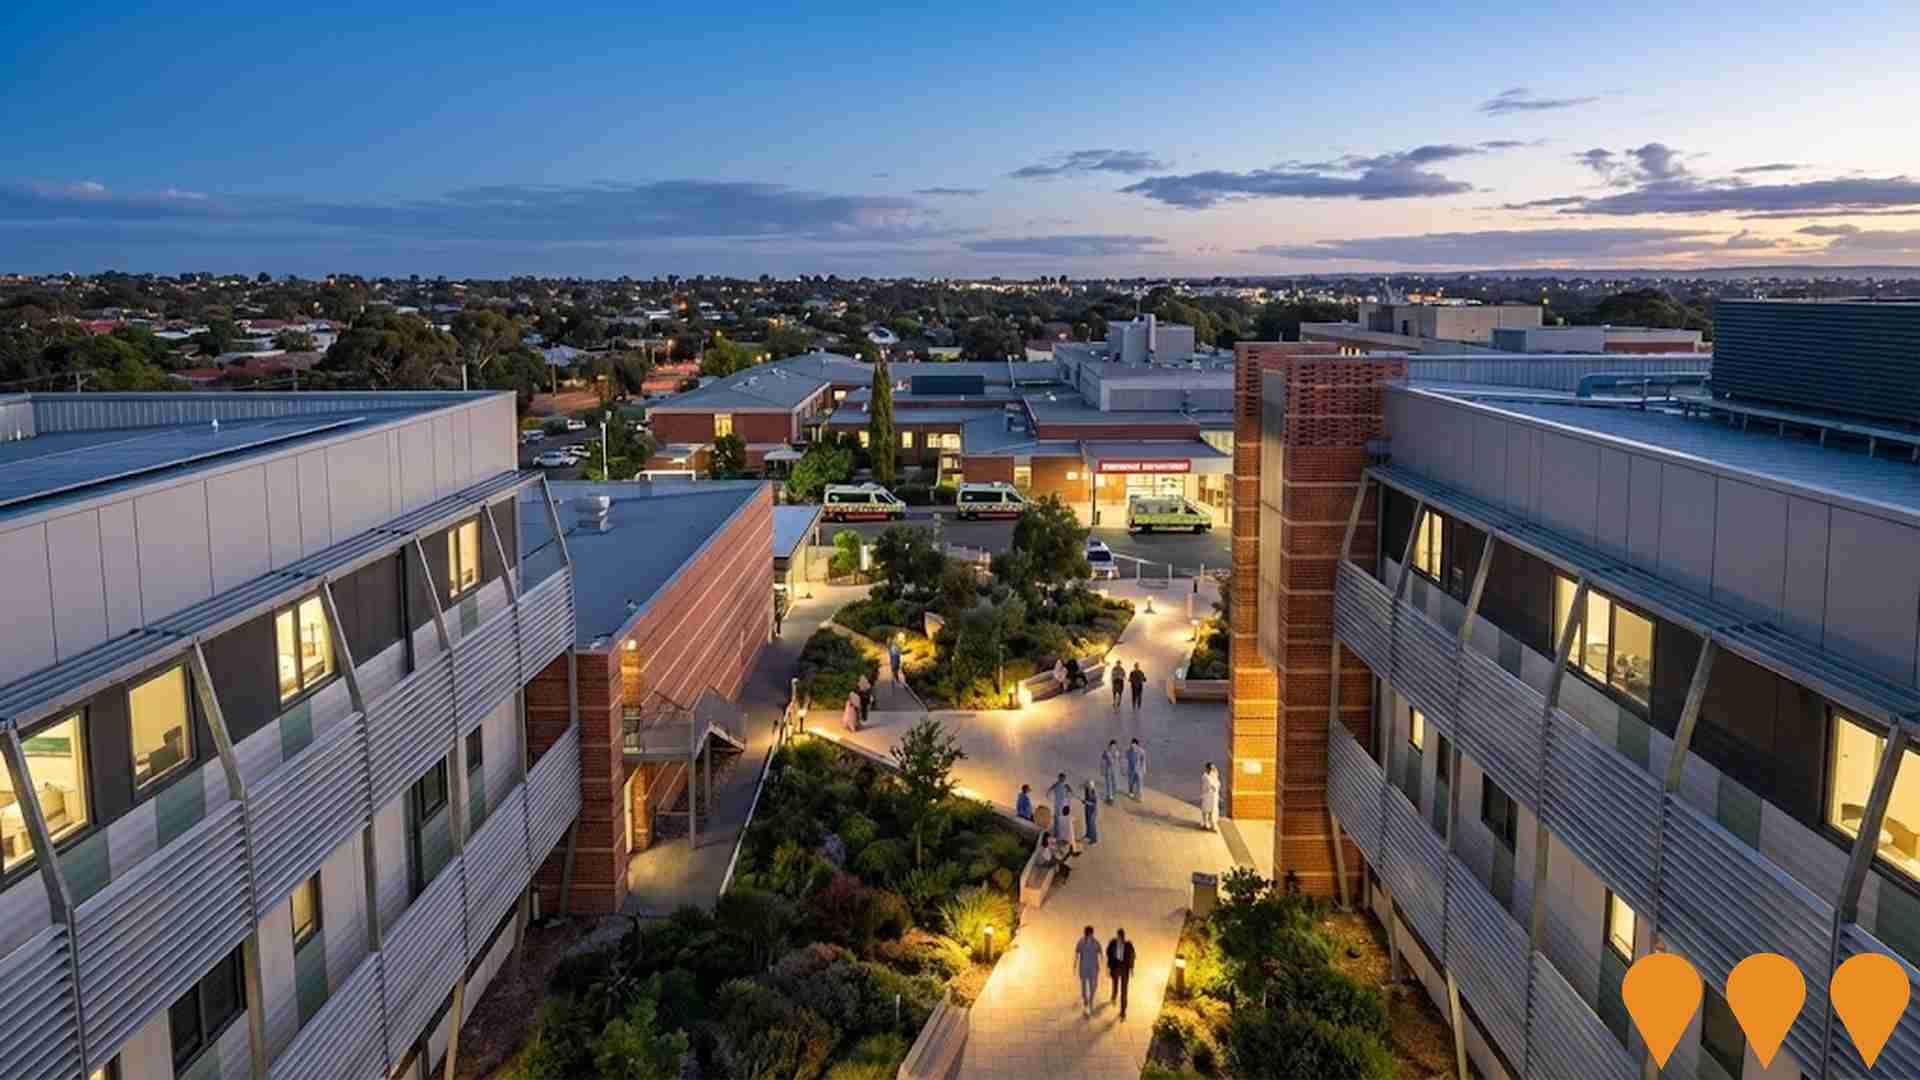
$47 million 48-bed expansion featuring two new 24-bed inpatient wards with single rooms and private bathrooms, specialised bariatric and mental health facilities, emergency department redevelopment with 76 spaces, and additional dialysis facilities. Major healthcare capacity increase for northern Adelaide region delivered by construction company 'Built'. Project completed in May 2025.
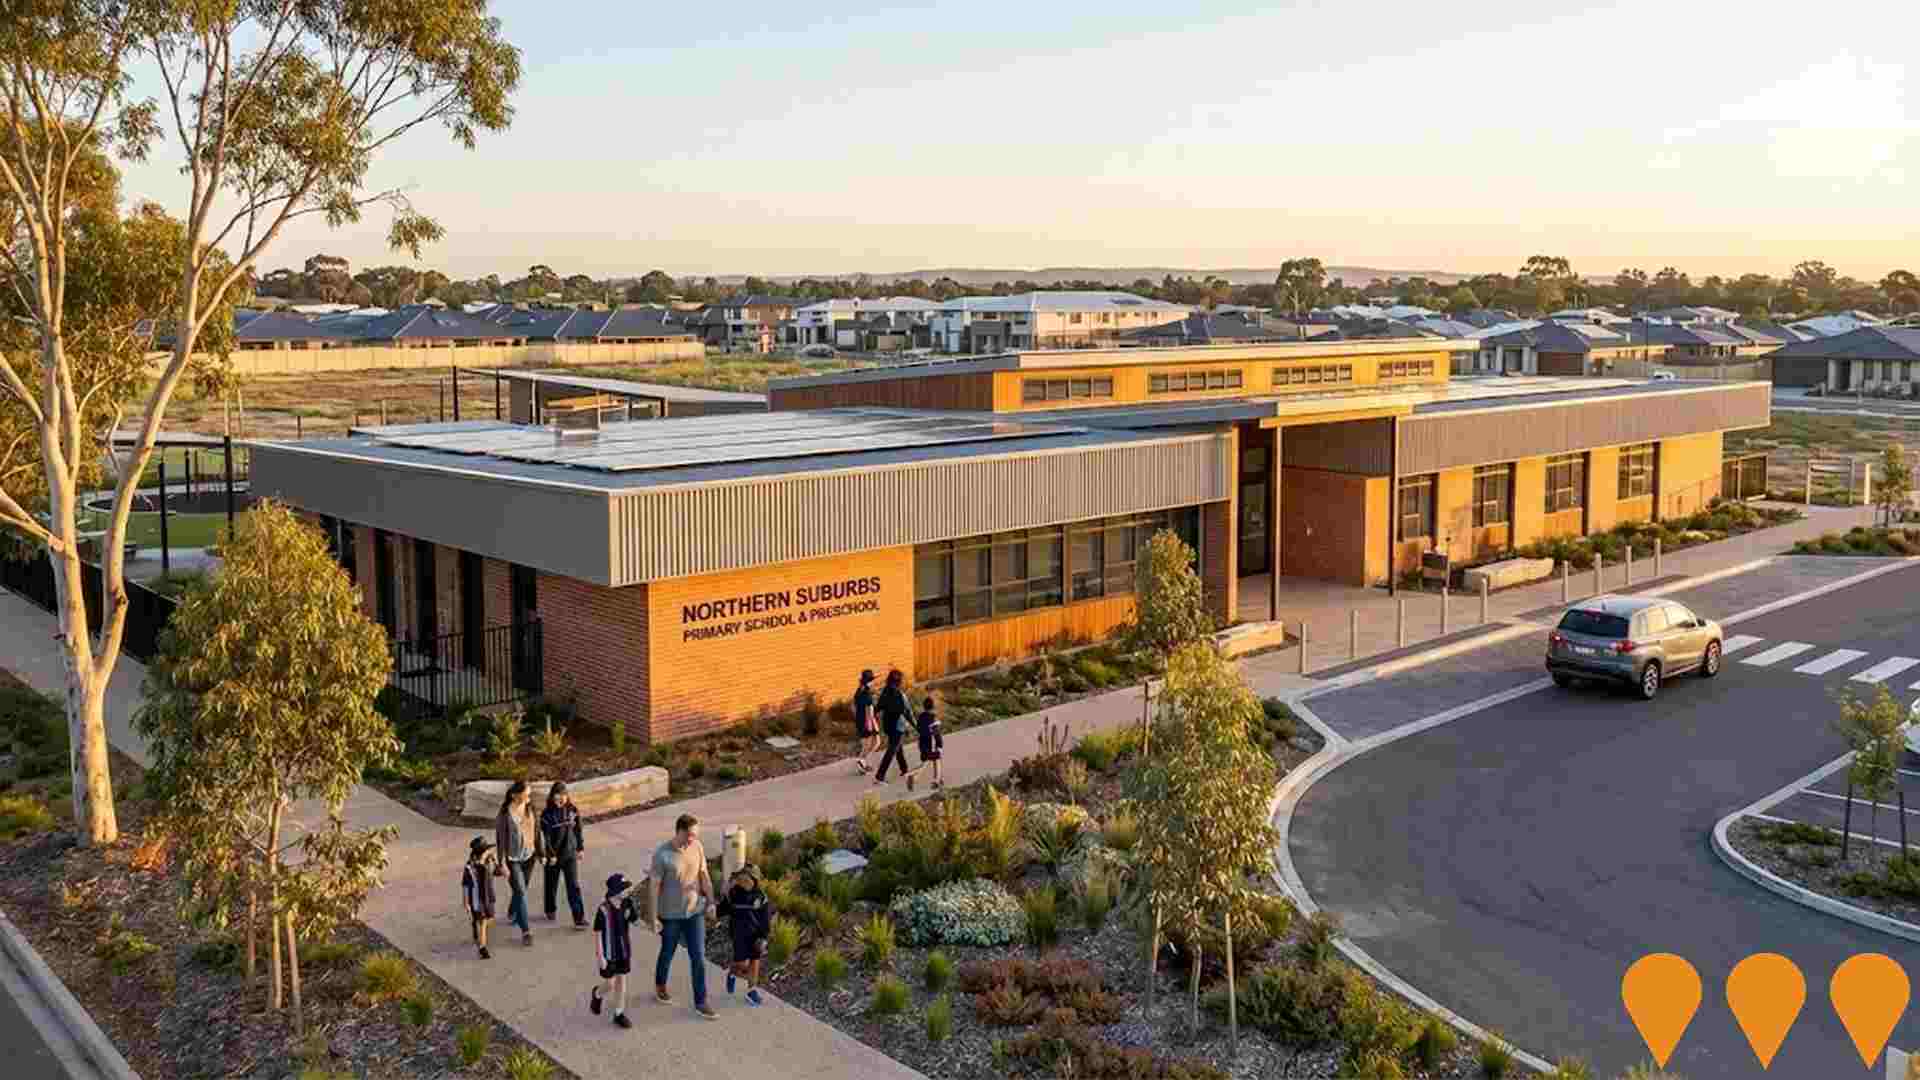
Northern Suburbs Primary School
New Reception to Year 6 school for 400 students plus 60-place preschool to support major residential growth in Adelaide's northern suburbs. Site selection and planning underway to ensure equitable access to high-quality public education services in one of the fastest-growing regions in the state.
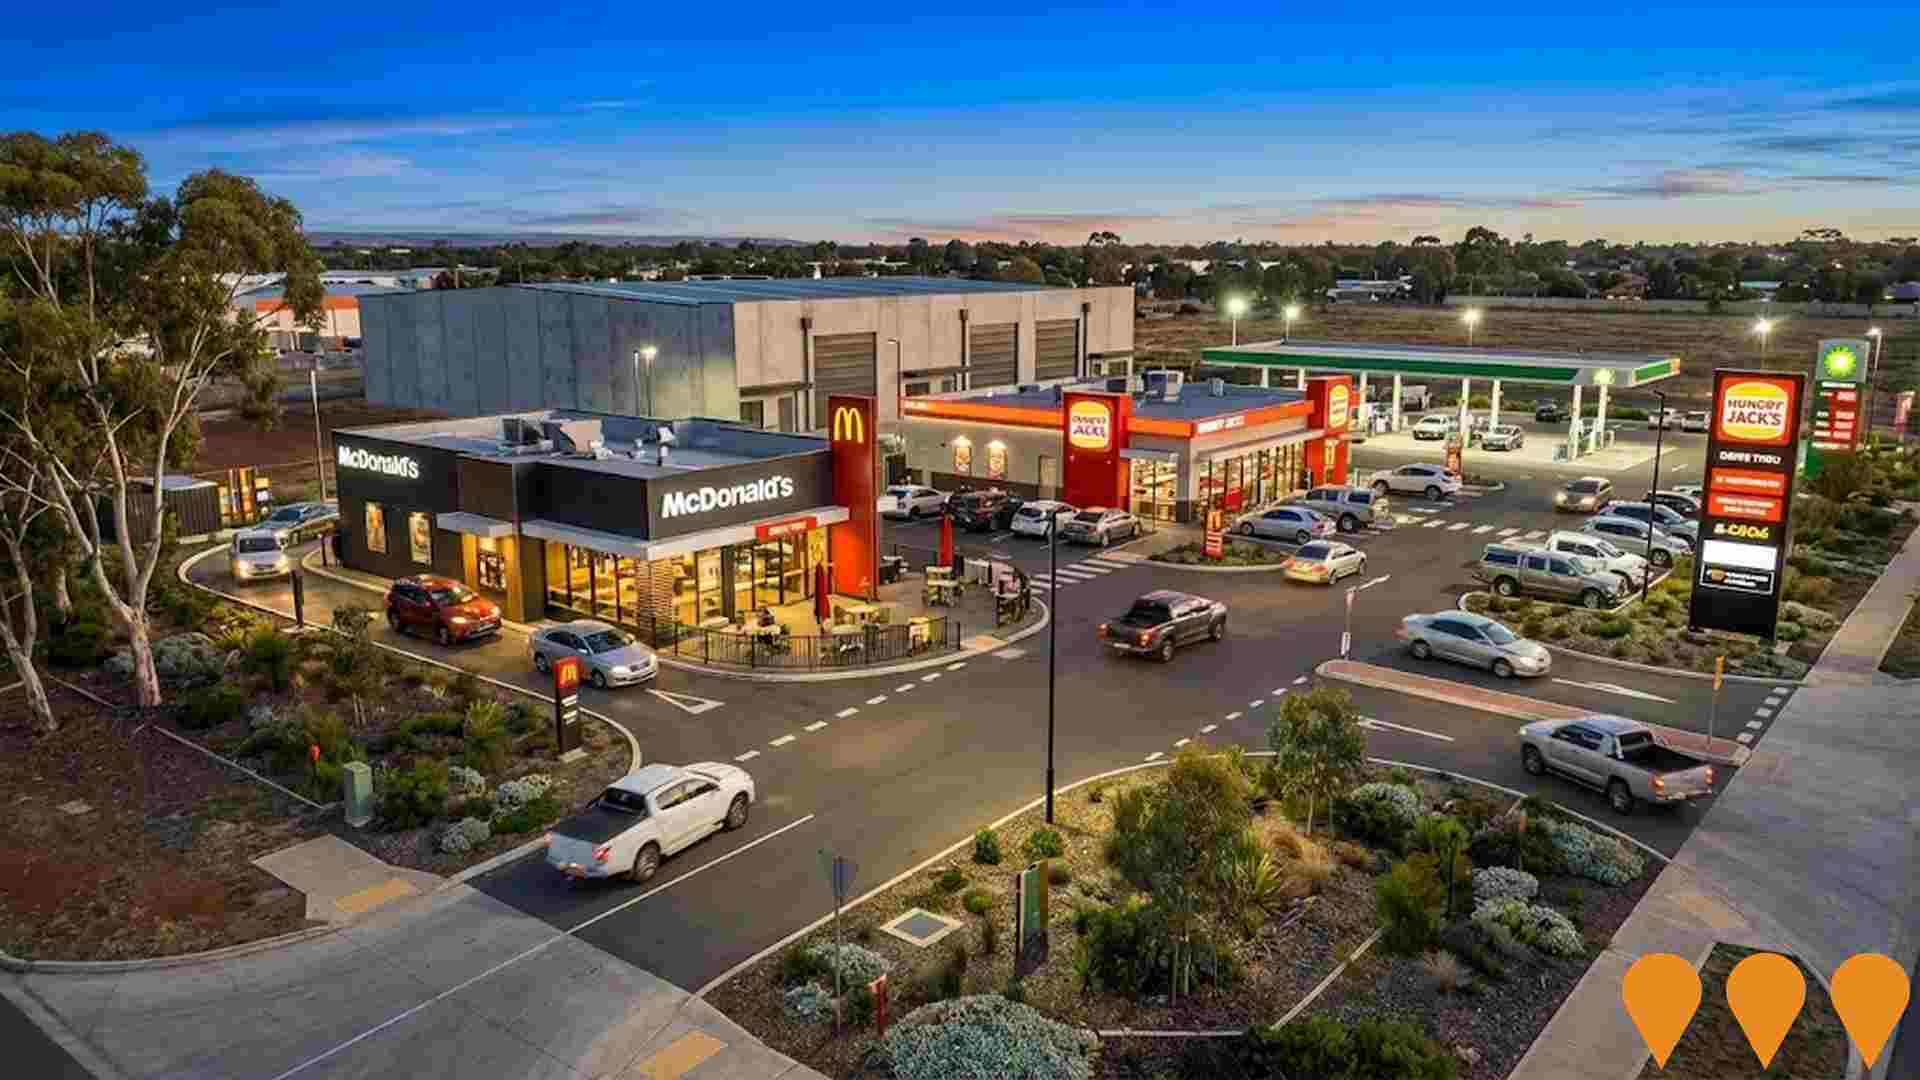
Edinburgh North Retail Convenience Hub
A $20 million fast-food and retail hub that was approved for Edinburgh North. The precinct will include national brands like McDonald's, Hungry Jack's, a petrol station, and a second drive-thru outlet. It's intended to be a 24/7 service hub for the growing residential, industrial, logistics, and commercial workforce in the area.
Employment
Employment conditions in Elizabeth face significant challenges, ranking among the bottom 10% of areas assessed nationally
Elizabeth's workforce comprises an equal distribution of white and blue-collar jobs, with prominent manufacturing and industrial sectors. The unemployment rate was 21.7% in September 2025, showing a significant gap compared to Greater Adelaide's rate of 3.9%.
Employment growth over the past year stood at 3.3%, indicating room for improvement. As of September 2025, 3,030 residents were employed while workforce participation lagged at 39.3% compared to Greater Adelaide's 61.7%. Dominant employment sectors included health care & social assistance, manufacturing, and retail trade. The area had a particular specialization in manufacturing, with an employment share of 1.9 times the regional level.
Conversely, professional & technical services employed only 2.0% of local workers, lower than Greater Adelaide's 7.3%. With 1.1 jobs per resident as at the Census, Elizabeth functioned as an employment hub attracting workers from nearby areas. Between September 2024 and September 2025, employment increased by 3.3%, while labour force grew by 1.4%, leading to a decrease in unemployment by 1.4 percentage points. In contrast, Greater Adelaide recorded employment growth of 3.0% with a marginal fall in unemployment of 0.1 percentage points. State-level data from 25-Nov-25 showed SA employment grew by 1.19%, adding 10,710 jobs, and the state unemployment rate was at 4.0%. National forecasts from May-25 projected national employment growth of 6.6% over five years and 13.7% over ten years. Applying these projections to Elizabeth's employment mix suggested local employment should increase by 5.7% over five years and 12.5% over ten years, though this was a simple extrapolation for illustrative purposes only.
Frequently Asked Questions - Employment
Income
Income metrics place the area in the bottom 10% of locations nationally according to AreaSearch analysis
Elizabeth SA2's median income among taxpayers was $43,786 in financial year 2022. The average income stood at $48,015 during the same period. These figures are below Greater Adelaide's median and average incomes of $52,592 and $64,886 respectively. By September 2025, estimated median and average incomes in Elizabeth SA2 would be approximately $49,404 and $54,175 based on a 12.83% Wage Price Index growth since financial year 2022. Census data shows that household, family, and personal incomes in Elizabeth fall between the 0th and 1st percentiles nationally. The predominant income cohort spans 34.0% of locals (3,914 people) in the $400 - $799 category, unlike metropolitan trends where 31.8% fall within the $1,500 - $2,999 range. Lower income households are prevalent, with 48.4% earning below $800 weekly. Housing affordability pressures are severe, with only 77.3% of income remaining, ranking at the 2nd percentile nationally.
Frequently Asked Questions - Income
Housing
Elizabeth displays a diverse mix of dwelling types, with a higher proportion of rental properties than the broader region
Elizabeth's dwelling structure, as per the latest Census, consisted of 51.5% houses and 48.4% other dwellings (semi-detached, apartments, 'other' dwellings). In comparison, Adelaide metro had 83.7% houses and 16.2% other dwellings. Home ownership in Elizabeth was at 19.0%, with the rest being mortgaged (22.6%) or rented (58.3%). The median monthly mortgage repayment in Elizabeth was $1,083, significantly lower than Adelaide metro's $1,300 and Australia's national average of $1,863. The median weekly rent figure in Elizabeth was $225, substantially below Adelaide metro's $265 and the national average of $375.
Frequently Asked Questions - Housing
Household Composition
Elizabeth features high concentrations of lone person households and group households, with a lower-than-average median household size
Family households account for 56.2% of all households, including 19.6% couples with children, 15.3% couples without children, and 19.8% single parent families. Non-family households make up the remaining 43.8%, with lone person households at 39.4% and group households comprising 4.2%. The median household size is 2.4 people, which is smaller than the Greater Adelaide average of 2.6.
Frequently Asked Questions - Households
Local Schools & Education
Elizabeth faces educational challenges, with performance metrics placing it in the bottom quartile of areas assessed nationally
The area's university qualification rate is 7.4%, significantly lower than Australia's average of 30.4%. Bachelor degrees are the most common, with 5.5% of residents holding one, followed by postgraduate qualifications at 1.3% and graduate diplomas at 0.6%. Vocational credentials are prevalent, with 34.4% of residents aged 15+ possessing them, including advanced diplomas (6.0%) and certificates (28.4%). Educational participation is high, with 33.2% of residents currently enrolled in formal education, comprising 13.9% in primary, 8.8% in secondary, and 2.9% in tertiary education.
Educational participation is notably high, with 33.2% of residents currently enrolled in formal education. This includes 13.9% in primary education, 8.8% in secondary education, and 2.9% pursuing tertiary education.
Frequently Asked Questions - Education
Schools Detail
Nearby Services & Amenities
Transport
Transport servicing is good compared to other areas nationally based on assessment of service frequency, route connectivity and accessibility
Elizabeth has 98 active public transport stops operating within its boundaries. These consist of a mix of train and bus services. There are 33 individual routes in total, providing 2,626 weekly passenger trips collectively.
The accessibility of these transport services is rated as good, with residents typically located 203 meters from the nearest stop. On average, there are 375 trips per day across all routes, which equates to approximately 26 weekly trips per individual stop.
Frequently Asked Questions - Transport
Transport Stops Detail
Health
Health performance in Elizabeth is a key challenge with a range of health conditions having marked impacts on both younger and older age cohorts
Elizabeth faces significant health challenges, with various conditions affecting both younger and older age groups. Private health cover is low, at approximately 46% of the total population (~5,295 people), compared to the national average of 55.3%.
Mental health issues are the most common condition, impacting 12.7% of residents, followed by arthritis affecting 10.3%. However, 58.3% of residents declare themselves completely clear of medical ailments, compared to 63.4% across Greater Adelaide. The area has a higher proportion of seniors aged 65 and over at 16.2%, with 1,868 people in this age group, compared to 13.3% in Greater Adelaide. Health outcomes among seniors present challenges broadly in line with the general population's health profile.
Frequently Asked Questions - Health
Cultural Diversity
Elizabeth was found to be more culturally diverse than the vast majority of local markets in Australia, upon assessment of a range of language and cultural background related metrics
Elizabeth was found to have a higher cultural diversity than most local markets, with 34.0% of its population born overseas and 27.8% speaking a language other than English at home. The predominant religion in Elizabeth is Christianity, making up 37.2% of the population. However, Islam is significantly overrepresented, comprising 7.1% compared to the Greater Adelaide average of 4.0%.
Regarding ancestry, the top three groups are English (28.3%), Australian (24.4%), and Other (20.6%), which is substantially higher than the regional average of 11.1%. There are notable differences in the representation of certain ethnic groups: Australian Aboriginal is overrepresented at 4.2% compared to the regional average of 3.0%, German is slightly underrepresented at 3.6% versus 4.4%, and Russian remains consistent with the regional average at 0.3%.
Frequently Asked Questions - Diversity
Age
Elizabeth's population is slightly younger than the national pattern
The median age in Elizabeth is 36 years, which is slightly below Greater Adelaide's average of 39 years and also slightly below the Australian median of 38 years. Compared to Greater Adelaide, Elizabeth has a higher proportion of residents aged 5-14, at 15.1%, but fewer residents aged 65-74, at 7.9%. Between the 2021 Census and the present day, the population aged 35-44 has increased from 12.1% to 13.2%, while the population aged 45-54 has decreased from 11.5% to 10.6%. By the year 2041, Elizabeth is projected to experience significant changes in its age composition, with the 45-54 age group expected to grow by 54%, reaching a total of 1,878 people from the previous count of 1,221.
