Chart Color Schemes
This analysis uses ABS Statistical Areas Level 2 (SA2) boundaries, which can materially differ from Suburbs and Localities (SAL) even when sharing similar names.
SA2 boundaries are defined by the Australian Bureau of Statistics and are designed to represent communities for statistical reporting (e.g., census and ERP).
Suburbs and Localities (SAL) represent commonly-used suburb/locality names (postal-style areas) and may use different geographic boundaries. For comprehensive analysis, consider reviewing both boundary types if available.
est. as @ -- *
ABS ERP | -- people | --
2021 Census | -- people
Sales Activity
Curious about local property values? Filter the chart to assess the volume and appreciation (including resales) trends and regional comparisons, or scroll to the map below view this information at an individual property level.
Find a Recent Sale
Sales Detail
Population
Population growth drivers in Elizabeth East are strong compared to national averages based on AreaSearch's ranking of recent, and medium to long-term trends
Elizabeth East's population was approximately 14,470 as of November 2025. This figure represents an increase of 423 people, a 3.0% rise from the 2021 Census which reported a population of 14,047. The change is inferred from ABS's estimated resident population of 14,444 in June 2024 and an additional 42 validated new addresses since the Census date. This results in a population density ratio of 1,768 persons per square kilometer, higher than the average seen across national locations assessed by AreaSearch. Over the past decade, Elizabeth East has shown resilient growth patterns with a compound annual growth rate of 1.2%, outperforming the state's average. Overseas migration contributed approximately 68.3% of overall population gains during recent periods.
AreaSearch uses ABS/Geoscience Australia projections for each SA2 area, released in 2024 with a base year of 2022. For areas not covered by this data and years post-2032, the SA State Government's Regional/LGA projections by age category are adopted, released in 2023 based on 2021 data, with adjustments made using weighted aggregation methods from LGA to SA2 levels. Considering projected demographic shifts, a significant population increase is forecast for the top quartile of statistical areas across the nation. Elizabeth East is expected to increase by 4,514 persons to 2041 based on the latest annual ERP population numbers, reflecting an overall increase of 31.0% over the 17-year period.
Frequently Asked Questions - Population
Development
Residential development activity is slightly higher than average within Elizabeth East when compared nationally
Elizabeth East averaged approximately 42 new dwelling approvals per year over the past five financial years, from FY-21 to FY-25, totalling 212 homes. In FY-26, up to 28 dwellings have been approved so far. This averages out to about 2.8 new residents gained for each dwelling built annually during these five years, suggesting strong demand which may support property values.
The average construction cost of new homes is around $194,000, below regional levels, indicating more affordable housing options for buyers. In FY-26, commercial development approvals amounted to $1.5 million, reflecting a primarily residential focus in the area. Compared to Greater Adelaide, Elizabeth East has significantly lower construction activity, at 83.0% below the regional average per person. This limited new construction typically enhances demand and pricing for existing homes. Furthermore, this activity is also below national averages, likely due to the area's maturity and possible planning constraints.
Recent developments consist of approximately 84.0% detached houses and 16.0% townhouses or apartments, preserving Elizabeth East's traditional suburban character with a focus on family homes. The population density in Elizabeth East is around 558 people per dwelling approval, indicating an established market. According to the latest AreaSearch quarterly estimate, the location is projected to grow by approximately 4,488 residents by 2041. If current development rates persist, housing supply might not keep pace with population growth, potentially intensifying competition among buyers and supporting stronger price growth in the future.
Frequently Asked Questions - Development
Infrastructure
Elizabeth East has emerging levels of nearby infrastructure activity, ranking in the 34thth percentile nationally
Changes to local infrastructure significantly affect an area's performance. AreaSearch has identified 18 projects likely to impact the area. Notable ones are Edinburgh Central Mixed Use Development, Blakes Crossing Master Planned Community, Elizabeth Vale Family Health and Wellbeing Hub, and Lionsgate Business Park. The following list details those most relevant.
Professional plan users can use the search below to filter and access additional projects.
INFRASTRUCTURE SEARCH
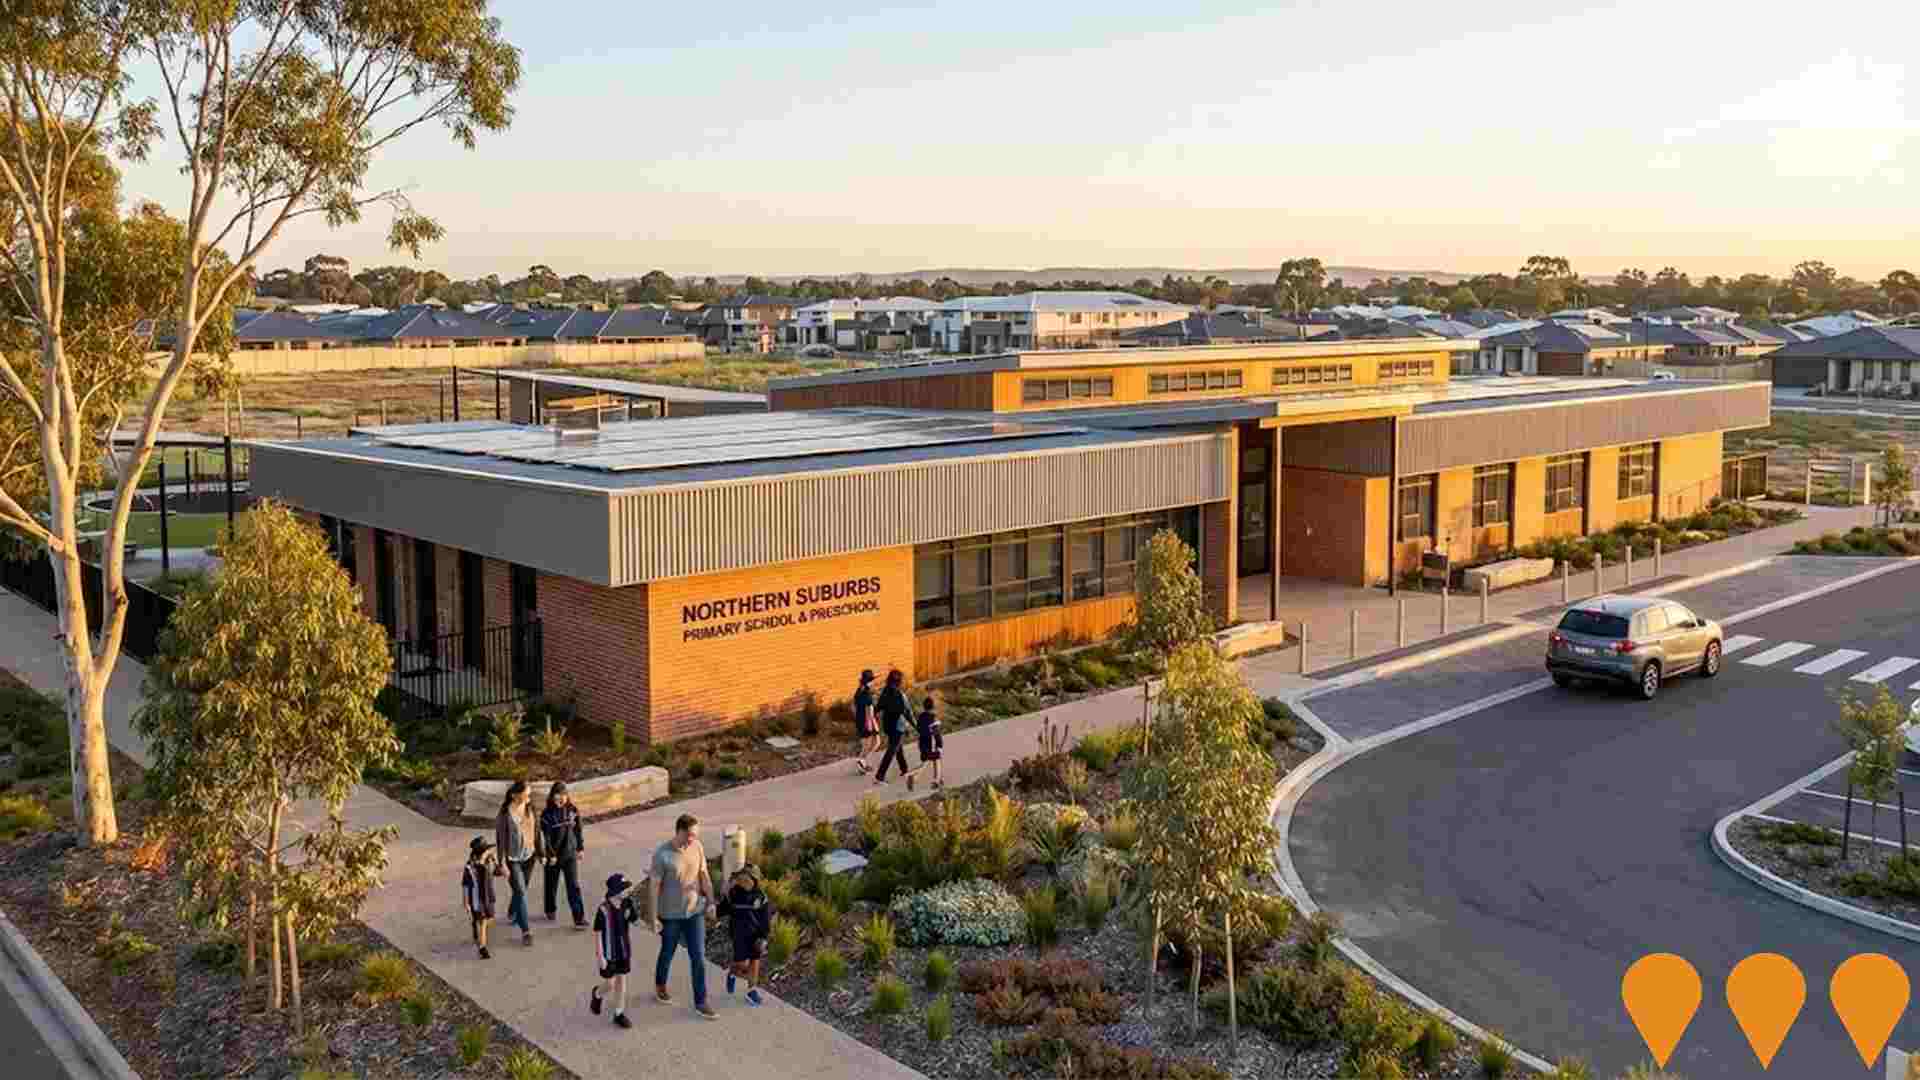
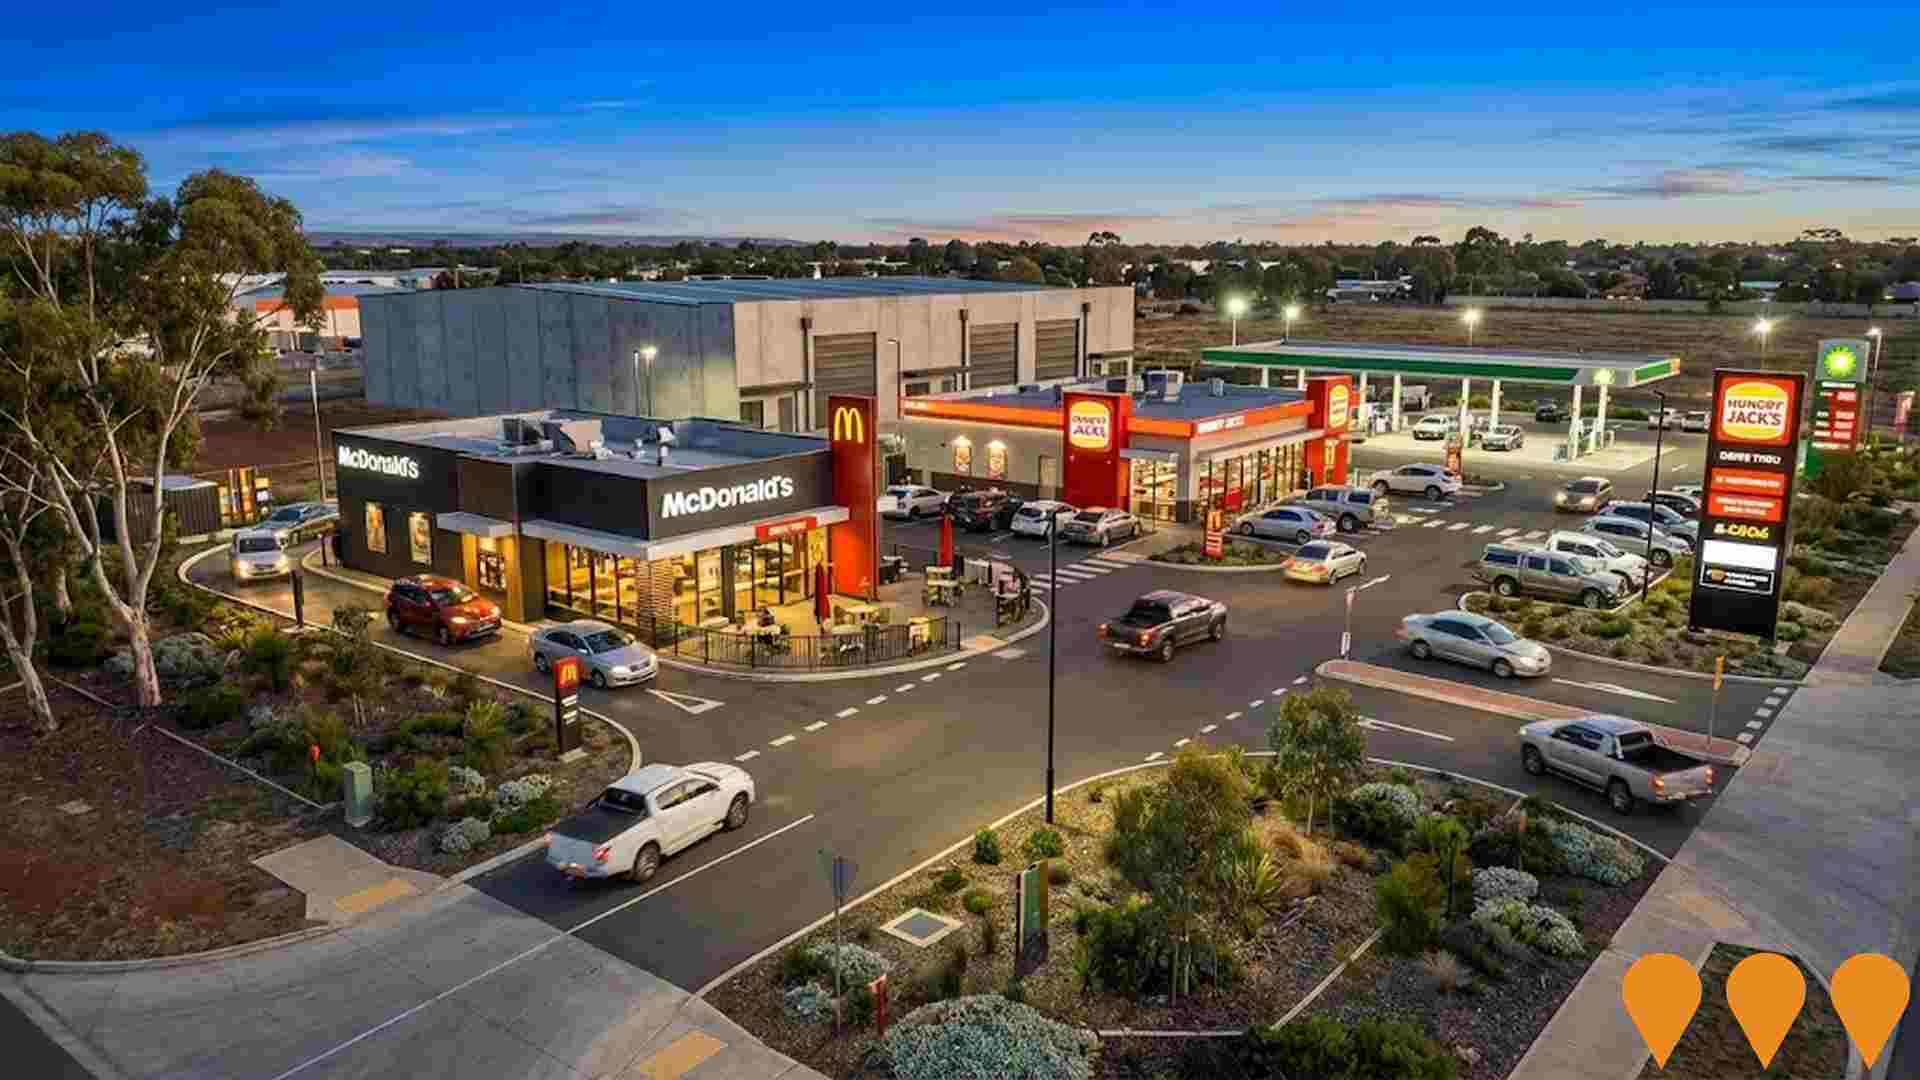
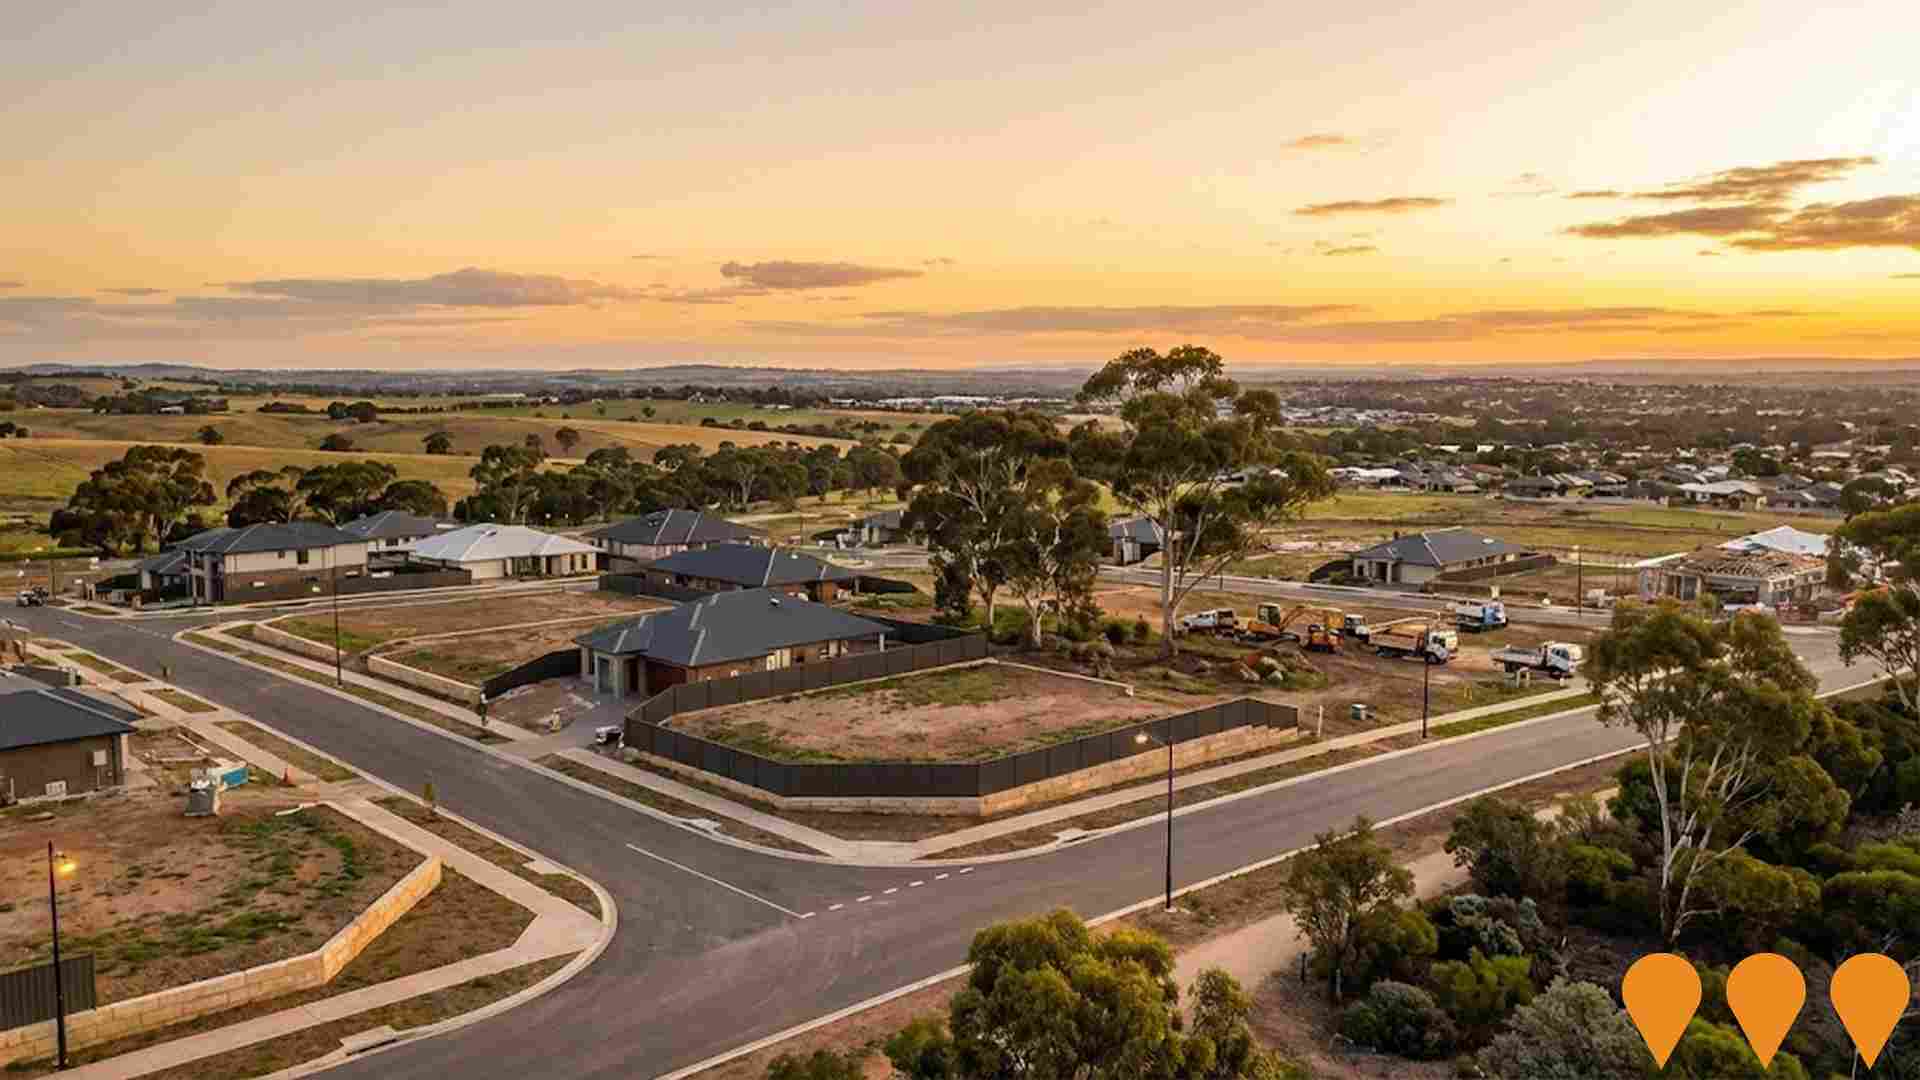
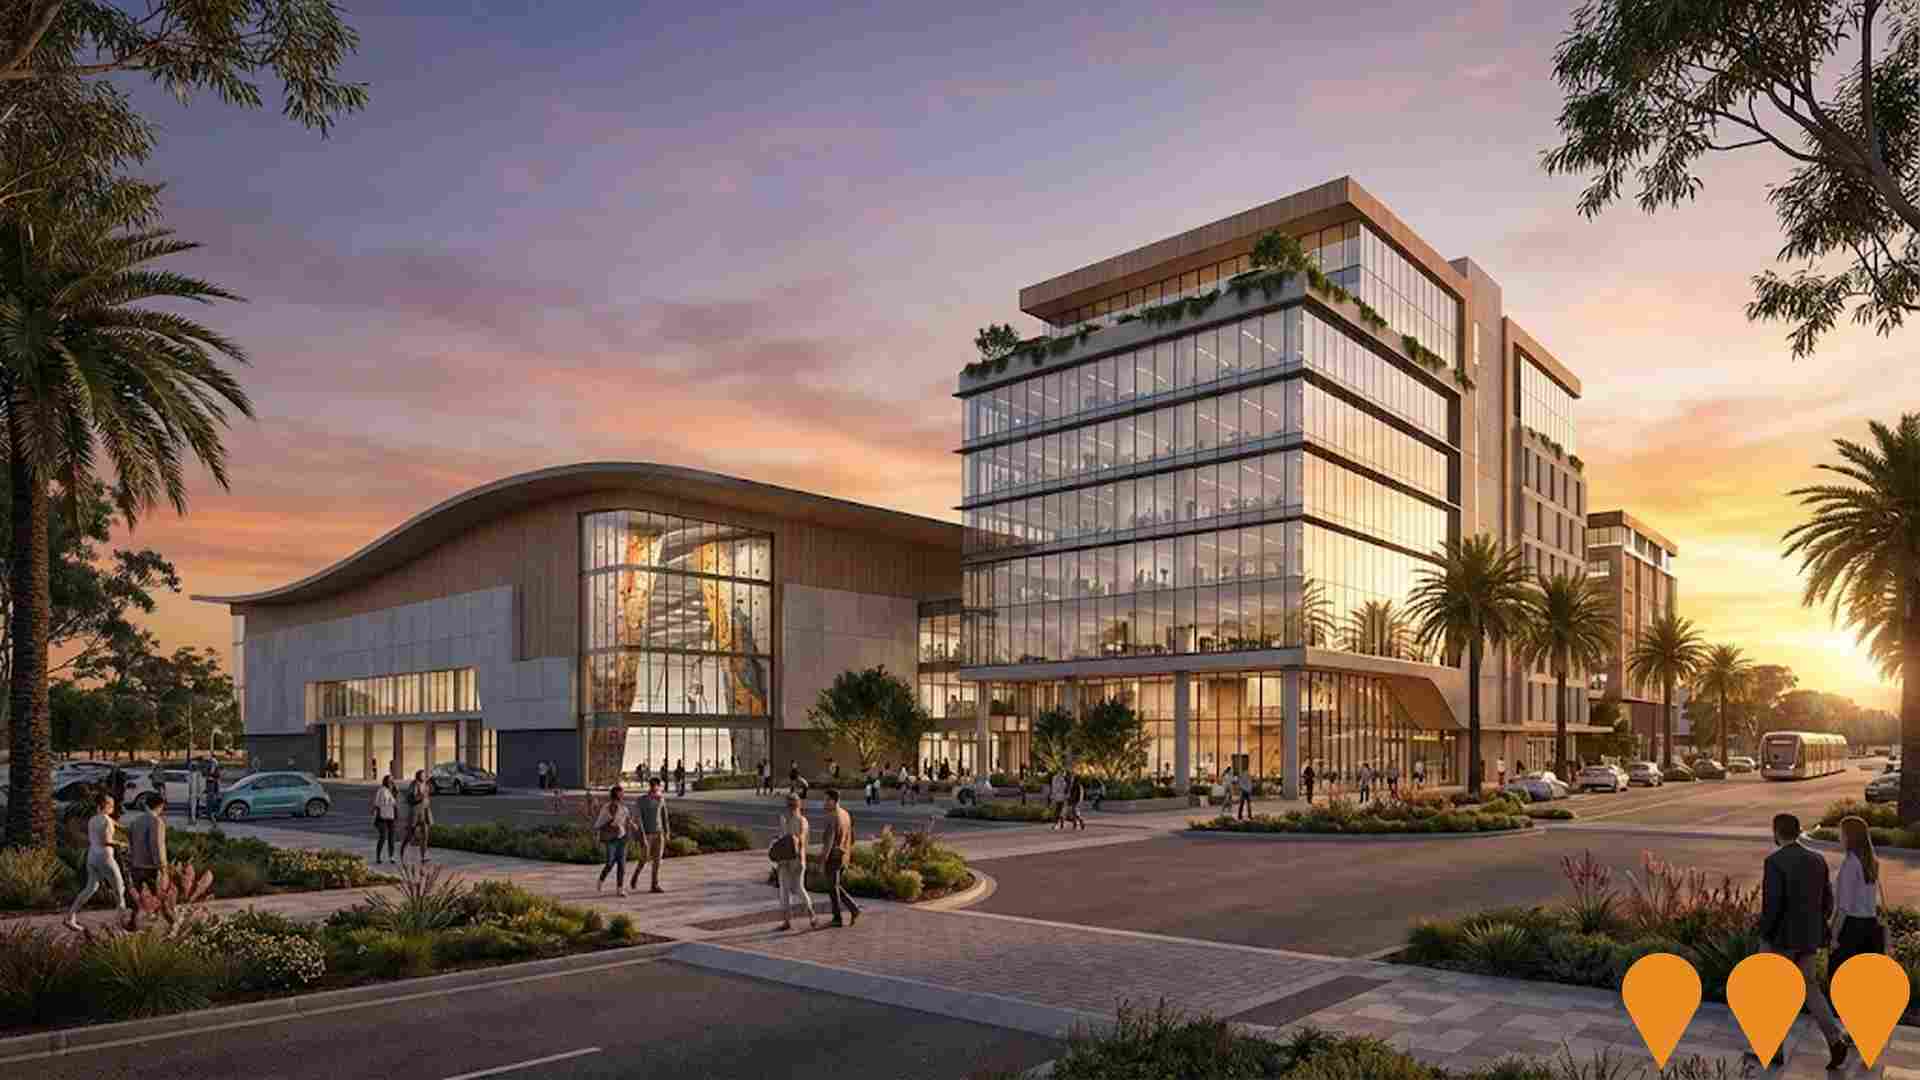
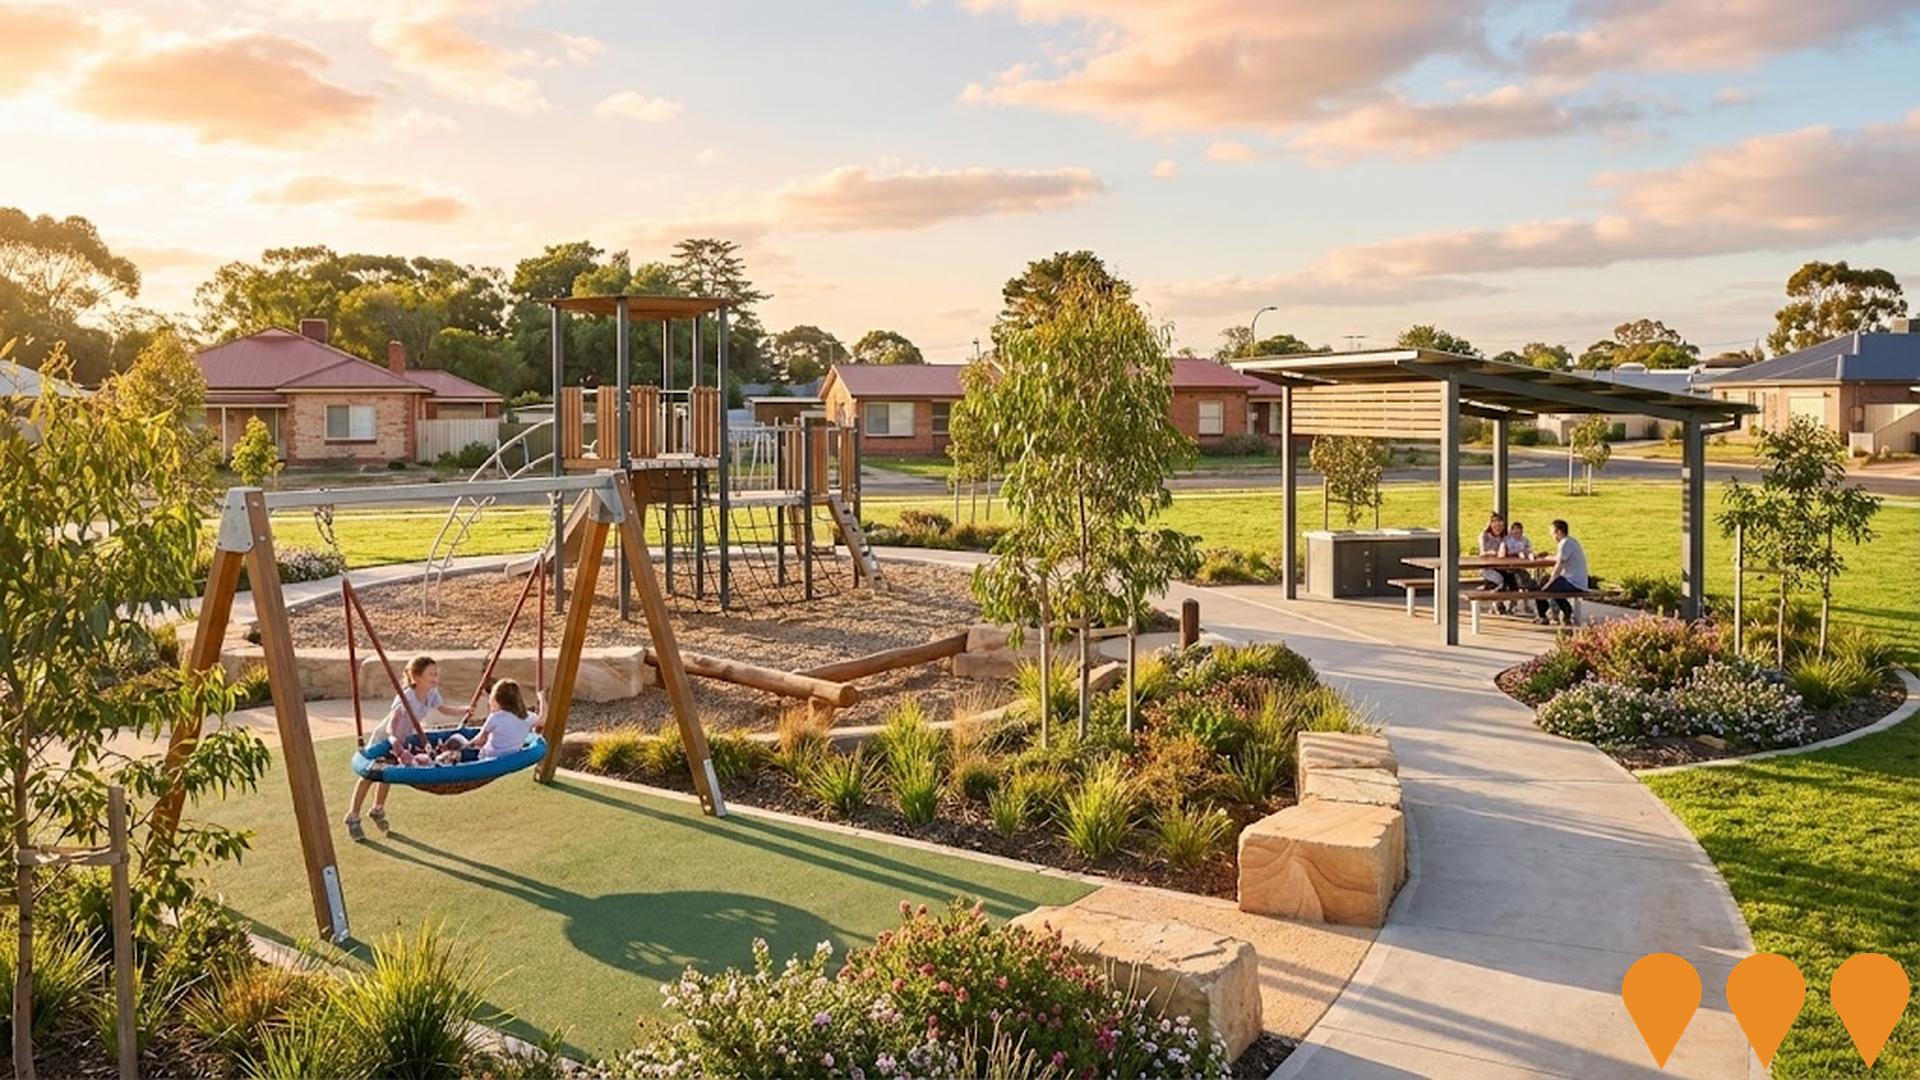
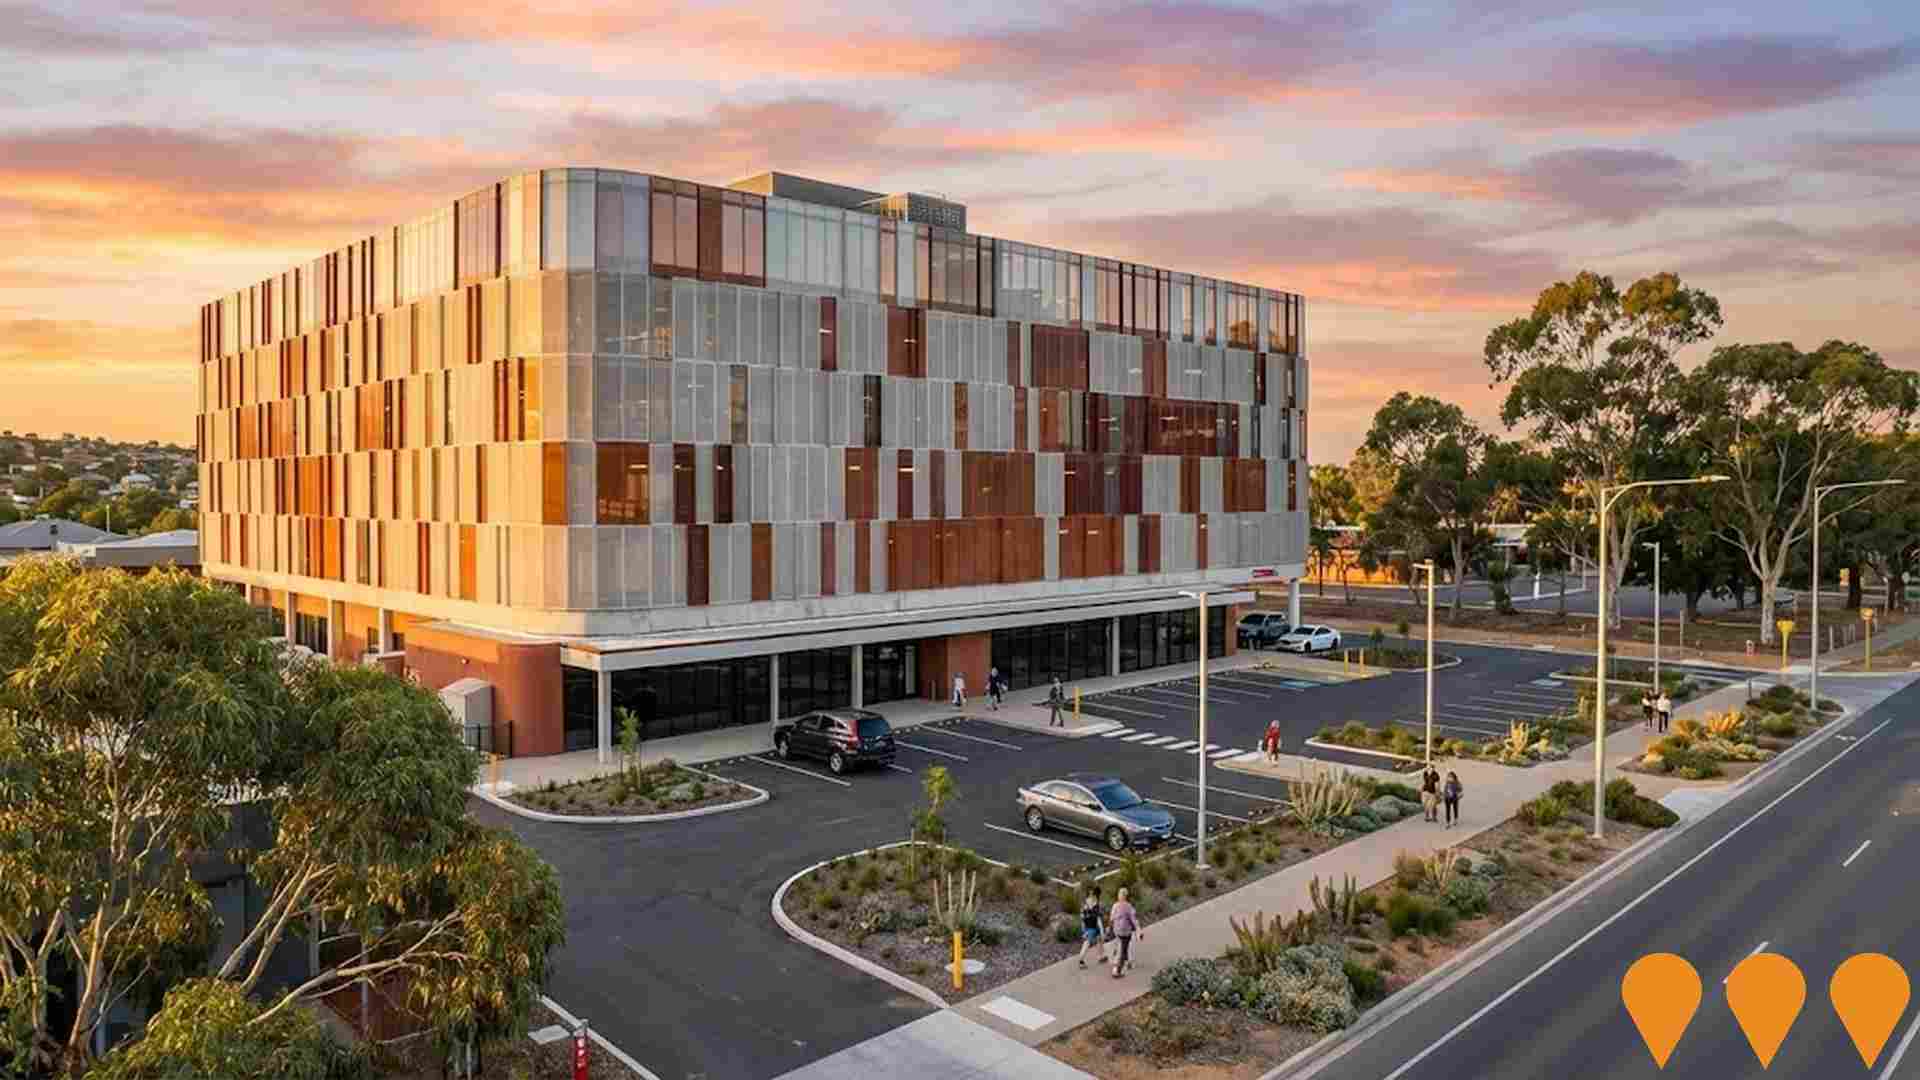
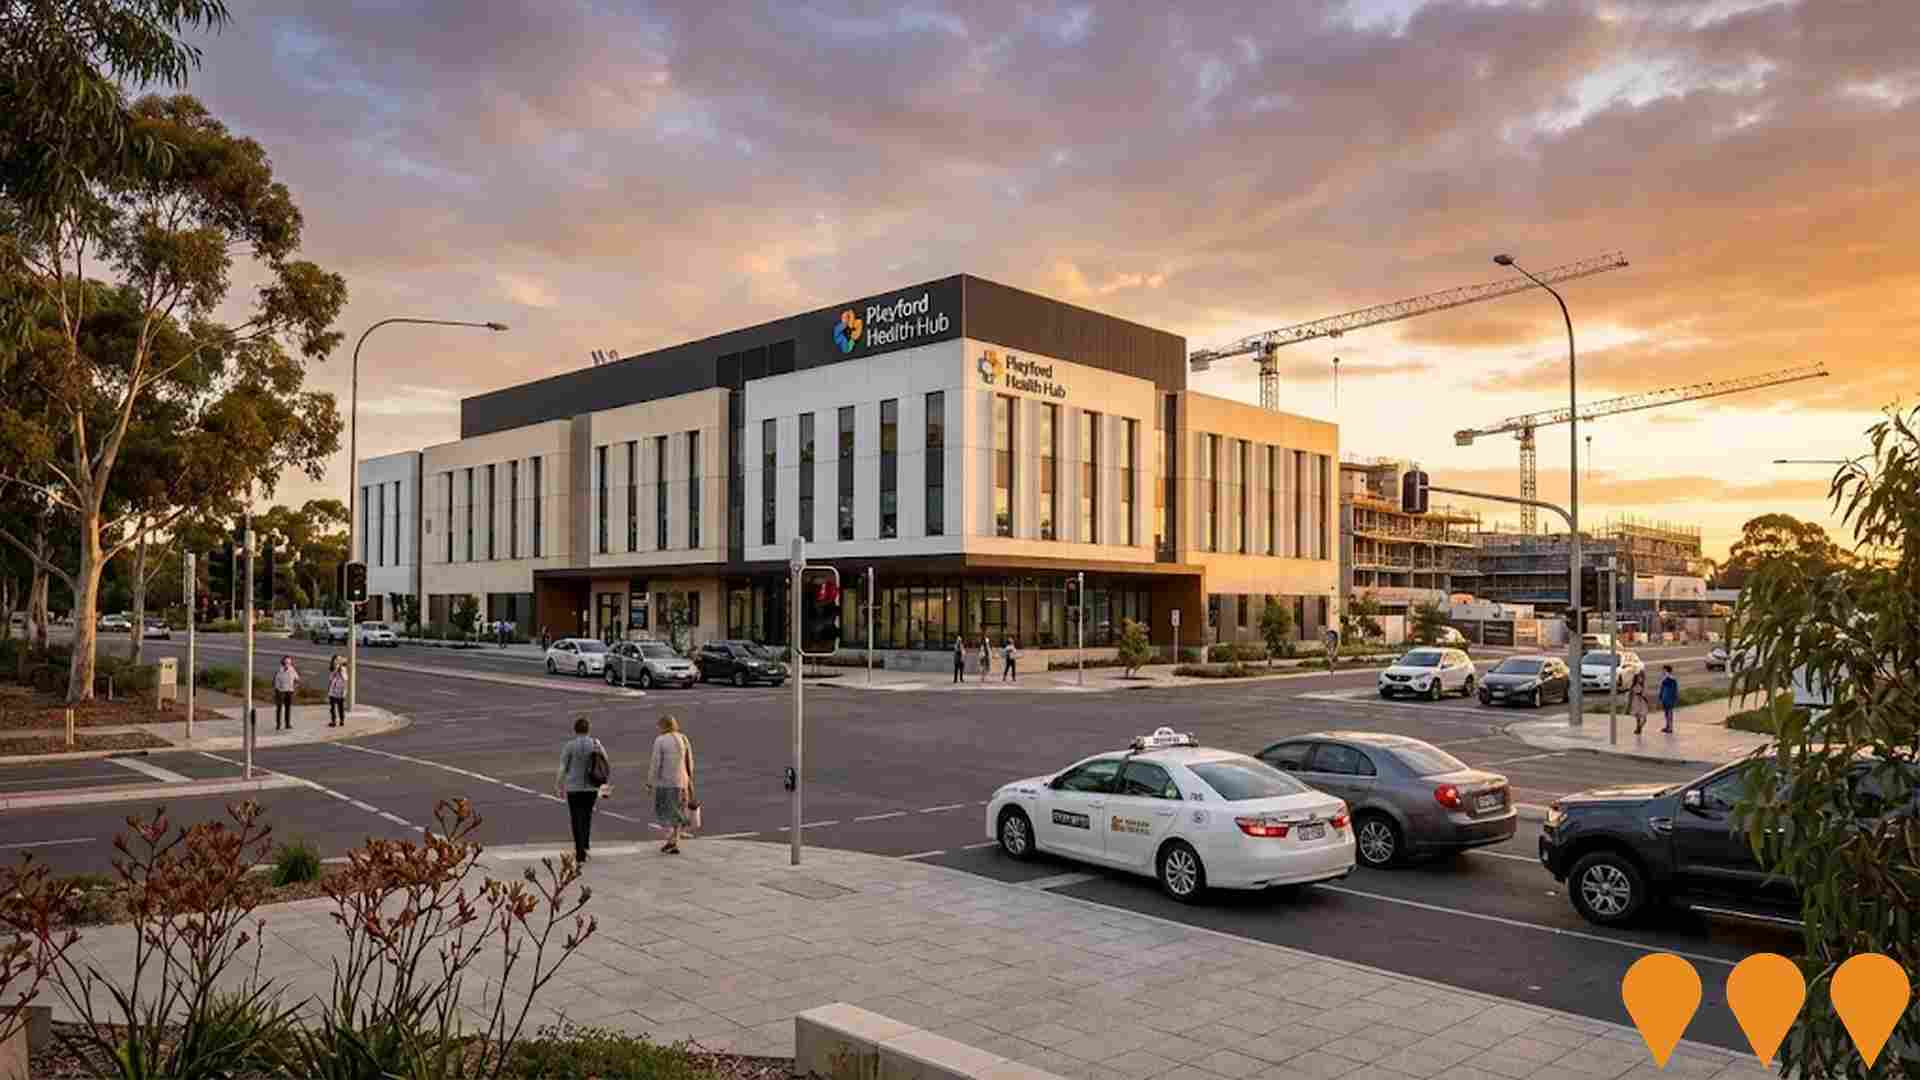
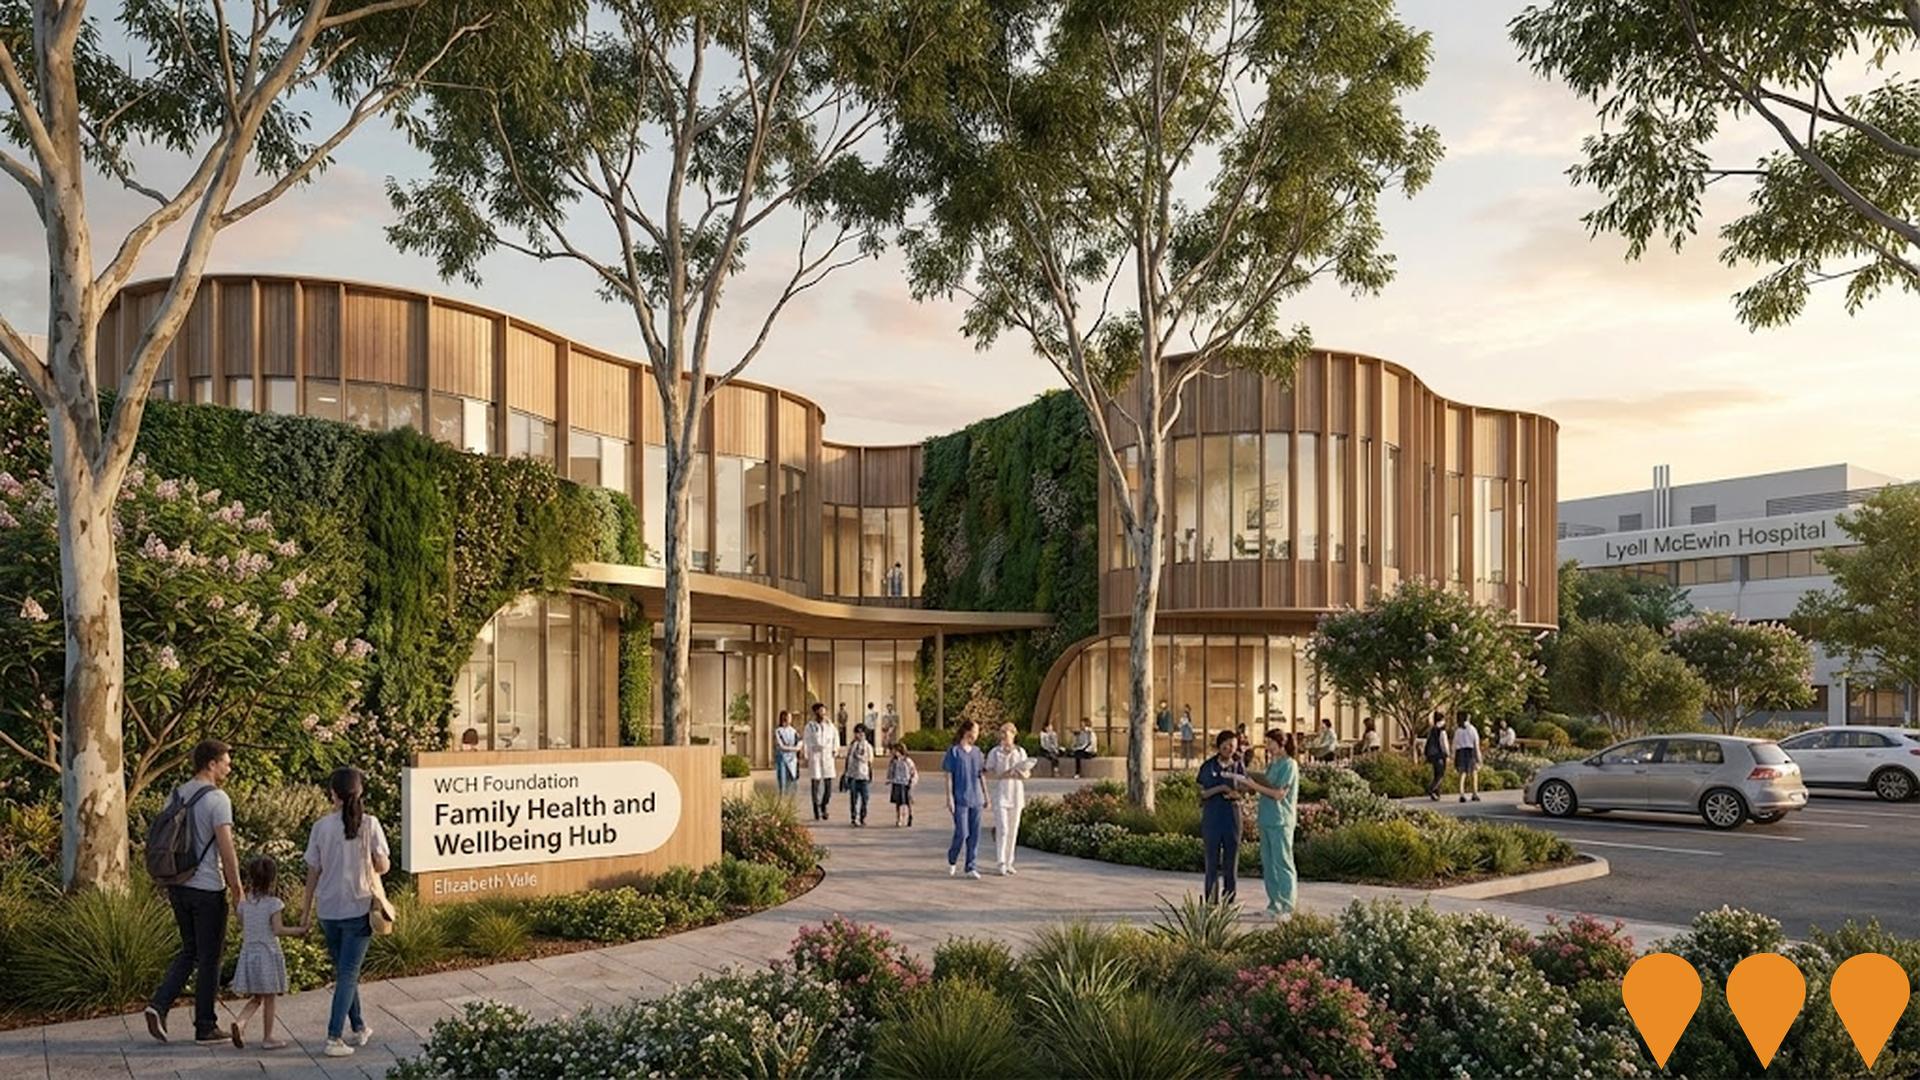
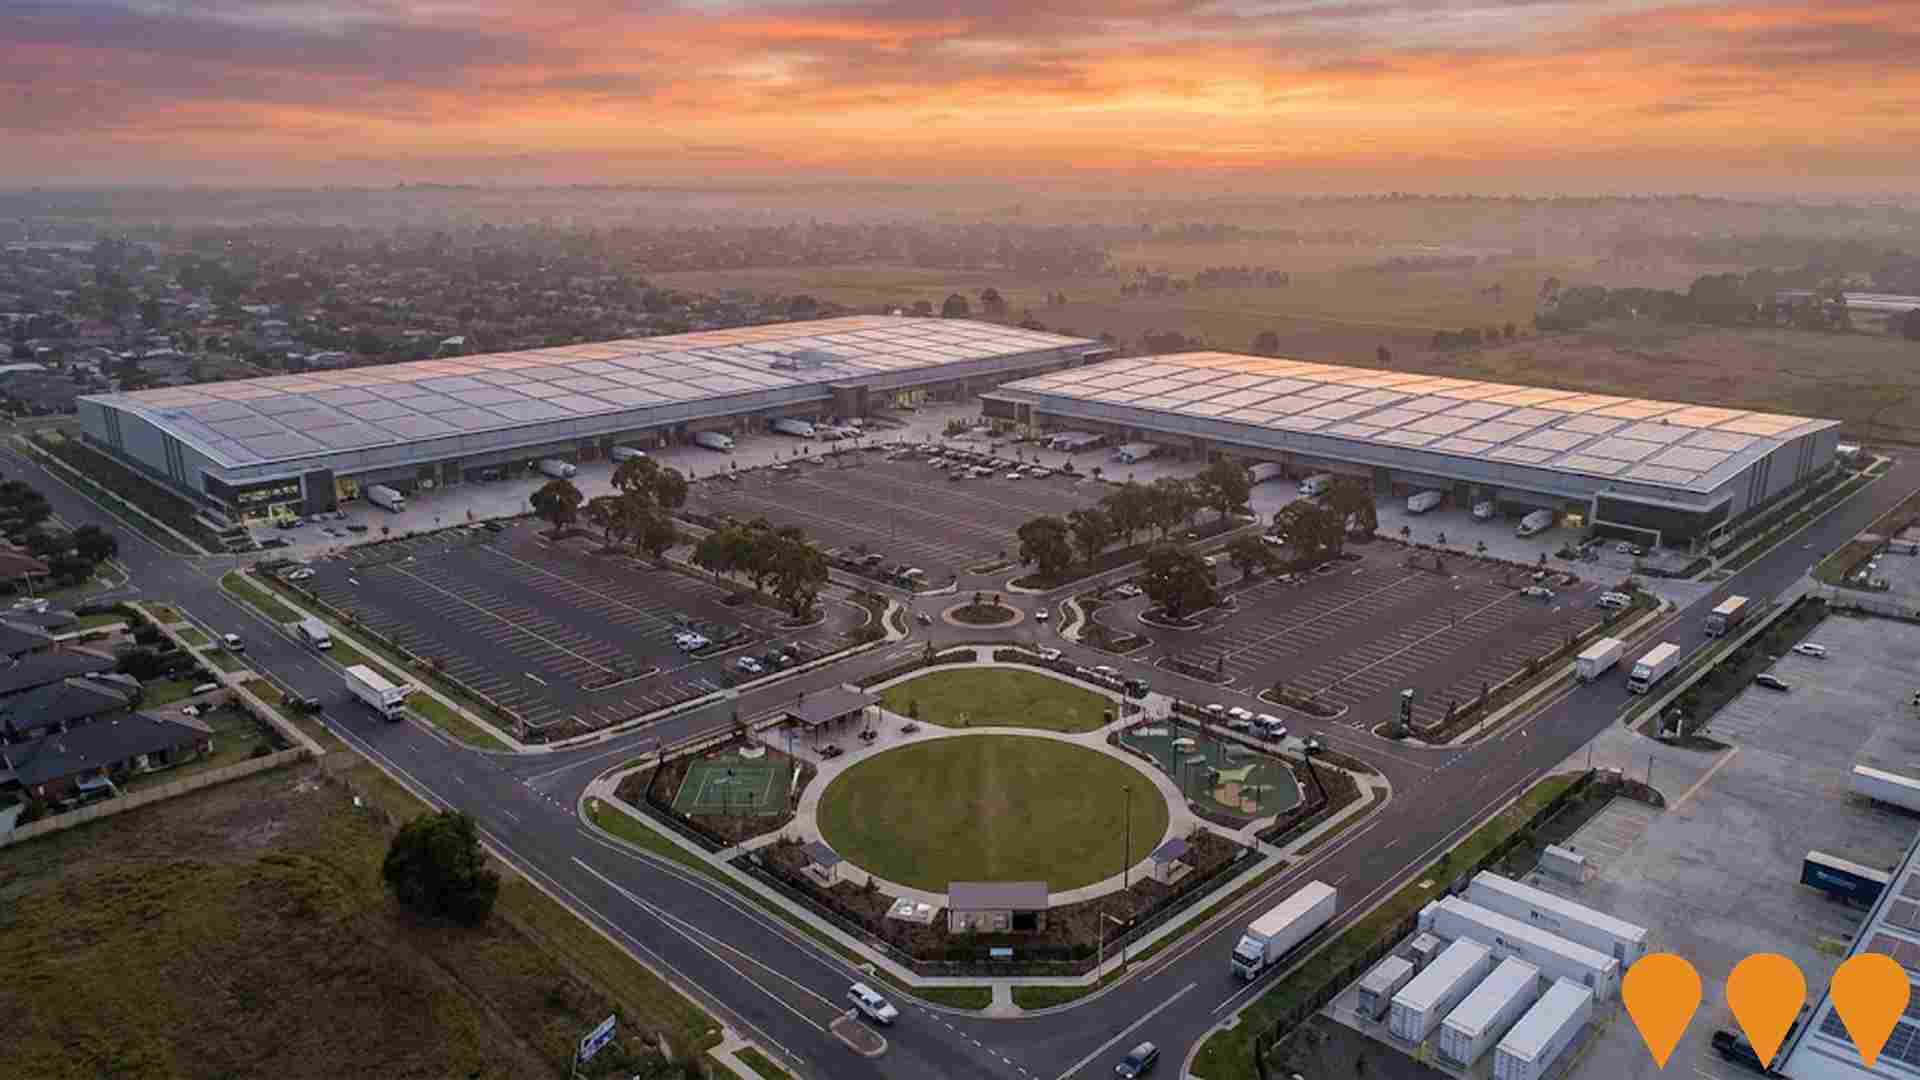
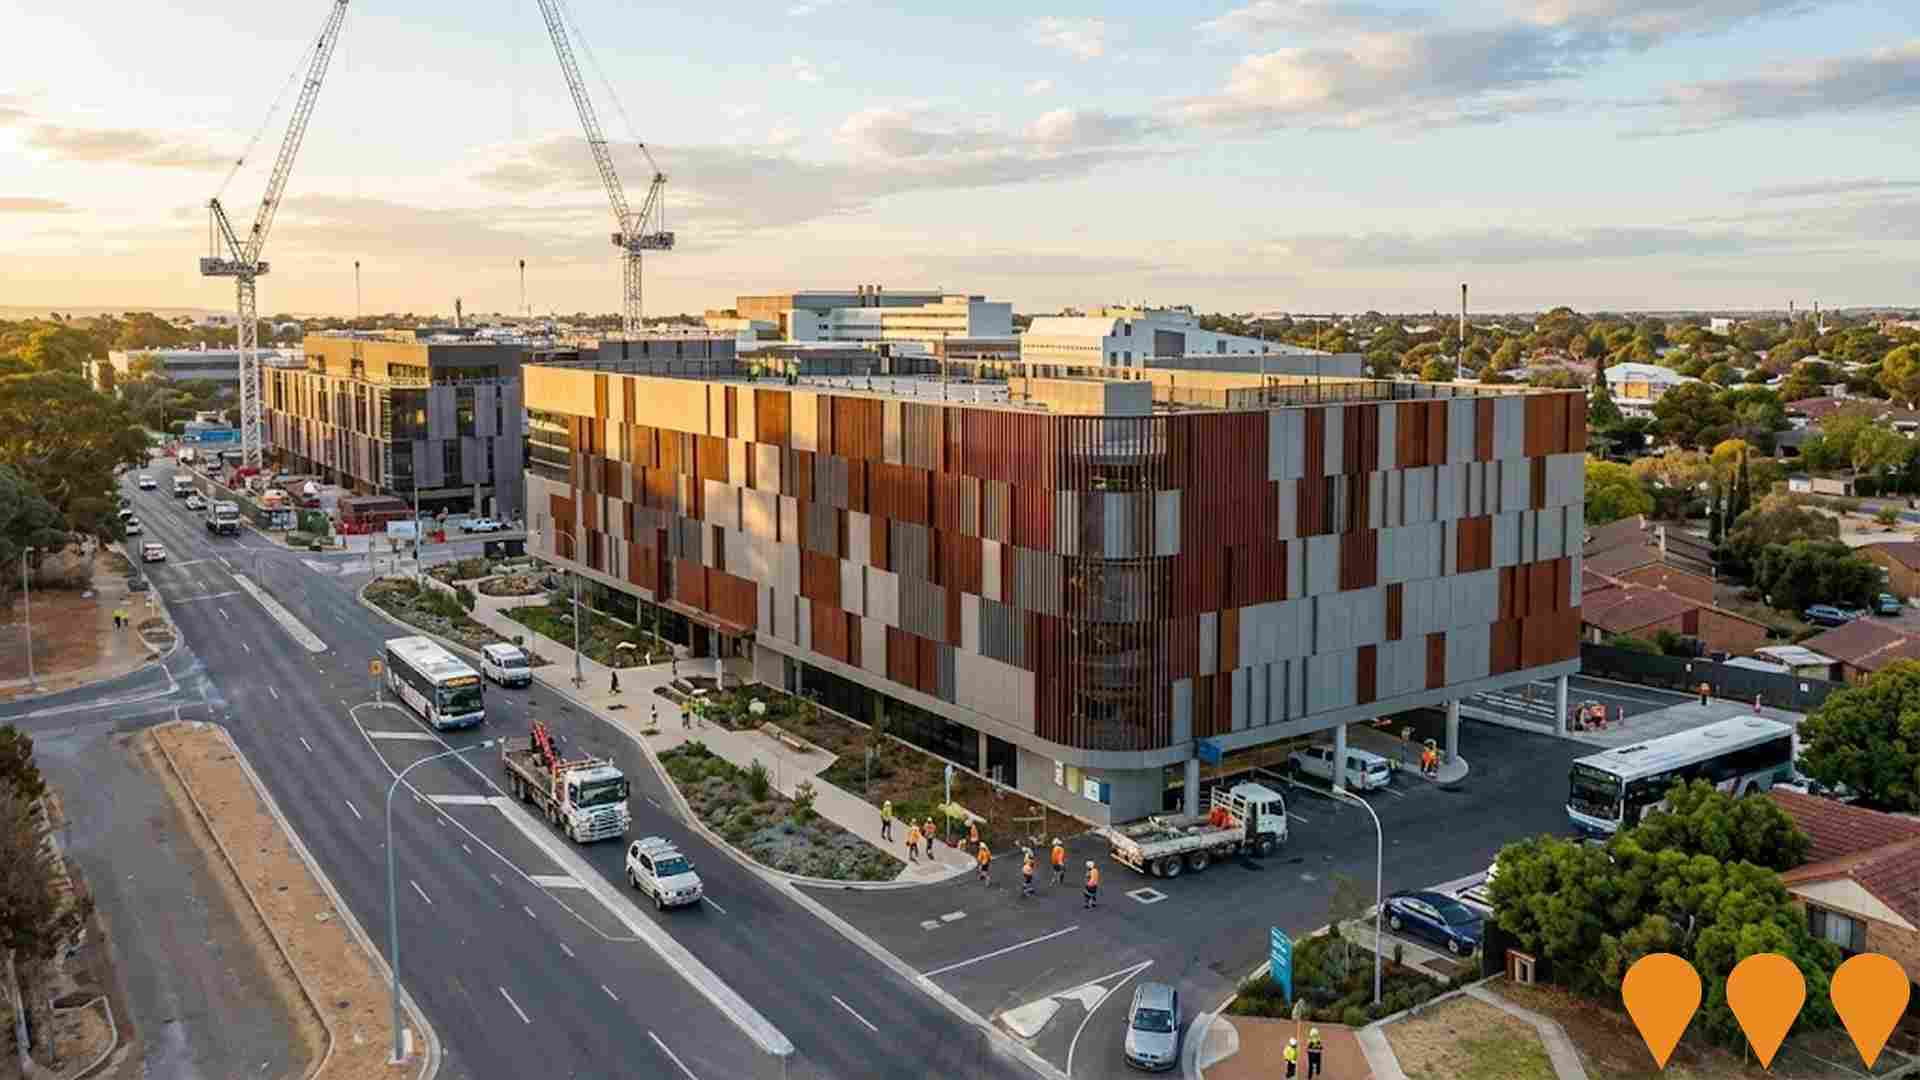
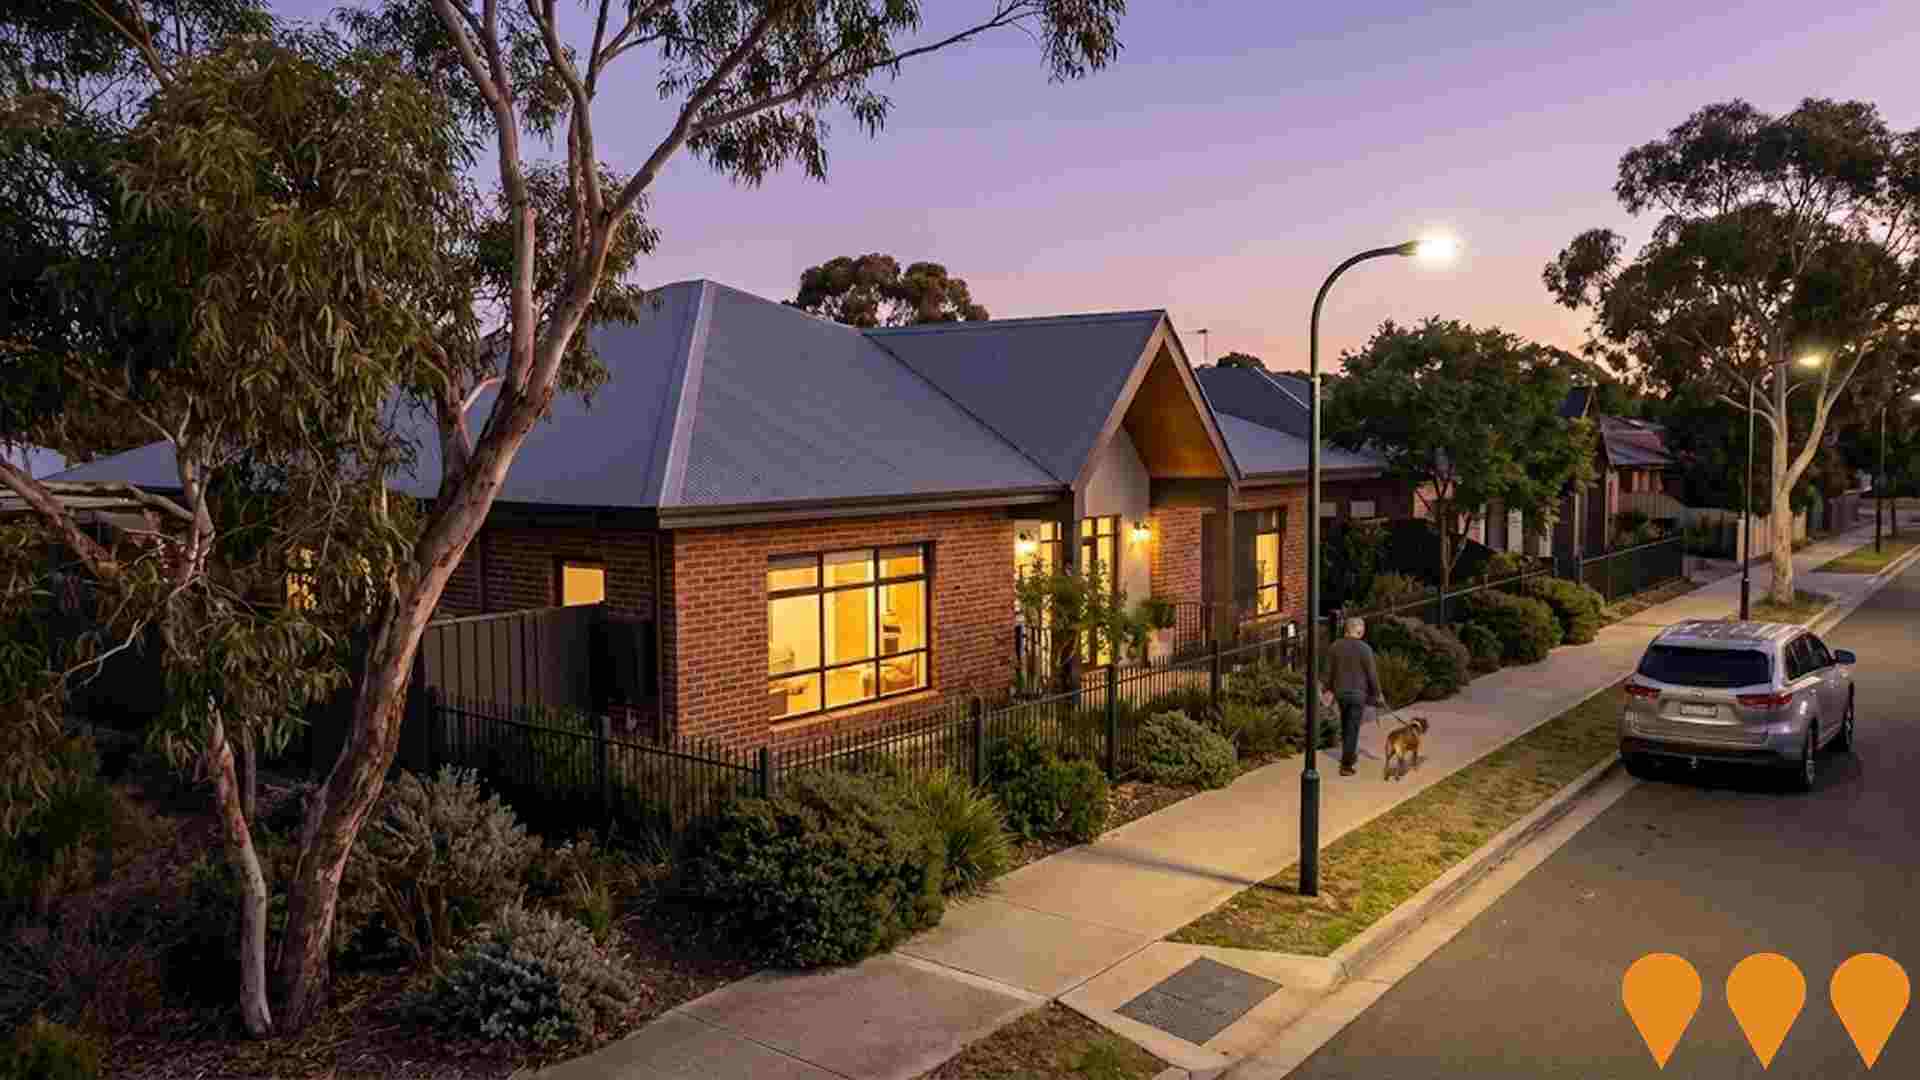
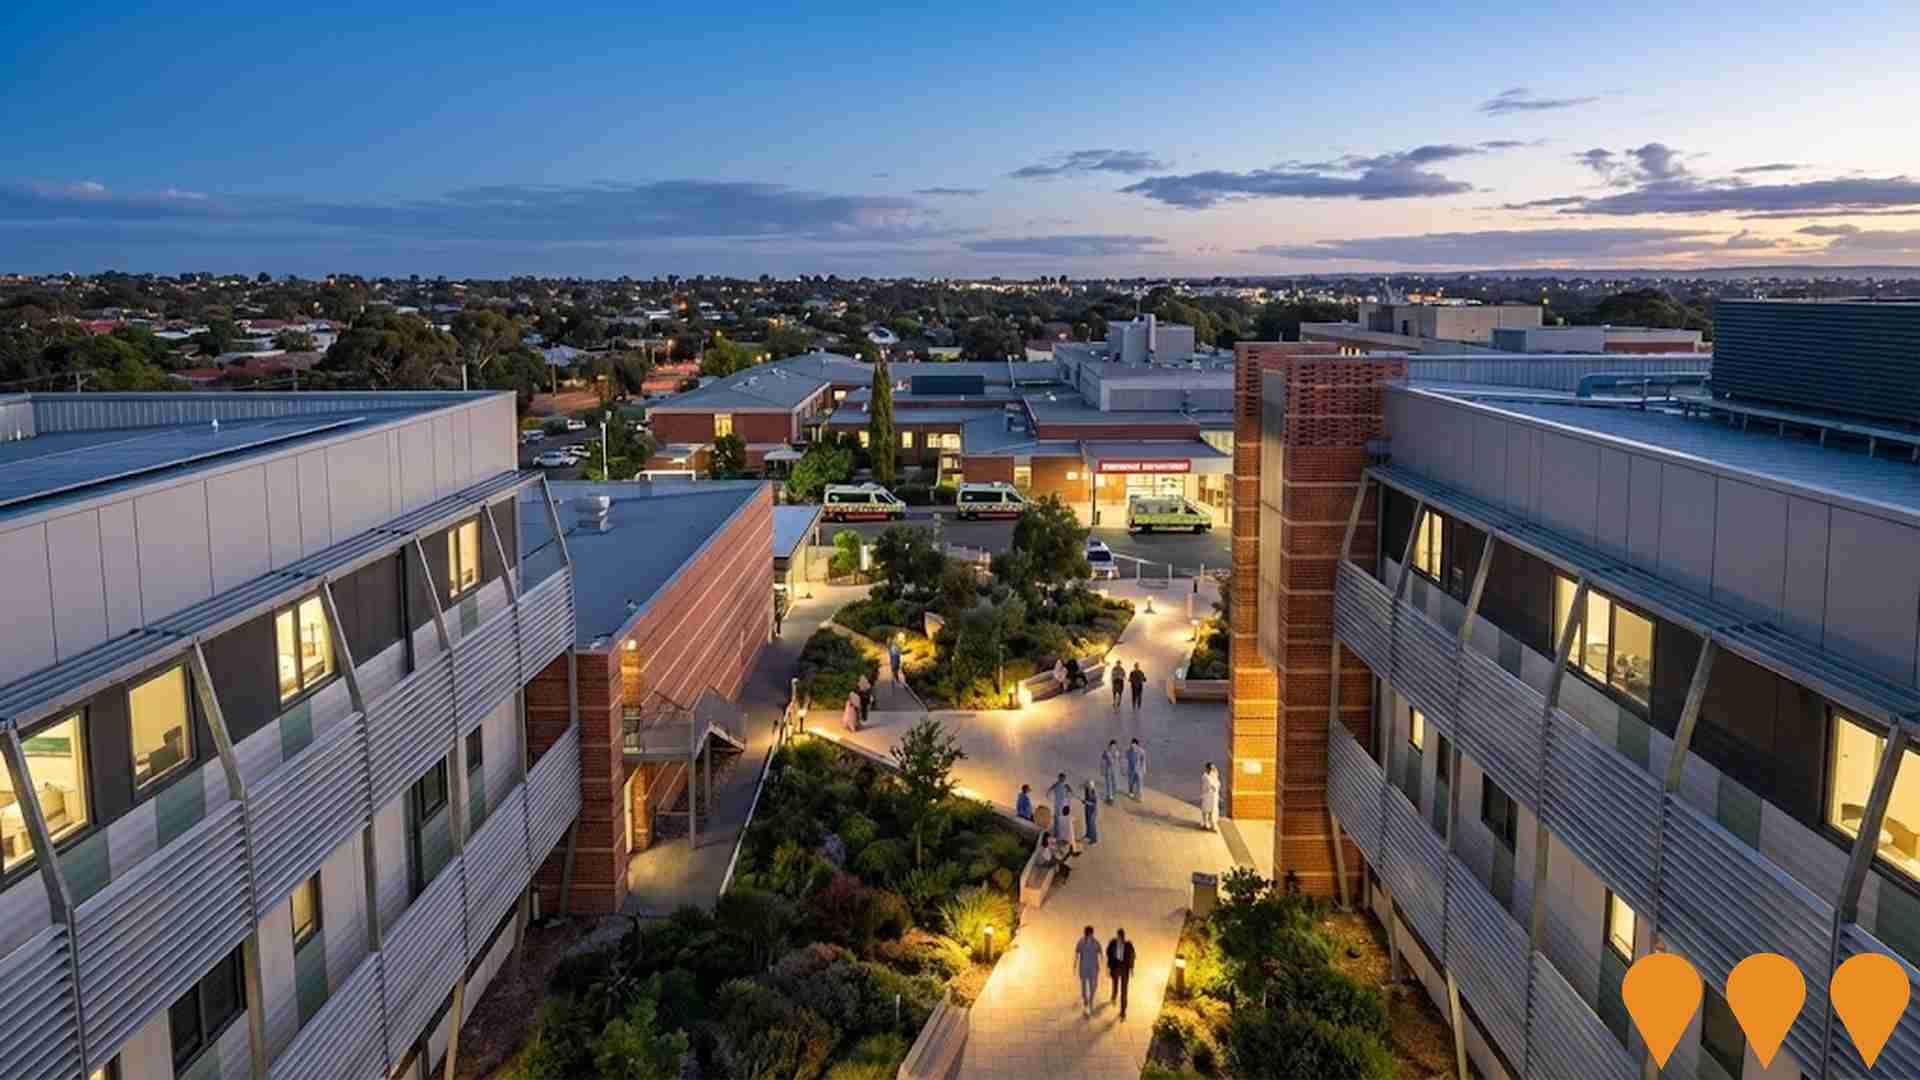
 Denotes AI-based impression for illustrative purposes only, not to be taken as definitive under any circumstances. Please follow links and conduct other investigations from the project's source for actual imagery. Developers and project owners wishing us to use original imagery please Contact Us and we will do so.
Frequently Asked Questions - Infrastructure
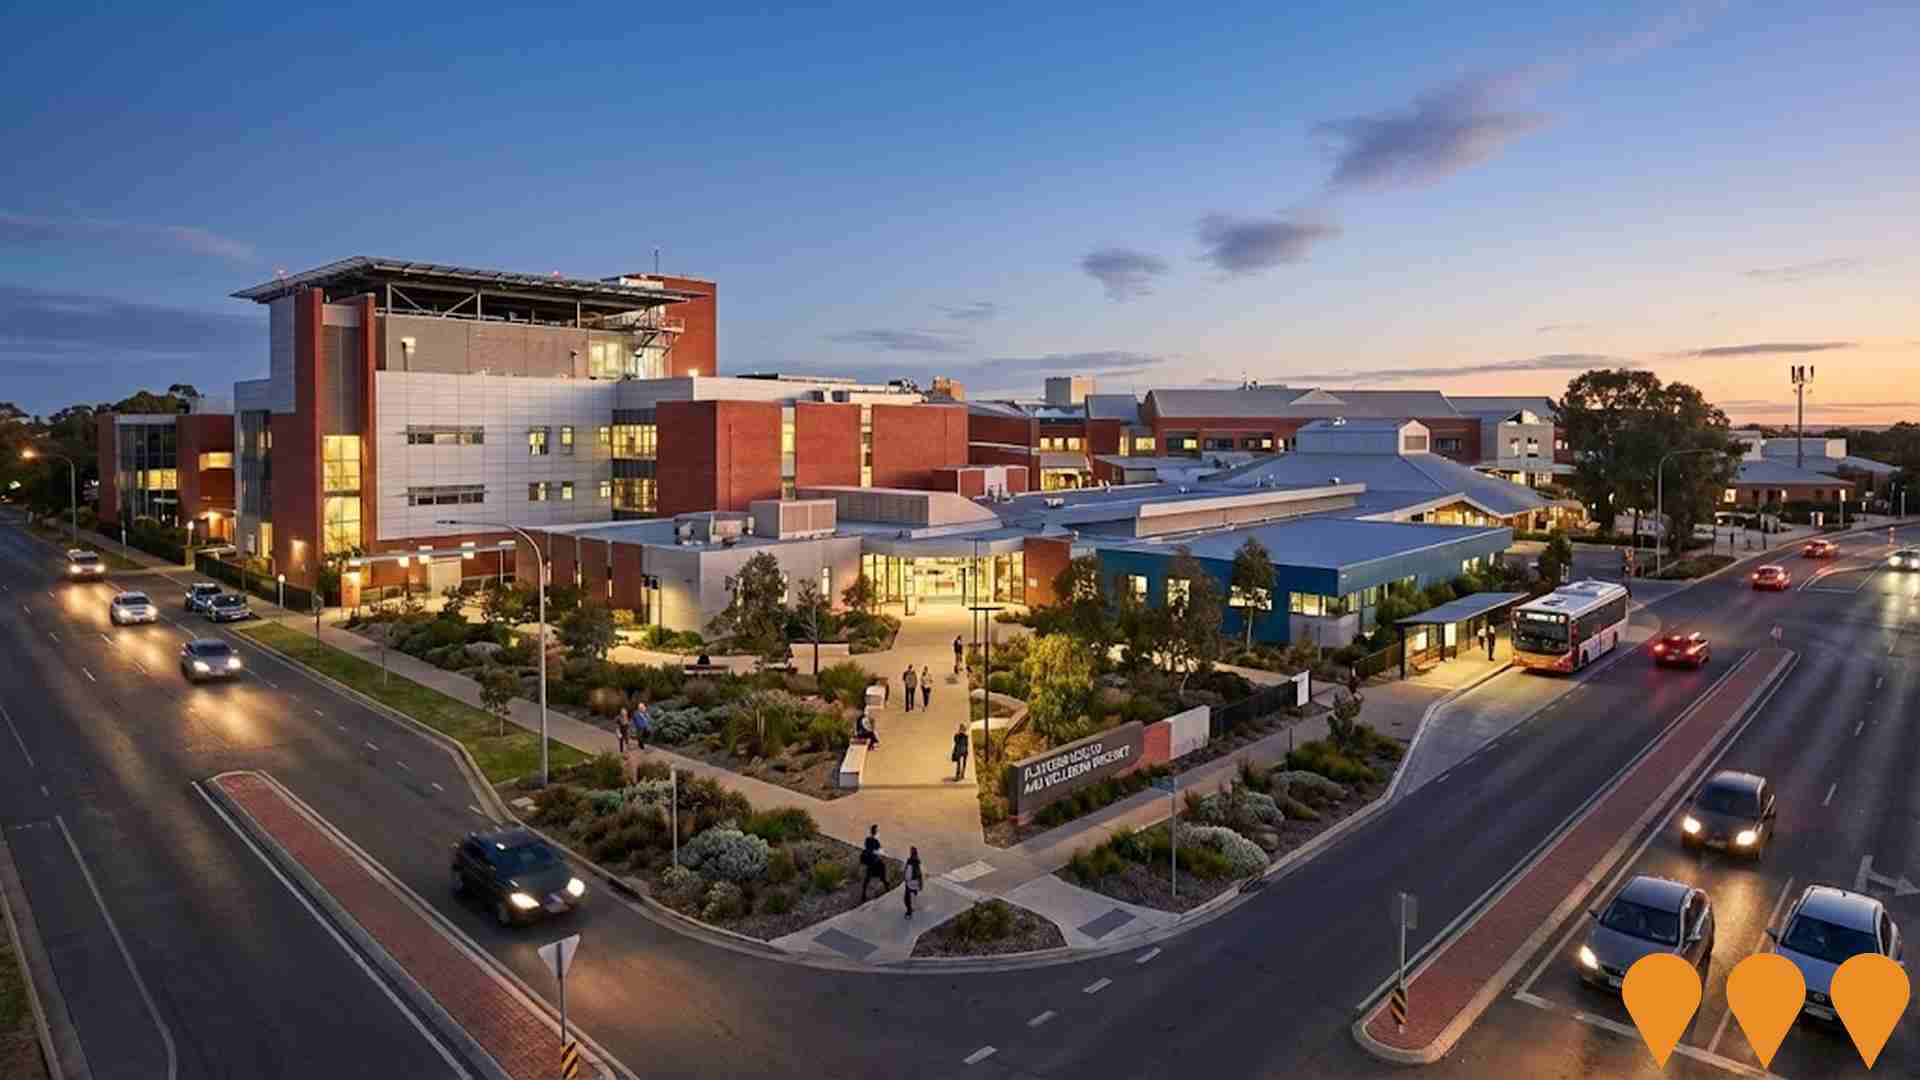
Playford Health Hub
Major health precinct opposite Lyell McEwin Hospital in northern Adelaide. Stage 1 (retail and 450-bay multi-deck car park) completed 2021. Stage 2 (specialist medical consulting, oncology, imaging and allied health) completed 2024. Stage 3 is a new 10-theatre, 120-bed private hospital operated by Calvary Adelaide Hospital. Construction commenced in Q4 2024 with practical completion expected mid-2027.
Elizabeth Vale Family Health and Wellbeing Hub
The WCH Foundation Family Health and Wellbeing Hub is a multipurpose community health facility featuring early parenting programs, perinatal and adolescent mental health support, student-led allied health clinics, and short-term residential accommodation for new mothers adjacent to the Lyell McEwin Hospital. Designed by Studio Nine Architects to create a welcoming, non-institutional environment with curved facades, extensive landscaping, and green walls. Part of the Playford Health and Wellbeing Precinct serving one of South Australia's fastest-growing communities.
Lionsgate Business Park
123ha multi-purpose business precinct redevelopment of the former Holden site into a hub for industrial, manufacturing, construction, engineering, automotive, and commercial uses, including a focus on sustainability with an on-site rooftop solar (up to 24MW) and a 150MW battery storage facility (Lionsgate Energy Storage System). It offers flexible tenancies and features a central park and sports/recreational facilities.
Playford Health Hub
Multi-stage redevelopment of former Elizabeth Vale Shopping Centre into modern health precinct. Includes 5,700 sqm of consulting rooms, allied health services, and 500+ car parks.
Healthia Aged Care Development
96-place residential care home comprising 8 small-scale homes with 12 private rooms each. Australia's first residential care home built to limit infectious virus spread. Partnership between ACH Group, NALHN, UniSA, and City of Playford.
Lyell McEwin Hospital Expansion
$47 million 48-bed expansion featuring two new 24-bed inpatient wards with single rooms and private bathrooms, specialised bariatric and mental health facilities, emergency department redevelopment with 76 spaces, and additional dialysis facilities. Major healthcare capacity increase for northern Adelaide region delivered by construction company 'Built'. Project completed in May 2025.
Edinburgh Central Mixed Use Development
Premier Defence, Innovation and Technology Hub in northern Adelaide. 3-hectare corner site featuring 8 retail tenancies (Stage 1 complete), 140-place purpose-built childcare centre, 15 mixed use warehouse/office units and 2 commercial buildings (Stage 2 under construction). Located in Edinburgh Defence Precinct near BAE Systems, Defence Science Technology Group and RAAF Base Edinburgh with Zone 3/4 defence compatibility.

Blakes Crossing Master Planned Community
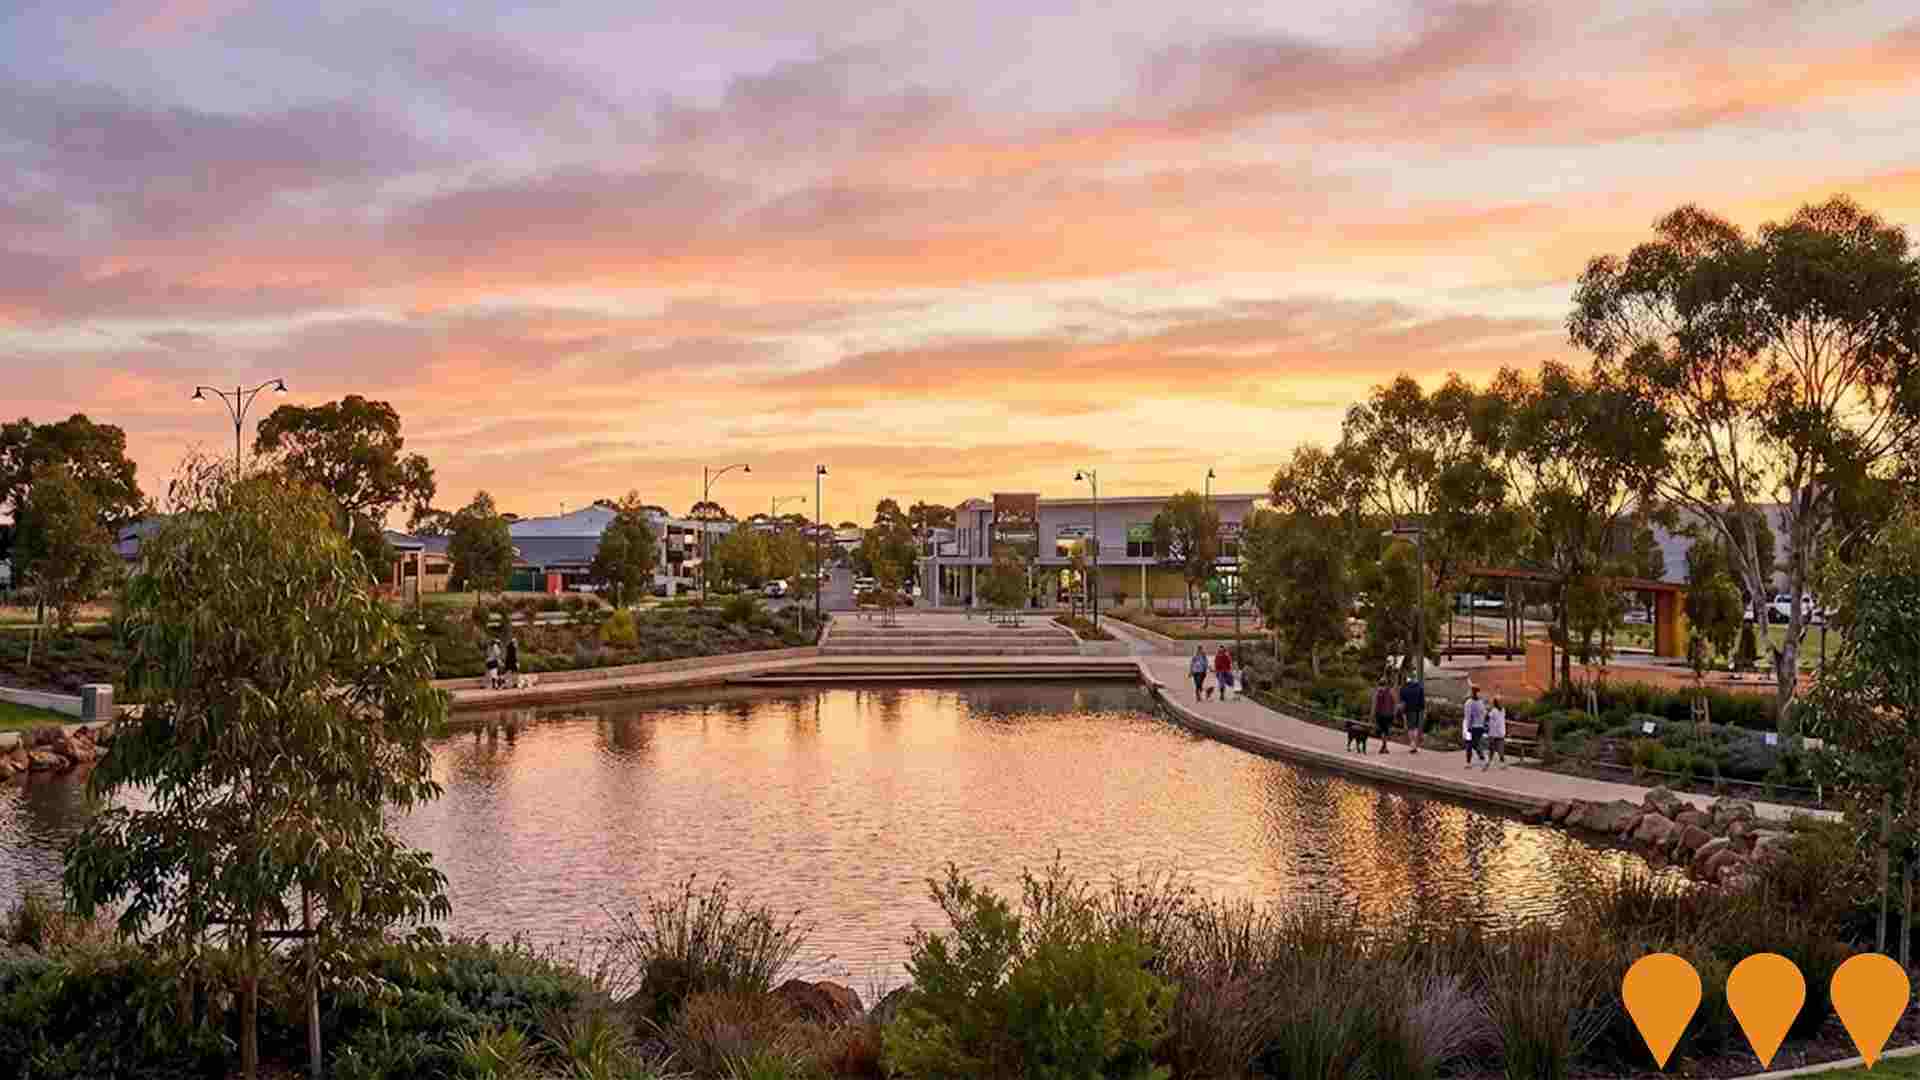
90-hectare master planned community development featuring shopping centre, schools, parks, and residential lots. Home to approximately 4,000 residents with Village Centre featuring Woolworths, Aldi and specialty stores. Includes 1.4 hectare park and lake, adventure playground and walking trails.
Employment
The labour market performance in Elizabeth East lags significantly behind most other regions nationally
Elizabeth East has a balanced workforce with representation from both white and blue-collar jobs. Key sectors are well-represented, and the unemployment rate as of September 2025 was 9.9%.
The area experienced an employment growth of 2.0% in the past year. There were 5,919 residents employed by September 2025, with an unemployment rate 5.9% higher than Greater Adelaide's rate of 3.9%, indicating room for improvement. Workforce participation lagged significantly at 53.3%, compared to Greater Adelaide's 61.7%. The leading employment industries among residents were health care & social assistance, retail trade, and construction.
Manufacturing stood out with employment levels at 1.4 times the regional average. However, professional & technical services employed only 3.3% of local workers, lower than Greater Adelaide's 7.3%. The area appears to offer limited local employment opportunities based on Census data comparisons between working population and resident population. Over a 12-month period ending September 2025, employment increased by 2.0%, while the labour force grew by 1.2%, leading to a 0.7 percentage point decrease in unemployment rate. In comparison, Greater Adelaide recorded employment growth of 3.0% and a 0.1 percentage point reduction in unemployment rate during the same period. State-level data as of 25-Nov-25 shows South Australia's employment grew by 1.19% year-on-year, adding 10,710 jobs, with an unemployment rate of 4.0%. This compares favourably to the national unemployment rate of 4.3%, with South Australia's employment growth outpacing the national average of 0.14%. Jobs and Skills Australia's national employment forecasts from May-25 suggest that national employment will expand by 6.6% over five years and 13.7% over ten years. Applying these projections to Elizabeth East's employment mix indicates local employment should increase by 5.9% over five years and 12.8% over ten years, based on simple weighting extrapolations for illustrative purposes.
Frequently Asked Questions - Employment
Income
Income metrics place the area in the bottom 10% of locations nationally according to AreaSearch analysis
Elizabeth East SA2 had a median taxpayer income of $42,709 and an average of $46,575 in financial year 2022, according to postcode level ATO data aggregated by AreaSearch. This was lower than the national average, with Greater Adelaide's median income being $52,592 and average income $64,886. By September 2025, estimates based on Wage Price Index growth of 12.83% suggest the median income would be approximately $48,189 and average income $52,551. In 2021 Census figures, Elizabeth East's incomes ranked between the 9th and 12th percentiles nationally. The $800 - 1,499 income bracket dominated with 29.9% of residents (4,326 people), contrasting with regional levels where the $1,500 - 2,999 bracket led at 31.8%. Housing affordability pressures were severe, with only 82.8% of income remaining, ranking at the 12th percentile nationally.
Frequently Asked Questions - Income
Housing
Elizabeth East is characterized by a predominantly suburban housing profile, with above-average rates of outright home ownership
Elizabeth East's dwelling structure, as per the latest Census, consisted of 82.9% houses and 17.1% other dwellings (semi-detached, apartments, 'other' dwellings), compared to Adelaide metro's 83.7% houses and 16.2% other dwellings. Home ownership in Elizabeth East stood at 24.2%, with mortgaged dwellings at 41.2% and rented ones at 34.6%. The median monthly mortgage repayment was $1,233, below Adelaide metro's average of $1,300. Median weekly rent in the area was $251, compared to Adelaide metro's $265. Nationally, Elizabeth East's mortgage repayments were significantly lower than the Australian average of $1,863, and rents were substantially below the national figure of $375.
Frequently Asked Questions - Housing
Household Composition
Elizabeth East has a typical household mix, with a fairly typical median household size
Family households constitute 69.5% of all households, including 27.7% couples with children, 21.7% couples without children, and 18.5% single parent families. Non-family households account for the remaining 30.5%, with lone person households at 27.2% and group households comprising 3.2%. The median household size is 2.6 people, which matches the Greater Adelaide average.
Frequently Asked Questions - Households
Local Schools & Education
Elizabeth East faces educational challenges, with performance metrics placing it in the bottom quartile of areas assessed nationally
The area's university qualification rate is 10.8%, significantly lower than the Australian average of 30.4%. This disparity presents both a challenge and an opportunity for targeted educational initiatives. Bachelor degrees are the most common (8.1%), followed by postgraduate qualifications (1.4%) and graduate diplomas (1.3%). Trade and technical skills are prevalent, with 37.7% of residents aged 15 and above holding vocational credentials.
This includes advanced diplomas (8.4%) and certificates (29.3%). Educational participation is high, with 30.0% of residents currently enrolled in formal education. This comprises 12.6% in primary education, 7.5% in secondary education, and 3.5% pursuing tertiary education.
Frequently Asked Questions - Education
Schools Detail
Nearby Services & Amenities
Transport
Transport servicing is moderate compared to other areas nationally based on assessment of service frequency, route connectivity and accessibility
Elizabeth East has 82 active public transport stops, all of which are bus stops. These stops are served by 17 different routes that together facilitate 1,064 weekly passenger trips. The area's transport accessibility is rated as good, with residents typically living within 215 meters of the nearest stop.
On average, there are 152 daily trips across all routes, equating to about 12 weekly trips per individual stop.
Frequently Asked Questions - Transport
Transport Stops Detail
Health
Health performance in Elizabeth East is well below average with a range of health conditions having marked impacts on both younger and older age cohorts
Elizabeth East faces significant health challenges, as indicated by health data. A variety of health conditions affect both younger and older age groups.
Private health cover is low, at approximately 46% (~6,714 people), compared to the national average of 55.3%. Mental health issues are the most common condition, affecting 11.3% of residents, followed by asthma at 9.6%. 62.0% of residents report no medical ailments, slightly lower than Greater Adelaide's 63.4%. The area has a higher proportion of seniors aged 65 and over, at 15.5% (2,244 people), compared to Greater Adelaide's 13.3%. Health outcomes among seniors generally align with the overall population's health profile.
Frequently Asked Questions - Health
Cultural Diversity
The level of cultural diversity witnessed in Elizabeth East was found to be above average when compared nationally for a number of language and cultural background related metrics
Elizabeth East had a higher cultural diversity than most local markets, with 27.9% of its population born overseas and 18.2% speaking a language other than English at home. Christianity was the predominant religion in Elizabeth East, making up 35.9% of its population. Islam was notably overrepresented, comprising 8.5% compared to the regional average of 4.0%.
The top three ancestry groups were English (32.1%), Australian (25.0%), and Other (13.3%). Some ethnic groups showed notable differences: Maltese at 0.6% versus 0.4% regionally, German at 4.1% versus 4.4%, and Welsh at 0.6% versus 0.5%.
Frequently Asked Questions - Diversity
Age
Elizabeth East's population is slightly younger than the national pattern
The median age in Elizabeth East is 36 years, which is slightly below Greater Adelaide's average of 39 years and also slightly below the Australian median of 38 years. Compared to Greater Adelaide, Elizabeth East has a higher percentage of residents aged 5-14 (14.3%) but fewer residents aged 75-84 (4.7%). Between the 2021 Census and now, the age group of 35-44 has increased from 12.4% to 13.6% of the population. Conversely, the age group of 45-54 has decreased from 12.0% to 10.8%. By the year 2041, Elizabeth East is projected to experience significant changes in its age composition. The demographic shift will be led by the 45-54 age group, which is expected to grow by 52%, adding 808 people and reaching a total of 2,377 from the current figure of 1,568.
