Chart Color Schemes
This analysis uses ABS Statistical Areas Level 2 (SA2) boundaries, which can materially differ from Suburbs and Localities (SAL) even when sharing similar names.
SA2 boundaries are defined by the Australian Bureau of Statistics and are designed to represent communities for statistical reporting (e.g., census and ERP).
Suburbs and Localities (SAL) represent commonly-used suburb/locality names (postal-style areas) and may use different geographic boundaries. For comprehensive analysis, consider reviewing both boundary types if available.
est. as @ -- *
ABS ERP | -- people | --
2021 Census | -- people
Sales Activity
Curious about local property values? Filter the chart to assess the volume and appreciation (including resales) trends and regional comparisons, or scroll to the map below view this information at an individual property level.
Find a Recent Sale
Sales Detail
Population
Population growth drivers in Parafield Gardens are above average based on AreaSearch's ranking of recent, and medium to long-term trends
Parafield Gardens' population is approximately 18,631 as of November 2025. This figure shows an increase of 164 people since the 2021 Census, which recorded a population of 18,467. The population growth from June 2024 to November 2025 is inferred from ABS estimates and includes 81 validated new addresses. The population density ratio is approximately 2,650 persons per square kilometer, placing Parafield Gardens in the upper quartile of national locations assessed by AreaSearch. Over the past decade, ending in June 2024, Parafield Gardens has shown a compound annual growth rate of 1.3%, outperforming its SA3 area. Overseas migration contributed approximately 65.5% of overall population gains during recent periods.
AreaSearch uses ABS/Geoscience Australia projections for each SA2 area, released in 2024 with a base year of 2022. For areas not covered by this data and years post-2032, the SA State Government's Regional/LGA projections are adopted with adjustments made using weighted aggregation methods from LGA to SA2 levels. According to demographic trends, lower quartile growth is anticipated for statistical areas across the nation. Parafield Gardens is expected to grow by 846 persons to reach a total population of approximately 19,477 by 2041, reflecting an increase of 4.5% over the 17-year period based on the latest annual ERP population numbers.
Frequently Asked Questions - Population
Development
Residential development activity is lower than average in Parafield Gardens according to AreaSearch's national comparison of local real estate markets
Parafield Gardens has averaged approximately 65 new dwelling approvals annually. Between FY-21 and FY-25, a total of 325 homes were approved, with an additional 28 approved in FY-26 so far. Over these five financial years, an average of only 0.5 people moved to the area per dwelling built.
This suggests that new supply is meeting or exceeding demand, providing ample buyer choice and creating capacity for population growth beyond current forecasts. The average construction value of new homes was $155,000, which is below the regional average, indicating more affordable housing options for buyers. In FY-26, there have been $13.6 million in commercial approvals, suggesting balanced commercial development activity. Compared to Greater Adelaide, Parafield Gardens maintains similar construction rates per person, preserving market equilibrium consistent with surrounding areas.
However, these rates are lower than the national average, reflecting market maturity and potential development constraints. New building activity consists of 85.0% standalone homes and 15.0% townhouses or apartments, sustaining the area's suburban identity with a concentration of family homes suited to buyers seeking space. With around 478 people per dwelling approval, Parafield Gardens shows a developed market. Future projections estimate that Parafield Gardens will add 829 residents by 2041. At current development rates, new housing supply should comfortably meet demand, providing good conditions for buyers and potentially supporting growth beyond current population projections.
Frequently Asked Questions - Development
Infrastructure
Parafield Gardens has limited levels of nearby infrastructure activity, ranking in the 8thth percentile nationally
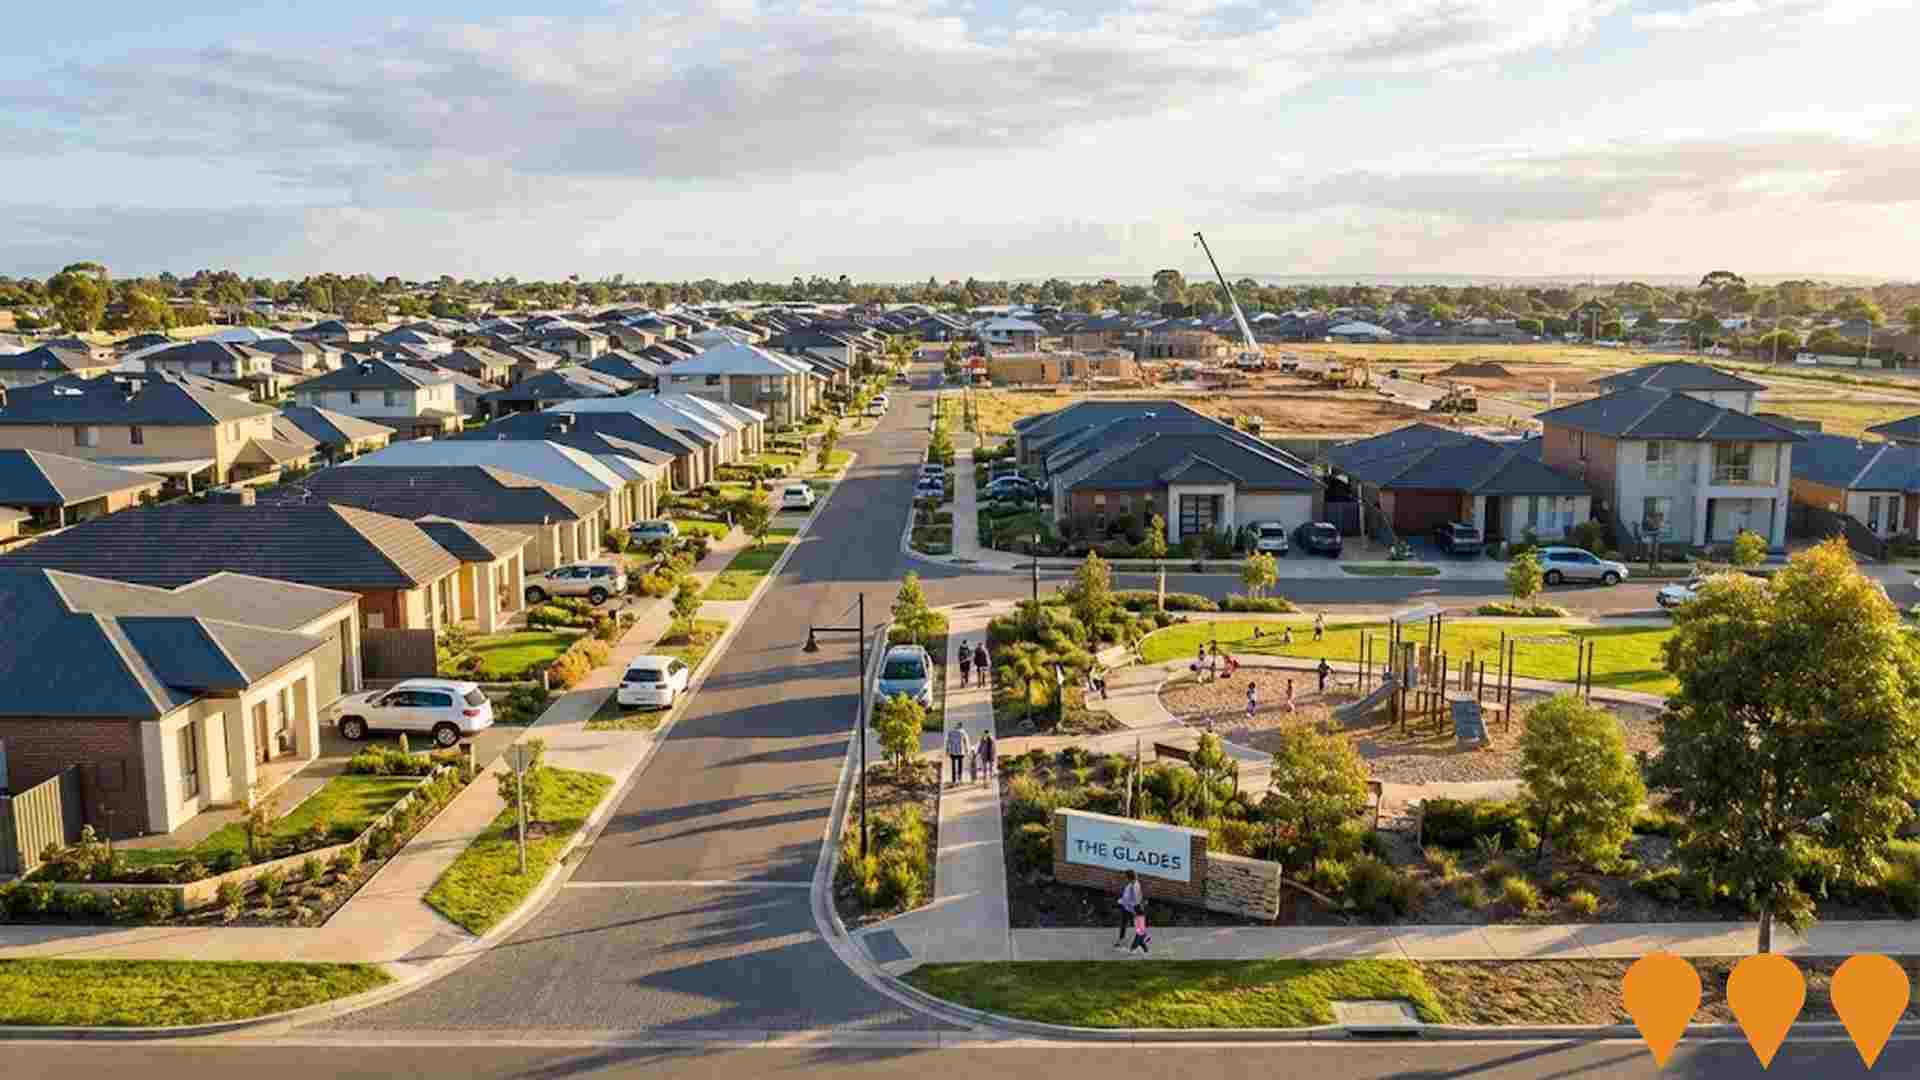
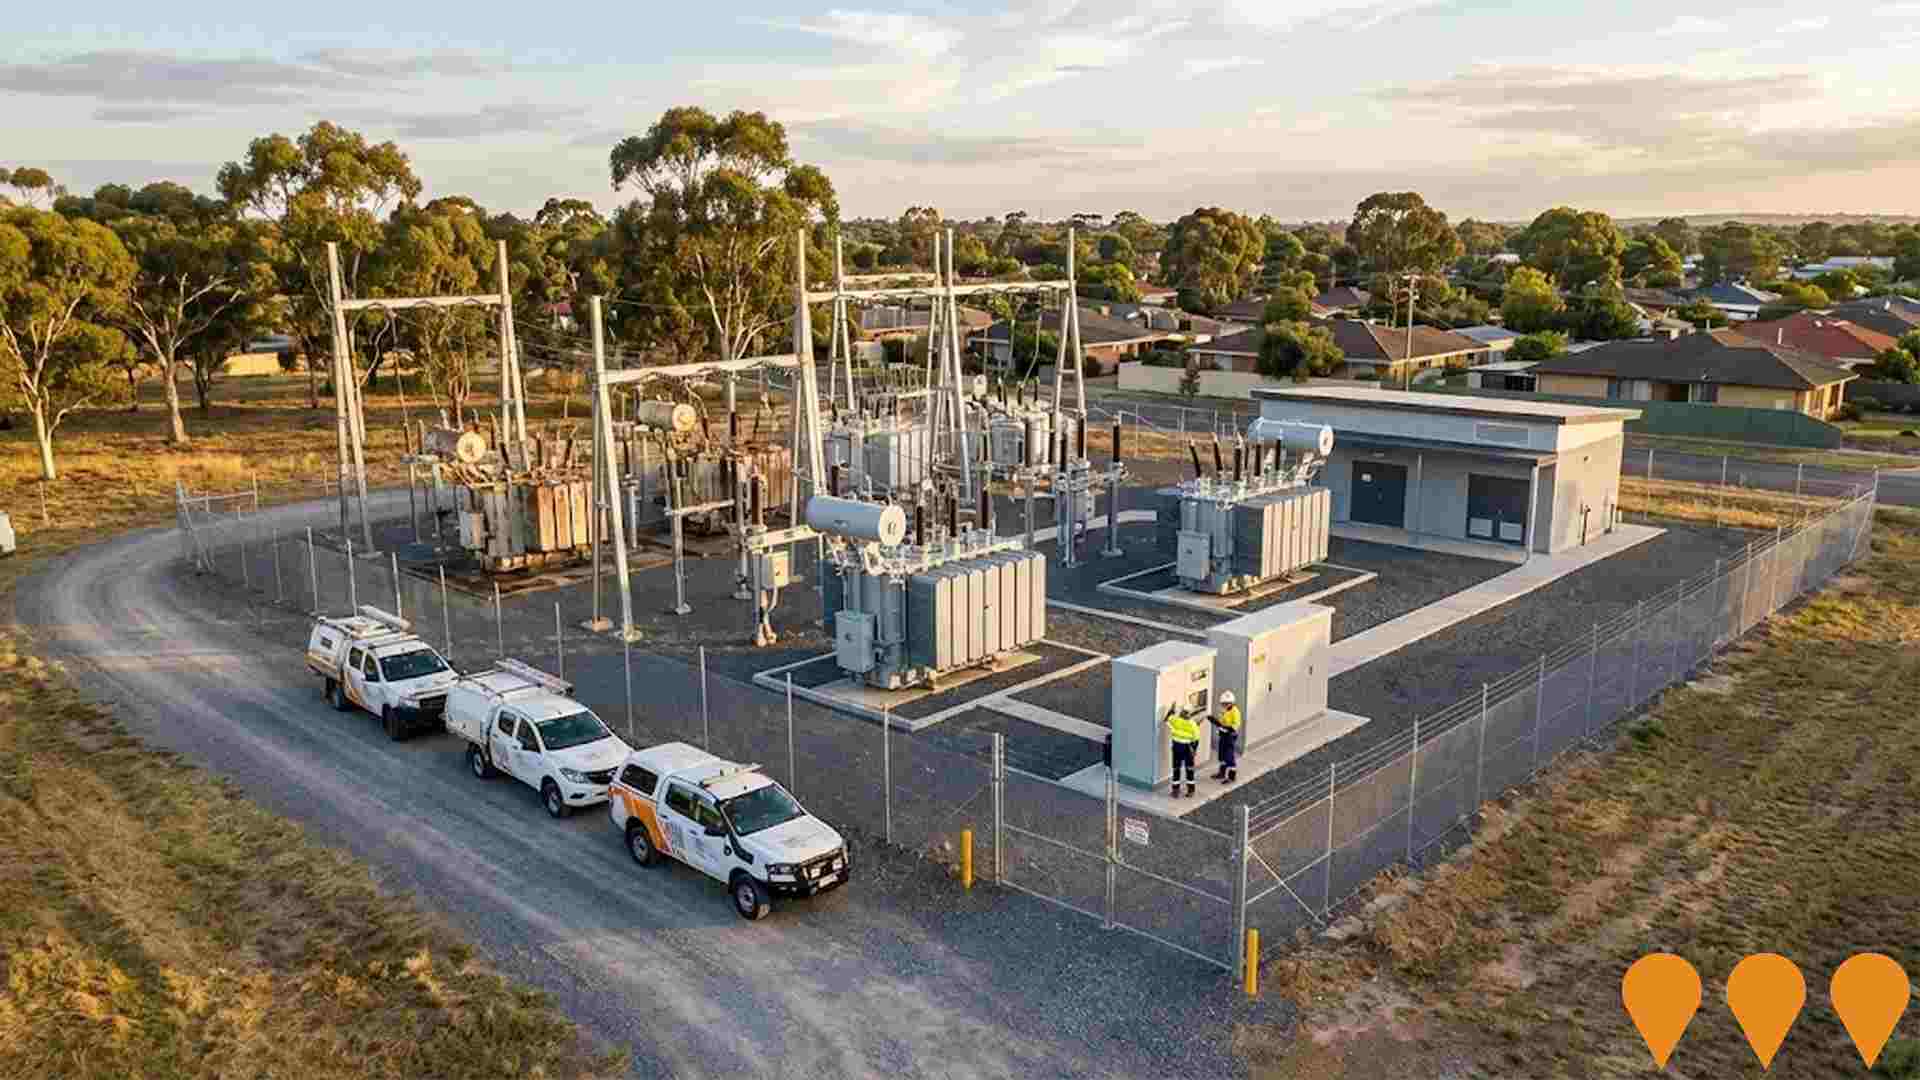
Changes to local infrastructure significantly impact an area's performance. AreaSearch has identified fifteen projects likely affecting the region. Notable initiatives include The Glades, Parafield Gardens (Stage 8+), Mawson Lakes Road Management Plan, Public Housing Builds in Parafield Gardens, and Gardenia Drive Aged Care Expansion. Below is a list of projects expected to be most relevant.
Professional plan users can use the search below to filter and access additional projects.
INFRASTRUCTURE SEARCH
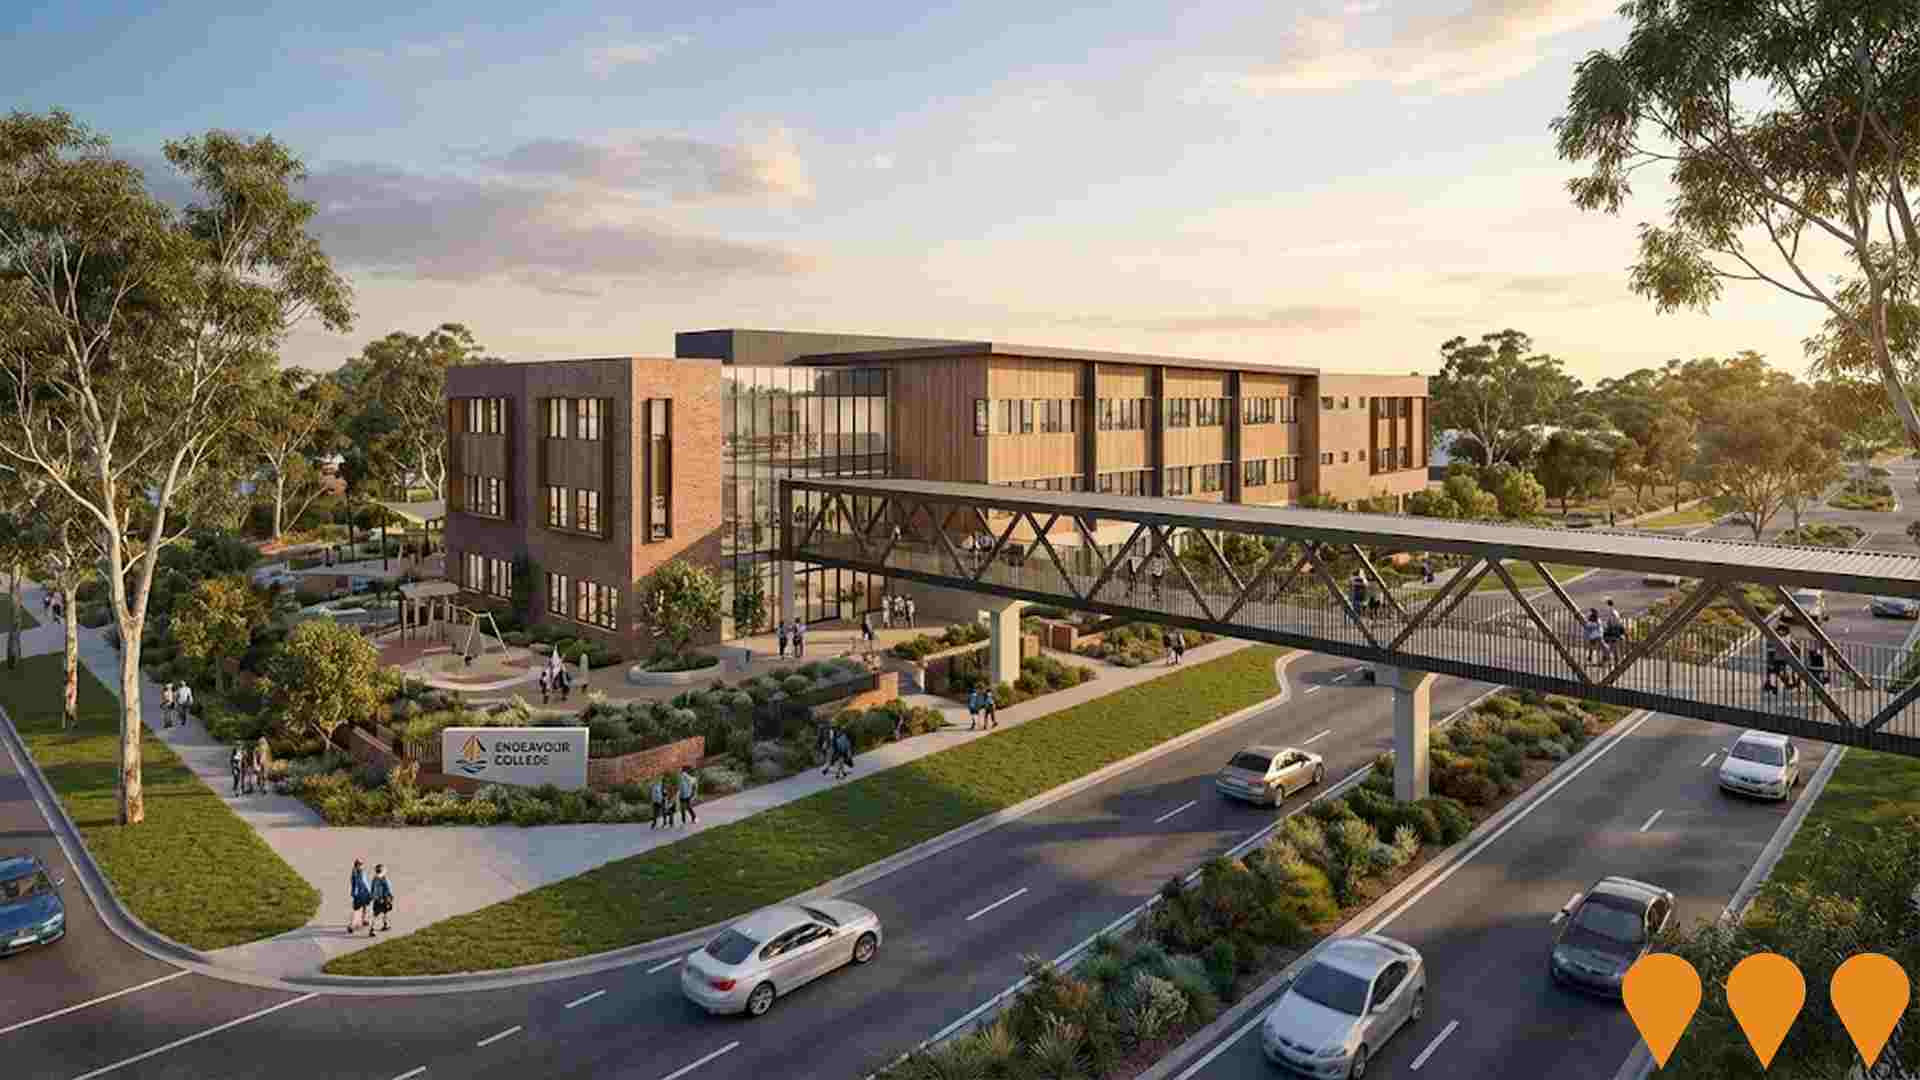
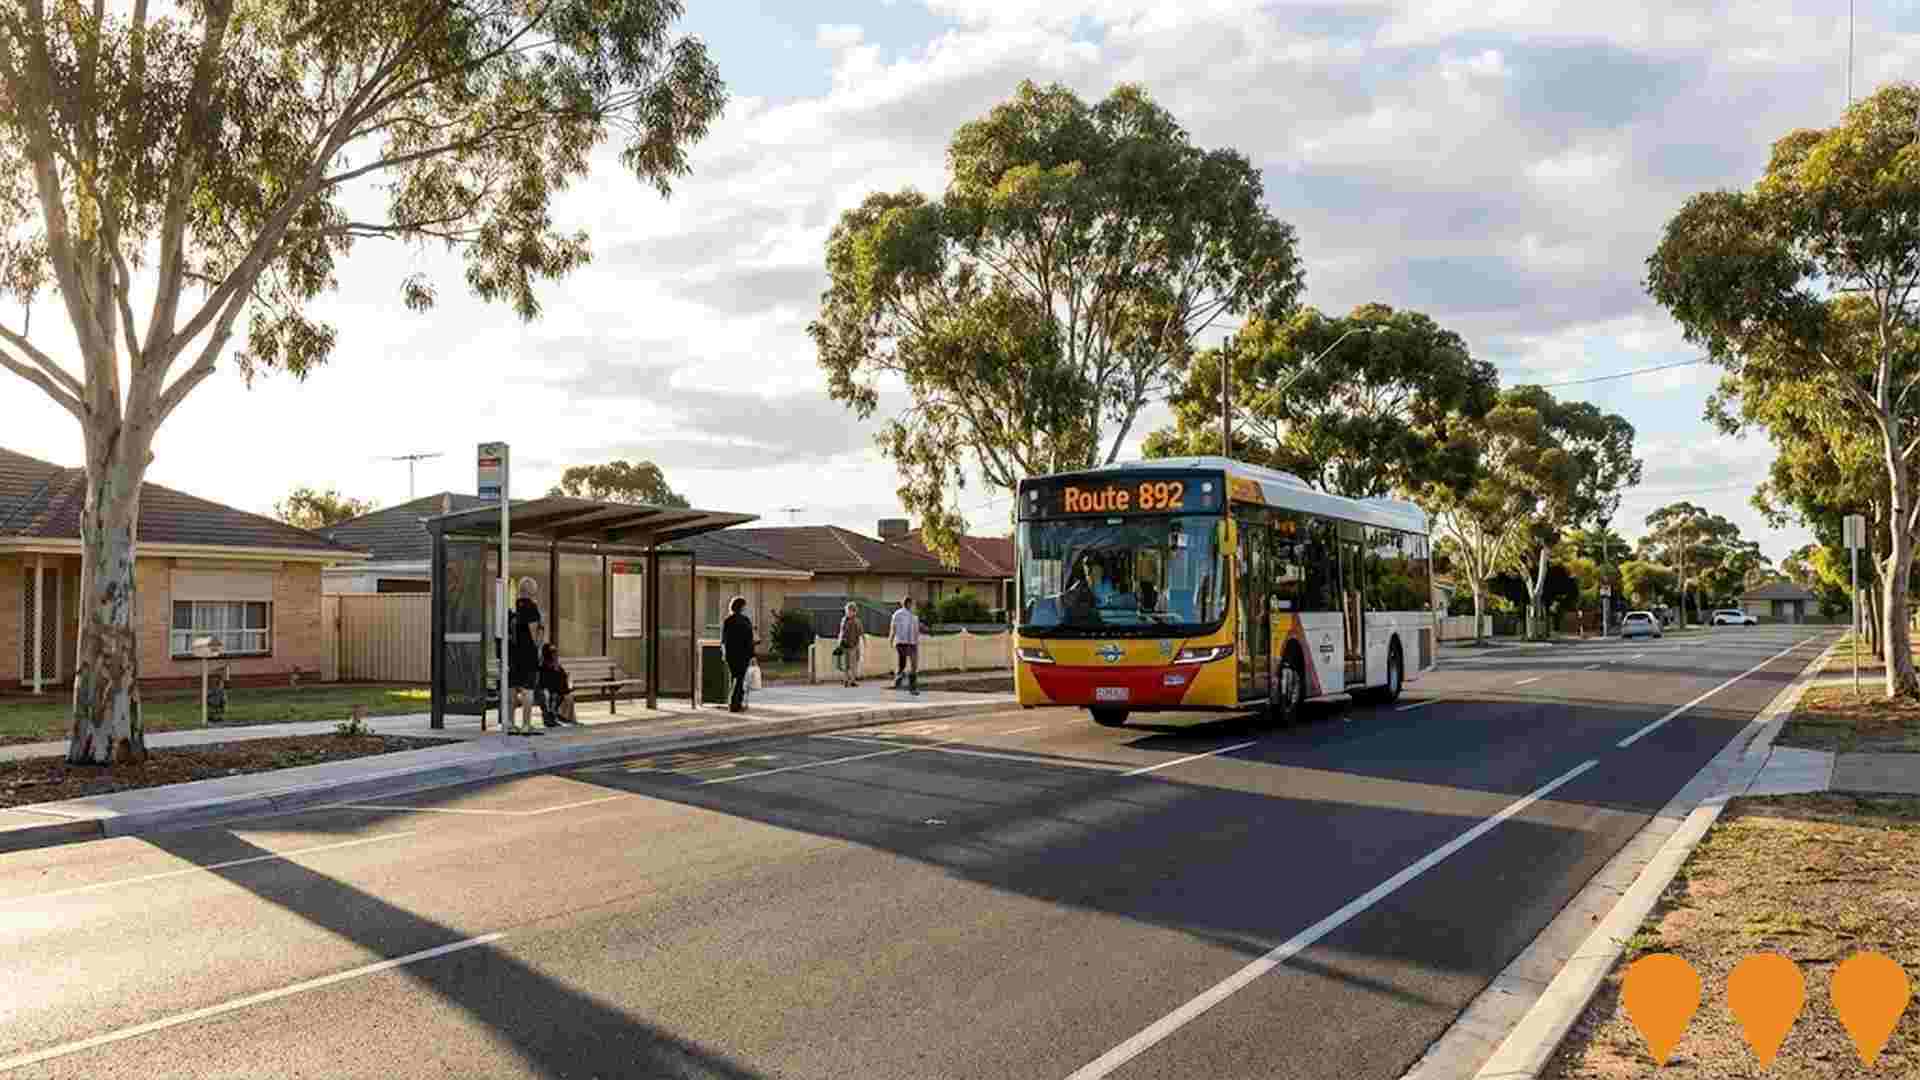
 Denotes AI-based impression for illustrative purposes only, not to be taken as definitive under any circumstances. Please follow links and conduct other investigations from the project's source for actual imagery. Developers and project owners wishing us to use original imagery please Contact Us and we will do so.
Frequently Asked Questions - Infrastructure
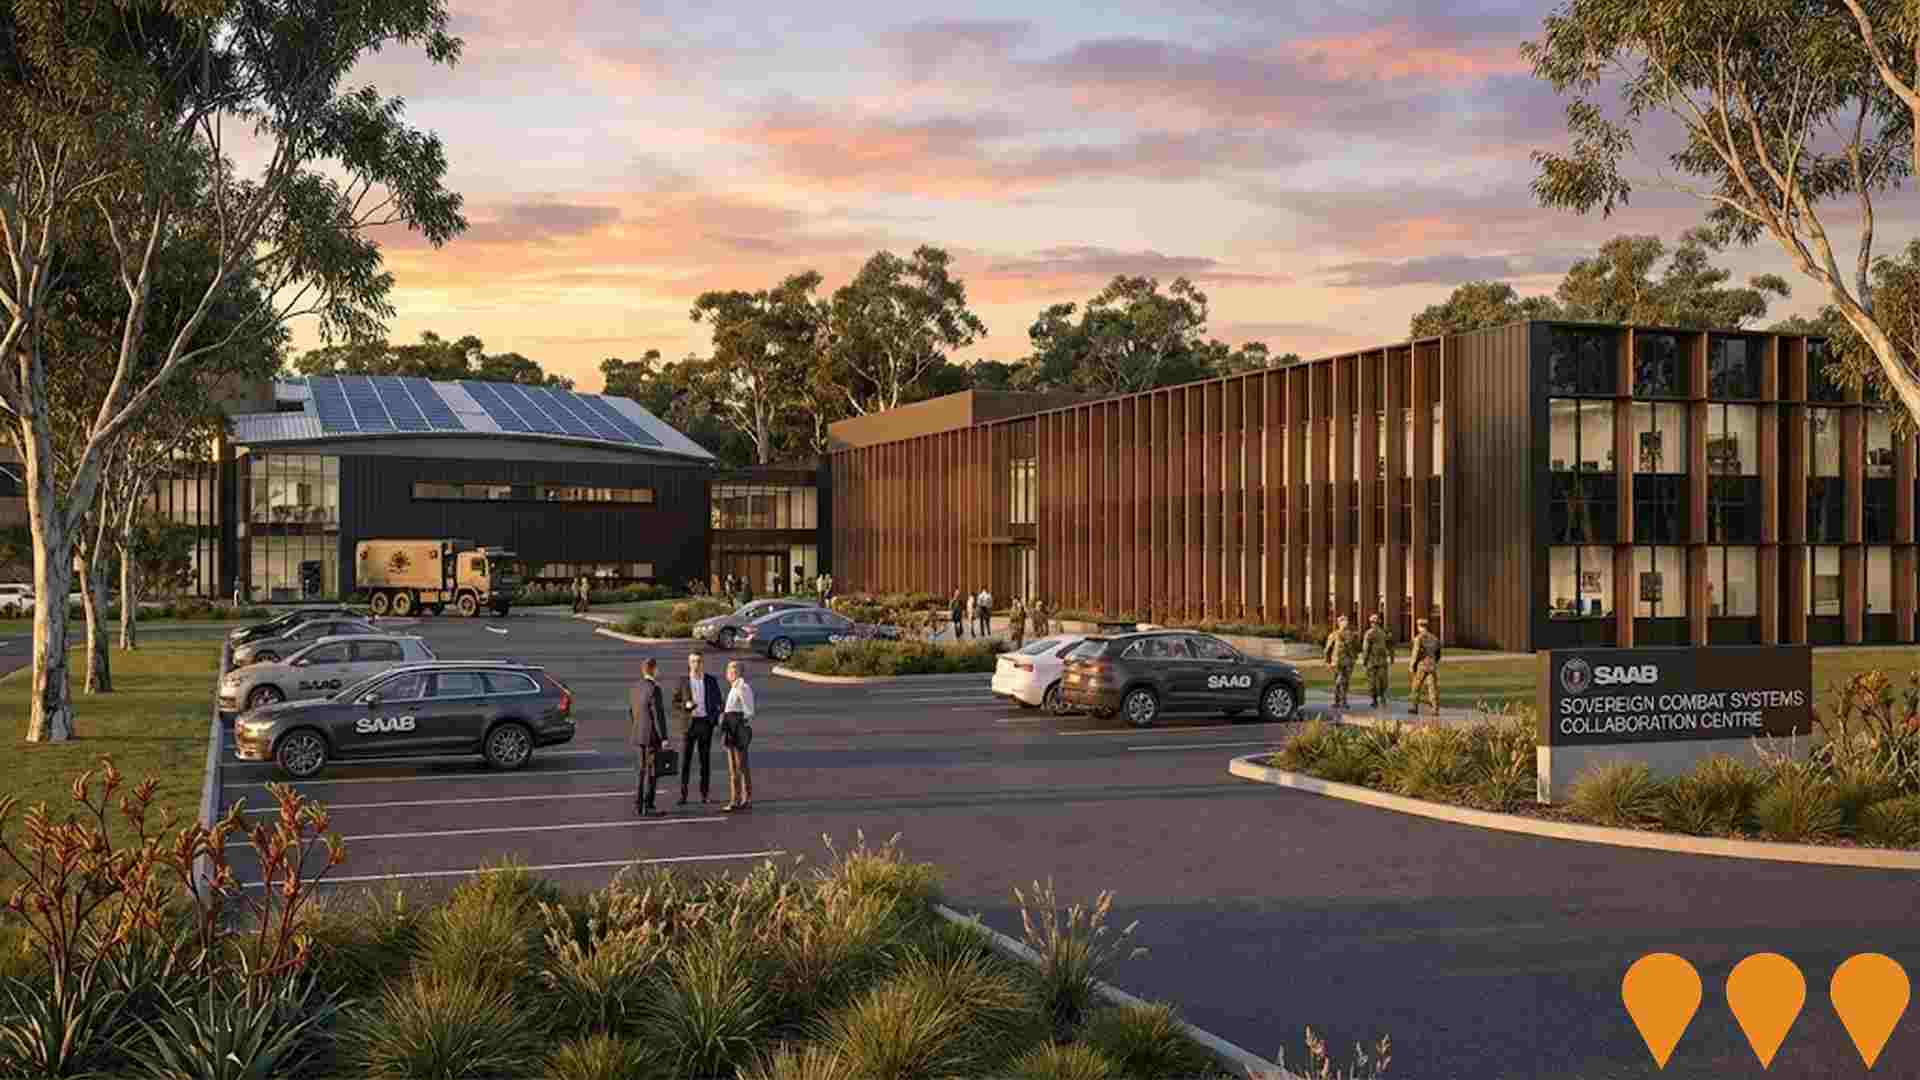
Saab Australia Sovereign Combat Systems Collaboration Centre
State-of-the-art $77 million Sovereign Combat Systems Collaboration Centre with $22.6 million government funding under the Modern Manufacturing Initiative. The facility serves as Australia's premier hub for software development, systems integration, testing and prototyping of combat systems. It houses the Australian Combat Management System (AusCMS) development and provides specialized training courses for the defence industry workforce. The centre strengthens Australia's sovereign defence capability and supports the Royal Australian Navy's surface fleet including Hobart-class destroyers and Hunter-class frigates.
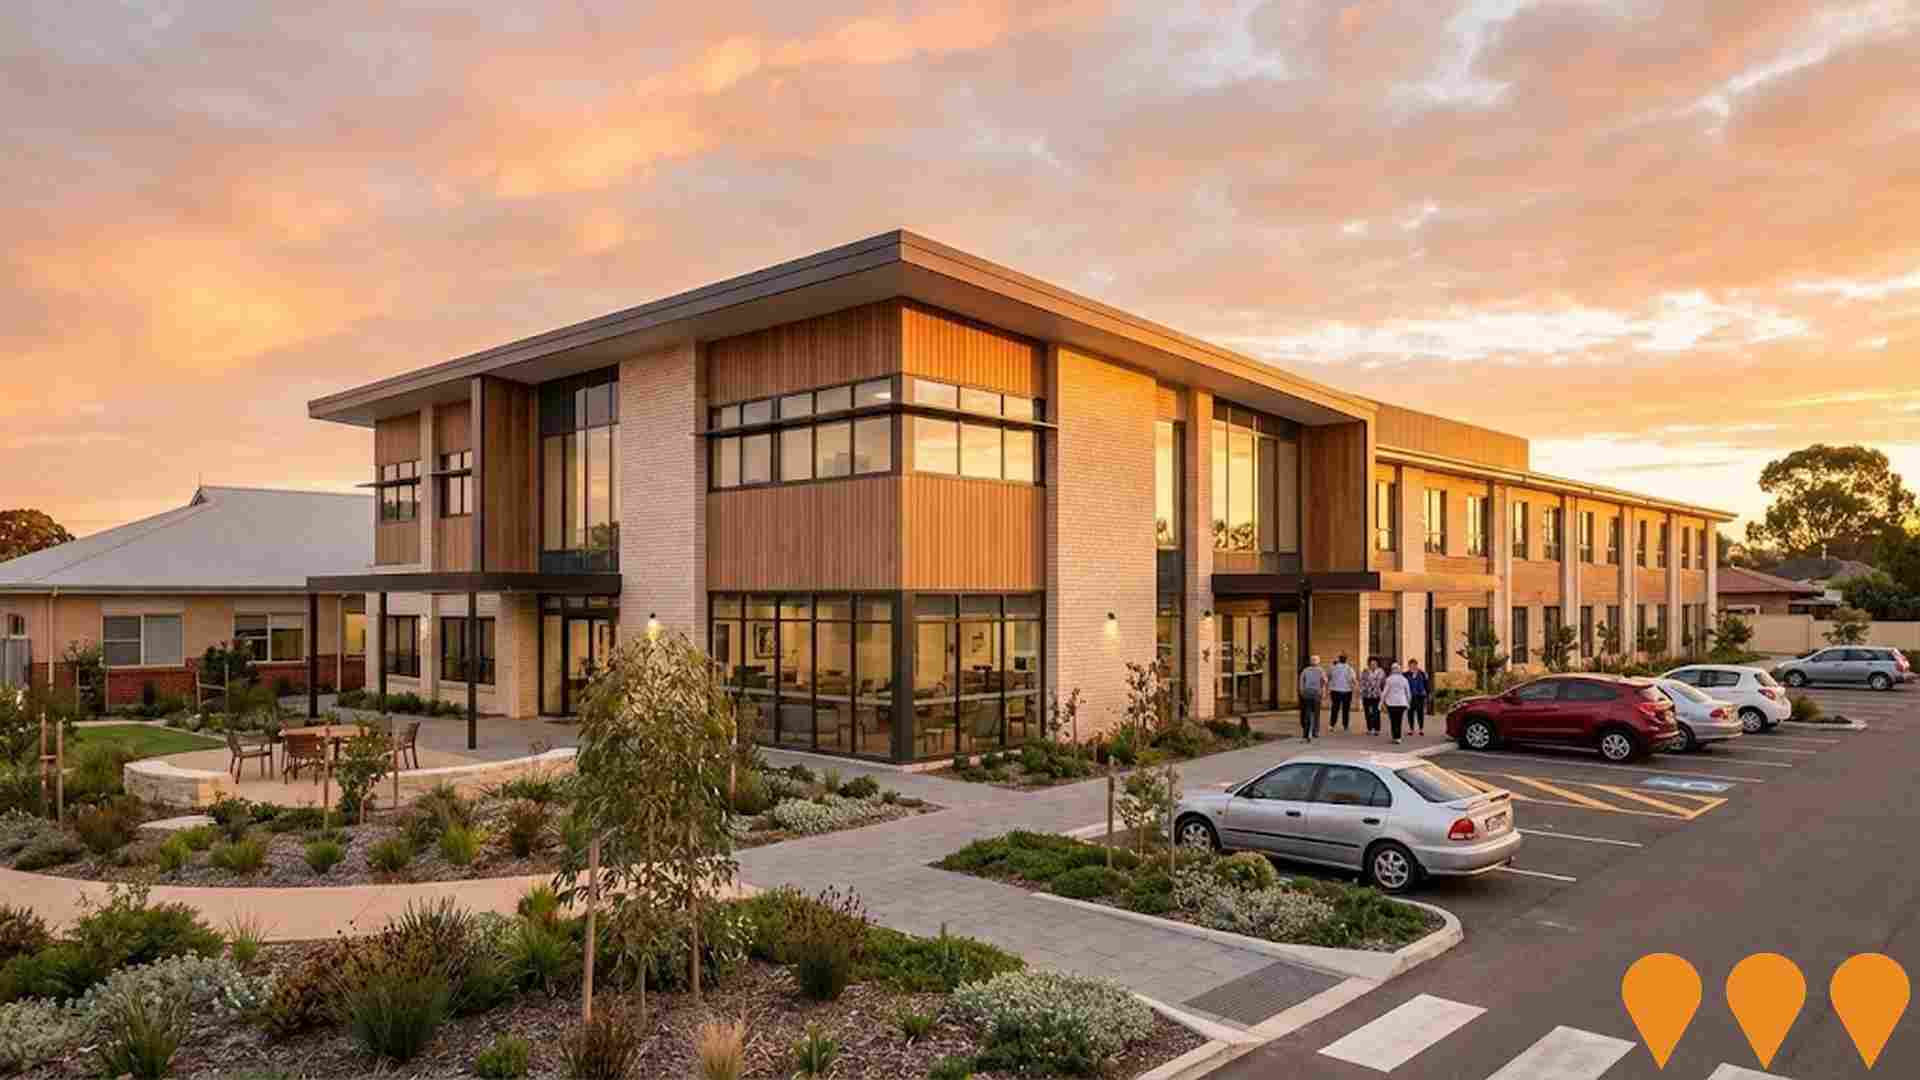
Gardenia Drive Aged Care Expansion
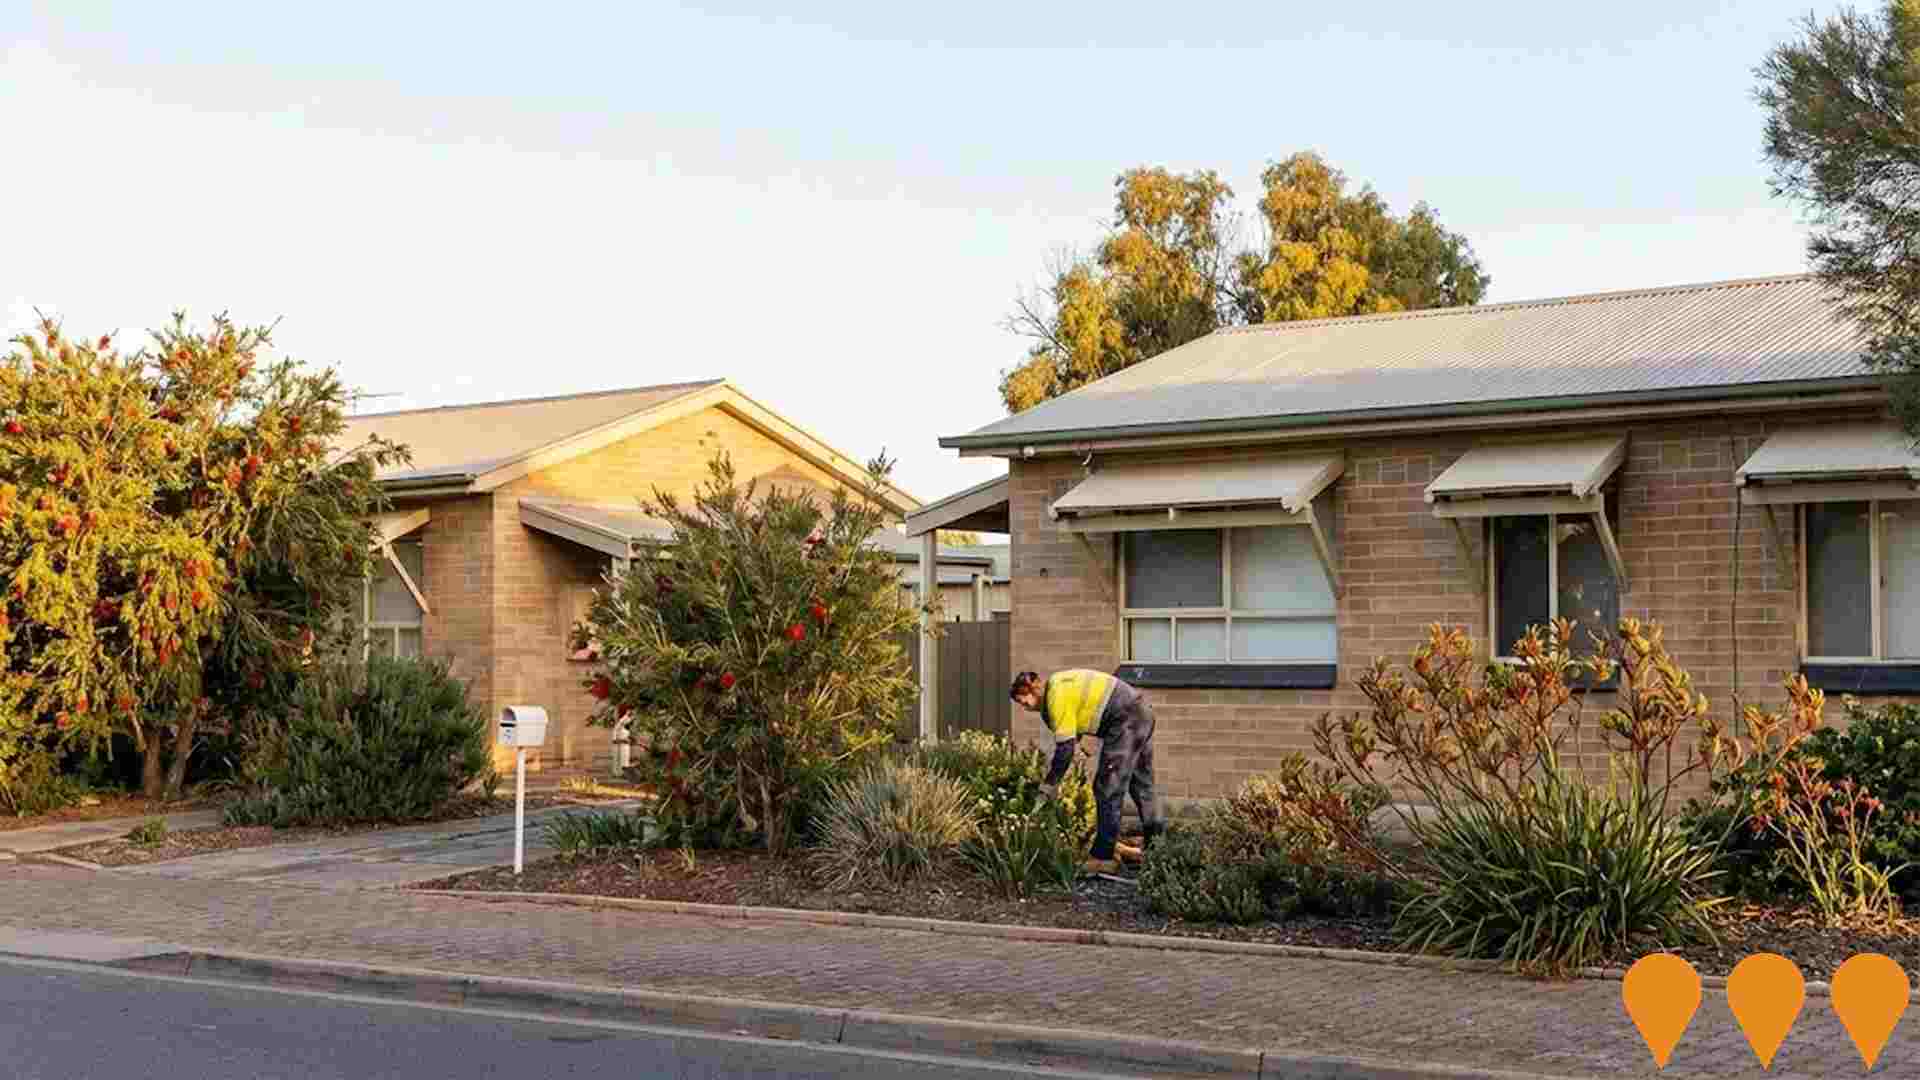
Expansion of the Edenfield Family Care Facility to add 47 bedrooms, including 27 for memory support, enhancing aged care services in the area.
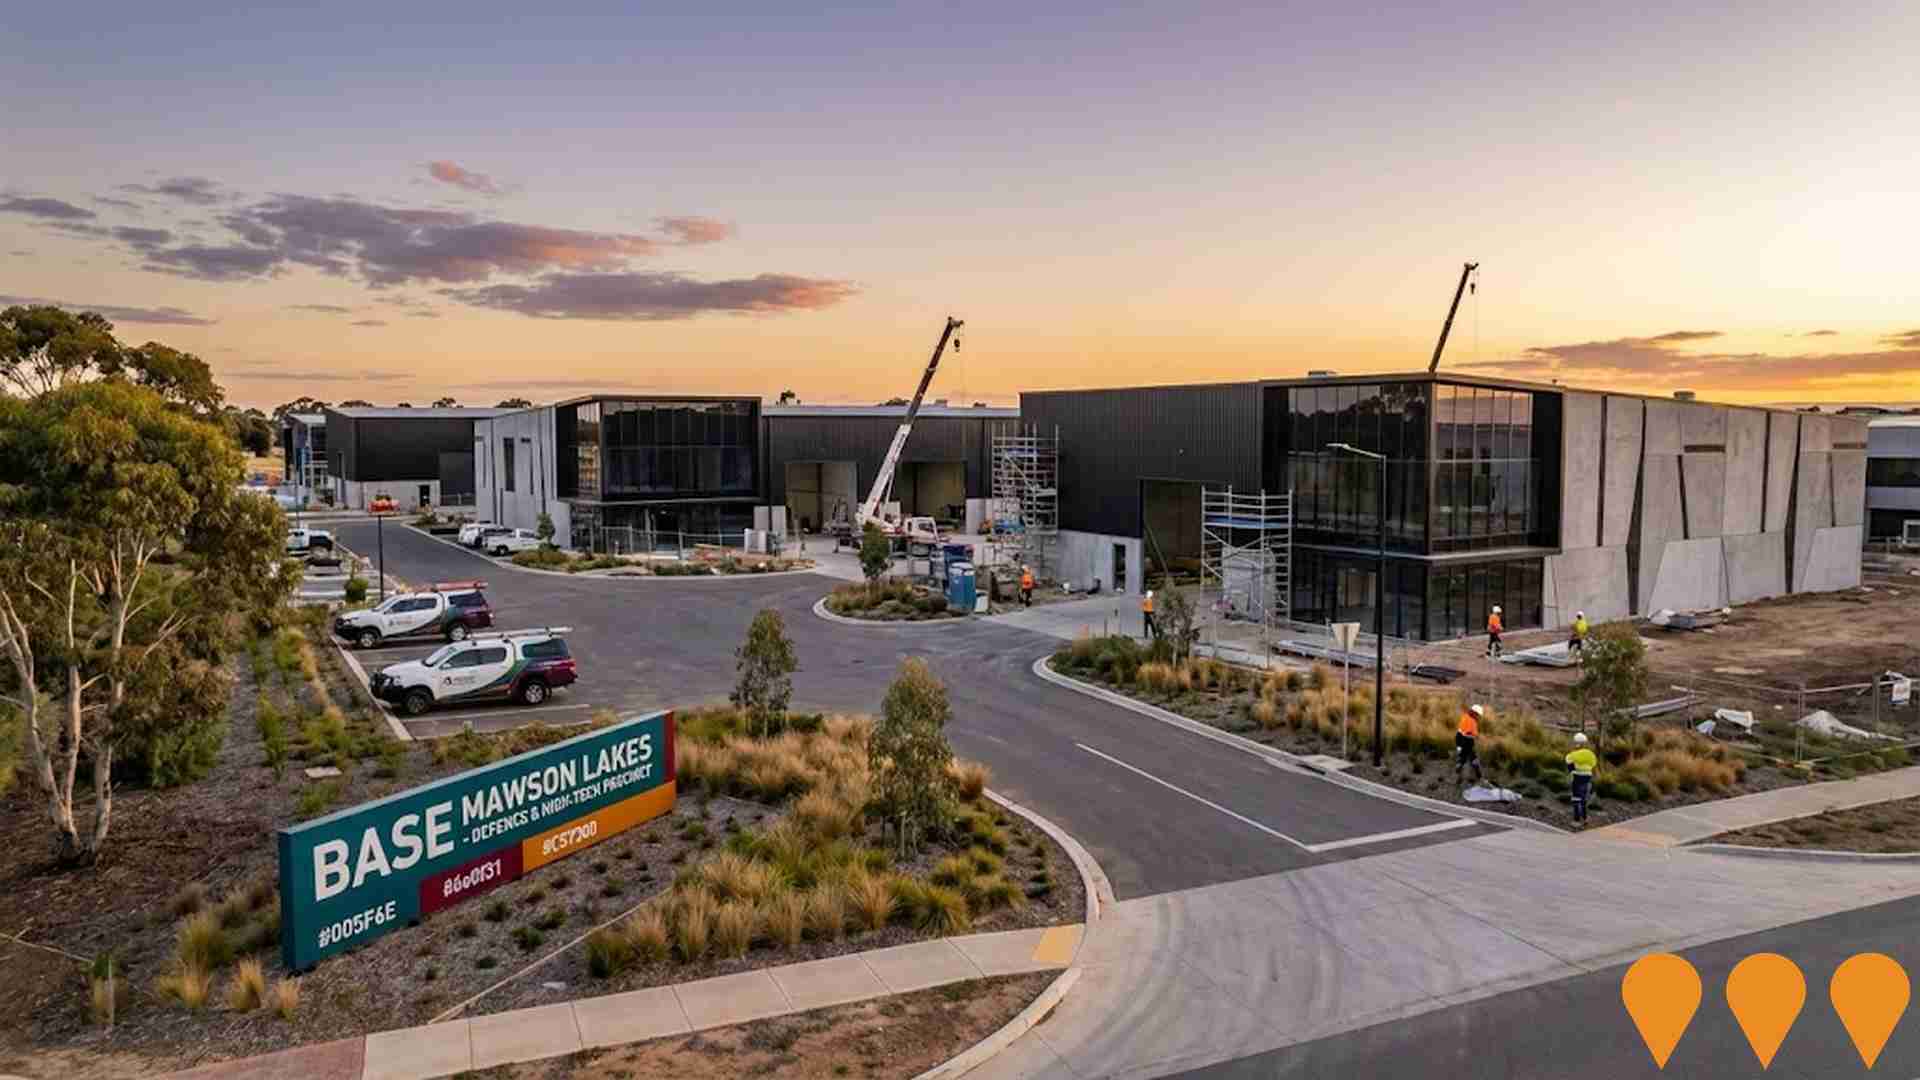
Base Mawson Lakes
A $25 million defence and high-tech business precinct in Adelaide Technology Park delivering 22 architecturally designed, high-performance warehouse units (approx. 101 to 523 sqm). The estate targets component manufacturers, clean-tech suppliers and defence supply-chain SMEs. Planning approval is secured, construction commenced August 2025, and practical completion is expected in May 2026. Land area approx. 8,199 sqm.
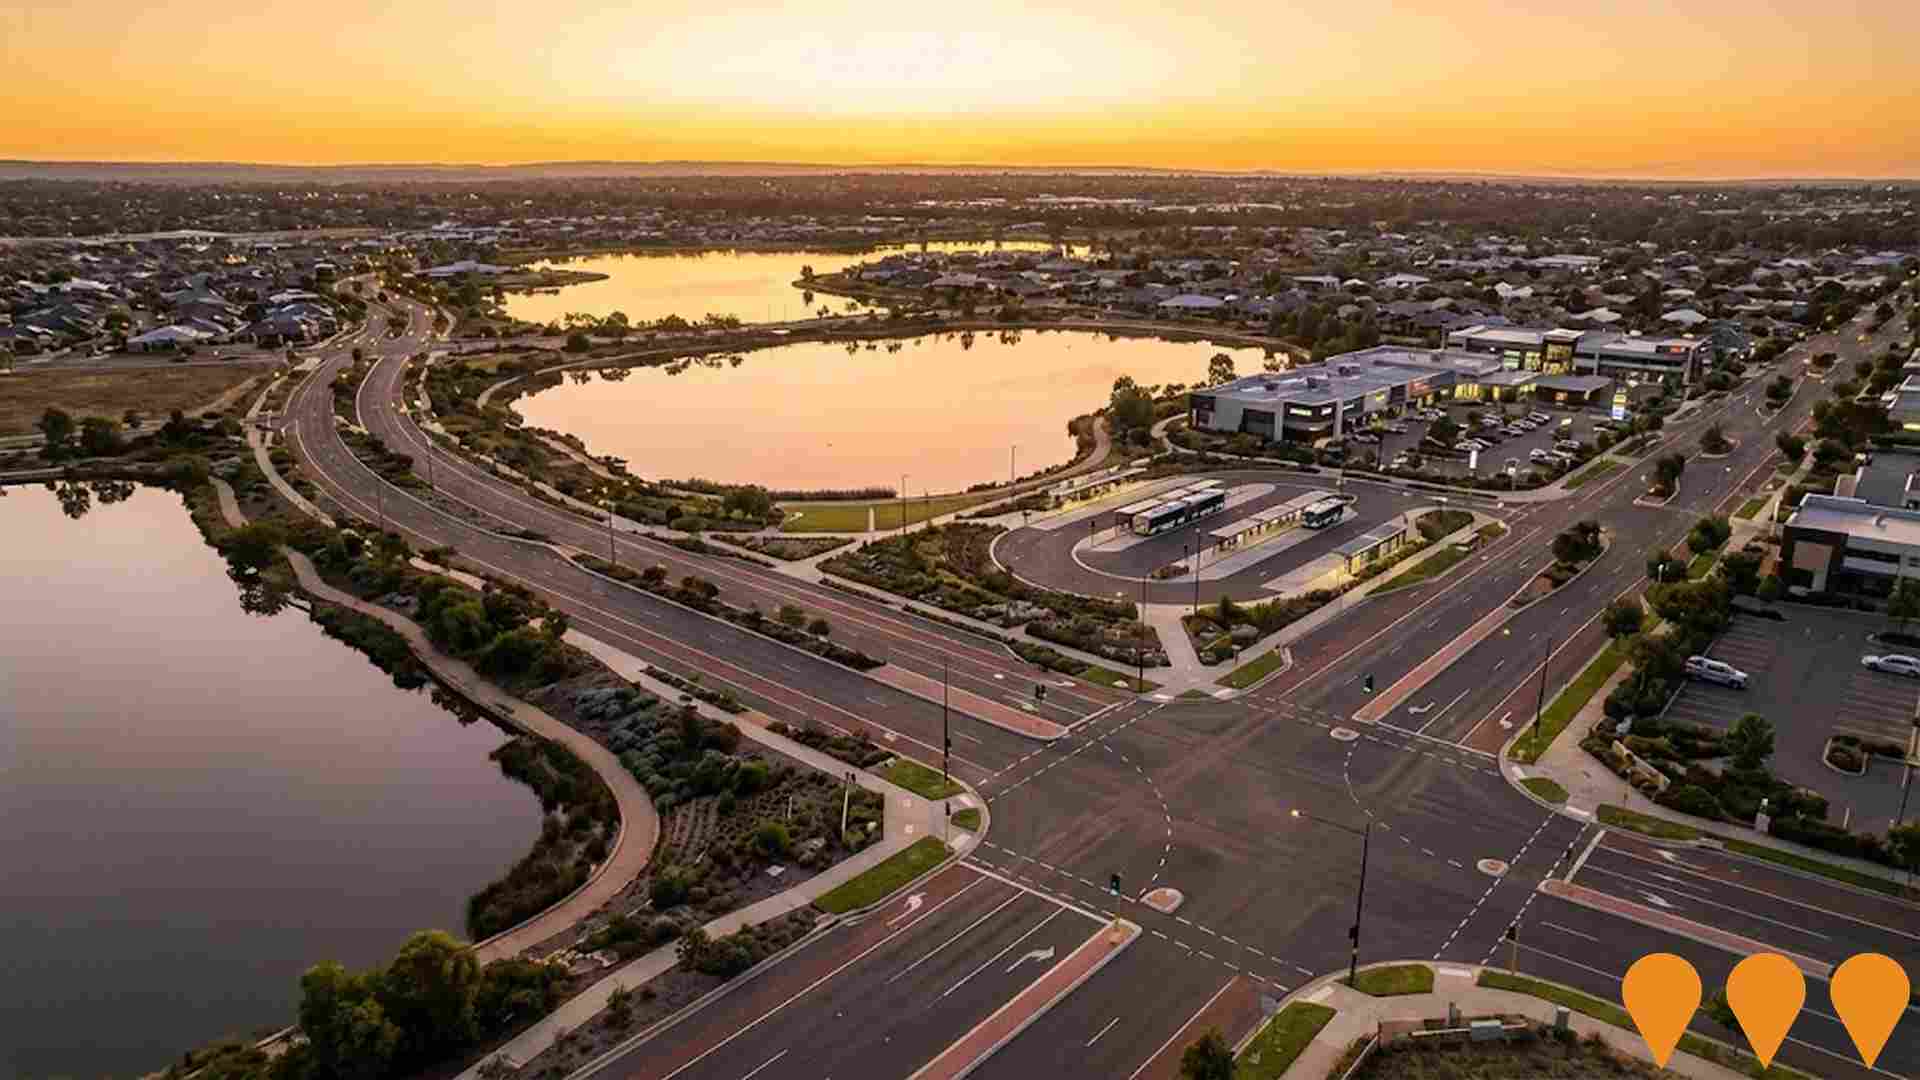
Mawson Lakes Road Management Plan
The Mawson Lakes Road Management Plan aims to analyze local accessibility concerns and propose improvements to enhance active travel, public transport use, safety, and connectivity in the Mawson Lakes area, including road network upgrades, parking management, pedestrian and cycling amenities, and public transport enhancements.
Kongsberg Defence Australia Manufacturing Headquarters
$25 million Australian manufacturing headquarters. 2500m2 facility for manufacture, assembly, integration, test, verification, maintenance and software development. First Asia-Pacific standalone facility for Kongsberg Defence business. Officially opened on September 5, 2024, supporting key defence projects including Naval Strike Missile.

Parafield Gardens High School Major Upgrades
A $10 million facility upgrade including a new building with gymnasium, food technology teaching facilities, amenities, refurbished music and drama suites, contemporary learning areas, removal of transportable buildings and asbestos, and a special options upgrade for students with disabilities featuring a new modular building with general learning areas, flexible learning spaces, shared kitchenette, storage, teacher preparation areas, and fully assisted access toilet.

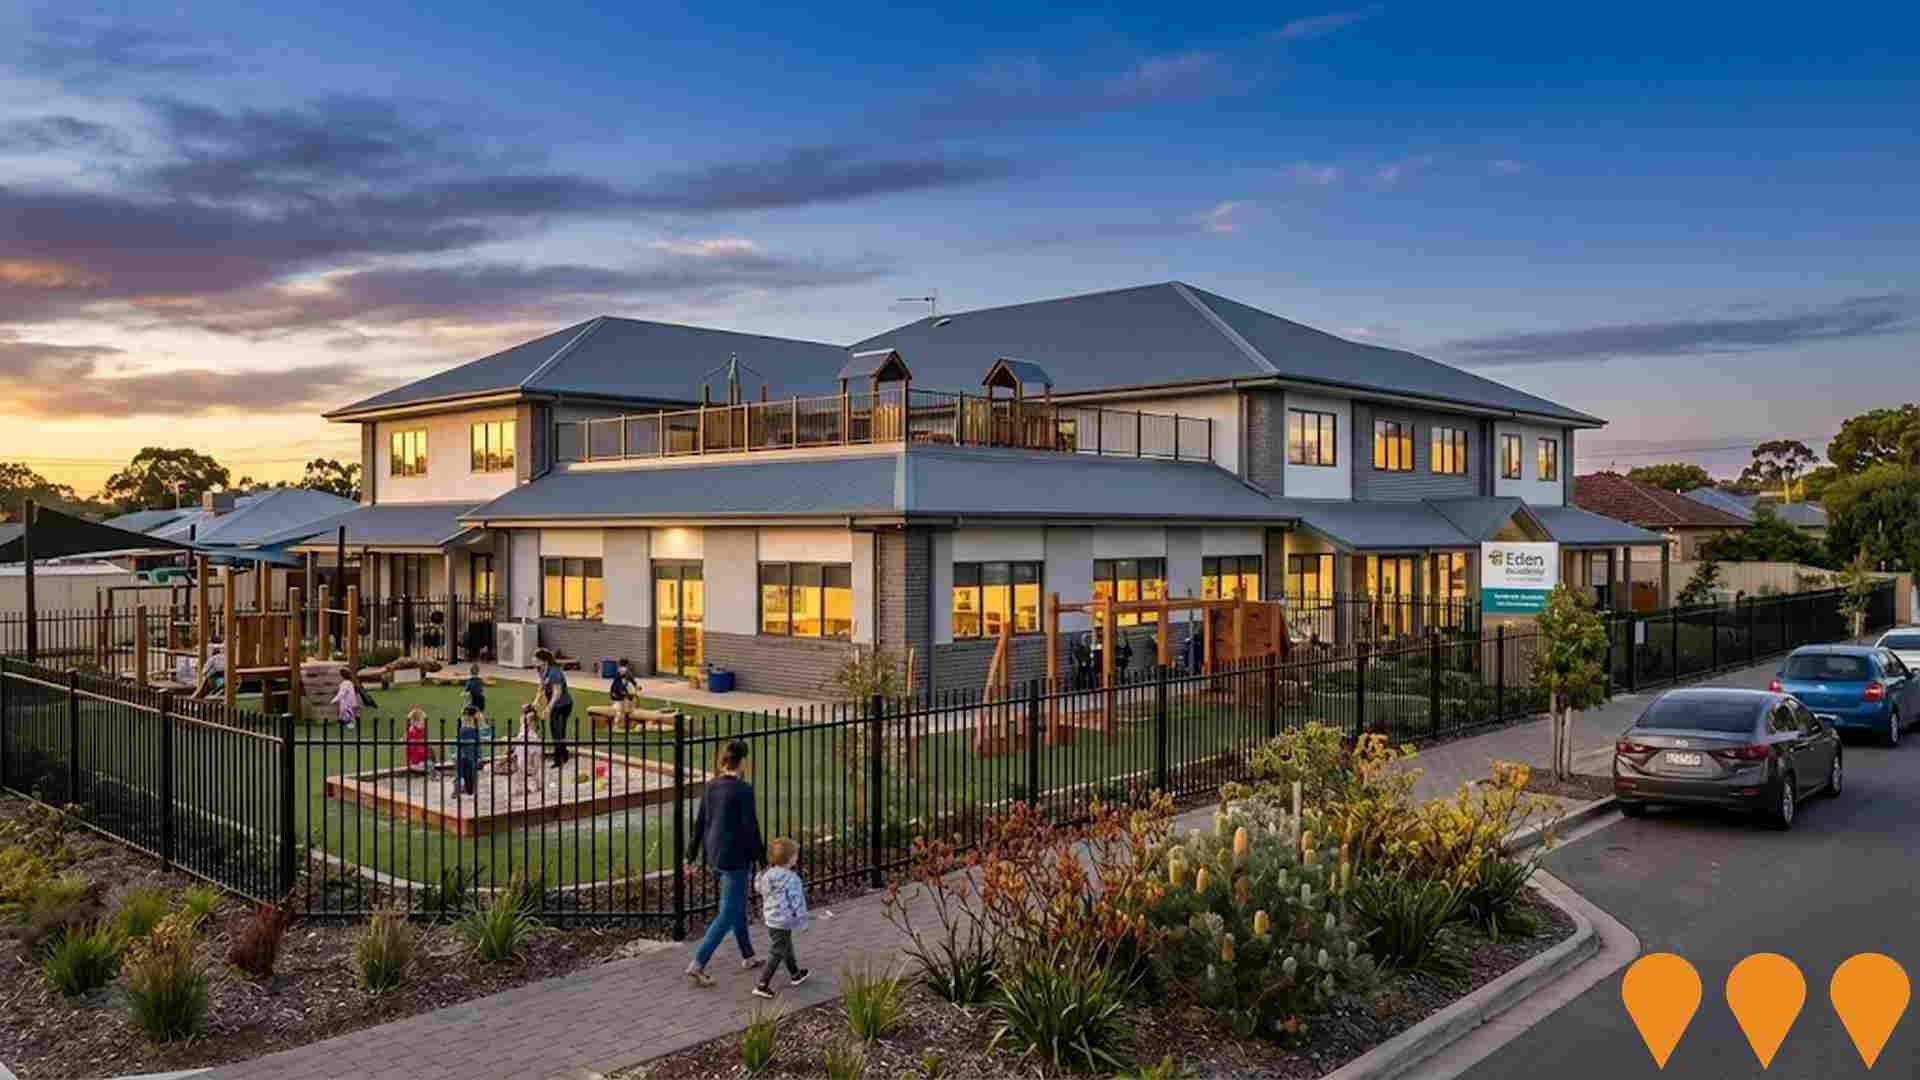
Eden Academy Parafield Gardens
A state-of-the-art childcare centre providing nurturing and educational environments for children from 0 to 5 years, with capacity for up to 126 places, featuring in-house meals, educational programs, and school readiness initiatives.
Parafield Gardens Primary School Major Upgrades
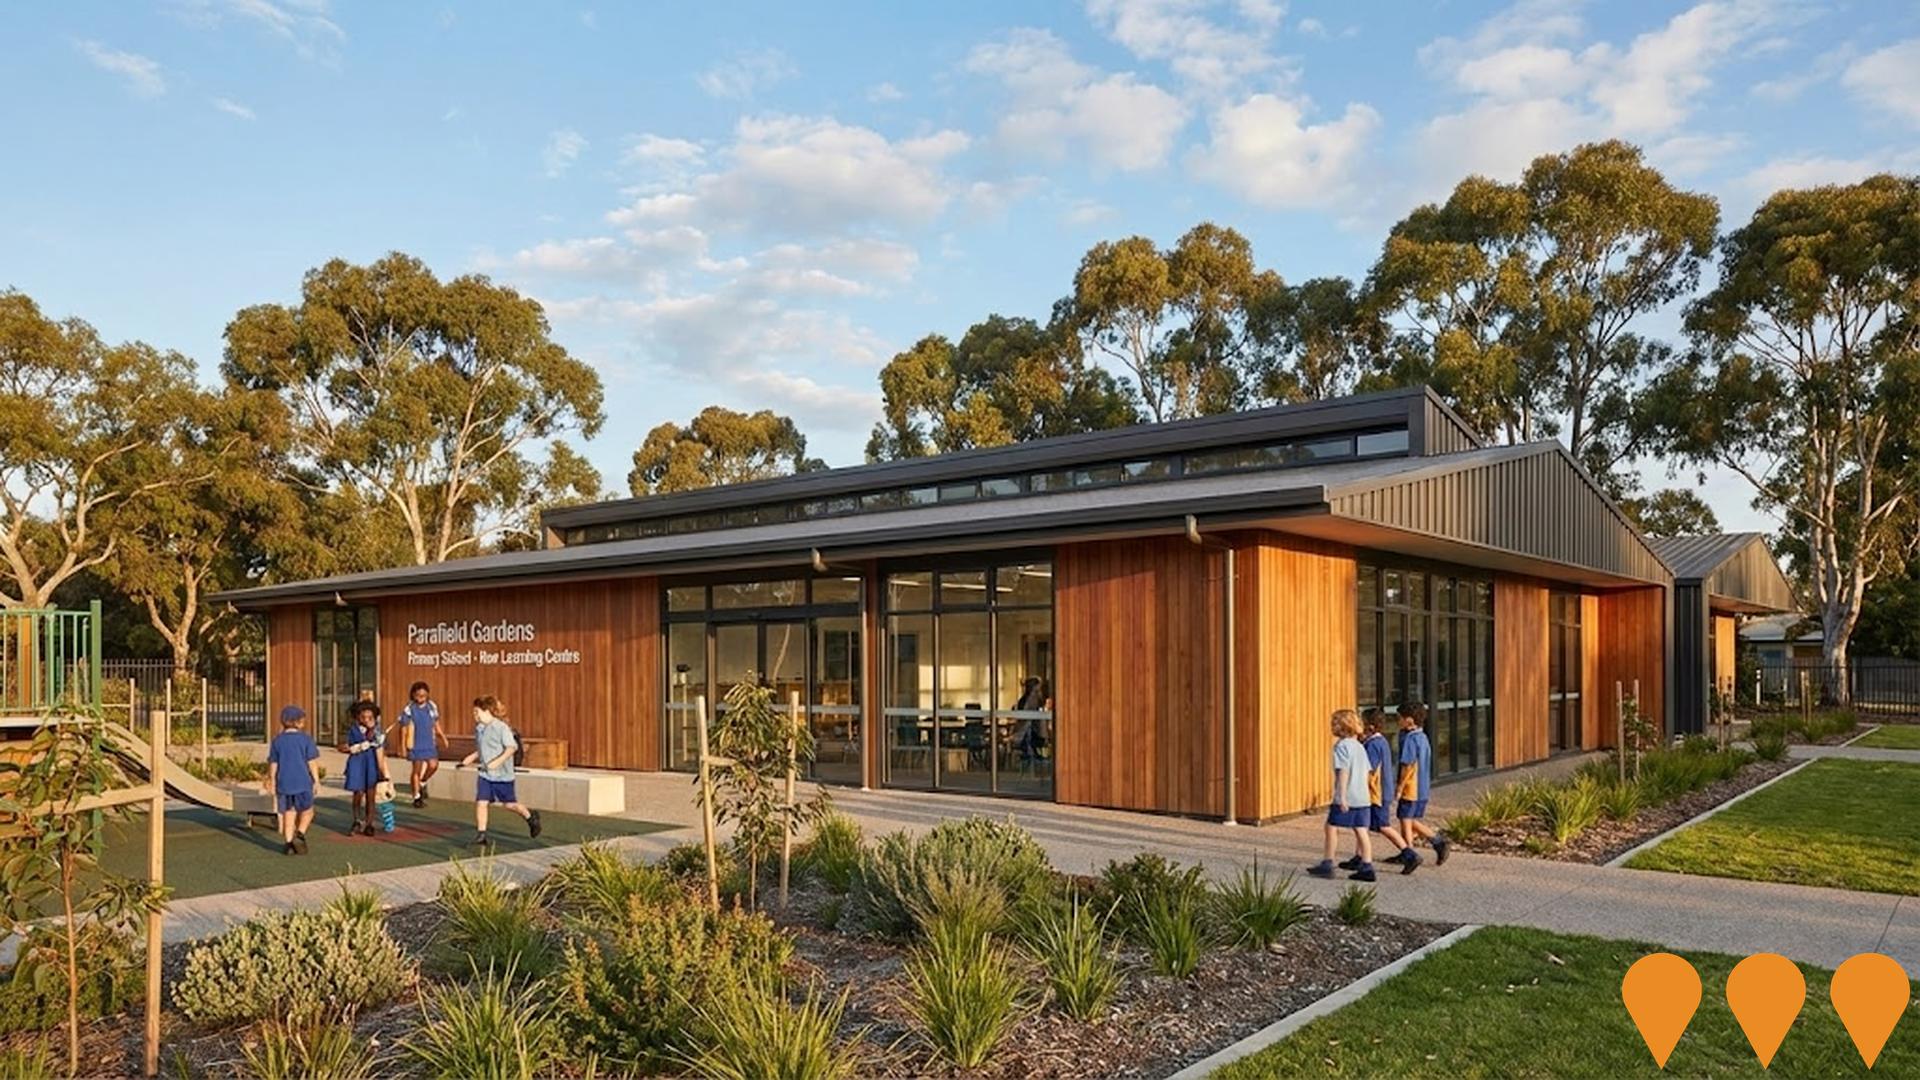
A $6.3 million upgrade delivering a new single storey modular building with three classrooms and a two room visual arts suite, plus extensive refurbishment of existing teaching spaces into flexible learning areas. Works are complete and in use.
Employment
Parafield Gardens shows employment indicators that trail behind approximately 70% of regions assessed across Australia
Parafield Gardens has a skilled workforce with strong representation in manufacturing and industrial sectors. The unemployment rate was 5.6% as of September 2025, with an estimated employment growth of 1.6% over the past year.
In this period, 8,423 residents were employed while the unemployment rate was higher than Greater Adelaide's rate of 3.9%, at 1.6%. Workforce participation was lower, at 57.1% compared to Greater Adelaide's 61.7%. Key industries for employment among residents are health care & social assistance, manufacturing, and retail trade. Manufacturing shows a notable concentration with employment levels at 1.6 times the regional average.
Conversely, professional & technical services have lower representation at 3.6%, compared to the regional average of 7.3%. Limited local employment opportunities are indicated by the count of Census working population versus resident population. Between September 2024 and 2025, employment increased by 1.6% while labour force grew by 1.2%, causing a decrease in unemployment rate by 0.4 percentage points. In comparison, Greater Adelaide saw employment grow by 3.0%, labour force expand by 2.9%, and unemployment fall by 0.1 percentage points. State-level data from 25-Nov-25 shows SA employment grew by 1.19% year-on-year, adding 10,710 jobs, with the state unemployment rate at 4.0%. This compares favourably to the national unemployment rate of 4.3%, with SA's employment growth outpacing the national average of 0.14%. National employment forecasts from Jobs and Skills Australia for May-25 project a 6.6% increase over five years and 13.7% over ten years. Applying these projections to Parafield Gardens' employment mix suggests local employment should increase by 6.0% over five years and 12.9% over ten years, though this is a simple weighting extrapolation for illustrative purposes and does not account for localised population projections.
Frequently Asked Questions - Employment
Income
Income figures position the area below 75% of locations analysed nationally by AreaSearch
AreaSearch's aggregation of ATO data for financial year 2022 shows Parafield Gardens SA2 had a median taxpayer income of $46,236 and an average income of $50,323. These figures are below the national averages of $52,592 and $64,886 respectively for Greater Adelaide. Based on Wage Price Index growth of 12.83% since financial year 2022, estimated median and average incomes as of September 2025 would be approximately $52,168 and $56,779 respectively. According to the 2021 Census, Parafield Gardens' household income ranks at the 27th percentile ($1,384 weekly), with personal income at the 10th percentile. Income distribution shows 34.4% of residents (6,409 individuals) fall within the $1,500 - $2,999 range, similar to regional levels at 31.8%. Housing affordability pressures are severe, with only 84.0% of income remaining, ranking at the 27th percentile.
Frequently Asked Questions - Income
Housing
Parafield Gardens is characterized by a predominantly suburban housing profile, with above-average rates of outright home ownership
Dwelling structure in Parafield Gardens, as evaluated at the latest Census held on 28 August 2016, consisted of 89.5% houses and 10.5% other dwellings (semi-detached, apartments, 'other' dwellings), compared to Adelaide metro's 83.9% houses and 16.0% other dwellings. Home ownership in Parafield Gardens was at 28.8%, with the rest of dwellings either mortgaged at 41.9% or rented at 29.3%. The median monthly mortgage repayment in the area was $1,382, higher than Adelaide metro's average of $1,300. The median weekly rent figure was recorded at $300, matching Adelaide metro's figure. Nationally, Parafield Gardens' mortgage repayments were lower than the Australian average of $1,863, while rents were substantially below the national figure of $375.
Frequently Asked Questions - Housing
Household Composition
Parafield Gardens has a typical household mix, with a higher-than-average median household size
Family households constitute 76.8% of all households, including 38.1% couples with children, 21.9% couples without children, and 15.2% single parent families. Non-family households comprise the remaining 23.2%, with lone person households at 20.4% and group households making up 2.7%. The median household size is 2.9 people, larger than the Greater Adelaide average of 2.7.
Frequently Asked Questions - Households
Local Schools & Education
Educational outcomes in Parafield Gardens fall within the lower quartile nationally, indicating opportunities for improvement in qualification attainment
The area has university qualification rates of 18.9%, significantly lower than the Australian average of 30.4%. This presents both a challenge and an opportunity for targeted educational initiatives. Bachelor degrees are the most common at 13.2%, followed by postgraduate qualifications (4.4%) and graduate diplomas (1.3%). Trade and technical skills are prominent, with 29.6% of residents aged 15+ holding vocational credentials - advanced diplomas (7.5%) and certificates (22.1%).
Educational participation is high, with 31.1% of residents currently enrolled in formal education. This includes 11.8% in primary education, 7.4% in secondary education, and 5.3% pursuing tertiary education.
Frequently Asked Questions - Education
Schools Detail
Nearby Services & Amenities
Transport
Transport servicing is moderate compared to other areas nationally based on assessment of service frequency, route connectivity and accessibility
Parafield Gardens has 70 active public transport stops, offering a mix of train and bus services. These stops are served by 18 different routes, together facilitating 1,100 weekly passenger trips. The area's transport accessibility is rated as good, with residents on average being located 206 meters from the nearest stop.
Service frequency averages 157 trips per day across all routes, equating to approximately 15 weekly trips per individual stop.
Frequently Asked Questions - Transport
Transport Stops Detail
Health
Health outcomes in Parafield Gardens are marginally below the national average with the level of common health conditions among the general population somewhat typical, though higher than the nation's average among older cohorts
Parafield Gardens has health indicators suggesting below-average outcomes compared to national averages. Common health conditions are somewhat typical but higher among older cohorts.
Private health cover is extremely low at approximately 46% of the total population (~8,607 people), while the national average is 55.3%. The most common medical conditions are asthma and arthritis, affecting 8.0 and 7.8% of residents respectively. 70.2% of residents declare themselves completely clear of medical ailments, compared to 68.1% across Greater Adelaide. The area has 15.8% of residents aged 65 and over (2,943 people). Health outcomes among seniors require more attention than the broader population.
Frequently Asked Questions - Health
Cultural Diversity
Parafield Gardens is among the most culturally diverse areas in the country based on AreaSearch assessment of a range of language and cultural background related metrics
Parafield Gardens has a high level of cultural diversity, with 42.5% of its population born overseas and 46.3% speaking a language other than English at home. Christianity is the predominant religion in Parafield Gardens, comprising 36.4% of the population. Buddhism is overrepresented compared to Greater Adelaide, making up 7.6% of Parafield Gardens' population, while the regional average is 5.1%.
The top three represented ancestry groups are Other at 22.4%, English at 20.2%, and Australian at 19.3%. Notably, Vietnamese (5.9%), Polish (1.3%), and Indian (6.1%) ethnic groups are overrepresented compared to their regional averages of 3.1%, 1.1%, and 3.2% respectively.
Frequently Asked Questions - Diversity
Age
Parafield Gardens's population is slightly younger than the national pattern
The median age in Parafield Gardens is 36 years, which is slightly below Greater Adelaide's average of 39 years and also slightly below Australia's median of 38 years. Compared to Greater Adelaide, Parafield Gardens has a higher proportion of residents aged 5-14 years (13.3%), but fewer residents aged 75-84 years (5.3%). Between the 2021 Census and the present day, the proportion of residents aged 75-84 years has increased from 4.7% to 5.3%, while the proportion of residents aged 5-14 years has decreased from 14.0% to 13.3%. By the year 2041, Parafield Gardens is projected to experience significant changes in its age composition. Notably, the population aged 85 years and above is expected to grow by 84%, reaching a total of 644 individuals from the current figure of 350. The aging population trend is evident, with those aged 65 years and above accounting for 69% of the projected growth. Conversely, population declines are projected for residents aged 25-34 years and those under 5 years old.
