Chart Color Schemes
This analysis uses ABS Statistical Areas Level 2 (SA2) boundaries, which can materially differ from Suburbs and Localities (SAL) even when sharing similar names.
SA2 boundaries are defined by the Australian Bureau of Statistics and are designed to represent communities for statistical reporting (e.g., census and ERP).
Suburbs and Localities (SAL) represent commonly-used suburb/locality names (postal-style areas) and may use different geographic boundaries. For comprehensive analysis, consider reviewing both boundary types if available.
est. as @ -- *
ABS ERP | -- people | --
2021 Census | -- people
Sales Activity
Curious about local property values? Filter the chart to assess the volume and appreciation (including resales) trends and regional comparisons, or scroll to the map below view this information at an individual property level.
Find a Recent Sale
Sales Detail
Population
An assessment of population growth drivers in Pooraka - Cavan reveals an overall ranking slightly below national averages considering recent, and medium term trends
AreaSearch's analysis indicates Pooraka - Cavan's population was approximately 8,376 as of November 2025. This figure represents an increase of 296 people, a rise of 3.7% since the 2021 Census, which recorded a population of 8,080. The change is inferred from ABS's estimated resident population of 8,371 in June 2024 and an additional 36 validated new addresses since the Census date. This results in a population density ratio of 1,118 persons per square kilometer, aligning with averages seen across locations assessed by AreaSearch. Overseas migration contributed approximately 67.6% of overall population gains during recent periods.
AreaSearch adopts ABS/Geoscience Australia projections for each SA2 area, released in 2024 with a base year of 2022. For areas not covered and years post-2032, the SA State Government's Regional/LGA projections by age category are used, based on 2021 data released in 2023, with adjustments employing a method of weighted aggregation of population growth from LGA to SA2 levels. Moving forward with demographic trends, a population increase just below the median of statistical areas across the nation is expected. The area is projected to expand by 636 persons to reach 2041, based on the latest annual ERP population numbers, reflecting a gain of 7.5% in total over the 17 years.
Frequently Asked Questions - Population
Development
AreaSearch analysis of residential development drivers sees Pooraka - Cavan recording a relatively average level of approval activity when compared to local markets analysed countrywide
Over the past five financial years, from FY-21 to FY-25, approximately 31 new homes have been approved annually in Pooraka - Cavan. This totals around 155 homes over these years. As of FY-26, 18 approvals have already been recorded. The average number of new residents per year arriving for each new home is about 1.8, indicating a balanced supply and demand market that supports stable conditions.
The average construction value of new properties is around $190,000, which is below the regional average, suggesting more affordable housing options for buyers in the area. In terms of commercial development, Pooraka - Cavan has seen $20.1 million in approvals recorded this financial year, indicating steady investment activity. When compared to Greater Adelaide, Pooraka - Cavan maintains similar construction rates per person, supporting market stability that aligns with regional patterns.
Recent construction in the area comprises approximately 73.0% detached dwellings and 27.0% attached dwellings, maintaining its traditional suburban character focused on family homes appealing to those seeking space. The location has around 348 people per dwelling approval, reflecting an established area. According to AreaSearch's latest quarterly estimate, Pooraka - Cavan is forecasted to gain approximately 631 residents by the year 2041. At current development rates, new housing supply should comfortably meet demand, providing good conditions for buyers and potentially supporting growth beyond current population projections.
Frequently Asked Questions - Development
Infrastructure
Pooraka - Cavan has limited levels of nearby infrastructure activity, ranking in the 10thth percentile nationally
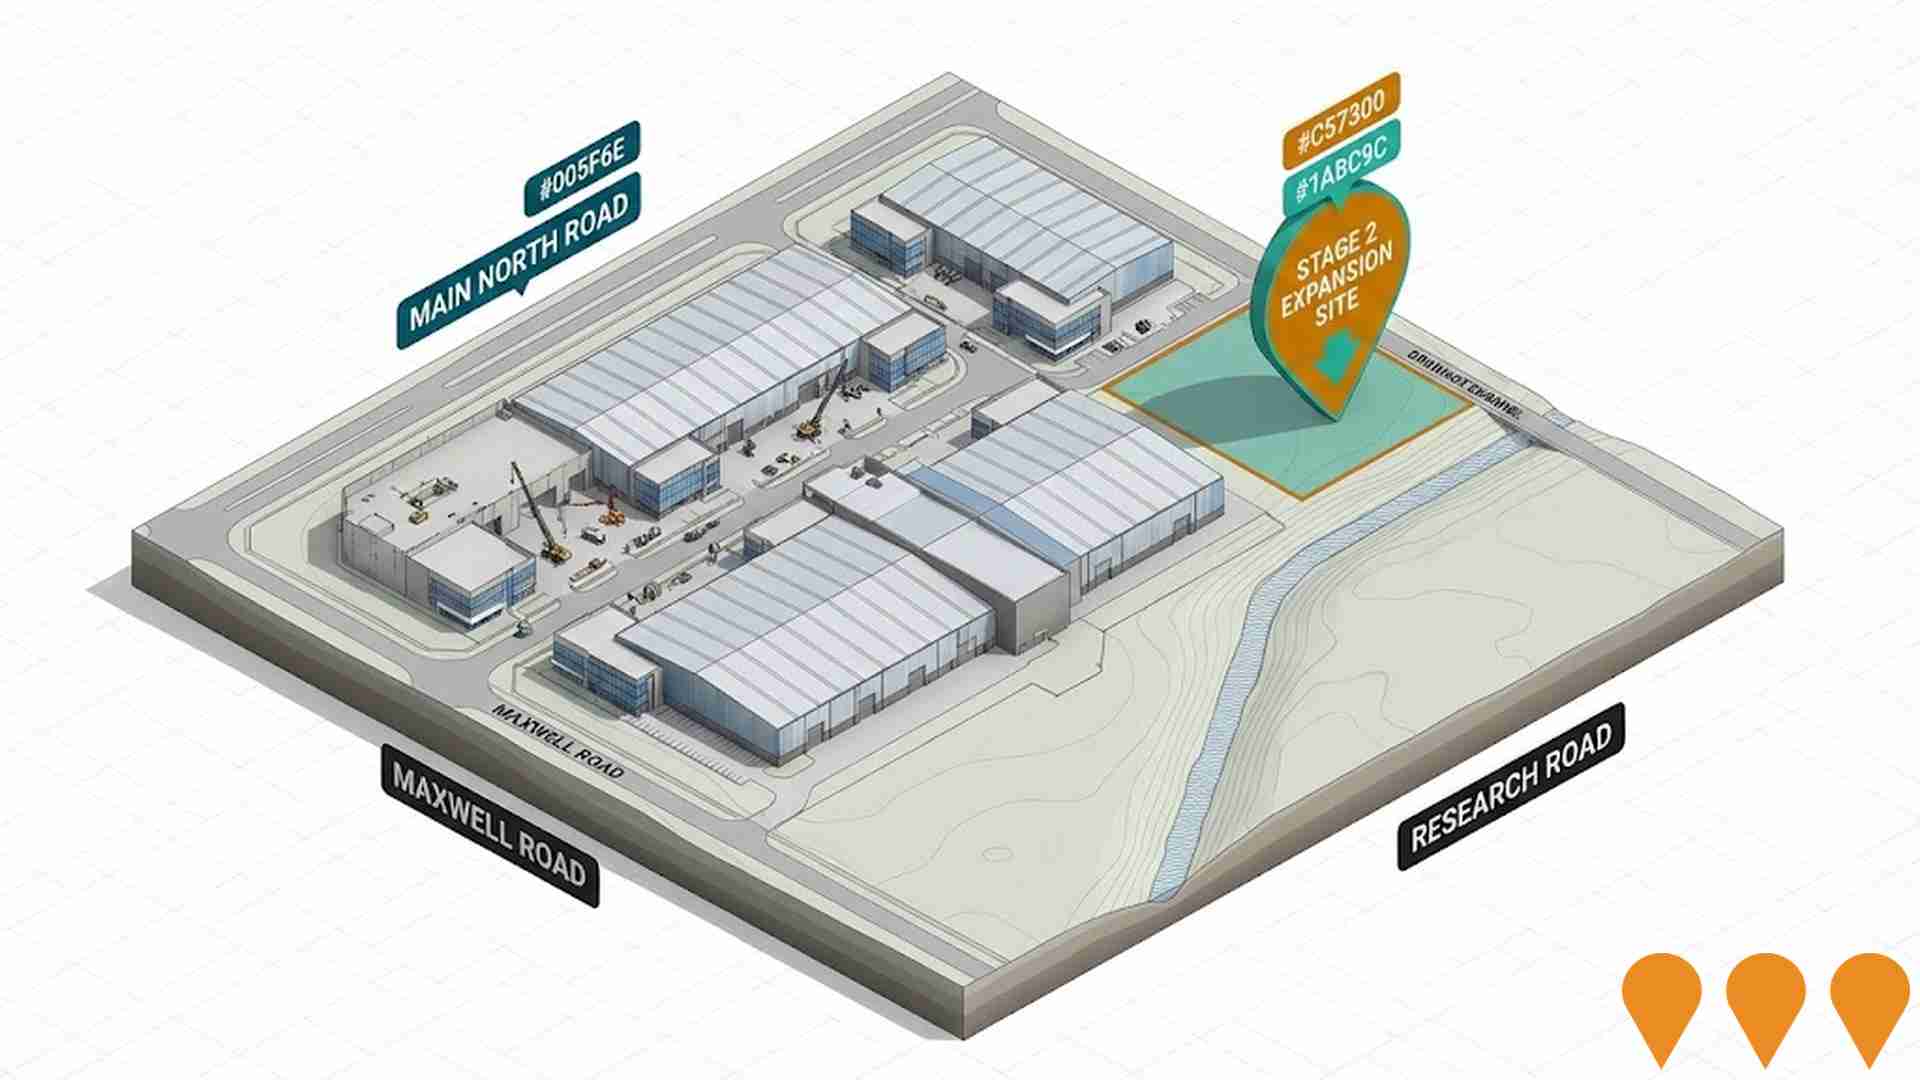
The performance of an area can greatly be influenced by changes in local infrastructure, major projects, and planning initiatives. AreaSearch has identified a total of 19 projects that are expected to have an impact on the area. Notable projects include Pooraka Enterprise Park Expansion - Stage 2 (Various Sites), Montague Farm Estate, Pooraka Triangle Masterplan Redevelopment, and Mawson Lakes Technology Precinct Expansion. The following list provides details on those projects that are likely to be most relevant.
Professional plan users can use the search below to filter and access additional projects.
INFRASTRUCTURE SEARCH
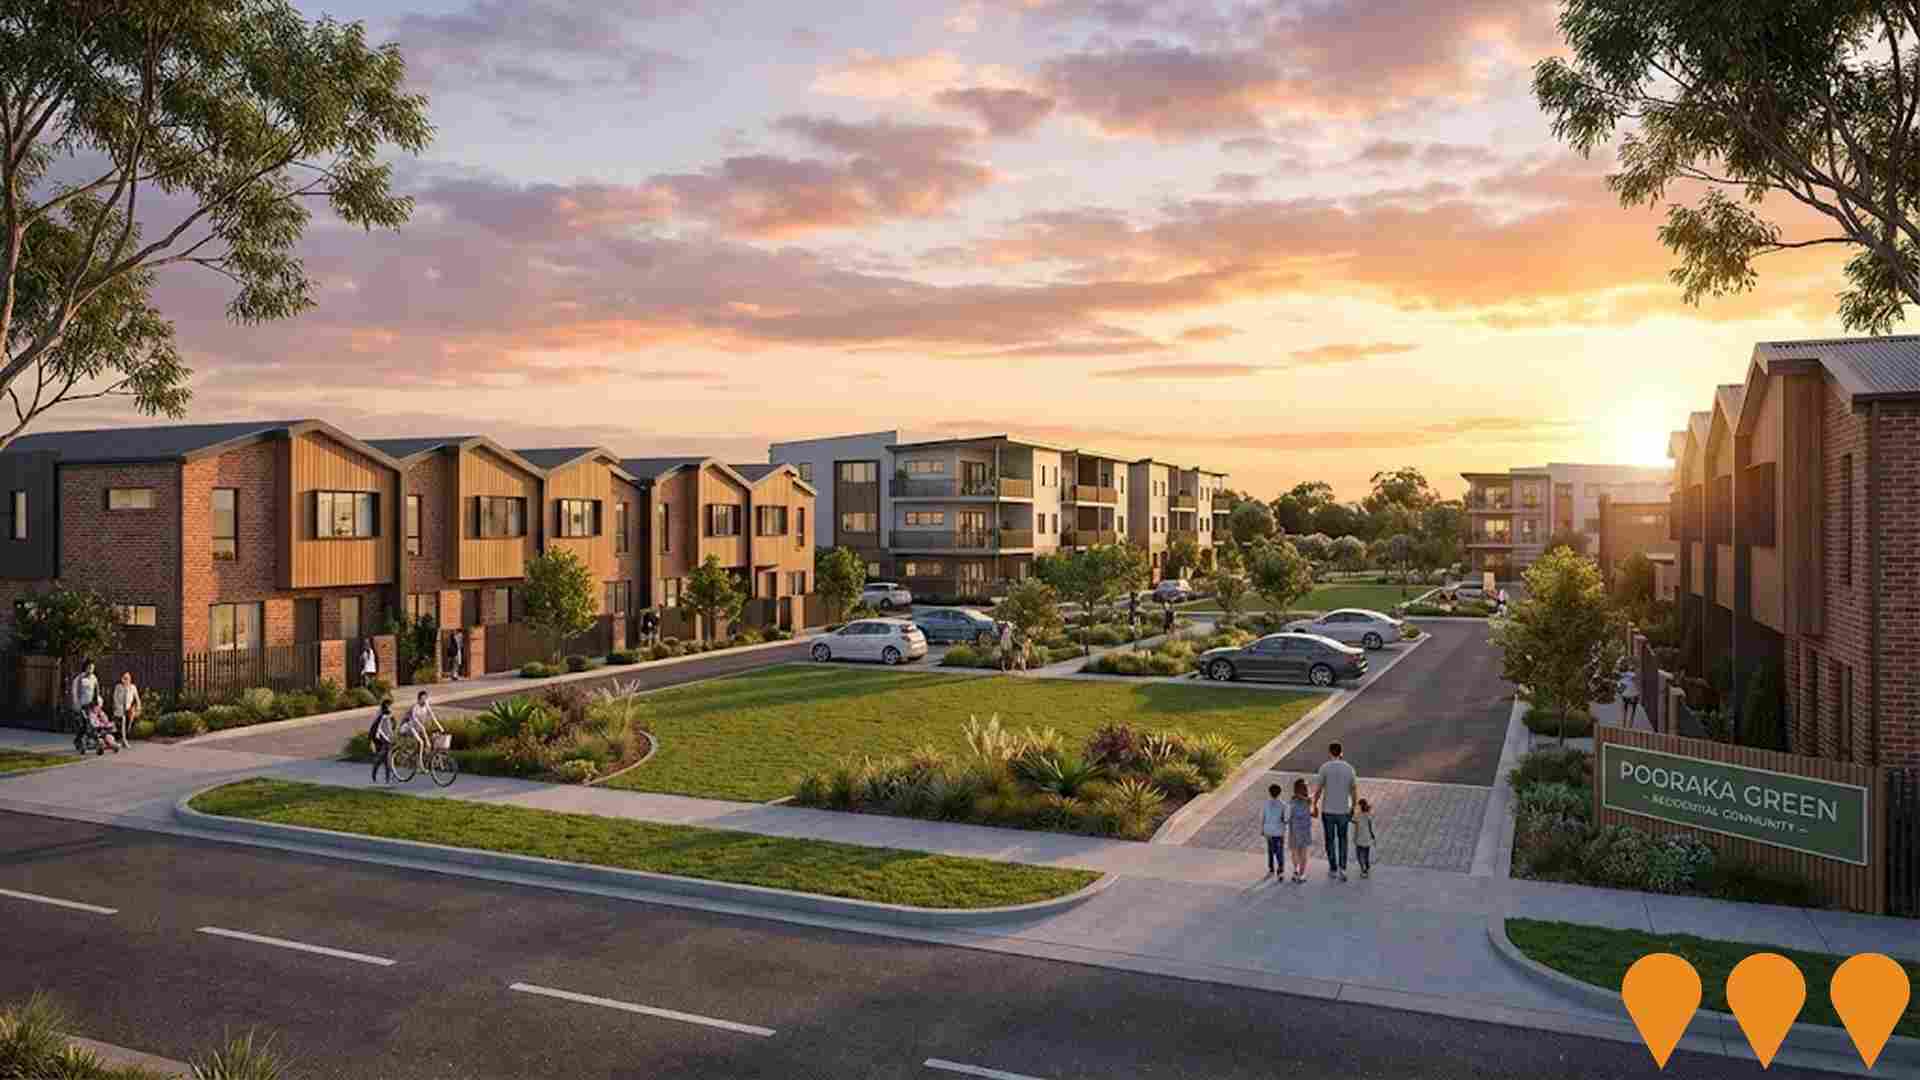
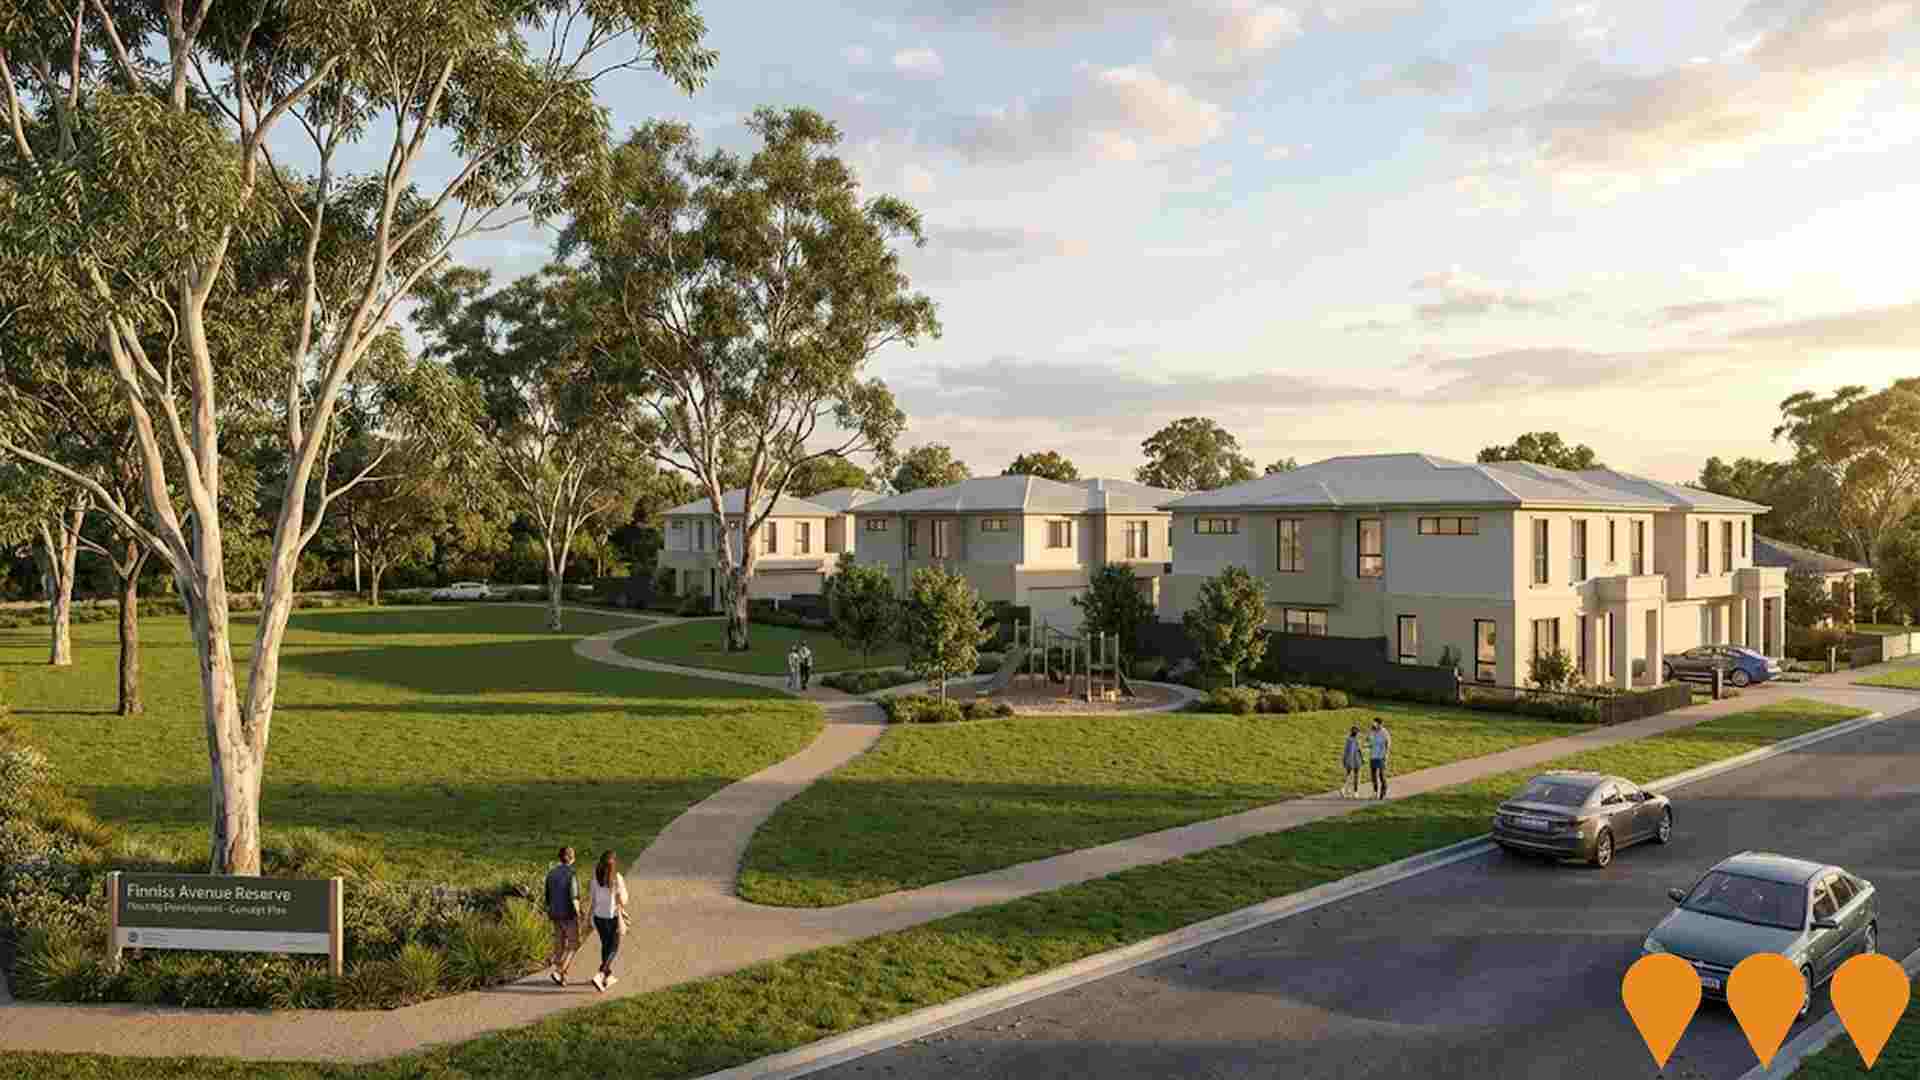
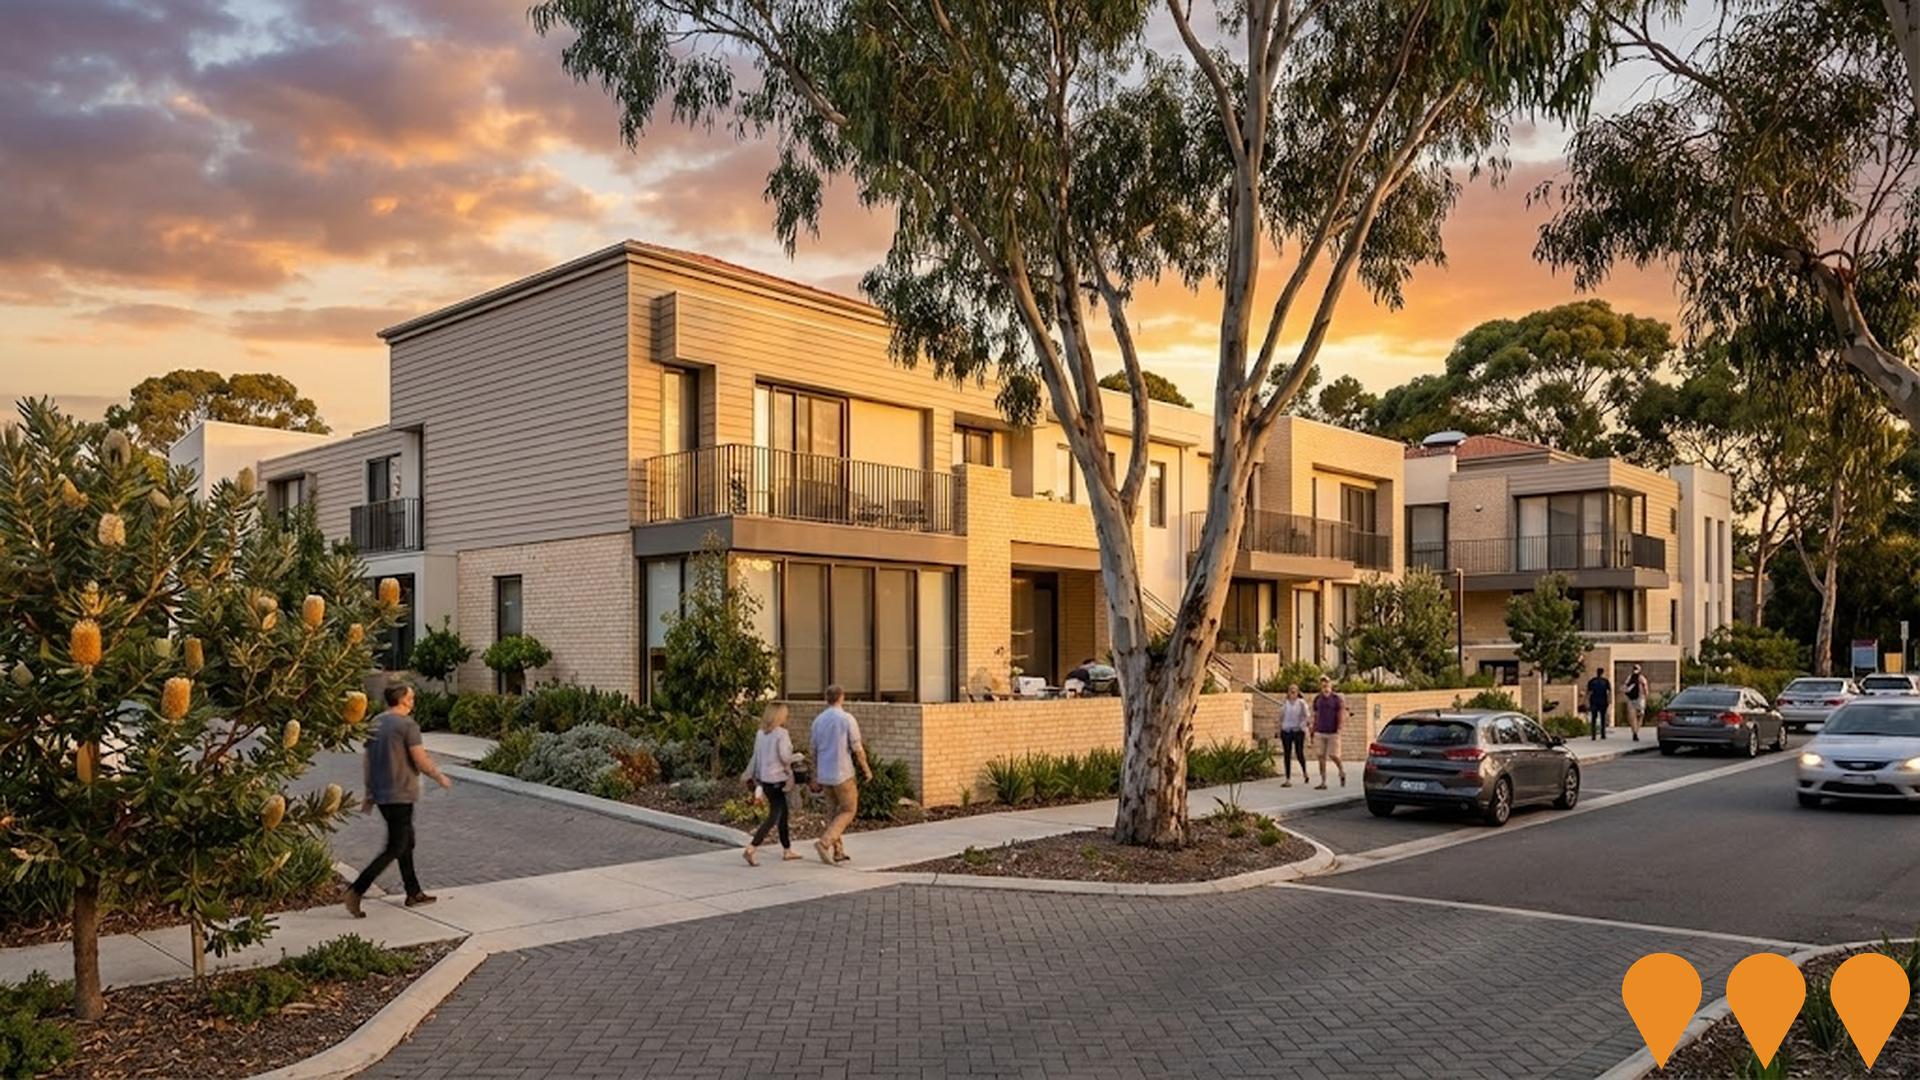
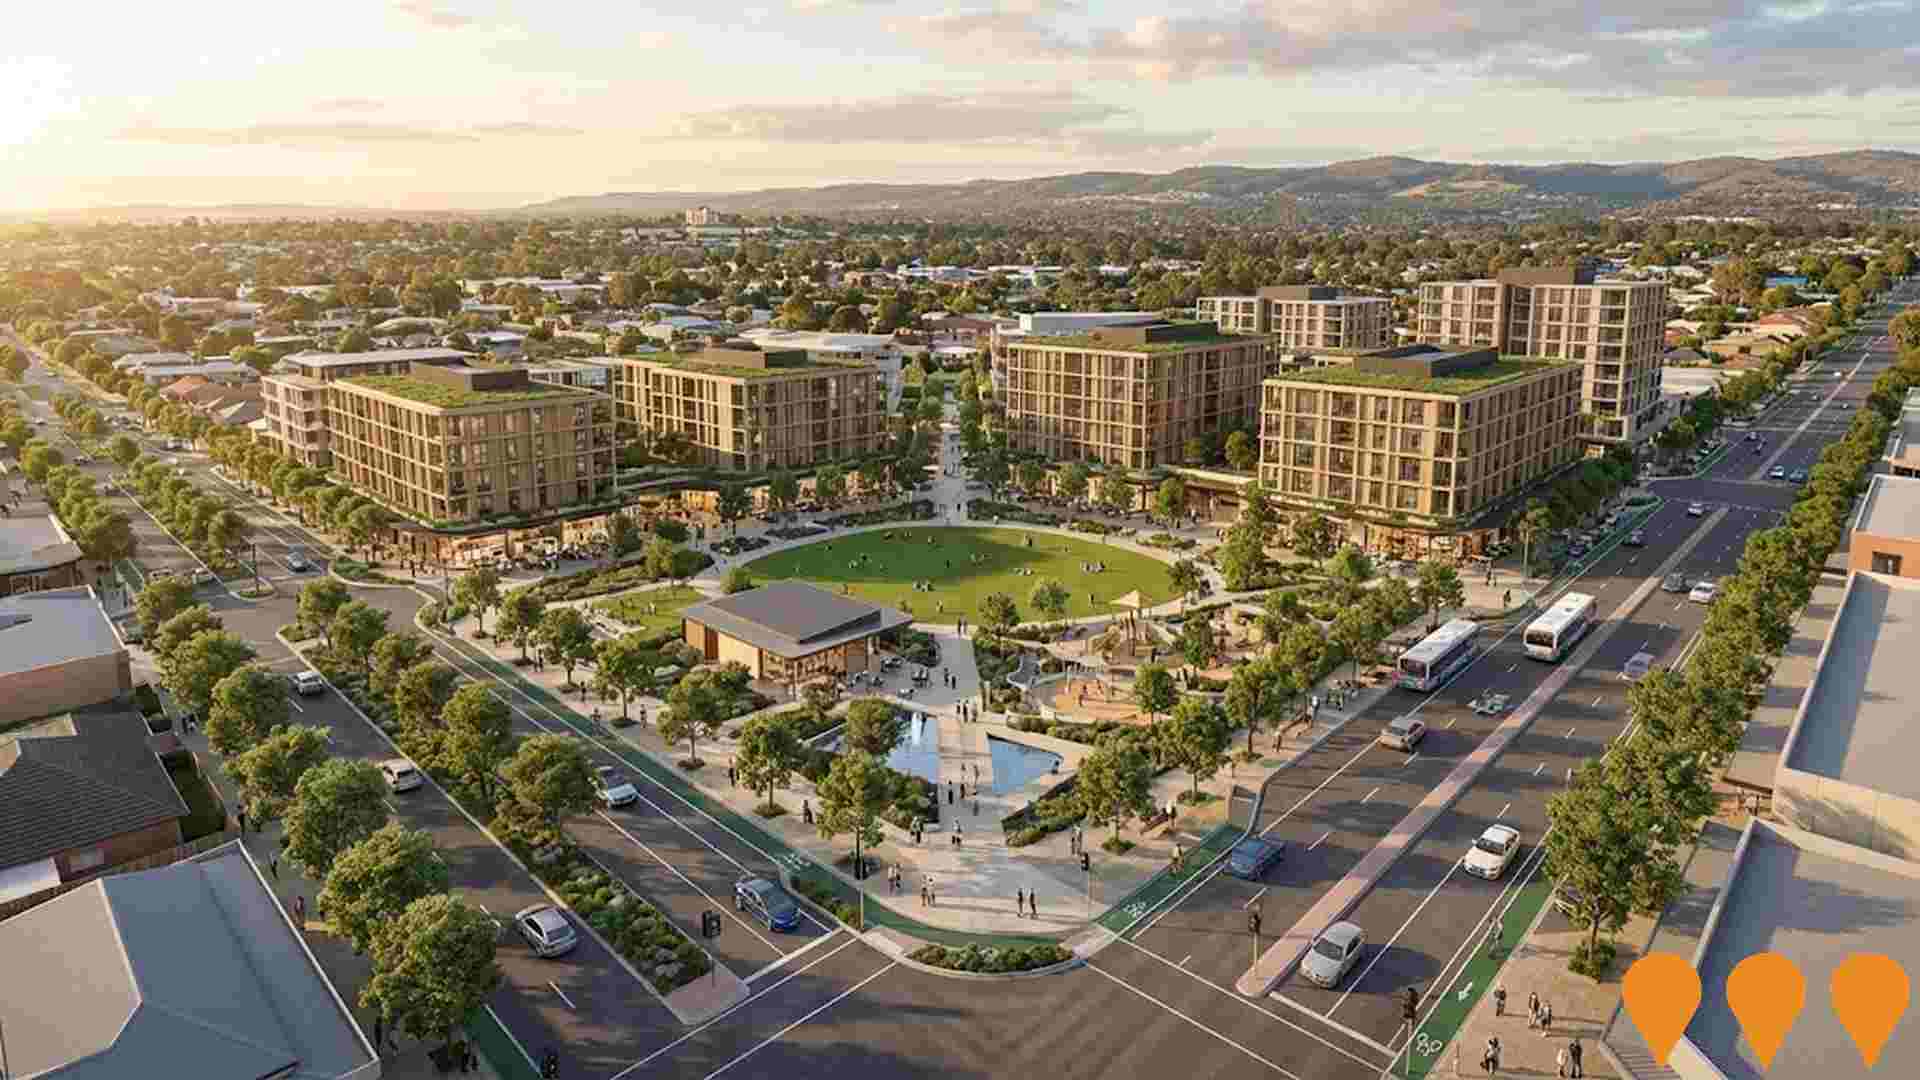
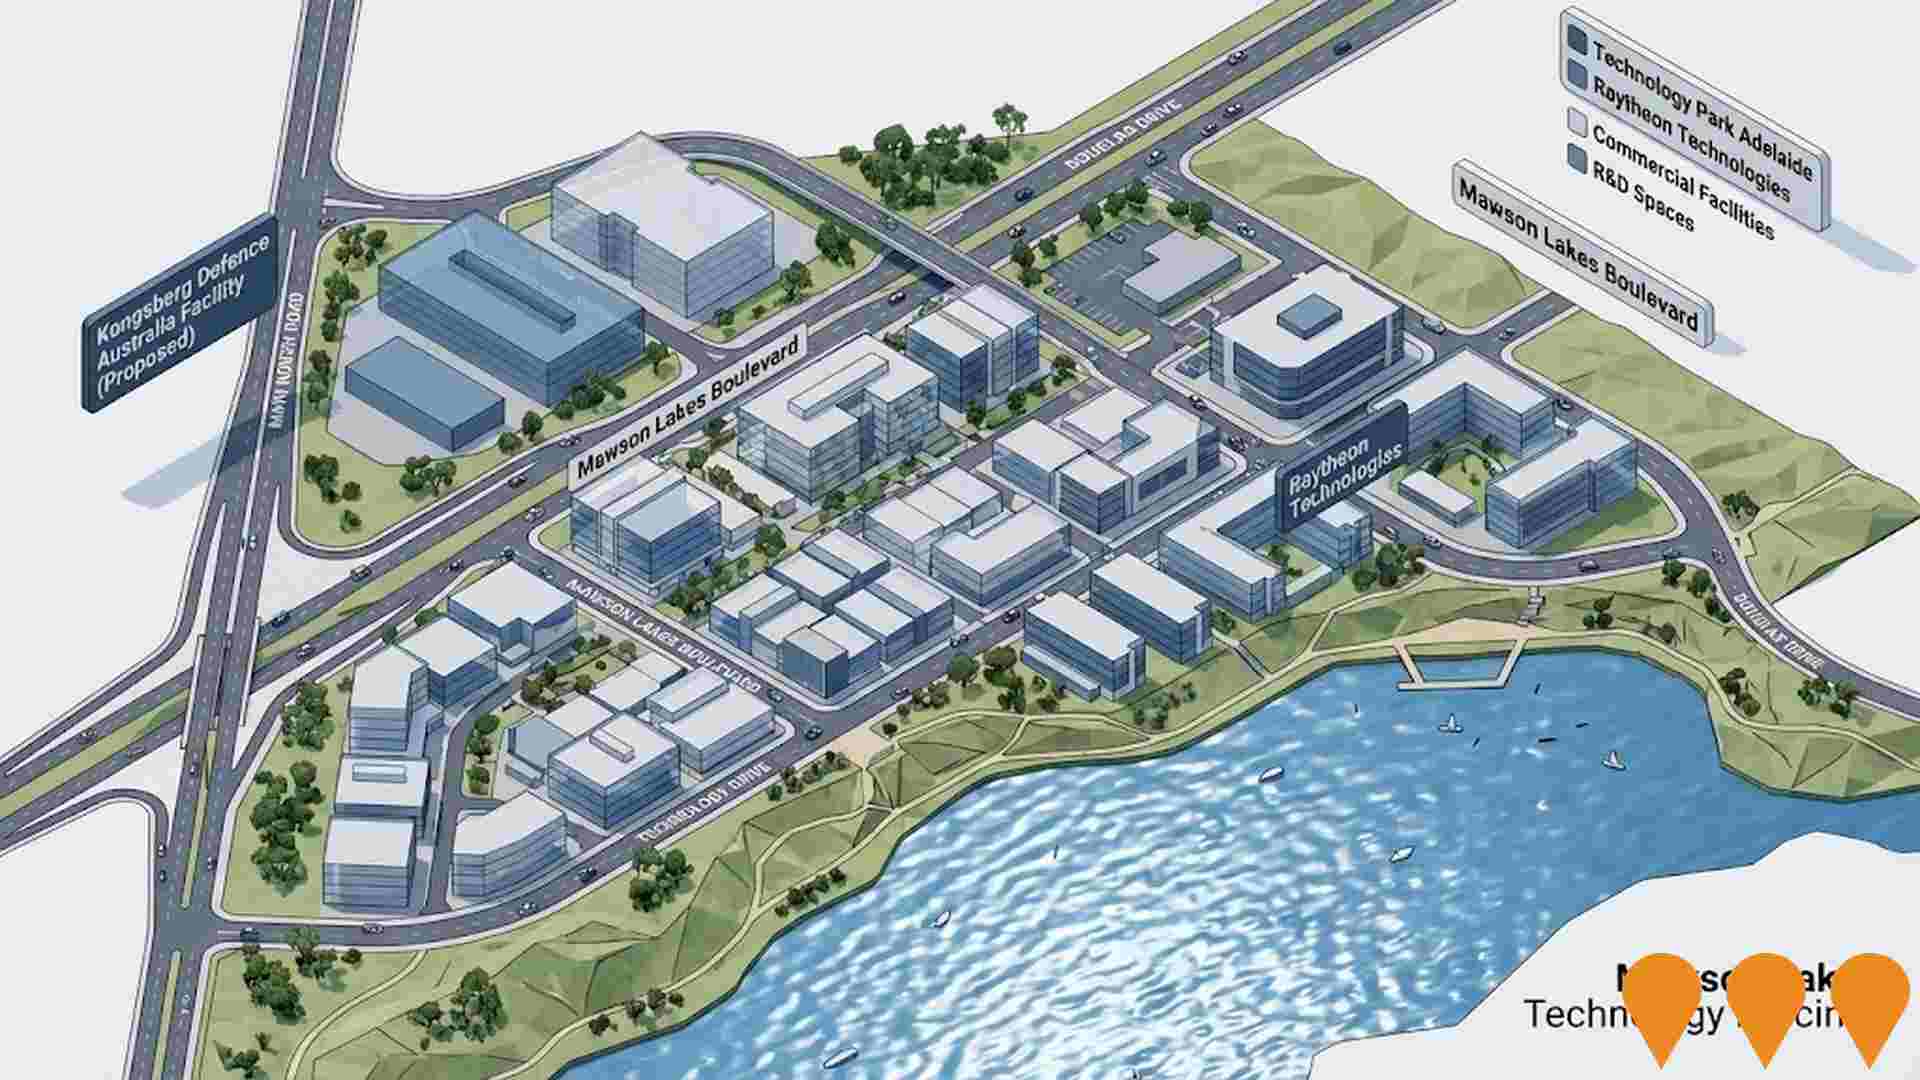
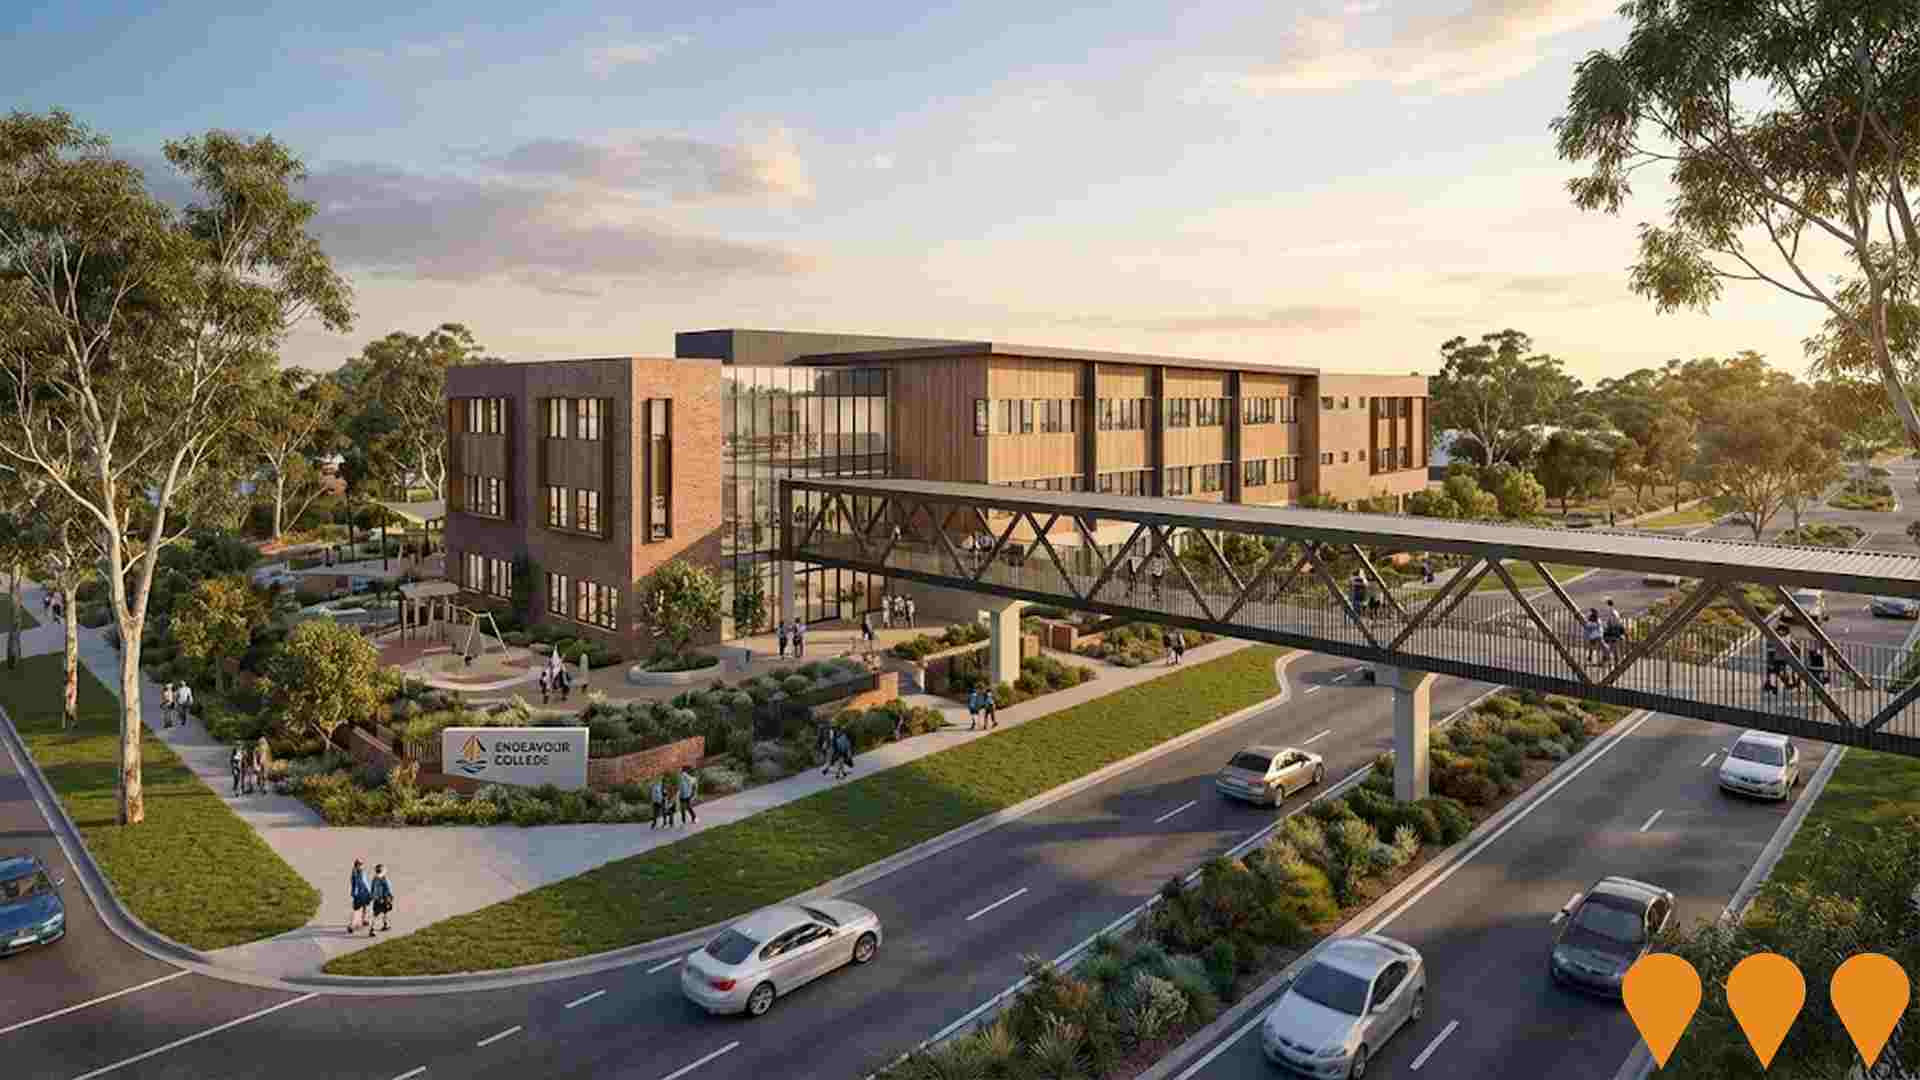
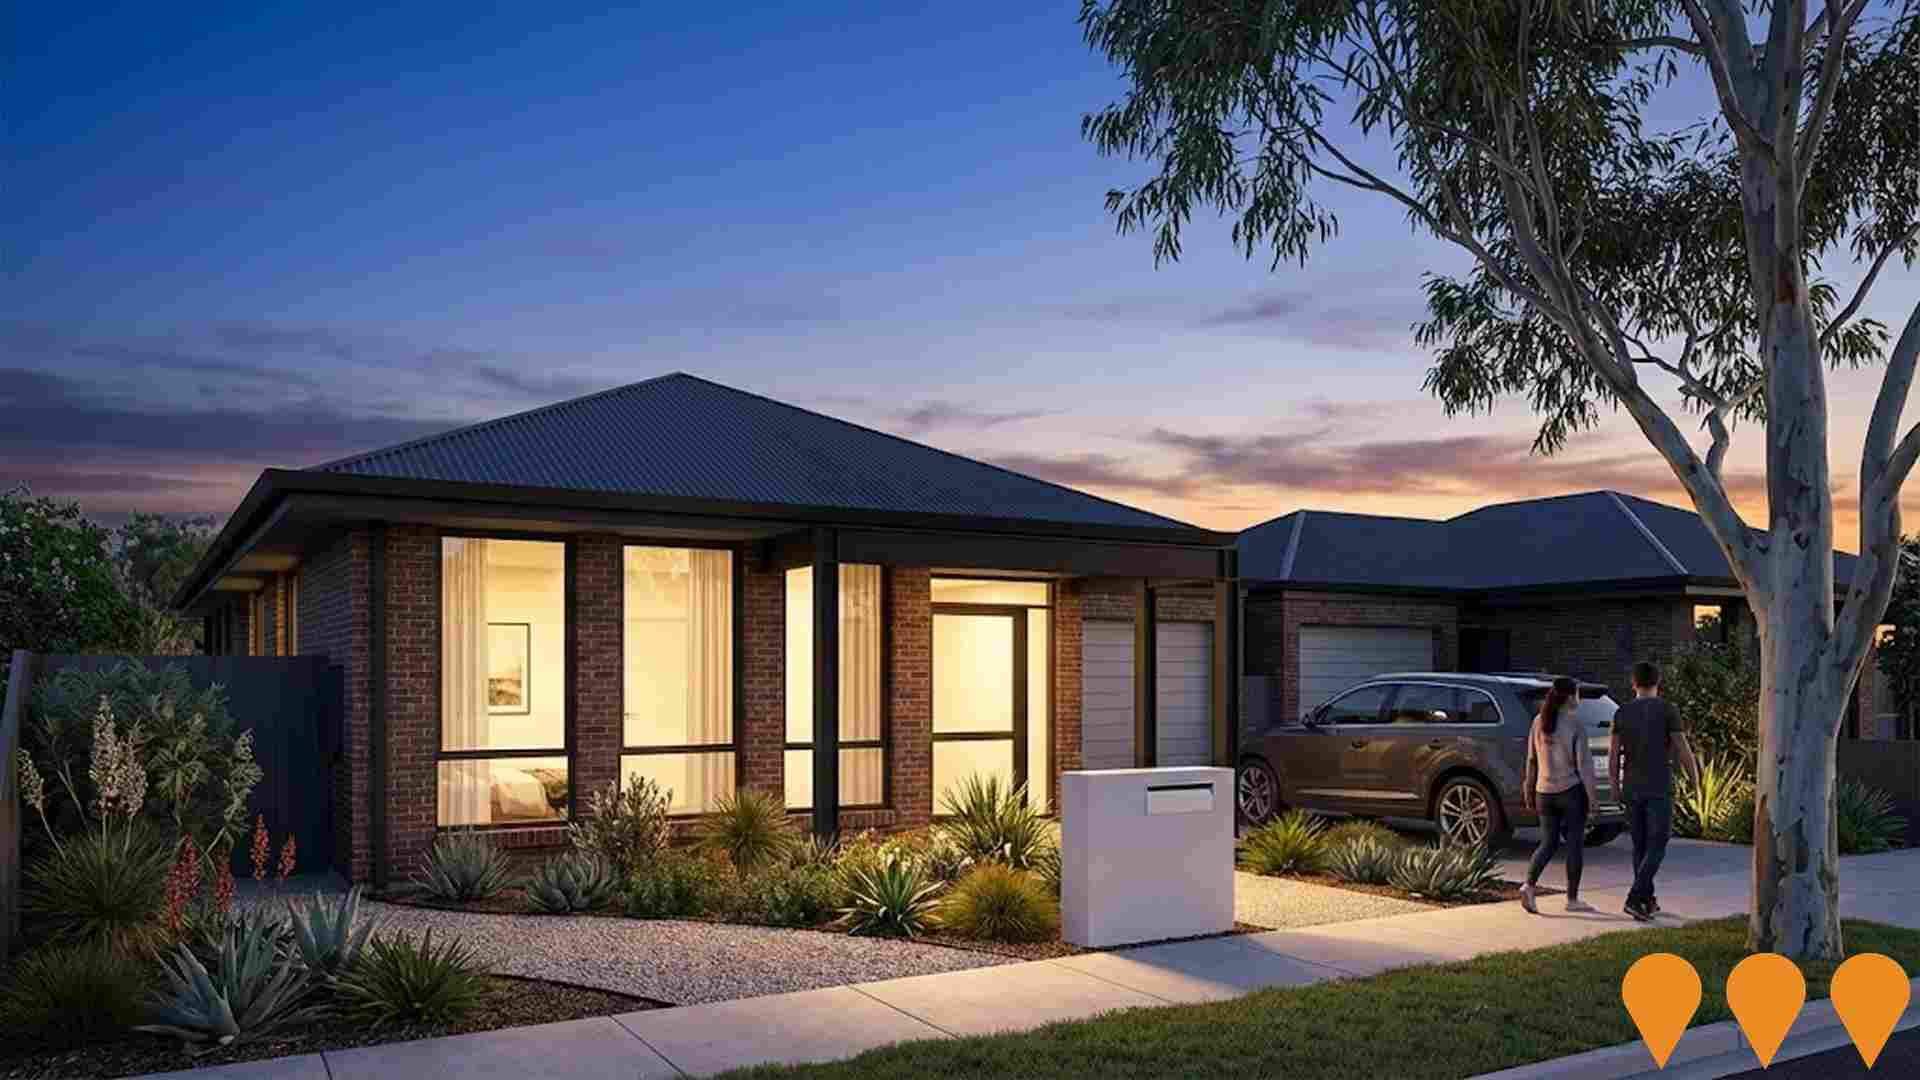
 Denotes AI-based impression for illustrative purposes only, not to be taken as definitive under any circumstances. Please follow links and conduct other investigations from the project's source for actual imagery. Developers and project owners wishing us to use original imagery please Contact Us and we will do so.
Frequently Asked Questions - Infrastructure
Pooraka Triangle Masterplan Redevelopment
A major urban renewal initiative transforming the 40-hectare Pooraka Triangle into a vibrant mixed-use precinct with residential, commercial, retail and community facilities, including up to 2,000 new homes and significant public realm improvements.
Mawson Lakes Technology Precinct Expansion
Ongoing expansion of the established Technology Park Adelaide and business precinct, managed by Renewal SA. Development includes new commercial facilities, research and development spaces, and technology infrastructure, with a recent focus on the defense and advanced manufacturing sectors, including the new Kongsberg Defence Australia facility.
Para Hills West Urban Renewal Precinct
State Government-led urban renewal initiative to transform underutilised former Housing SA land into a vibrant mixed-use precinct with up to 1,000 new homes over the next decade.
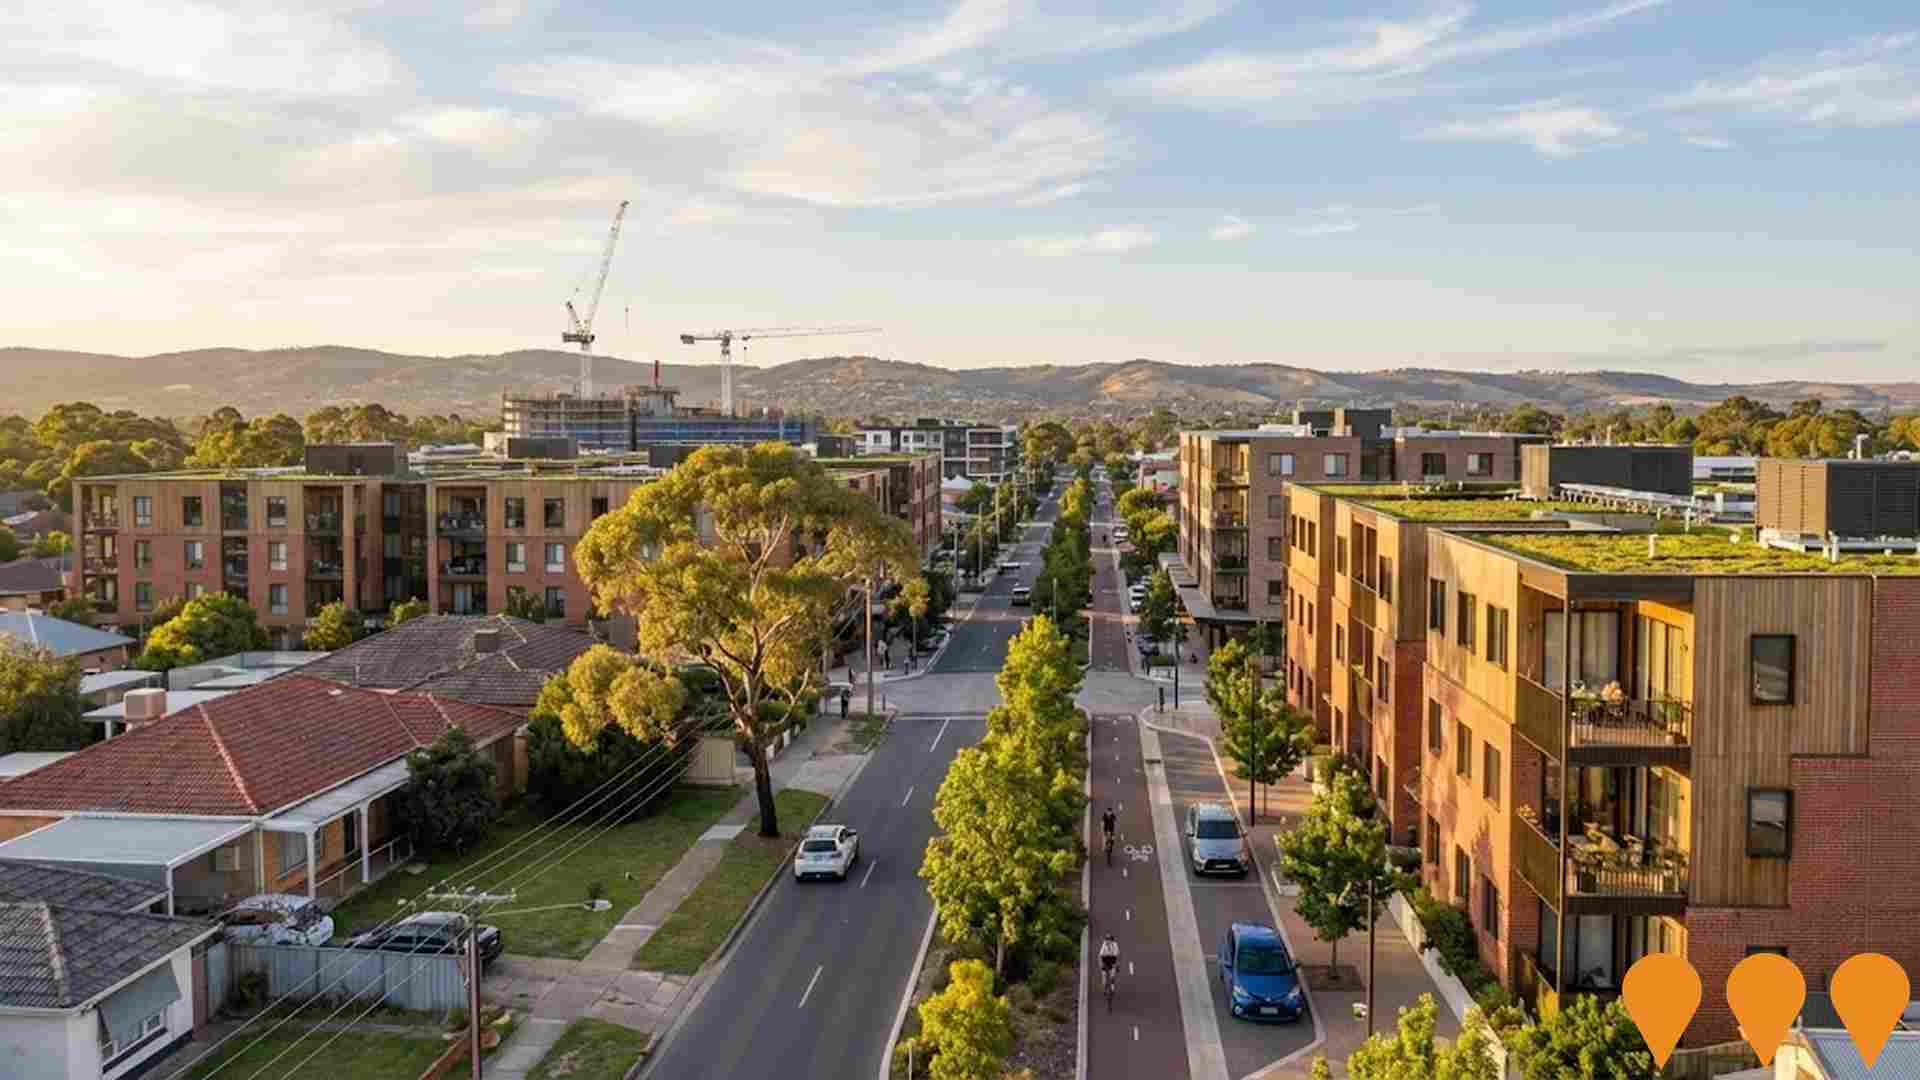
Montague Farm Estate
Large master-planned residential community delivering over 1,000 new homes including townhouses, apartments and detached dwellings in the heart of Pooraka, with integrated parks and community facilities.
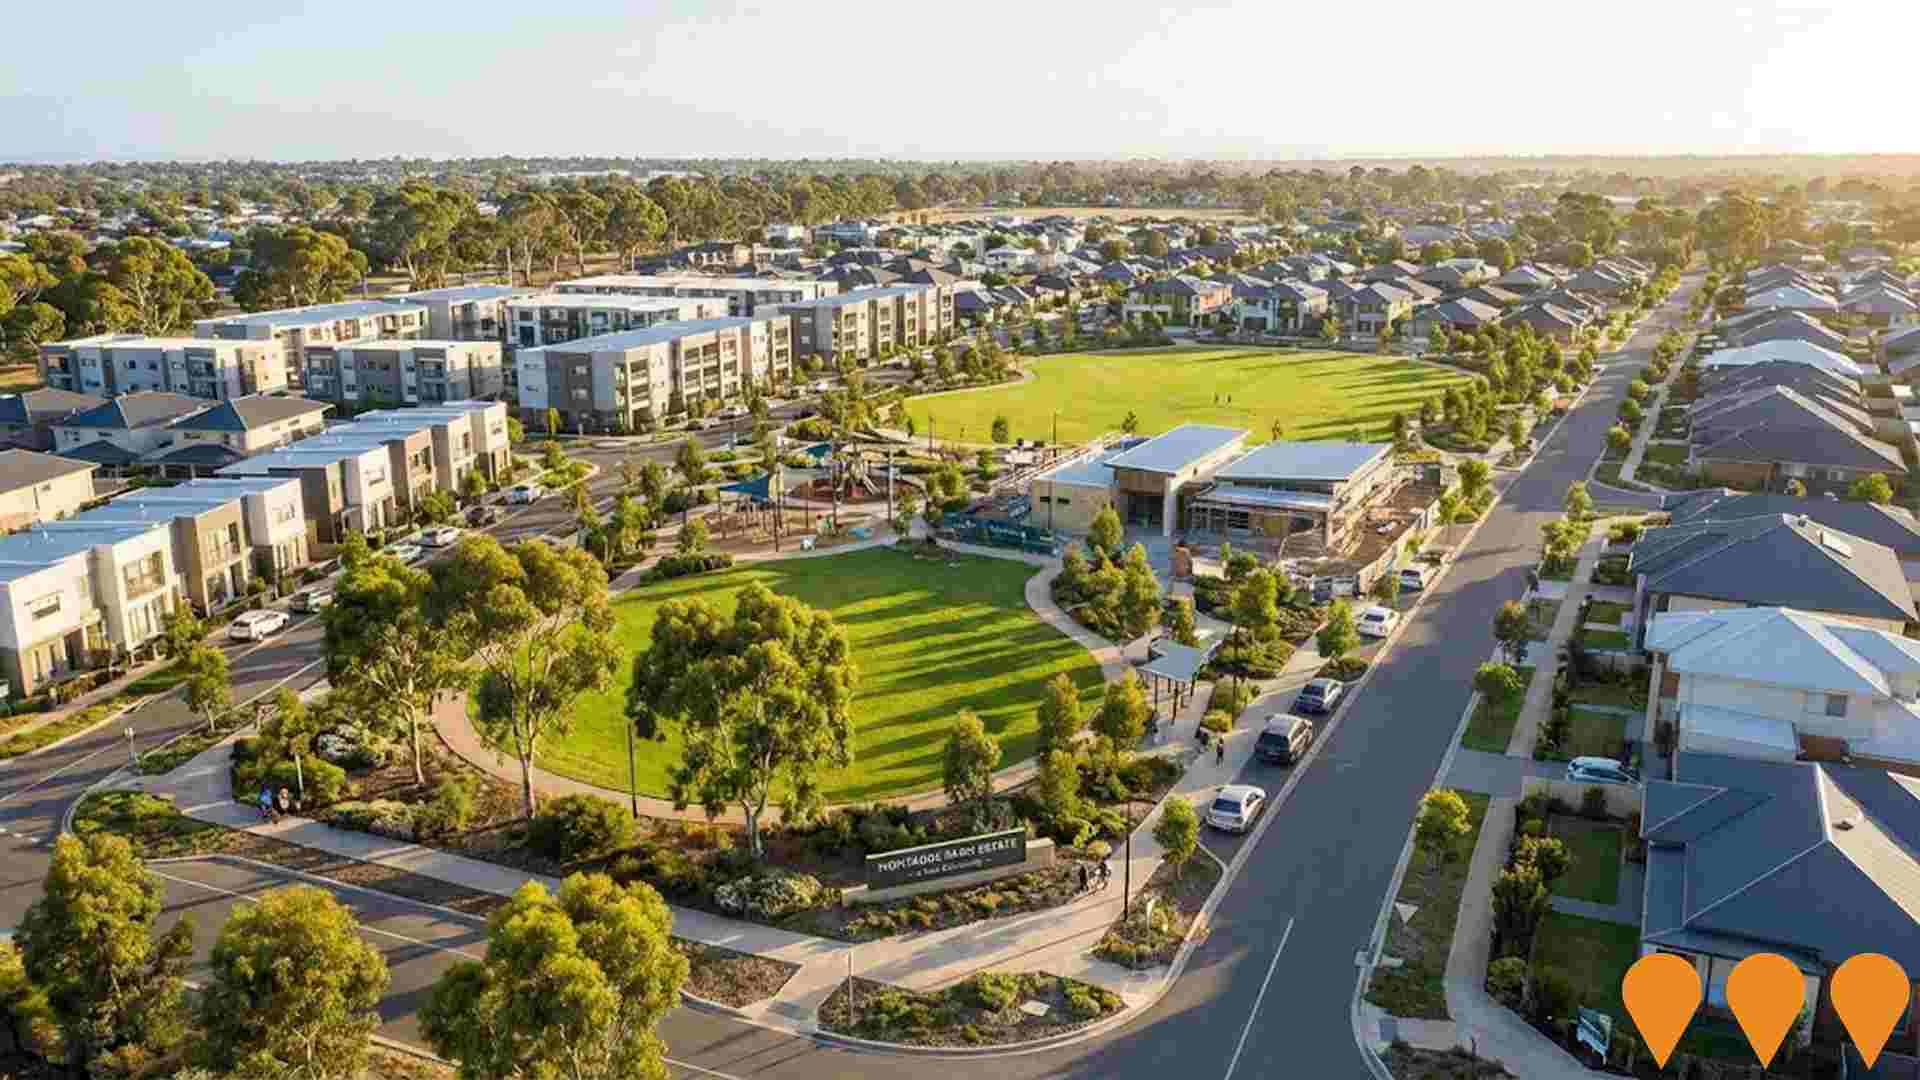
Northern Suburbs High School at Eyre
State-of-the-art Year 7-12 school with capacity for 1300 students on a 10-hectare site. The school will incorporate the latest education practices and support the growing population in Adelaide's northern suburbs. Part of the Greater Adelaide Regional Plan (GARP) which details 82,000 new homes to be built in the Outer North over the next 30 years.
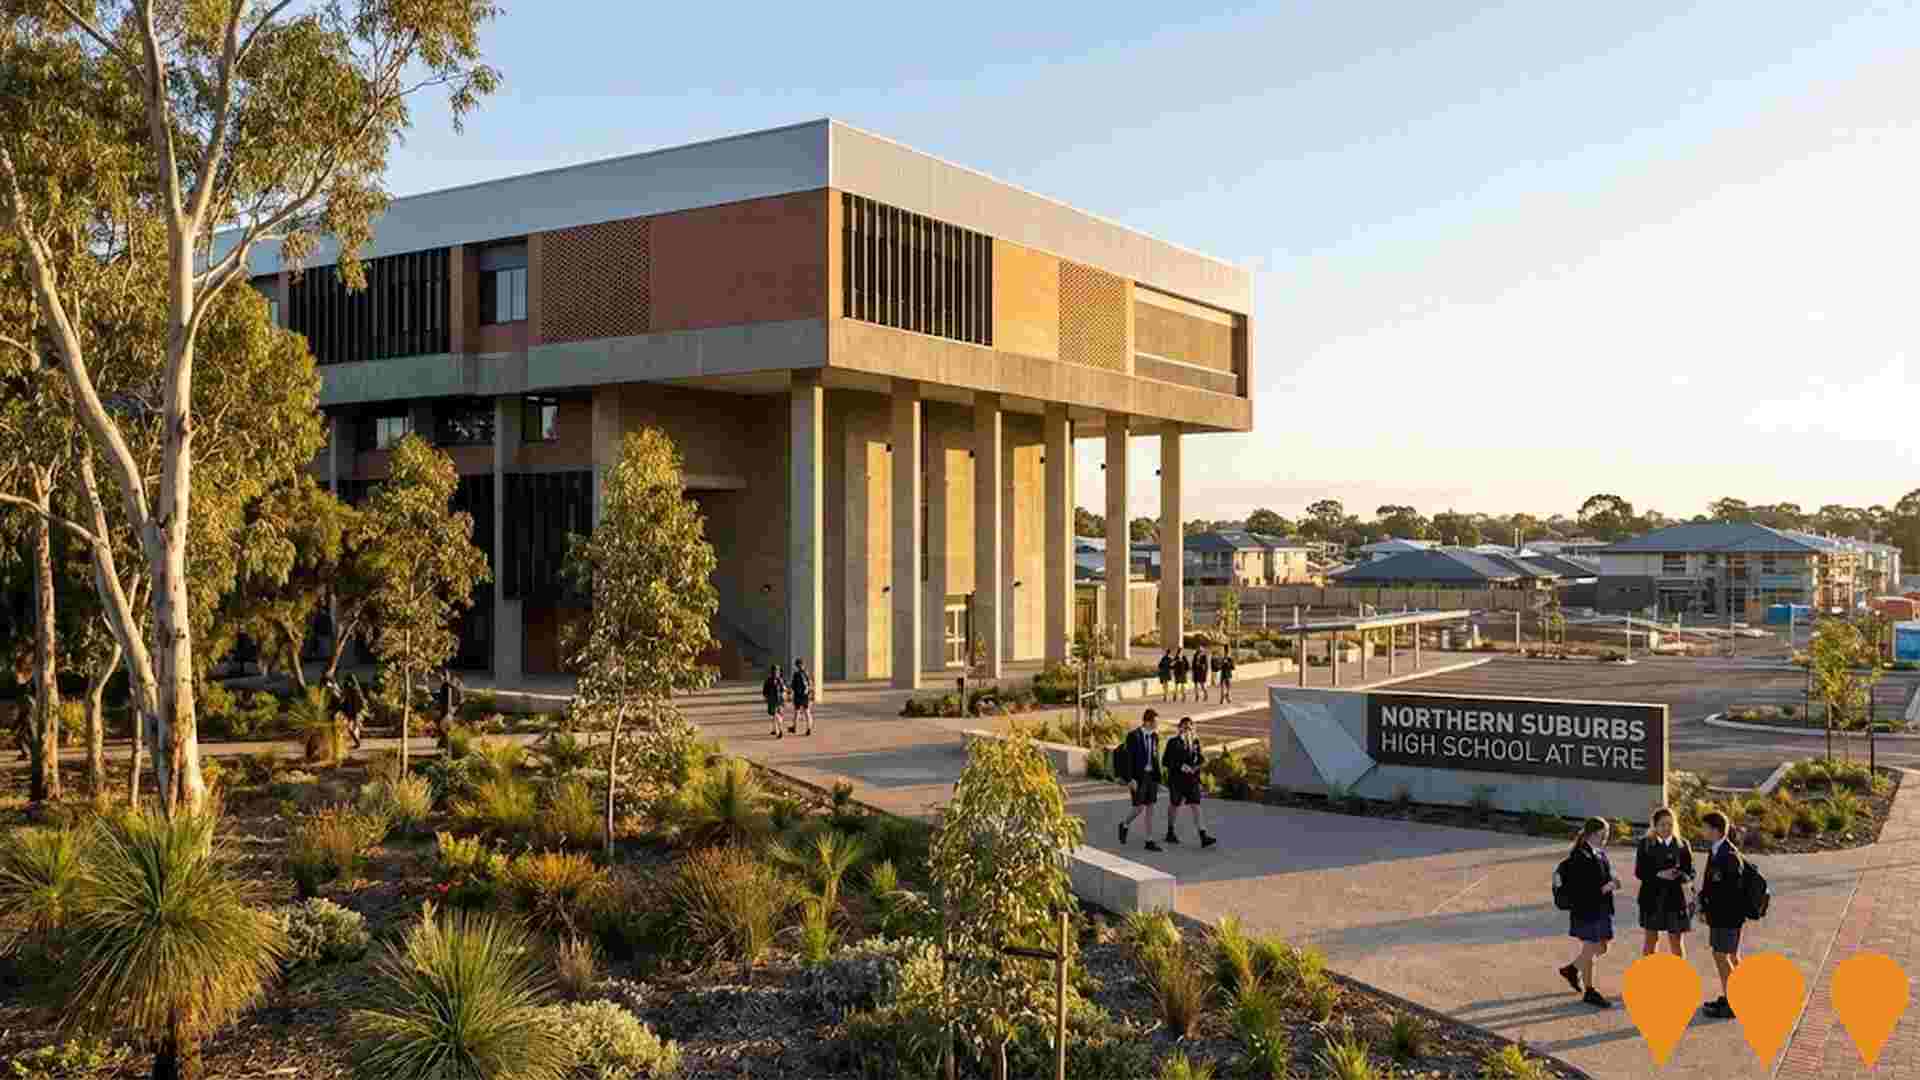
Walkleys Road Corridor
South Australia's first 6-Star Green Star Communities certified residential development delivering around 220 homes with diverse housing types including traditional allotments, low-maintenance lots, townhouses and super lots for integrated development. The project includes new streets, shared paths and bikeways, upgraded green streetscapes, stormwater detention basins with biofiltration, and a $2 million district-level playspace at Baloo Reserve. Features sustainable design with water-sensitive urban design principles. Planning application lodged June 2024 with first civil works and initial land release expected to commence 2025, with five-year delivery horizon through to 2030.
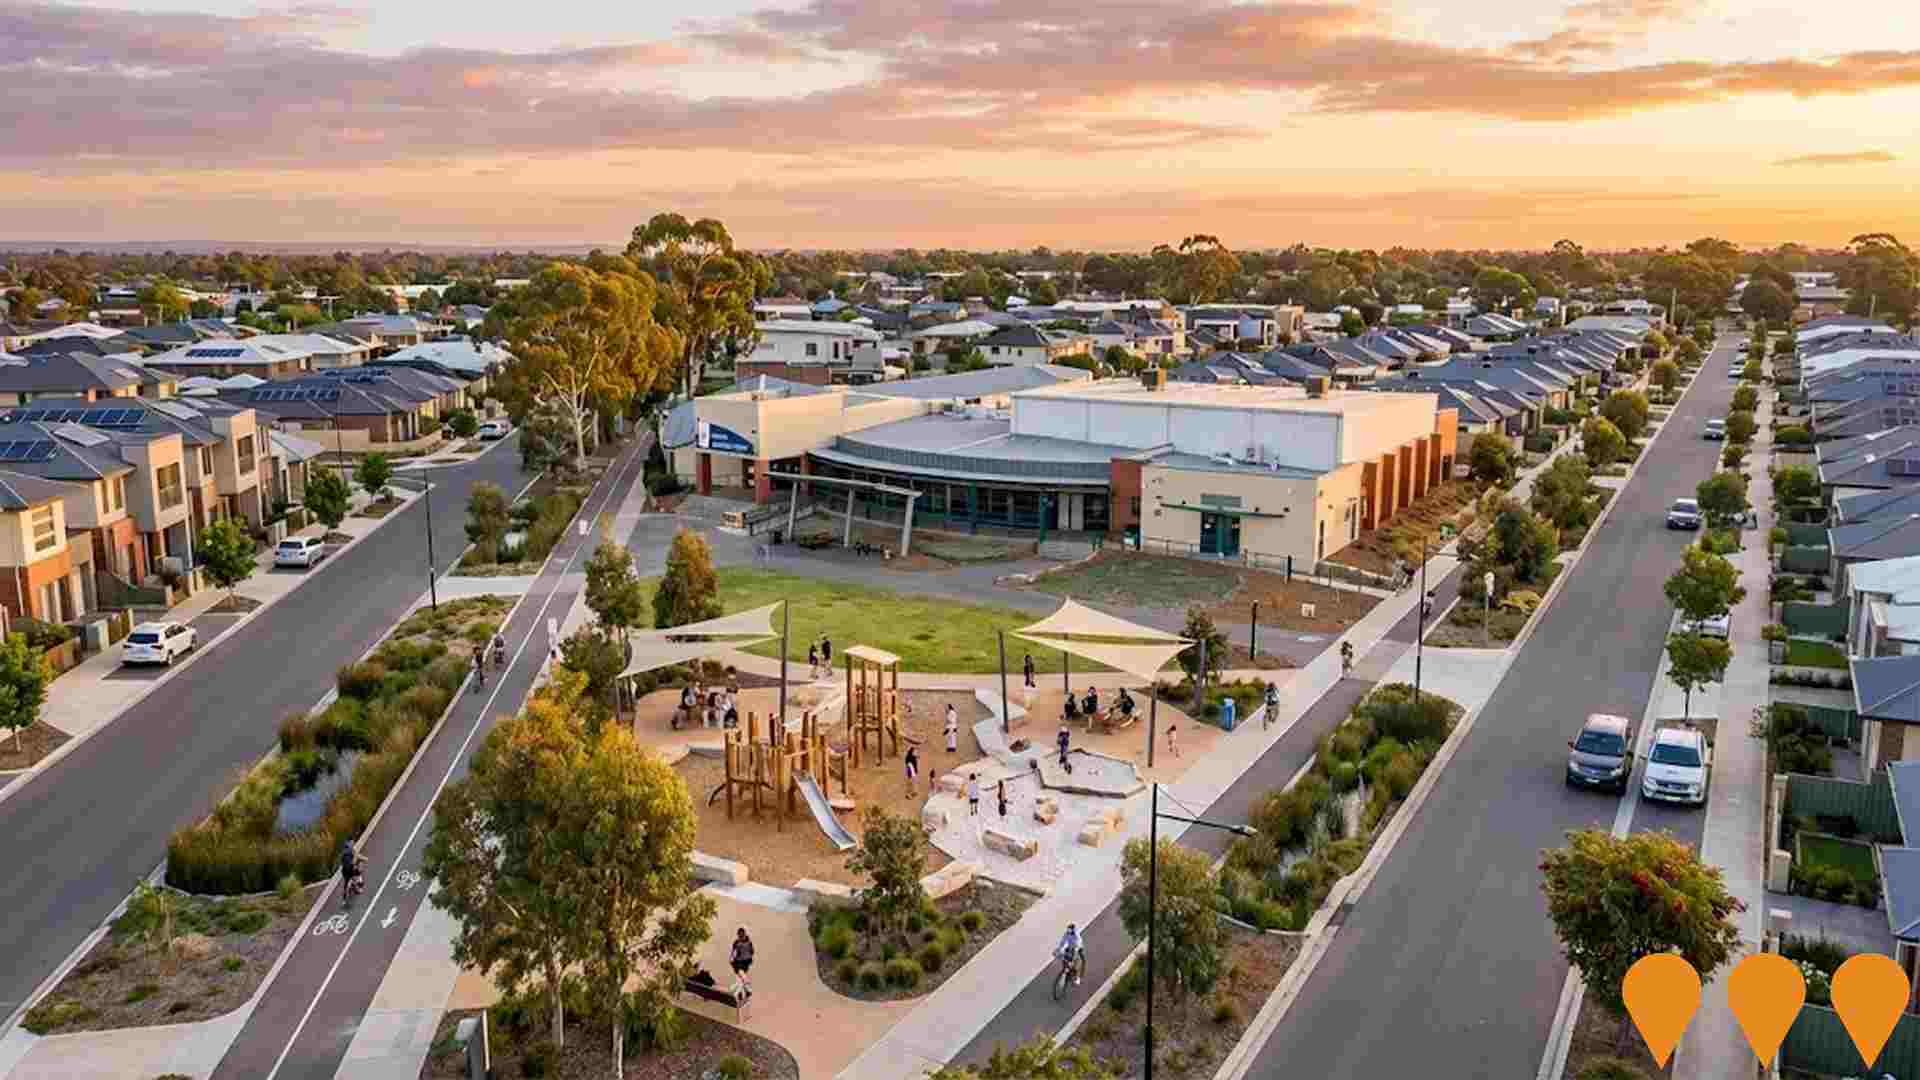
The Lakeside Project
Endeavour College is expanding its Mawson Lakes campus with a new Reception to Year 6 junior school and a pedestrian footbridge over Mawson Lakes Boulevard that links to the existing secondary campus. The three-storey facility includes 14 general learning areas, specialist STEM spaces, a library, music rooms, outdoor play areas and a central multi-purpose hub. Planning Consent was granted by the City of Salisbury Council Assessment Panel (DA 25017550) in September 2025. Target opening is from 2027.
SDA High Physical Support Home, Ingle Farm
Brand new Specialist Disability Accommodation (SDA) home in Ingle Farm, built to High Physical Support (HPS) and NCC Class 1B standards. Features accessible design including wide corridors, ramp entry, open showers, accessible kitchen, and provisions for a separate carer's room. The specific address, 16A Danum Avenue, has been sold and is a completed investment property, indicating the project is fully constructed and compliant with NDIS requirements.
Employment
Employment performance in Pooraka - Cavan has been below expectations when compared to most other areas nationally
Pooraka - Cavan has a skilled workforce with 5.2% unemployment as of September 2025. Employment growth over the past year was estimated at 1.4%.
There are 3,986 residents in work, with an unemployment rate of 1.2% above Greater Adelaide's rate of 3.9%. Workforce participation is lower than Greater Adelaide's at 57.7%. Key industries of employment include health care & social assistance, manufacturing, and retail trade. Manufacturing has a particularly strong presence, employing 1.5 times the regional level.
Education & training employs just 7.0% of local workers, below Greater Adelaide's 9.3%. The worker-to-resident ratio is 0.9, indicating substantial employment opportunities locally. Between September 2024 and September 2025, employment levels increased by 1.4%, with labour force increasing by the same percentage. Unemployment remained essentially unchanged during this period. In comparison, Greater Adelaide recorded higher employment growth of 3.0% and lower unemployment rate decrease of 0.1%. State-level data from 25-Nov-25 shows SA employment grew by 1.19%, adding 10,710 jobs, with a state unemployment rate of 4.0%. This compares favourably to the national unemployment rate of 4.3% and outpaces the national average employment growth of 0.14%. Jobs and Skills Australia's national employment forecasts from May-25 project national employment growth of 6.6% over five years and 13.7% over ten years, with varying rates across industry sectors. Applying these projections to Pooraka - Cavan's employment mix suggests local employment should increase by 6.1% over five years and 13.2% over ten years.
Frequently Asked Questions - Employment
Income
Income levels sit below national averages according to AreaSearch assessment
AreaSearch's latest postcode level ATO data for financial year 2022 shows Pooraka - Cavan SA2 had a median income among taxpayers of $52,047 and an average of $59,831. This is lower than the national average. In Greater Adelaide, the median was $52,592 with an average of $64,886. By September 2025, based on Wage Price Index growth of 12.83%, estimated incomes would be approximately $58,725 (median) and $67,507 (average). According to Census 2021 income data, Pooraka - Cavan's household, family, and personal incomes all fall between the 11th and 17th percentiles nationally. In terms of income distribution, 31.2% of individuals in Pooraka - Cavan earn between $1,500 and $2,999 annually, similar to regional levels at 31.8%. Housing affordability pressures are severe with only 83.9% of income remaining, ranking at the 18th percentile nationally.
Frequently Asked Questions - Income
Housing
Pooraka - Cavan is characterized by a predominantly suburban housing profile, with above-average rates of outright home ownership
In Pooraka-Cavan, as per the latest Census evaluation, houses constituted 85.9% of dwellings, with other types (semi-detached, apartments, 'other') making up 14.0%. This compares to Adelaide metro's 83.9% houses and 16.0% other dwellings. Home ownership in Pooraka-Cavan stood at 33.1%, with mortgaged dwellings at 36.3% and rented ones at 30.6%. The median monthly mortgage repayment was $1,335, surpassing Adelaide metro's average of $1,300. The median weekly rent was recorded at $300, matching Adelaide metro's figure. Nationally, Pooraka-Cavan's mortgage repayments were significantly lower than the Australian average of $1,863, and rents were substantially below the national figure of $375.
Frequently Asked Questions - Housing
Household Composition
Pooraka - Cavan has a typical household mix, with a lower-than-average median household size
Family households account for 67.9% of all households, including 30.4% couples with children, 22.3% couples without children, and 13.6% single parent families. Non-family households make up the remaining 32.1%, with lone person households at 28.4% and group households comprising 3.6% of the total. The median household size is 2.5 people, which is smaller than the Greater Adelaide average of 2.7.
Frequently Asked Questions - Households
Local Schools & Education
Educational outcomes in Pooraka - Cavan fall within the lower quartile nationally, indicating opportunities for improvement in qualification attainment
In Pooraka-Cavan Trail region, 20.5% of residents aged 15+ have university degrees, compared to Australia's 30.4%. The most common qualifications are bachelor degrees (13.4%), followed by postgraduate (5.8%) and graduate diplomas (1.3%). Vocational credentials are held by 31.1%, including advanced diplomas (8.4%) and certificates (22.7%). Educational participation is high, with 29.1% currently enrolled in formal education: primary (9.6%), secondary (7.0%), and tertiary (5.7%).
Educational participation is notably high, with 29.1% of residents currently enrolled in formal education. This includes 9.6% in primary education, 7.0% in secondary education, and 5.7% pursuing tertiary education.
Frequently Asked Questions - Education
Schools Detail
Nearby Services & Amenities
Transport
Transport servicing is good compared to other areas nationally based on assessment of service frequency, route connectivity and accessibility
The analysis of public transport in Pooraka - Cavan shows that there are 71 active transport stops currently operating. These stops serve a mix of bus routes, with a total of 39 individual routes providing service to the area. The combined weekly passenger trips facilitated by these routes amount to 2,352.
Residents in this region enjoy excellent transport accessibility, with an average distance of just 149 meters to the nearest transport stop. On average, there are 336 trips per day across all routes, which translates to approximately 33 weekly trips per individual stop.
Frequently Asked Questions - Transport
Transport Stops Detail
Health
Health performance in Pooraka - Cavan is lower than average with common health conditions somewhat prevalent across both younger and older age cohorts
Pooraka - Cavan faces significant health challenges. Common health conditions are prevalent across both younger and older age cohorts. The rate of private health cover is relatively low at approximately 50% of the total population (~4146 people), compared to 47.1% across Greater Adelaide, which is lower than the national average of 55.3%.
Mental health issues impact 8.1% of residents and arthritis impacts 7.9%. Approximately 69.0% declare themselves completely clear of medical ailments, compared to 68.1% in Greater Adelaide. The area has 18.4% of residents aged 65 and over (1539 people), higher than the 16.1% in Greater Adelaide. Health outcomes among seniors present some challenges, broadly in line with the general population's health profile.
Frequently Asked Questions - Health
Cultural Diversity
Pooraka - Cavan is among the most culturally diverse areas in the country based on AreaSearch assessment of a range of language and cultural background related metrics
Pooraka-Cavan has a high level of cultural diversity, with 39.8% of its population born overseas and 41.6% speaking a language other than English at home. Christianity is the predominant religion in Pooraka-Cavan, accounting for 43.1% of people. Islam is overrepresented, comprising 10.5% compared to the Greater Adelaide average of 8.0%.
The top three ancestry groups are English (20.5%), Australian (19.0%), and Other (17.9%). Notable divergences include Vietnamese at 6.7%, Polish at 1.4%, and Serbian at 0.8%, compared to regional averages of 3.1%, 1.1%, and 0.5% respectively.
Frequently Asked Questions - Diversity
Age
Pooraka - Cavan's population is slightly younger than the national pattern
Pooraka-Cavan has a median age of 38, nearly matching Greater Adelaide's figure of 39 and Australia's median age of 38. Compared to Greater Adelaide's average, Pooraka-Cavan has an over-representation of the 25-34 age cohort (15.2% locally) and an under-representation of the 75-84 year-olds (5.8%). Between 2021 and present, the proportion of the population aged 25 to 34 has increased from 14.3% to 15.2%, while the 45 to 54 cohort has decreased from 12.1% to 11.2%. By 2041, demographic modeling suggests Pooraka-Cavan's age profile will significantly change. The 75-84 age cohort is projected to expand by 202 people (42%), from 485 to 688. Notably, the combined age groups of 65 and above will account for 61% of total population growth, reflecting the area's aging demographic profile. Meanwhile, the 5-14 cohort is projected to decline by 16 people.
