Chart Color Schemes
This analysis uses ABS Statistical Areas Level 2 (SA2) boundaries, which can materially differ from Suburbs and Localities (SAL) even when sharing similar names.
SA2 boundaries are defined by the Australian Bureau of Statistics and are designed to represent communities for statistical reporting (e.g., census and ERP).
Suburbs and Localities (SAL) represent commonly-used suburb/locality names (postal-style areas) and may use different geographic boundaries. For comprehensive analysis, consider reviewing both boundary types if available.
est. as @ -- *
ABS ERP | -- people | --
2021 Census | -- people







Curious about local property values? Filter the chart to assess the volume and appreciation (including resales) trends and regional comparisons, or scroll to the map below view this information at an individual property level.

Find a Recent Sale

Sales Detail
Garbutt - West End has an estimated 6,606 residents, up from 6,273 at the 2021 Census — a change of 333 people, or 5.3%. Growth has averaged 0.8% a year over five years. Overseas migration accounts for 56.9% of that increase. That puts 387 residents on each square kilometre. Population is estimated from ABS Estimated Resident Population releases and GNAF address data, re-based from the 2021 Census and updated annually.
Detail
As of Aug 2026, the population of Garbutt - West End stands at approximately 6,606 according to evaluations by AreaSearch. This represents a gain of 333 people (5.3%) compared to the 2021 Census tally of 6,273 people. Such movement is calculated using the ABS estimated resident population figure of 6,605 as of June 2025 alongside 90 validated new addresses logged post-Census. With a density of 387 persons per square kilometer, the locality offers generous space per resident with scope for future expansion. The community's 5.3% post-Census expansion sits within 1.9 percentage points of the wider SA4 region (7.2%), highlighting resilient growth drivers.
Net overseas migration served as the primary contributor to demographic expansion, accounting for roughly 56.9% of total recent population increases. Projections for SA2 districts utilise ABS/Geoscience Australia datasets published in 2024 with 2022 serving as the baseline. Where areas fall outside this series, or for intervals beyond 2032, Queensland State Government SA2 forecasts published in 2023 (utilising 2021 data) are integrated. Because those state models lack age cohort breakdowns, AreaSearch applies proportional growth weightings sourced from the ABS Greater Capital Region projections (published in 2023 from 2022 data) across each bracket. Under this combined approach, the total population is projected to contract by 485 persons by 2041. In contrast, select demographics are slated to expand, with the 85 and over demographic leading gains through an addition of 111 people. More details can be found in the age section.
Frequently Asked Questions - Population
97 new dwellings have been approved in Garbutt - West End over the past five years, an average of 19 a year. That is 3.0 approvals per 1,000 residents. Figures come from ABS building approvals aggregated to this SA2 boundary and are updated monthly as the ABS releases them.
Detail
Residential building approvals across Garbutt - West End have averaged approximately 19 new homes annually, totalling 97 homes approved over the past 5 financial years (between FY-22 and FY-26). Over the past 5 financial years (between FY-22 and FY-26), the area recorded an average influx of 2.7 people per year for every newly built residence, demonstrating healthy underlying demand to sustain real estate valuations. New residential construction costs average $306,000, sitting below broader regional benchmarks and offering accessible entry points for buyers. Furthermore, commercial building approvals have reached $38.5 million this financial year, underscoring strong local commercial investment.
In comparison to Rest of Qld, per-capita residential construction in Garbutt - West End tracking at roughly 75% of regional levels positions the suburb in the 29th percentile nationwide, limiting options for purchasers while bolstering interest in established stock. This building rate is likewise subdued compared to nationwide figures, signalling a mature locality facing potential physical or planning limitations. Newly approved housing consists of 89.0% detached dwellings and 11.0% medium and high-density housing, preserving the suburb's low-density profile geared toward buyers seeking detached family dwellings. Interestingly, builders are delivering freestanding residences at a higher rate than the baseline stock (54.0% at Census), showing enduring appetite for traditional housing despite broader densification trends. The presence of 708 people per dwelling approval reflects a calm, low-intensity construction pipeline. Given that demographic forecasts indicate stagnant or decreasing population numbers, Garbutt - West End is likely to experience easing residential demand pressures, creating advantageous conditions for prospective purchasers.
Frequently Asked Questions - Development
Development applications around Garbutt - West End
Loading development applications…
| Lodged | Address | Description | Type | Distance | Status |
|---|
SOURCE: Planning portals and council registers, compiled by AreaSearch. Distance & bearing measured from the suburb midpoint.
AreaSearch tracks 10 current infrastructure and development projects inside Garbutt - West End, worth an estimated $800 million. A further 34 sit in the immediately surrounding suburbs, taking the tracked pipeline within reach of the area to $3.77 billion. 15 are already under construction and 8 are due for completion within three years. The pipeline spans residential development, transport & logistics and precincts & urban renewal. Records are compiled from Infrastructure Australia, state agencies, council planning portals and public announcements, reviewed and updated daily, then ranked by proximity, construction stage, completion horizon and project scale.
Detail
Local economic and social outcomes are substantially shaped by capital works and strategic planning initiatives, with AreaSearch cataloguing 23 projects expected to influence the district. Prominent developments include the Army Aviation Program of Works - RAAF Base Townsville, Weststate Private Hospital, Francis Street Roadworks, West End, and Queensland Rail Support Facilities, Bolam Street, alongside key initiatives outlined below.
Professional plan users can use the search below to filter and access additional projects.
INFRASTRUCTURE SEARCH
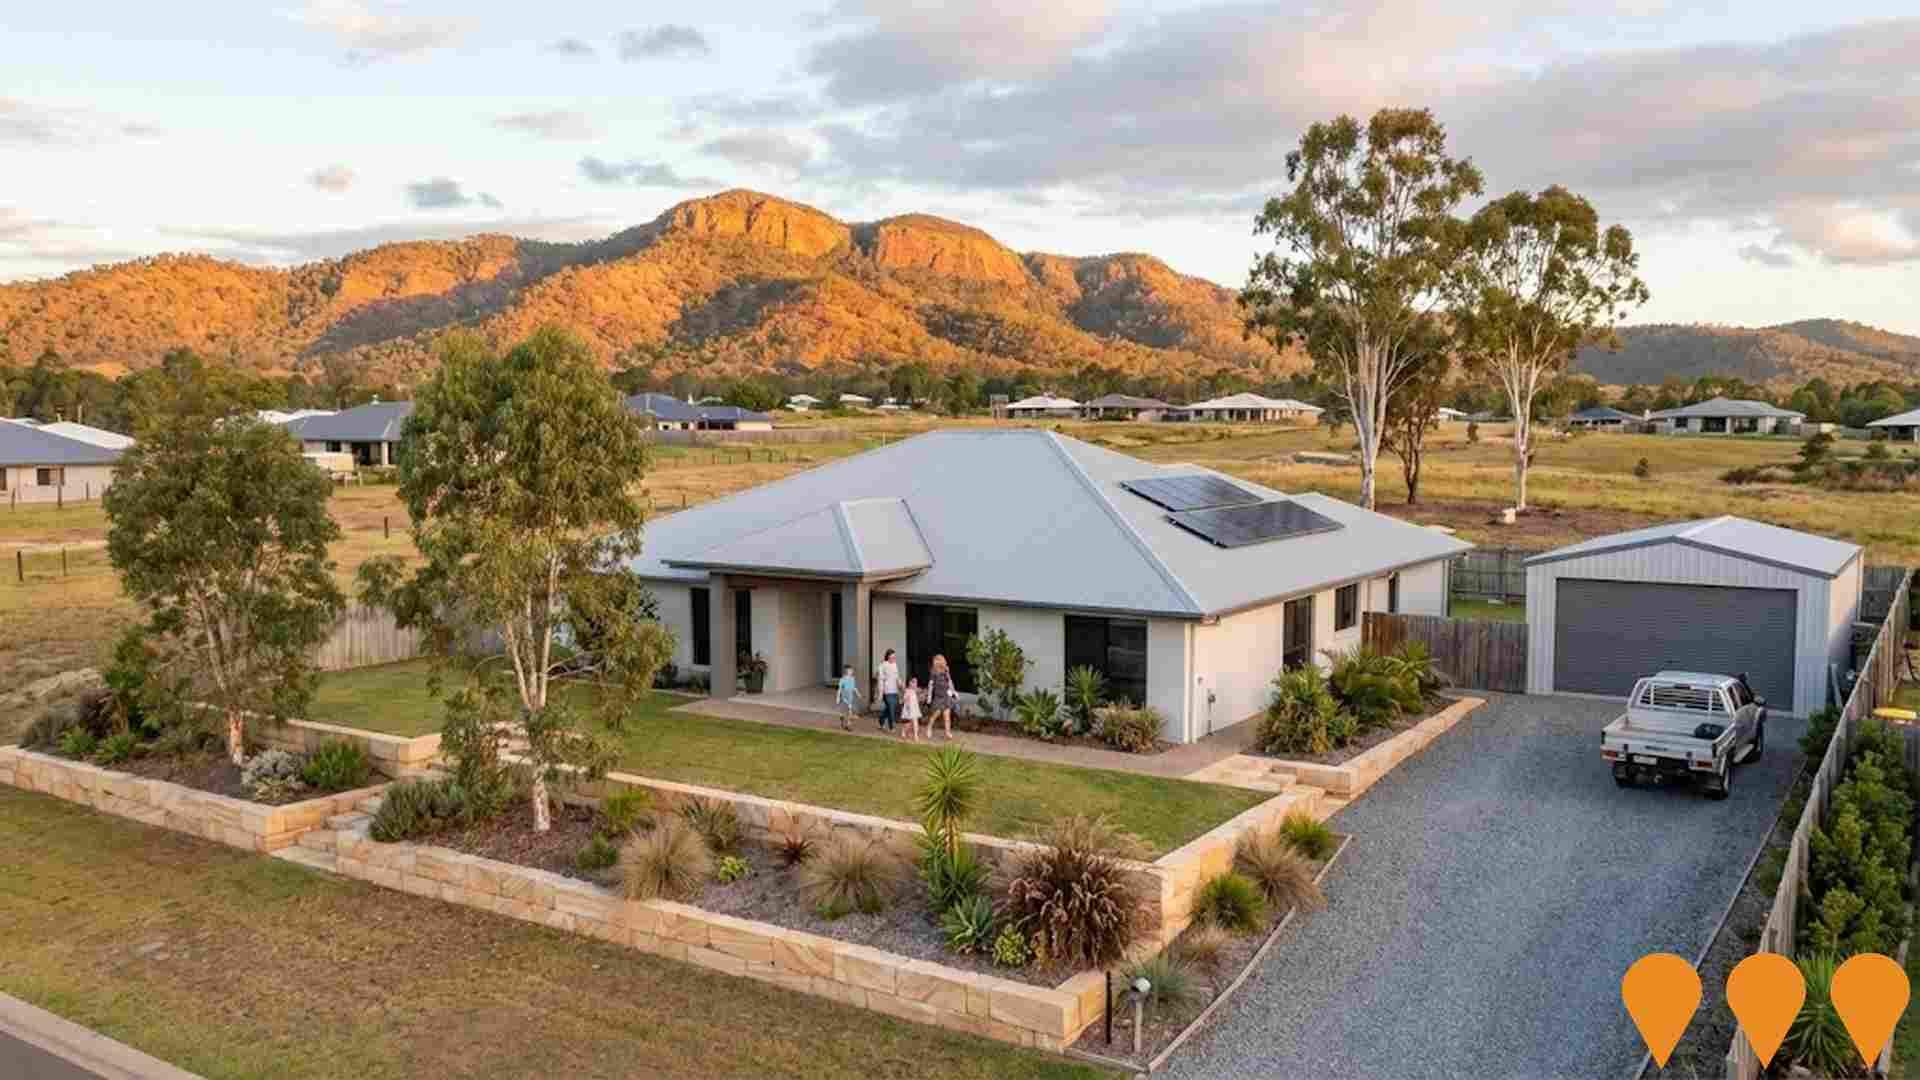
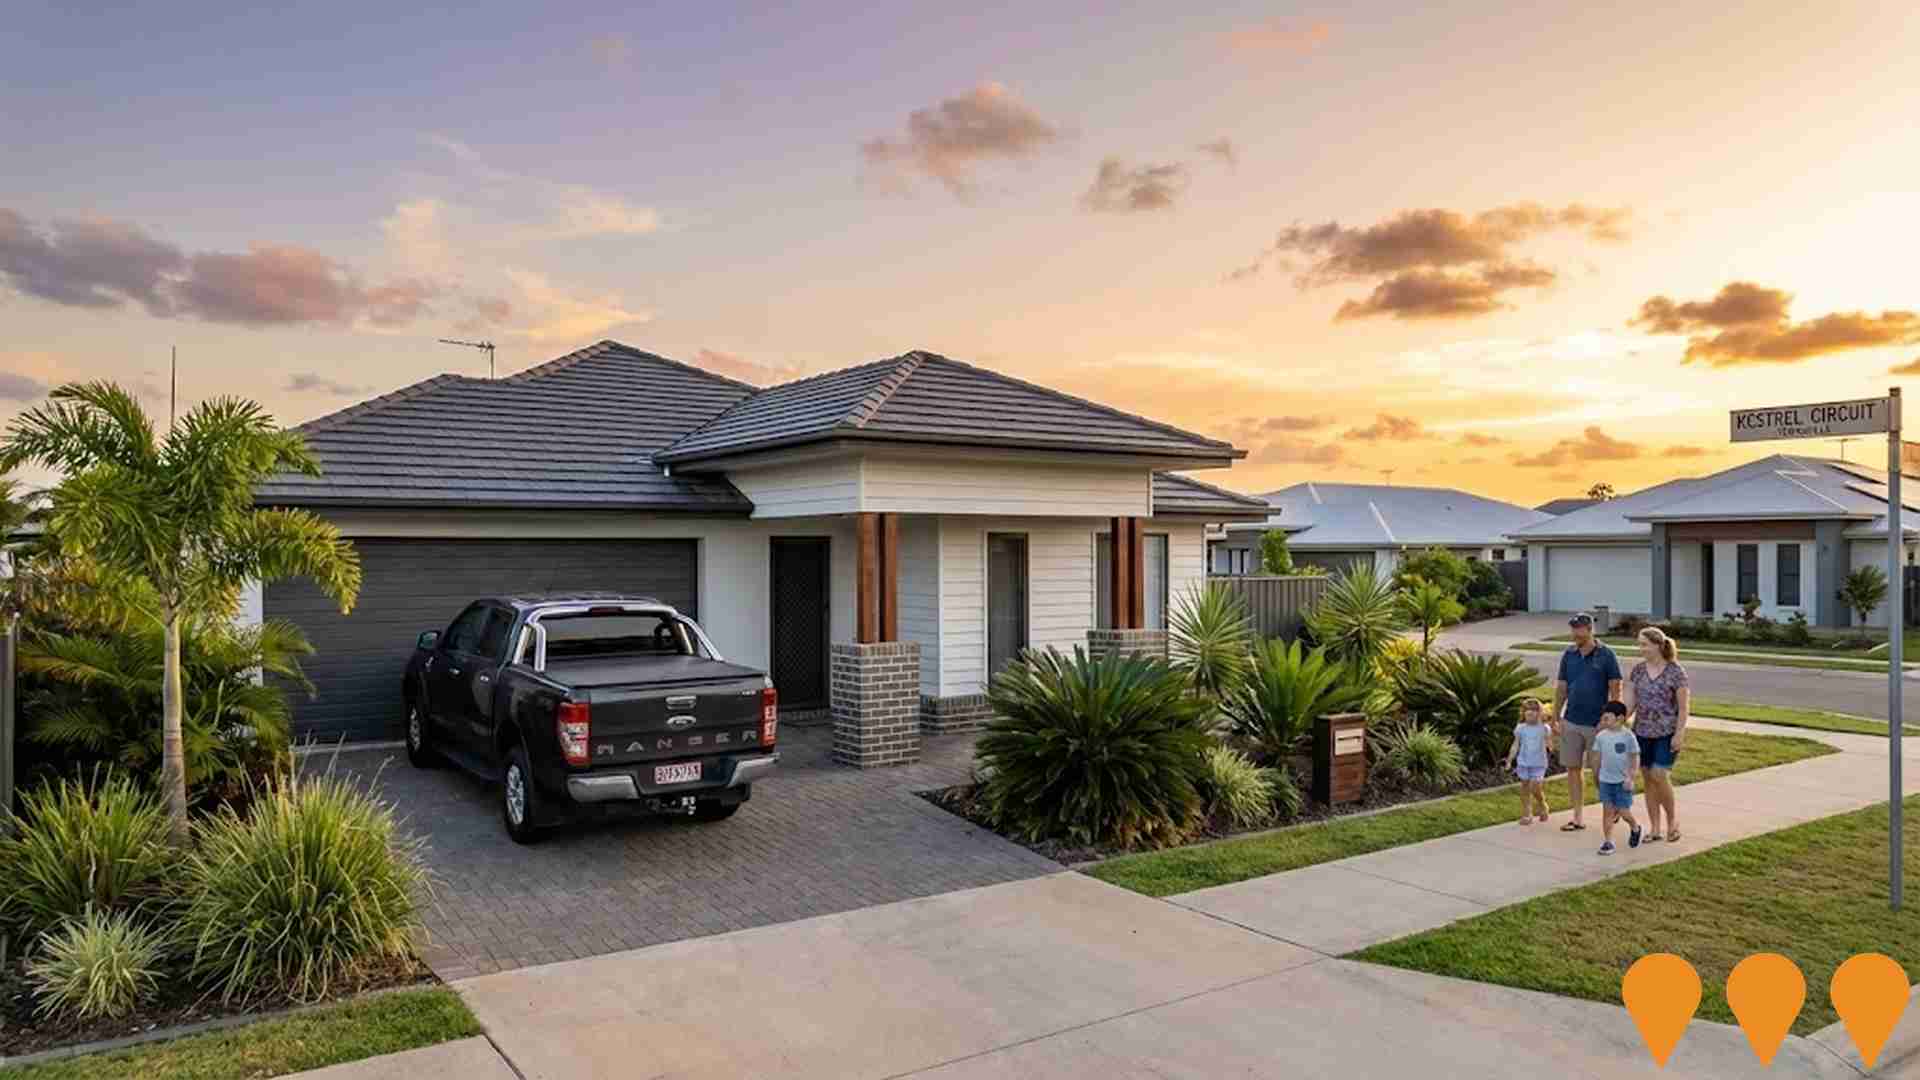
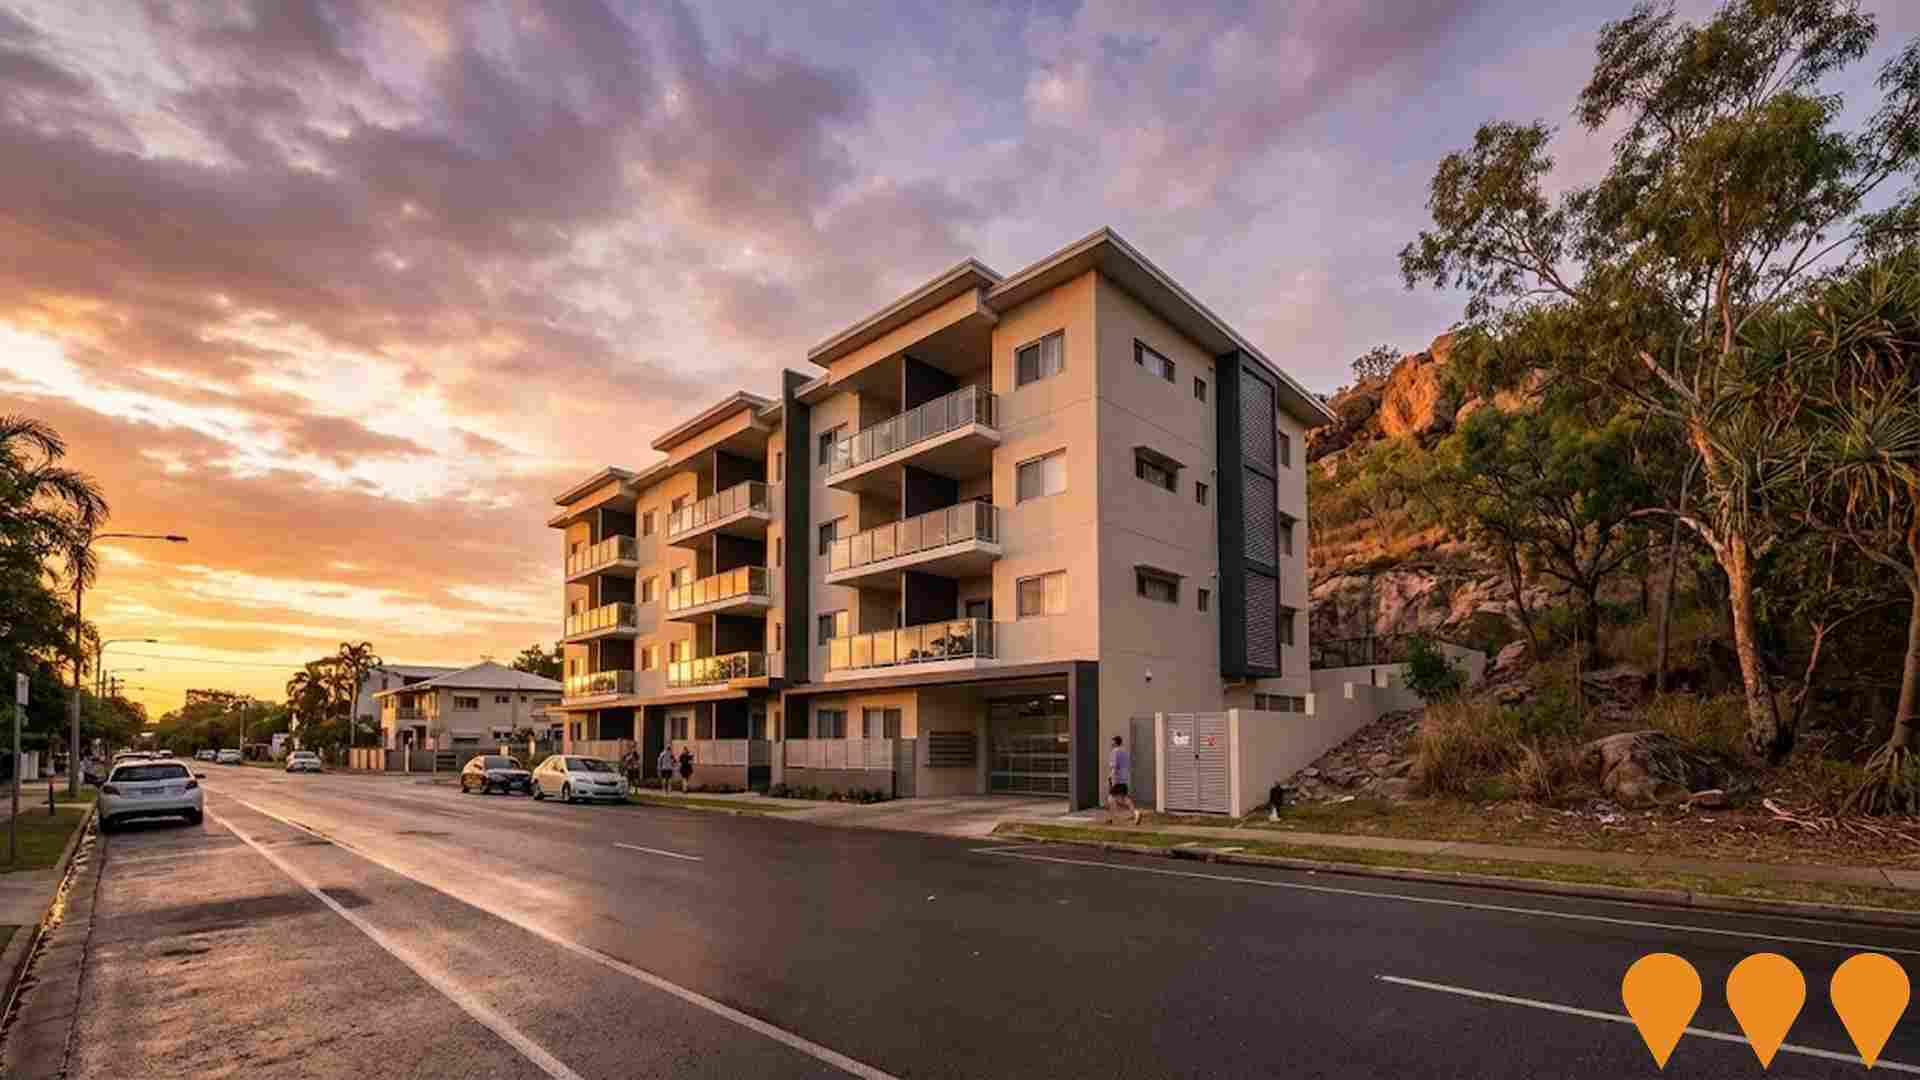
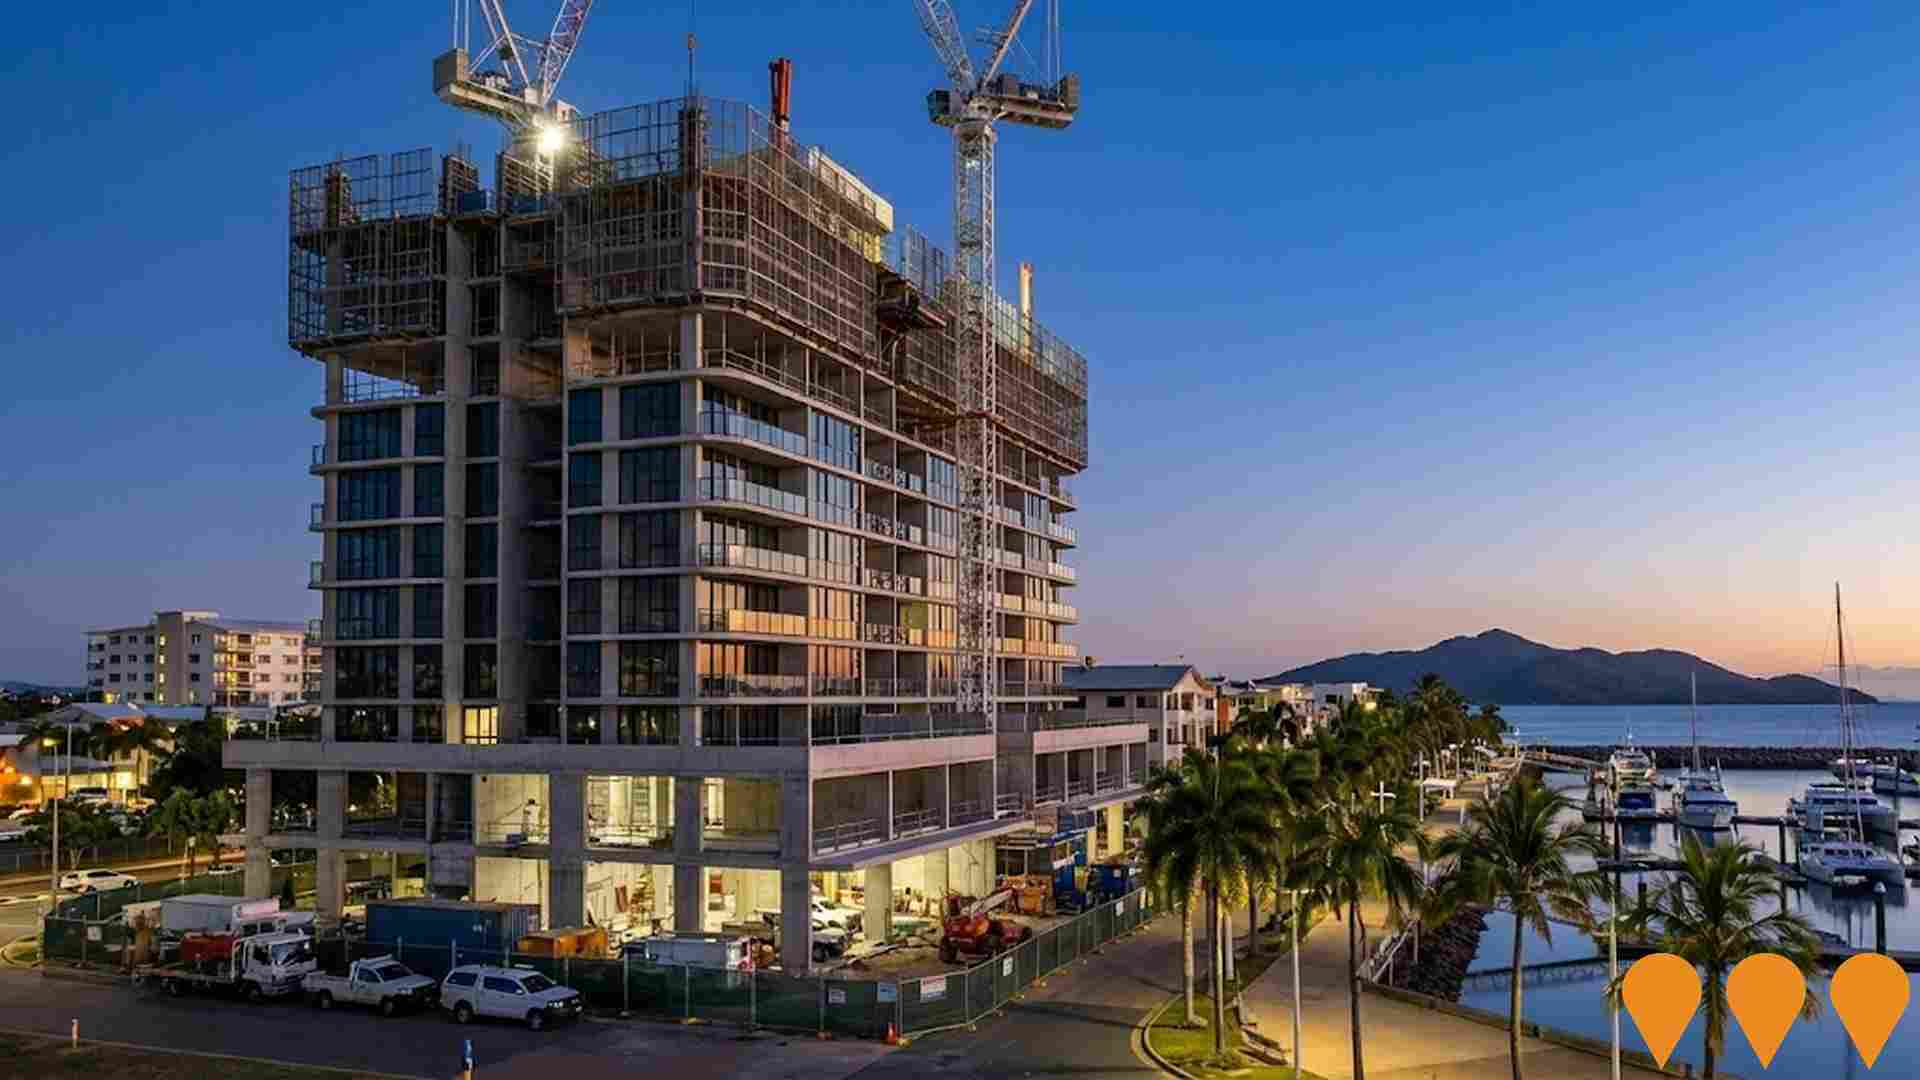
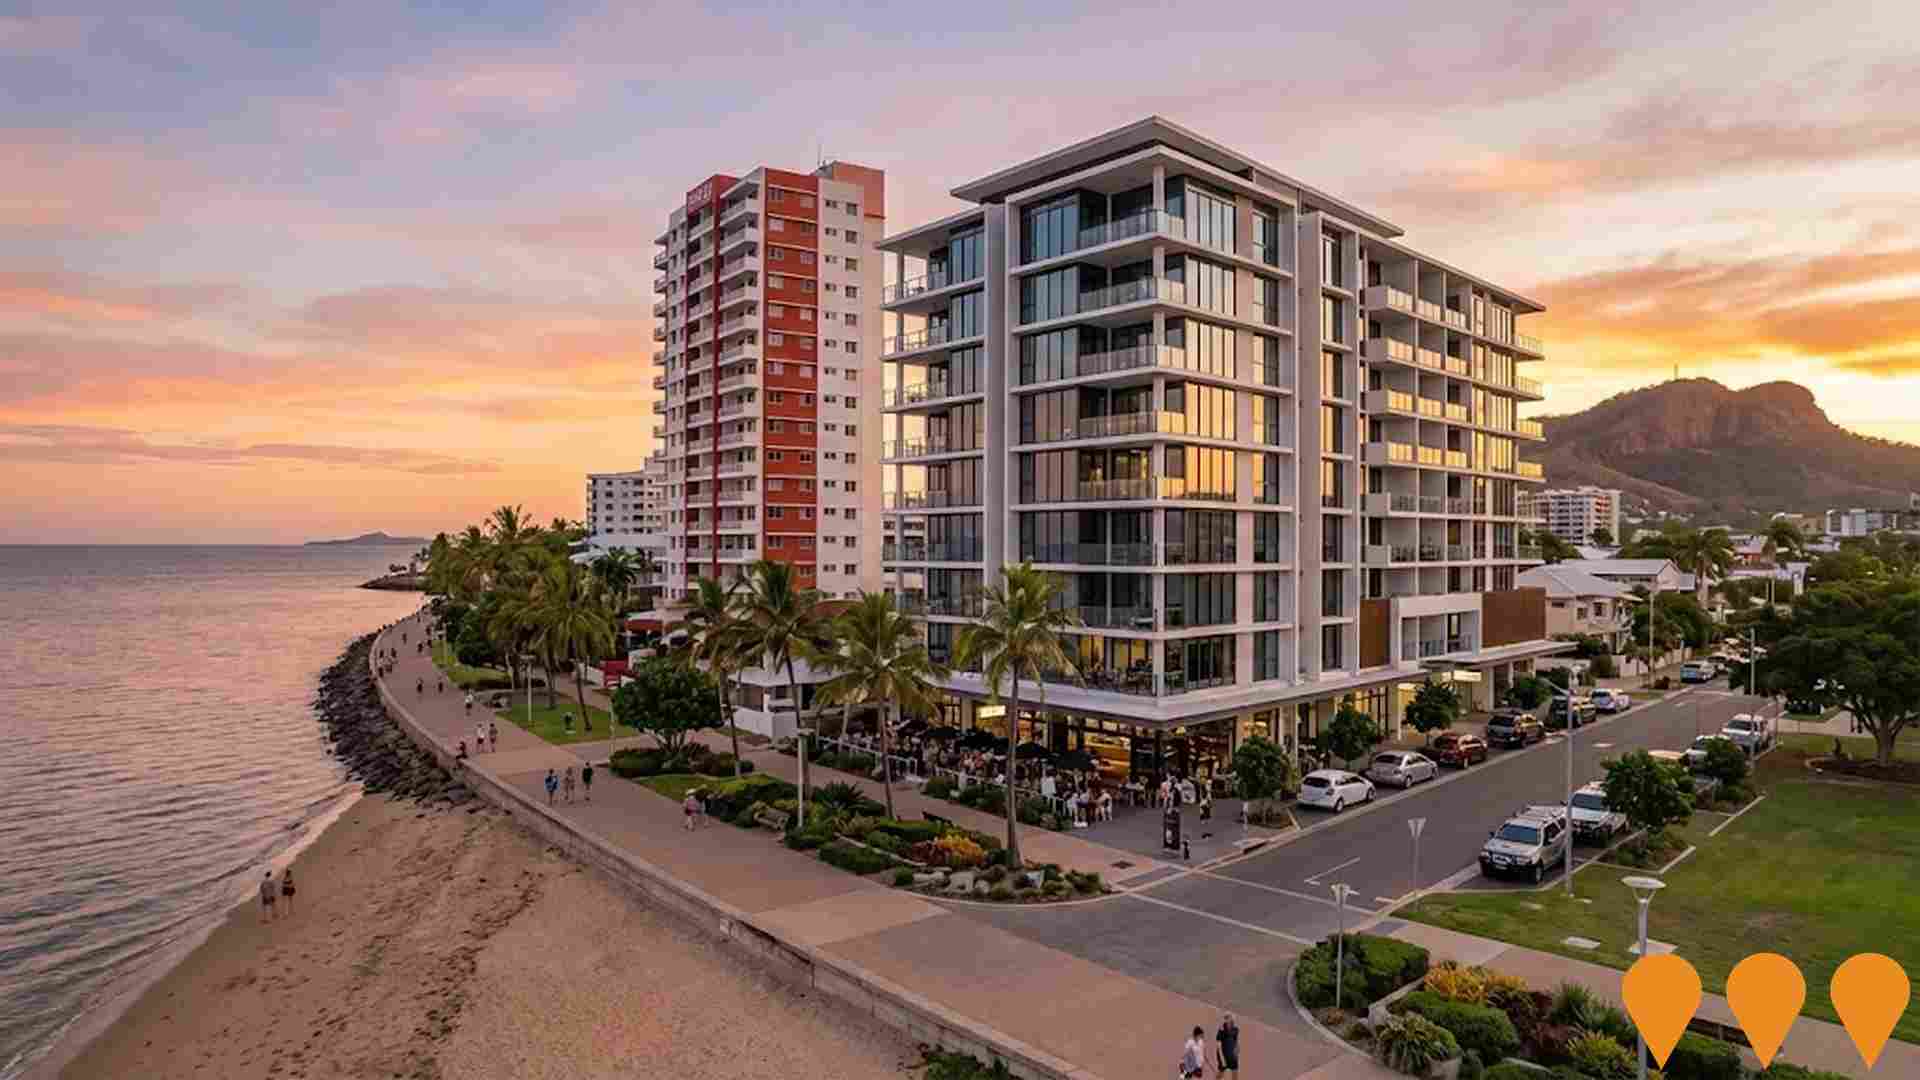
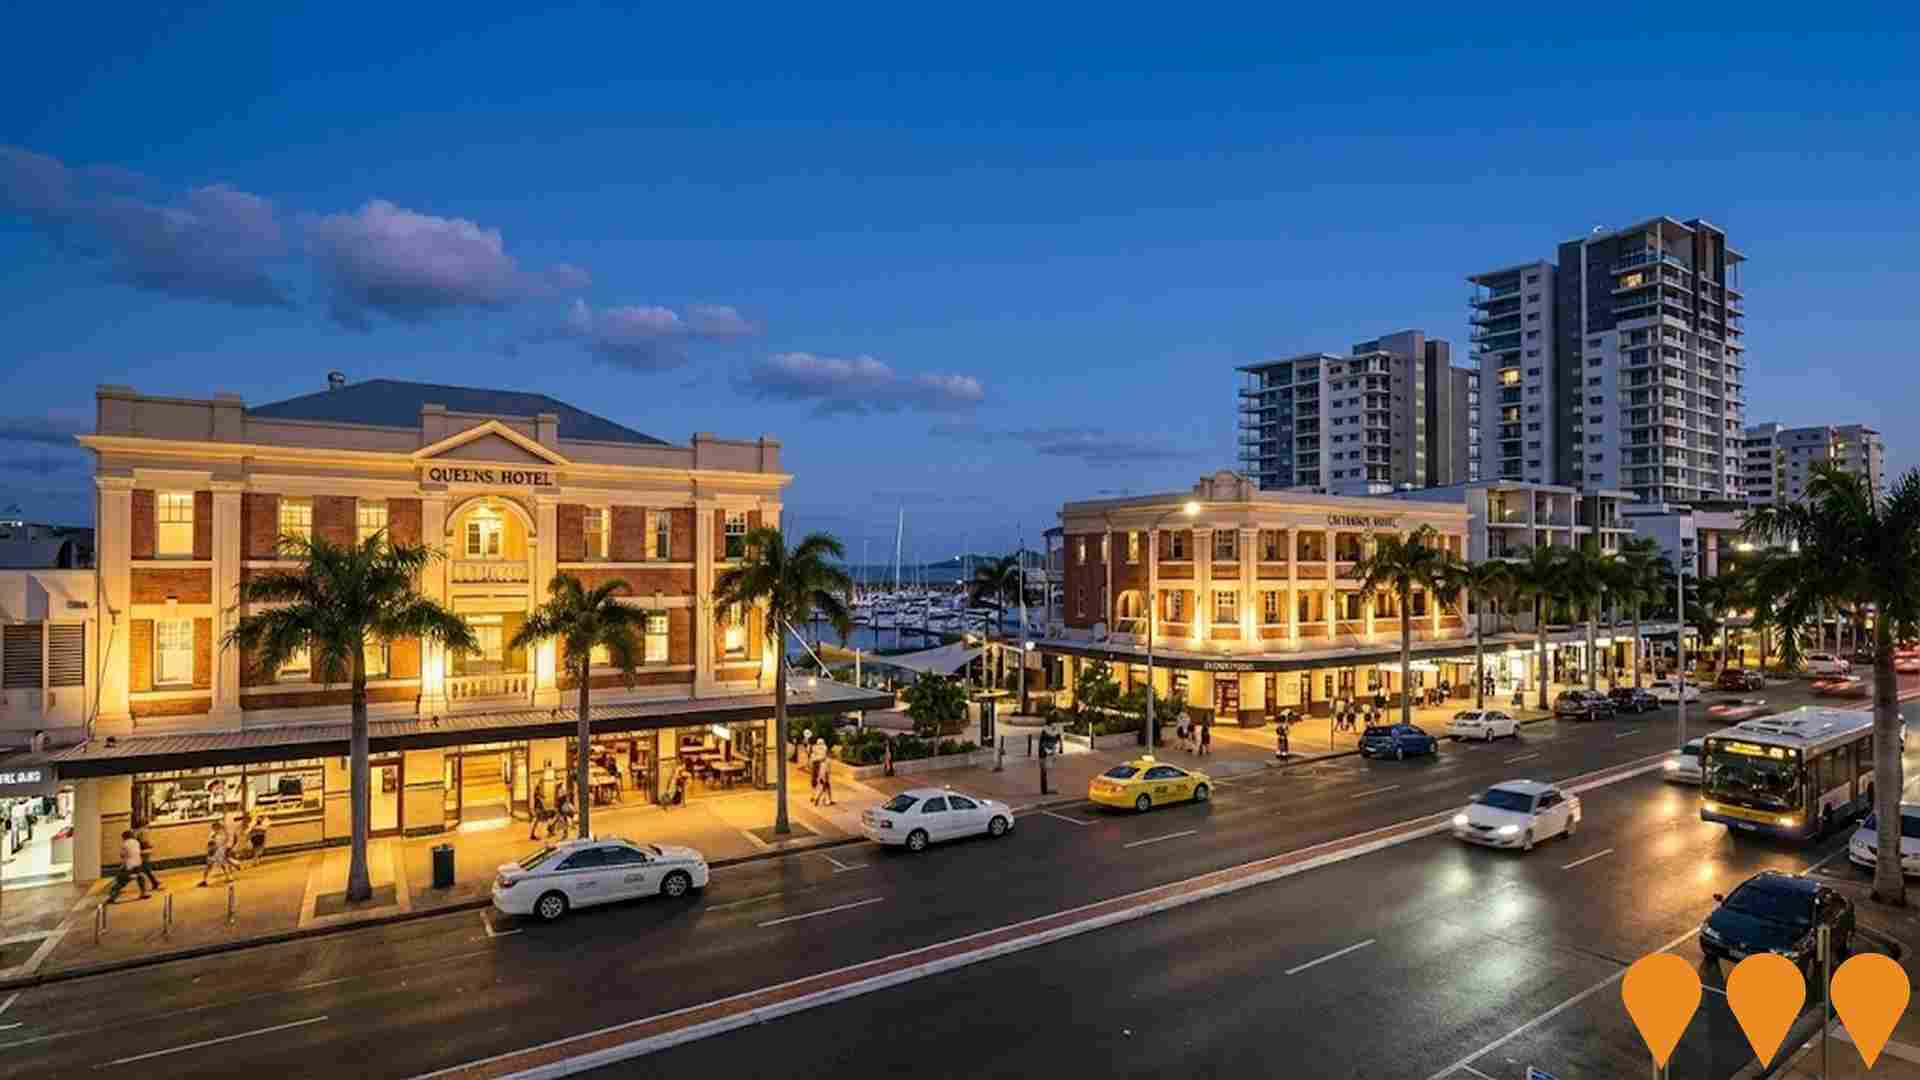
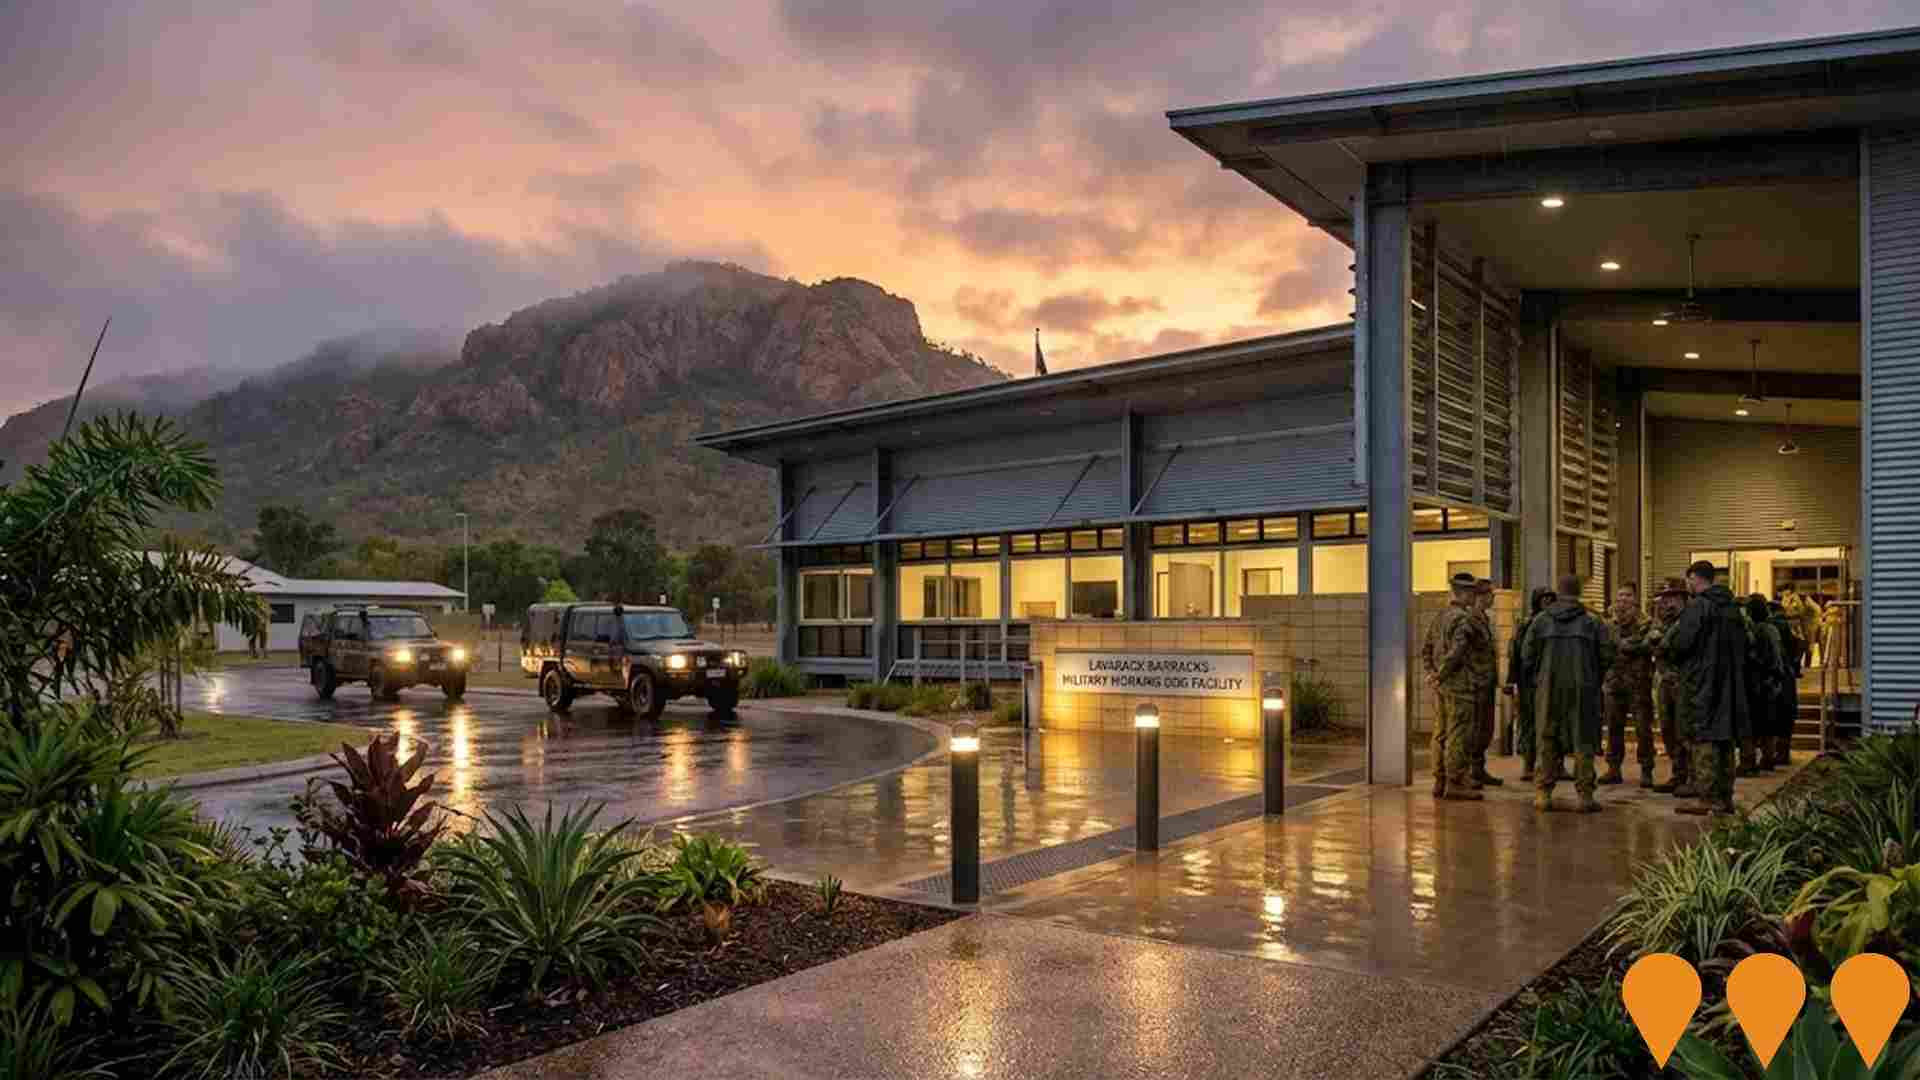
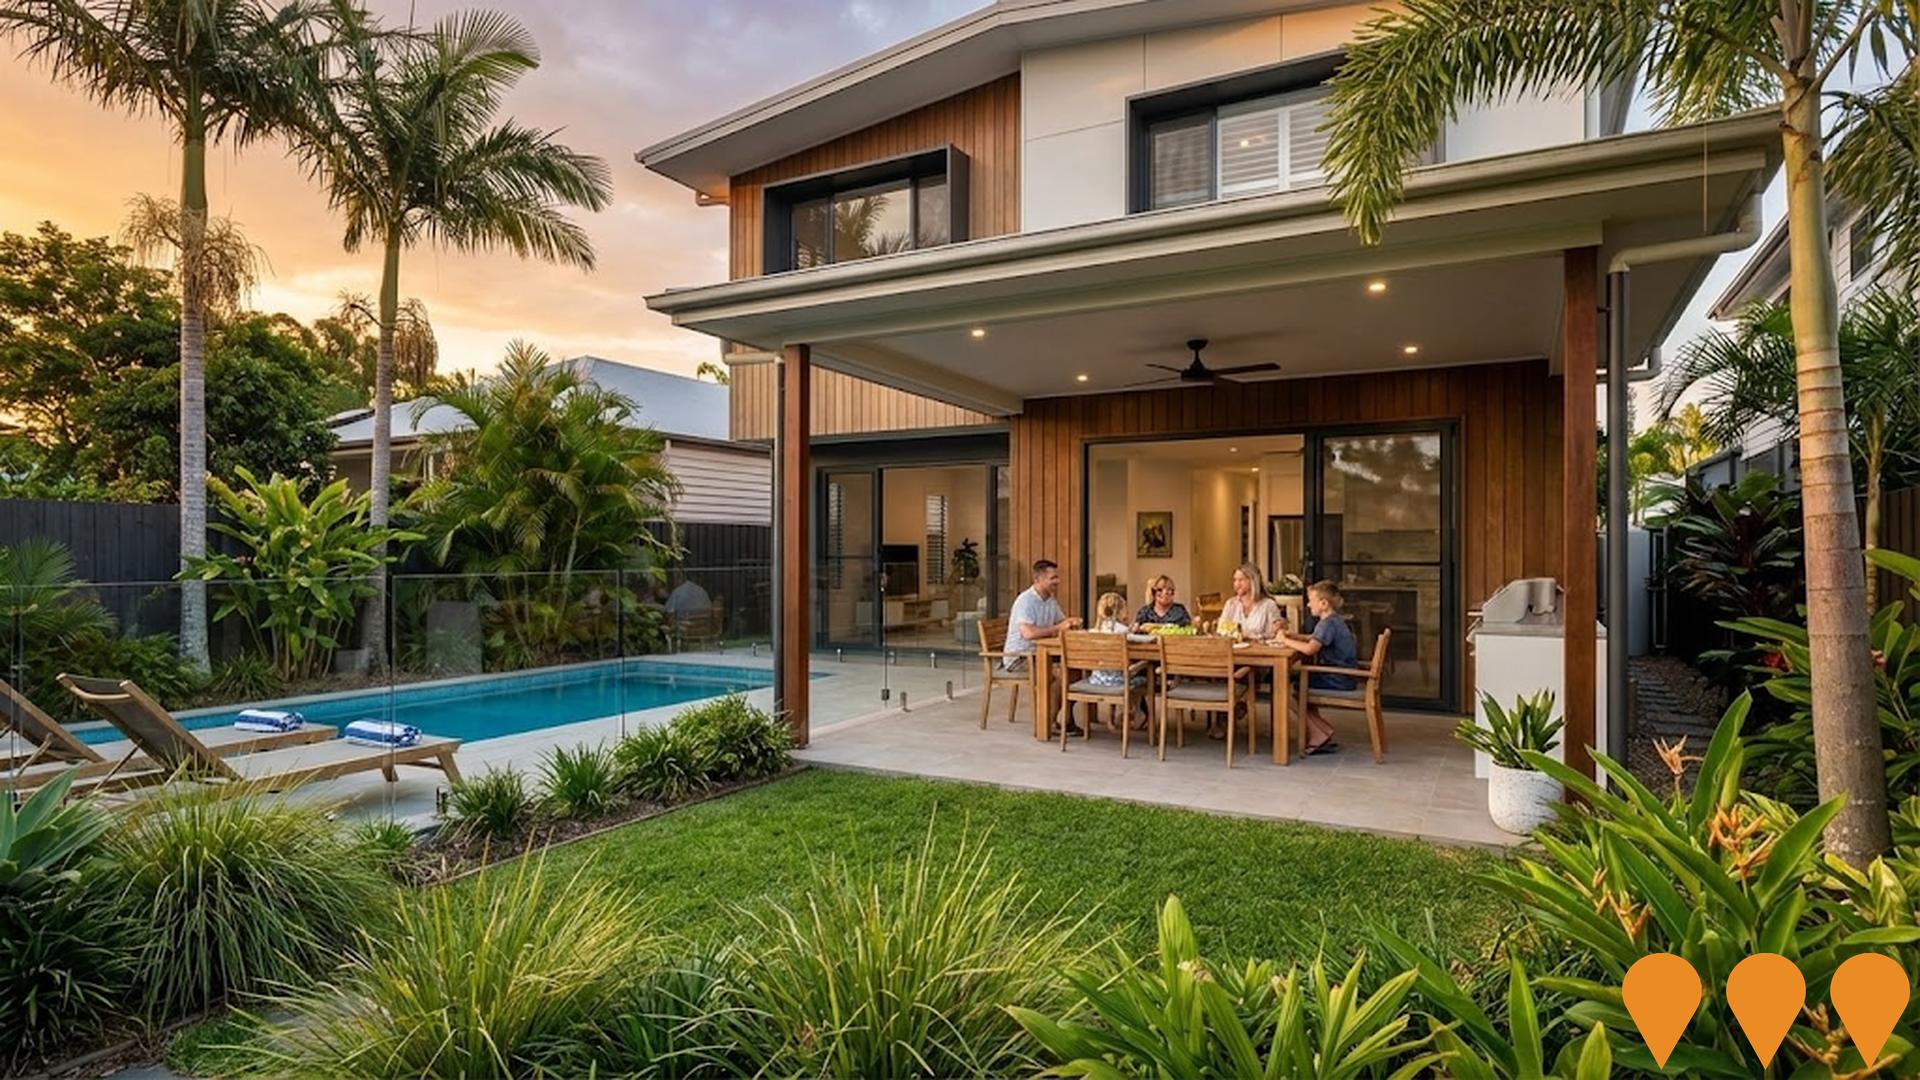
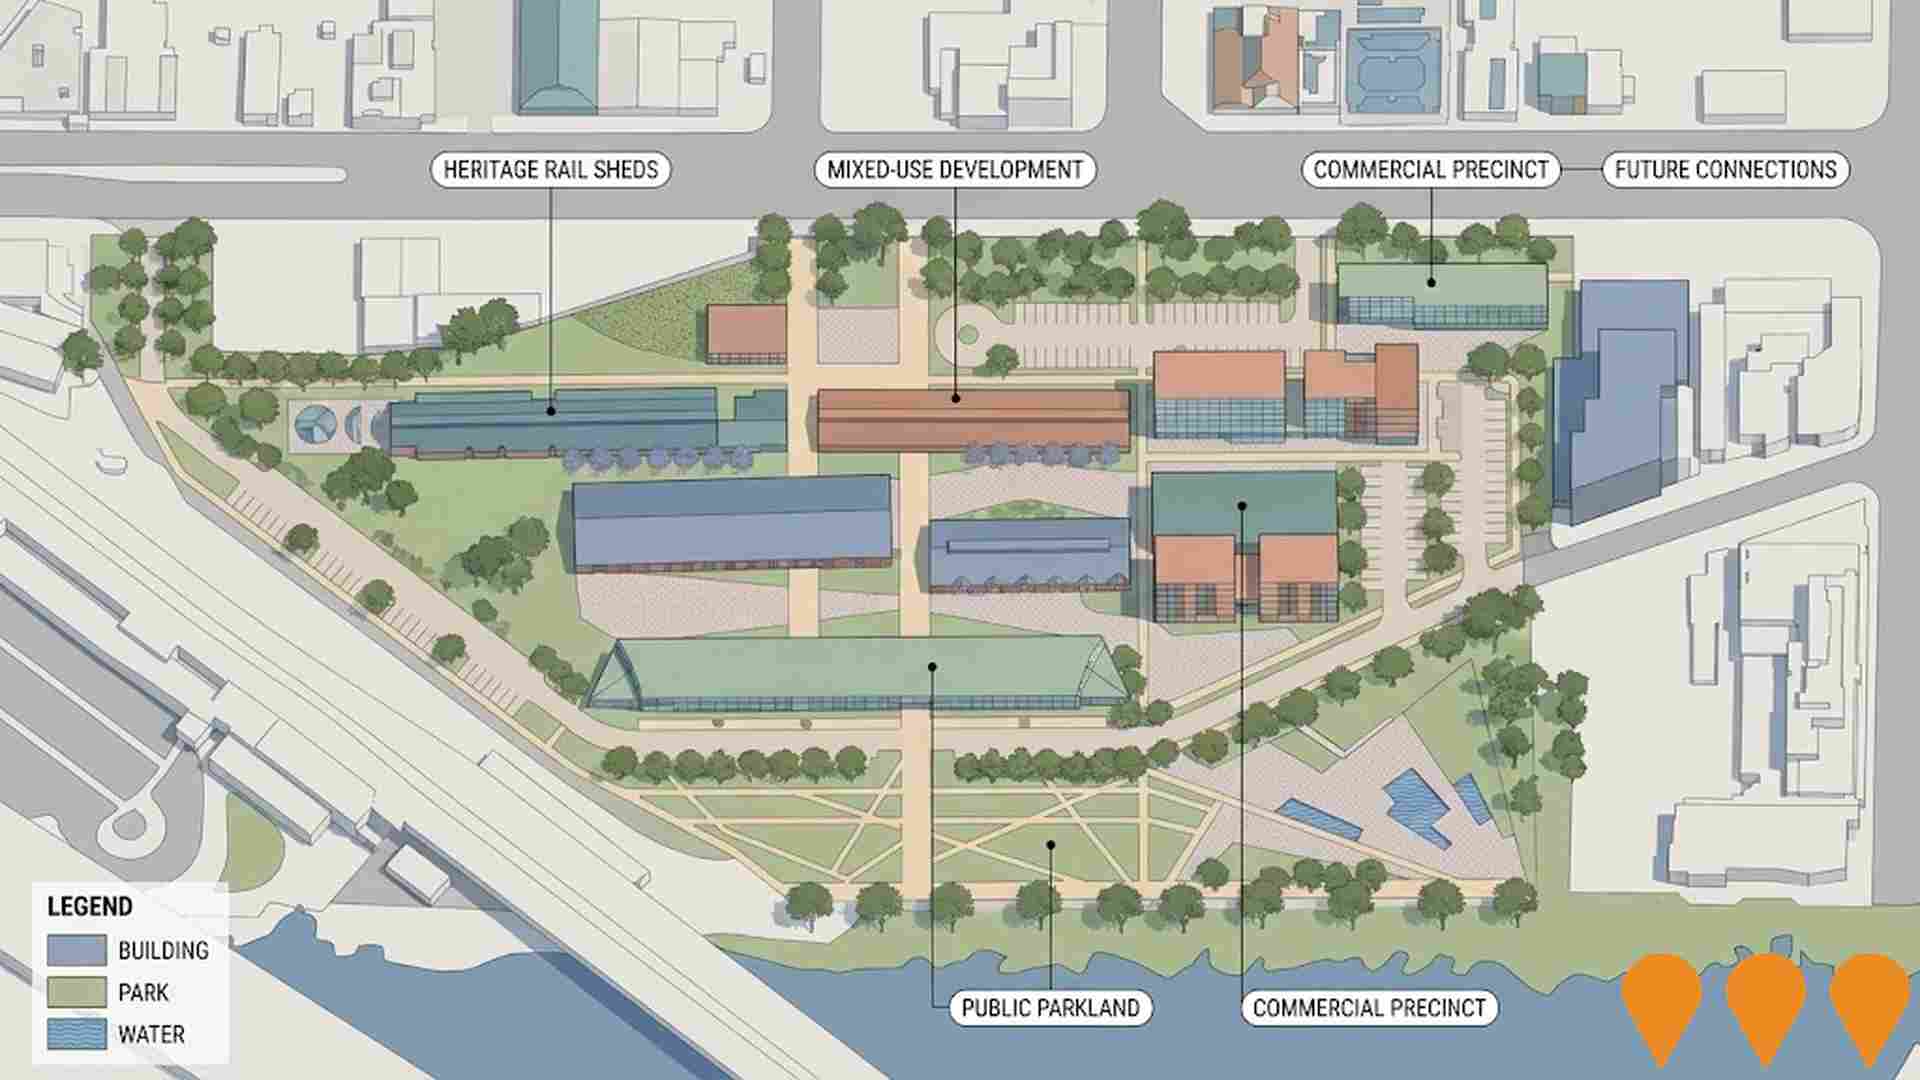
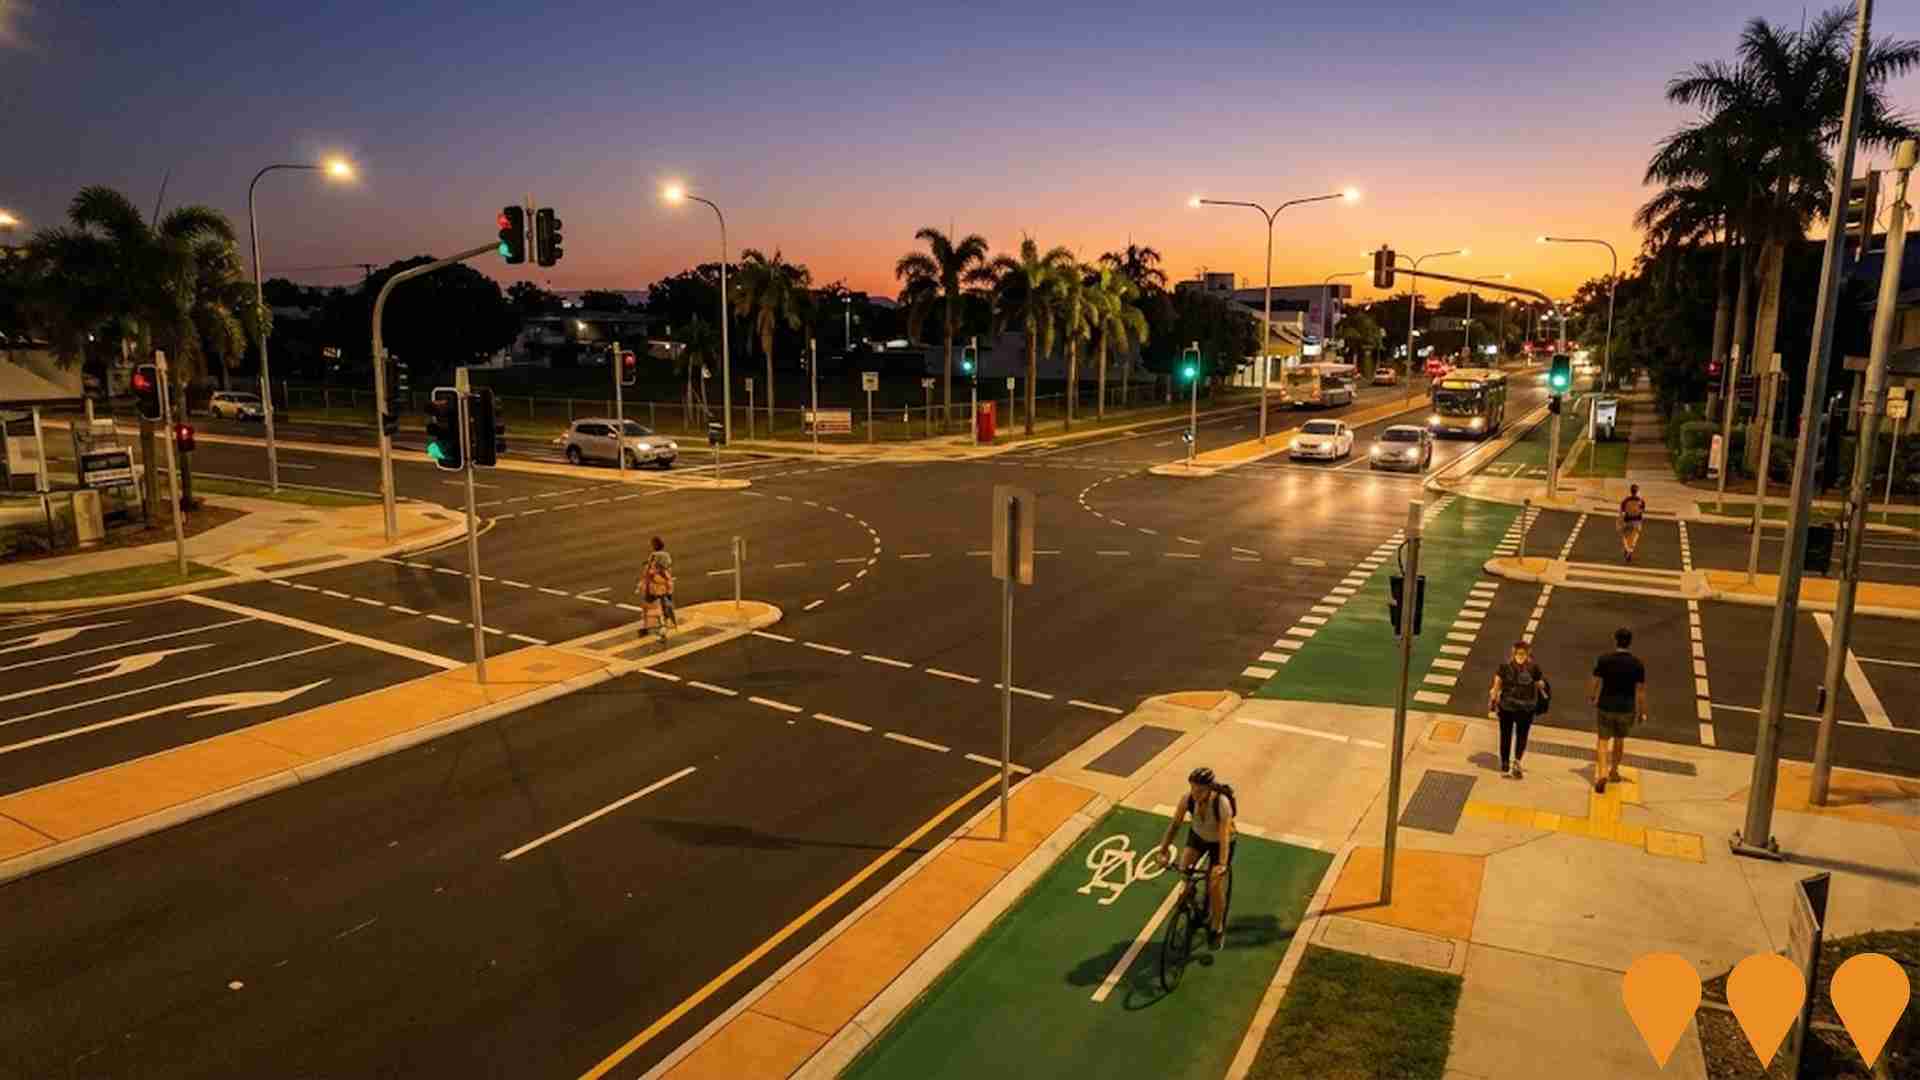
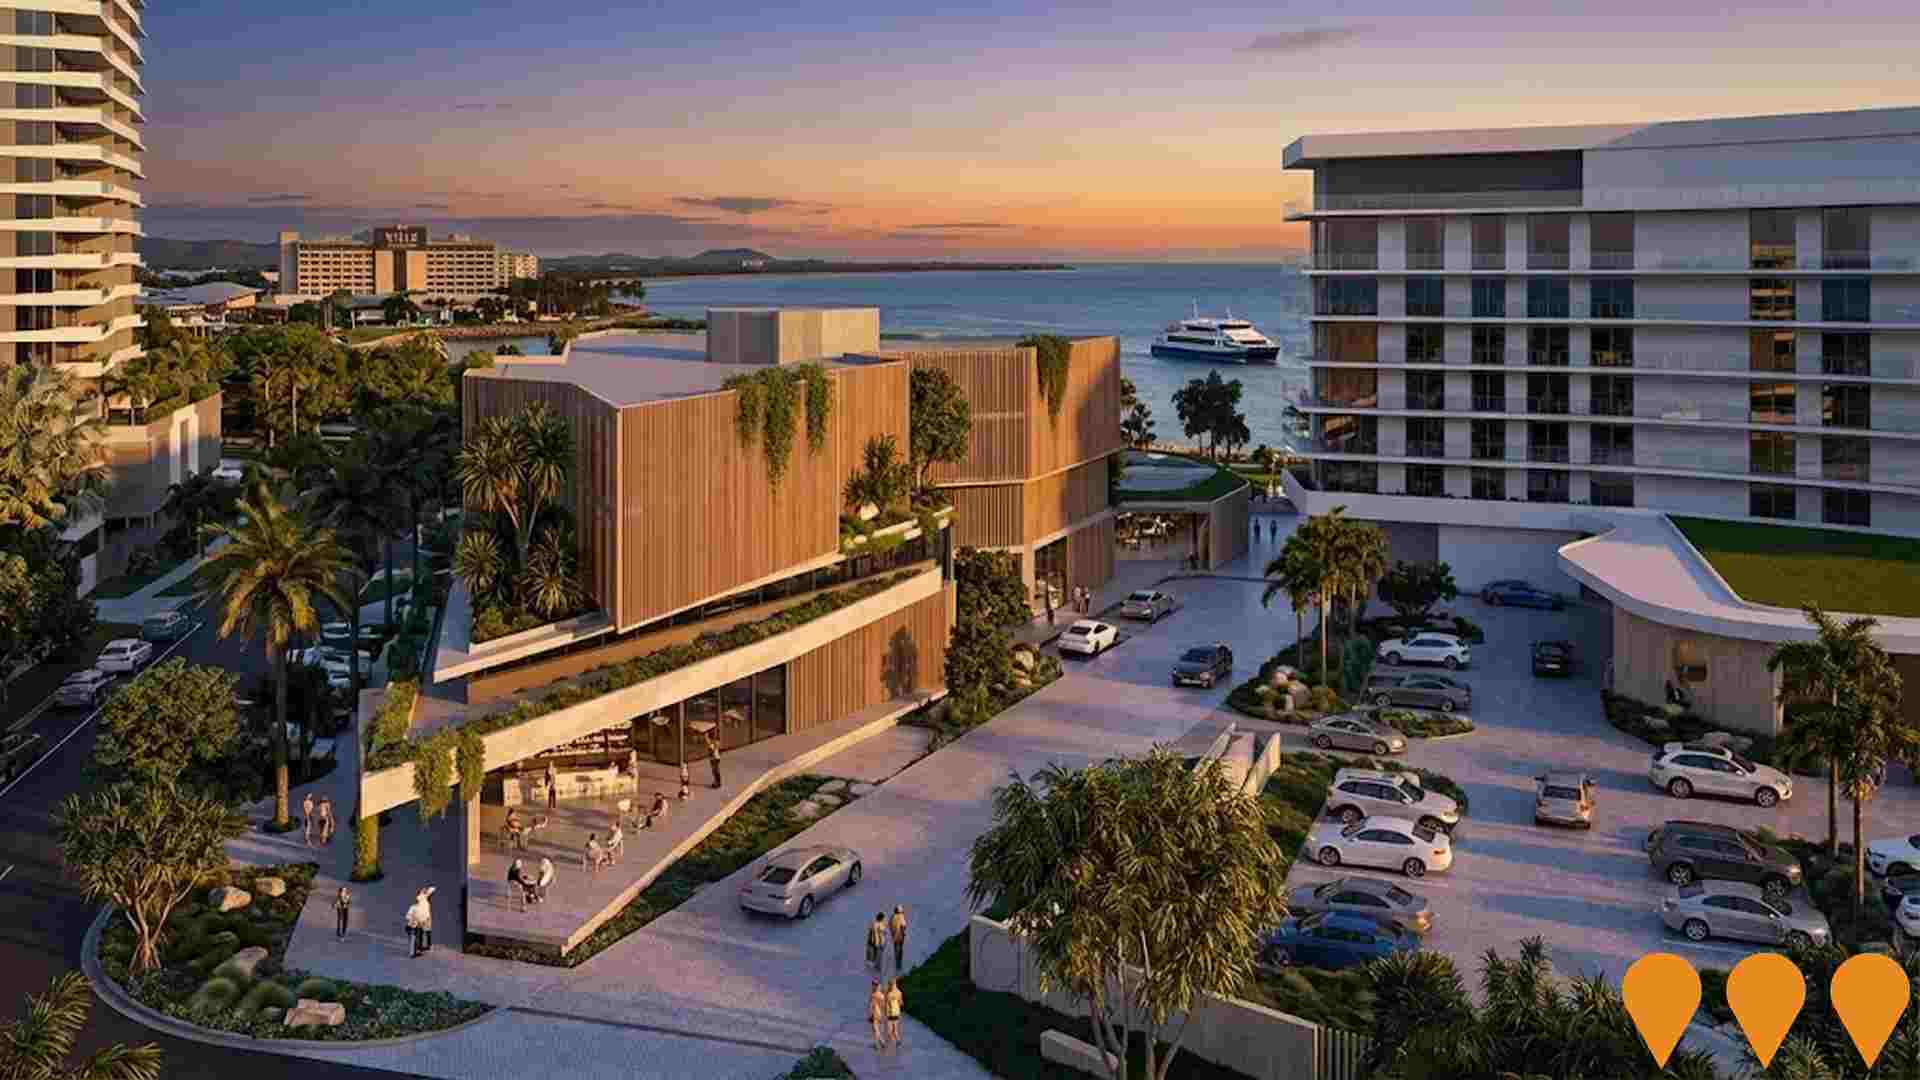
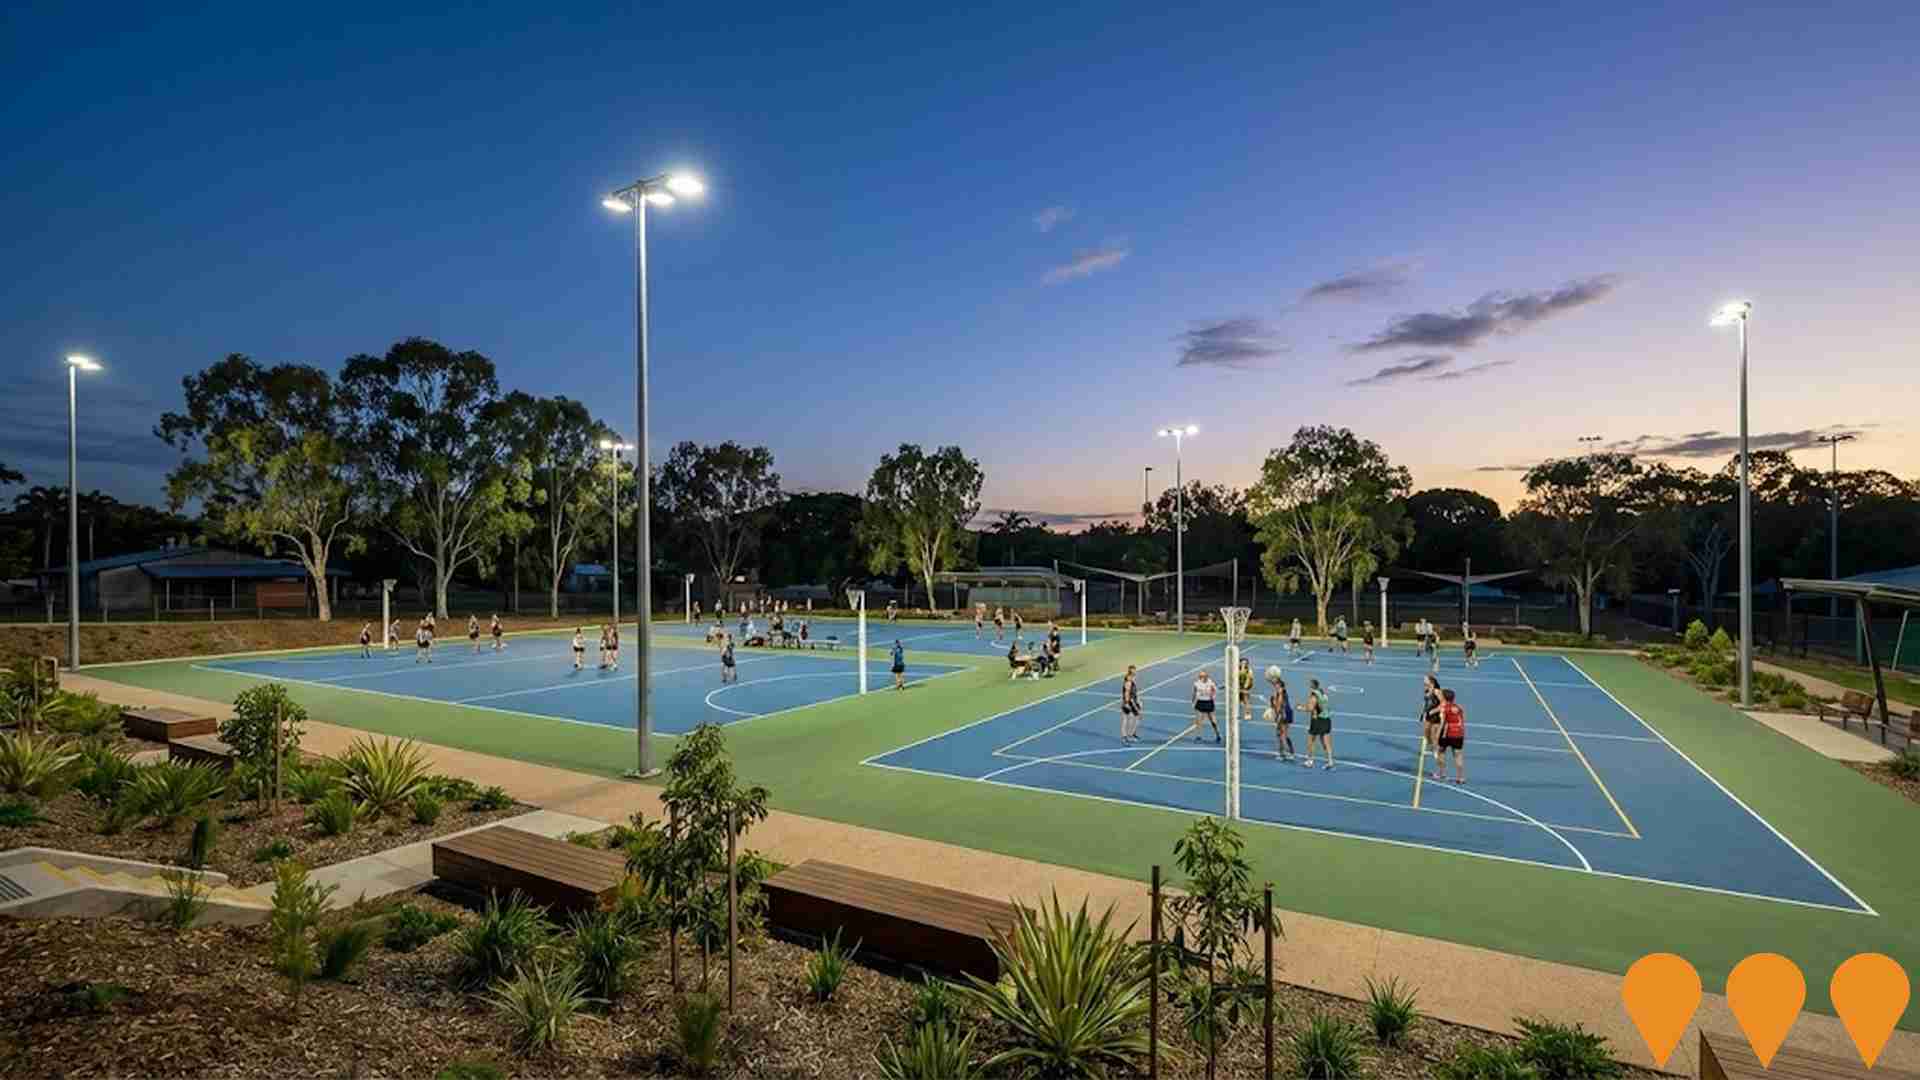
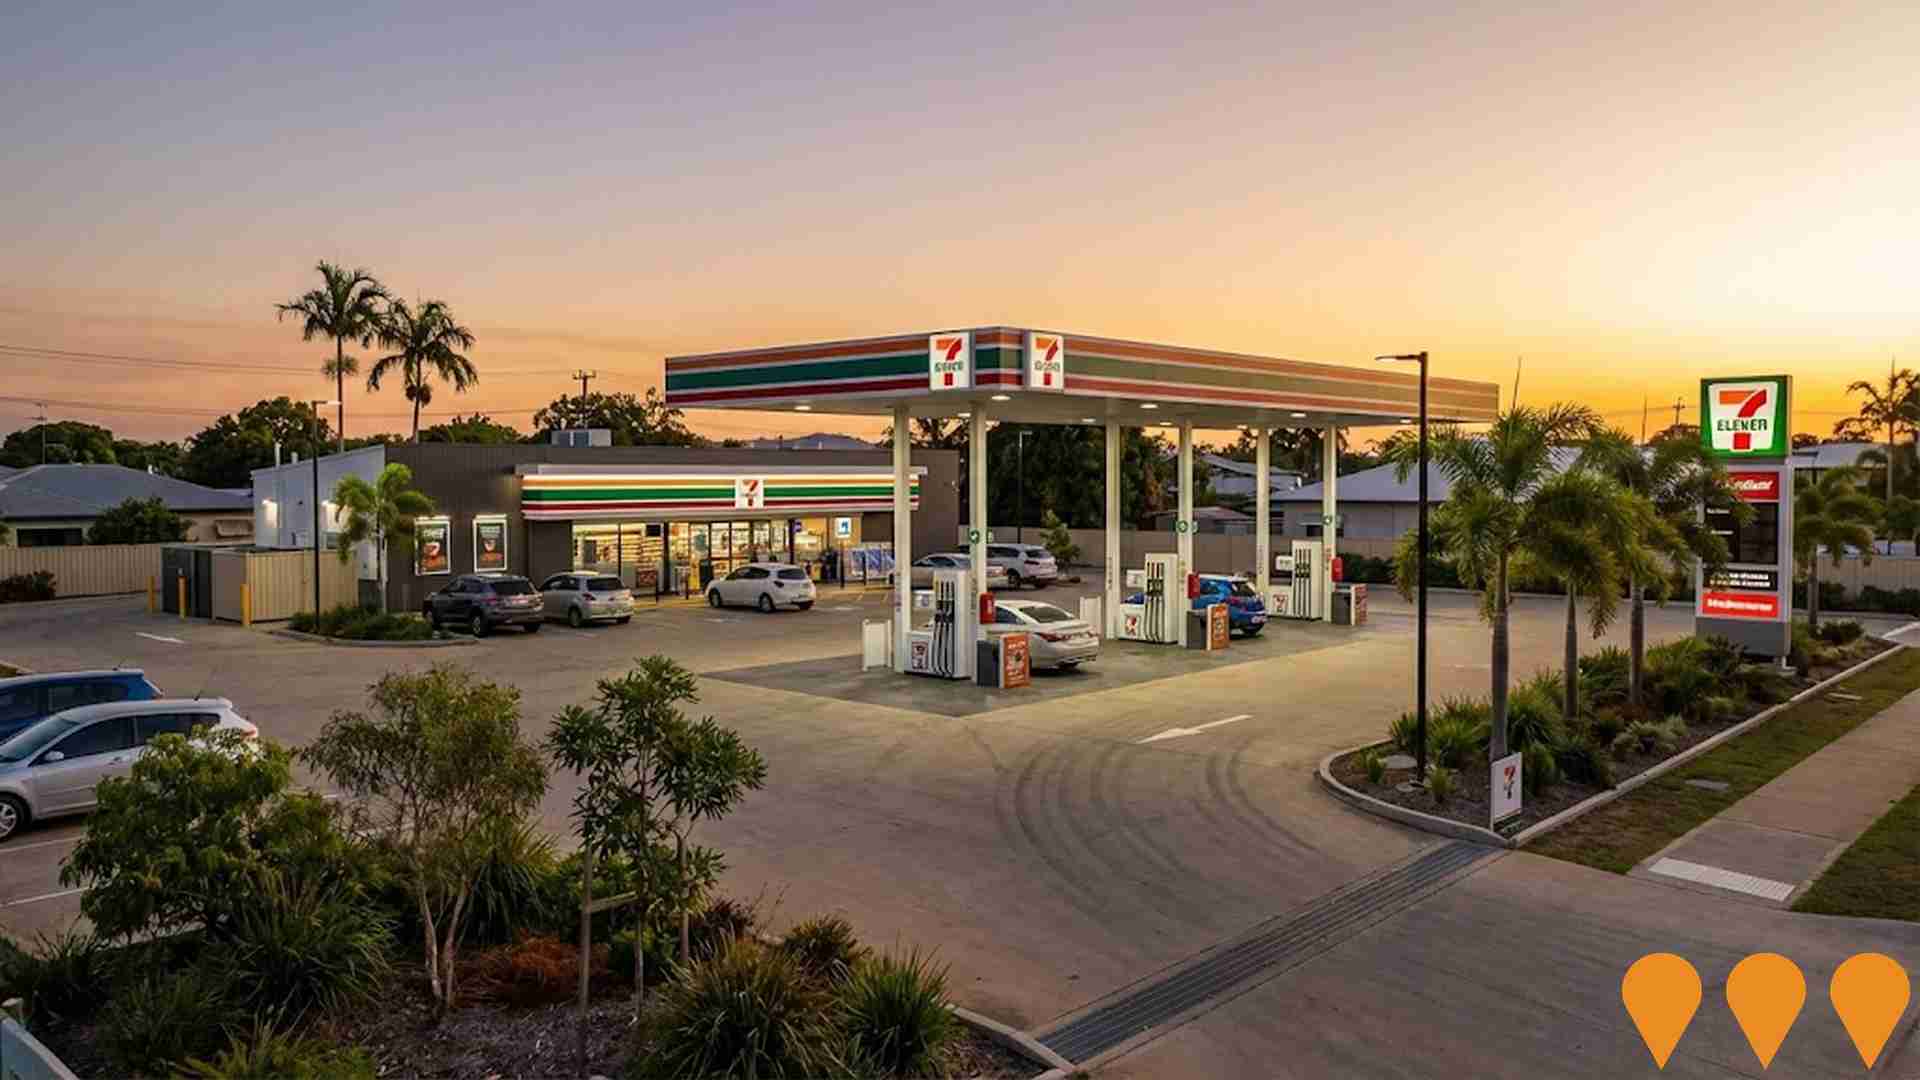
 Denotes AI-based impression for illustrative purposes only, not to be taken as definitive under any circumstances. Please follow links and conduct other investigations from the project's source for actual imagery. Developers and project owners wishing us to use original imagery please Contact Us and we will do so.
Frequently Asked Questions - Infrastructure
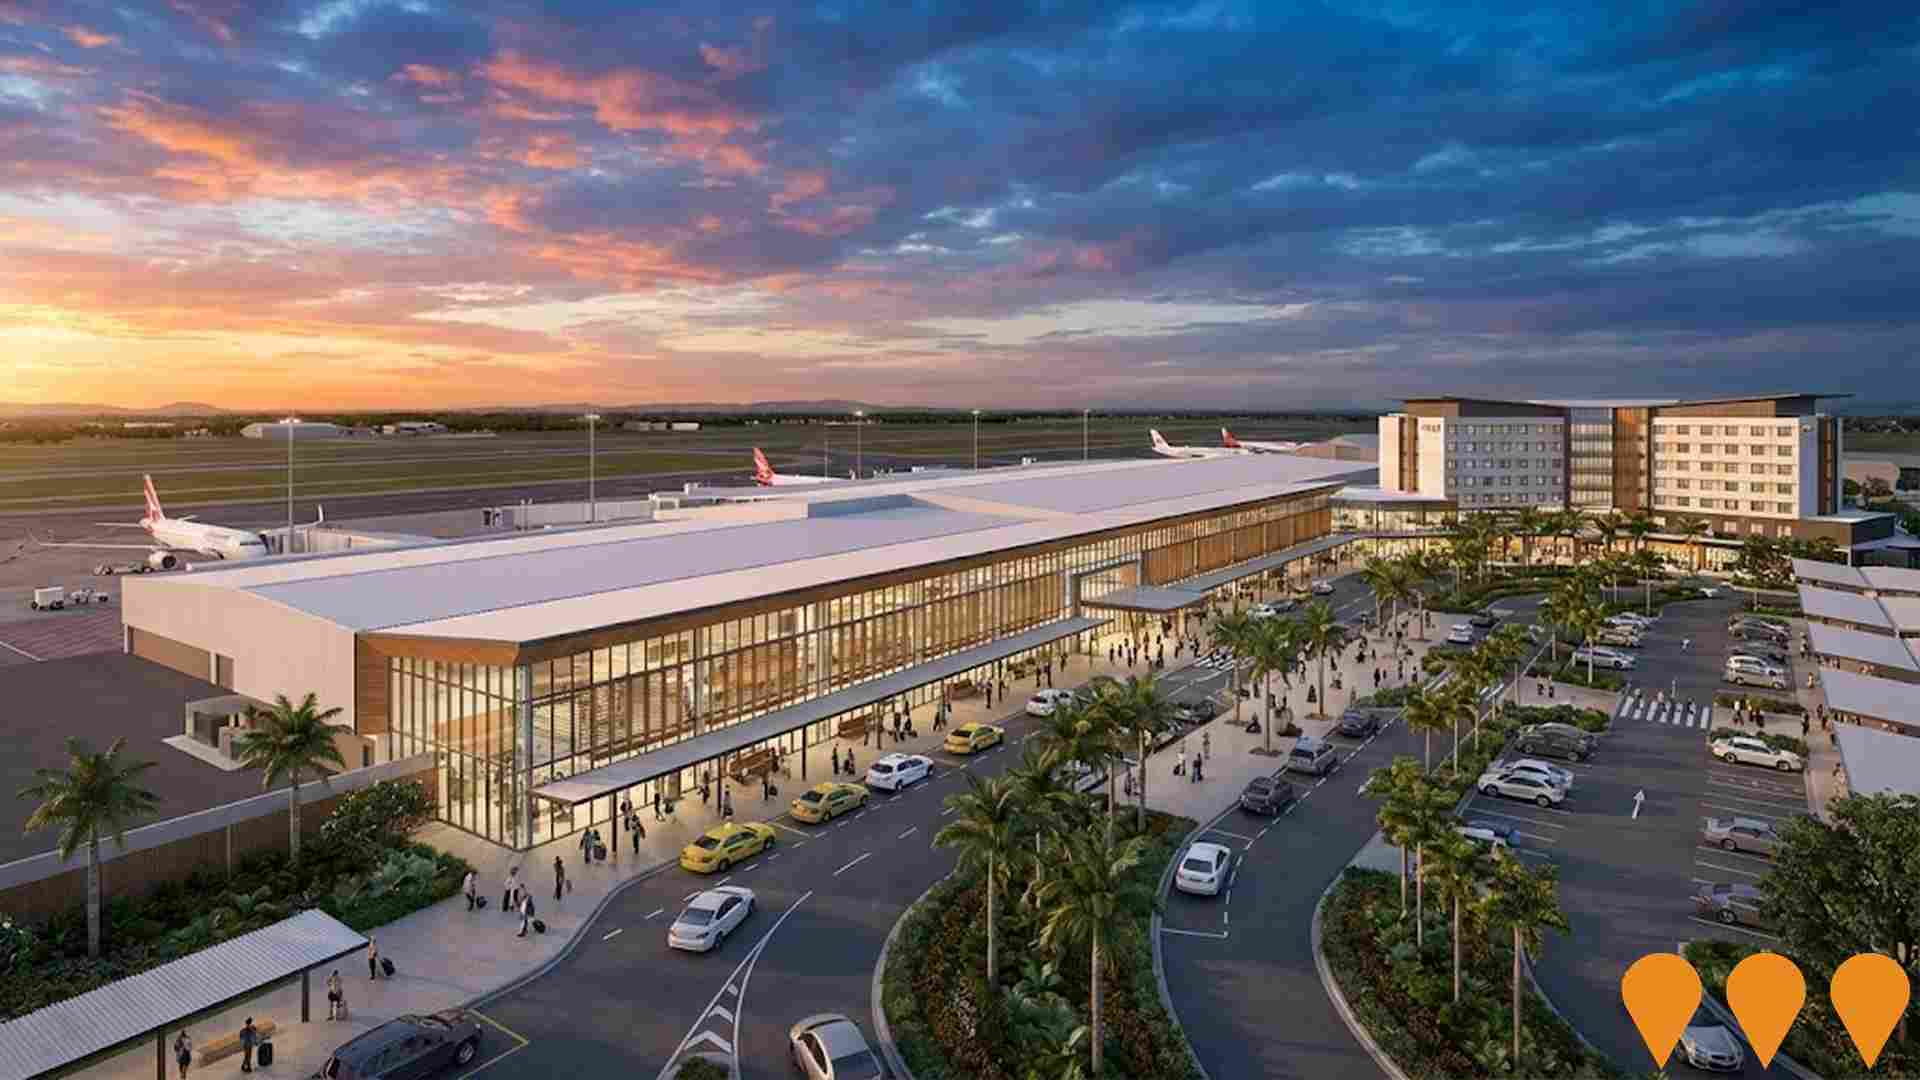
Army Aviation Program of Works - RAAF Base Townsville
A AUD 700 million Defence infrastructure upgrade at RAAF Base Townsville and the Townsville Field Training Area to support the Australian Army AH-64E Apache fleet and expanded aviation operations. Works include new and refurbished aircraft hangars, command and working accommodation, training facilities, simulator facilities, maintenance and refuelling infrastructure, explosive ordnance areas, airfield upgrades and multi-storey car parking. The program supports relocation of 1st Aviation Regiment from Darwin and 16th Aviation Brigade Headquarters from Brisbane. Construction is underway, CPB Contractors is the managing contractor, and works are expected to be completed by 2028.

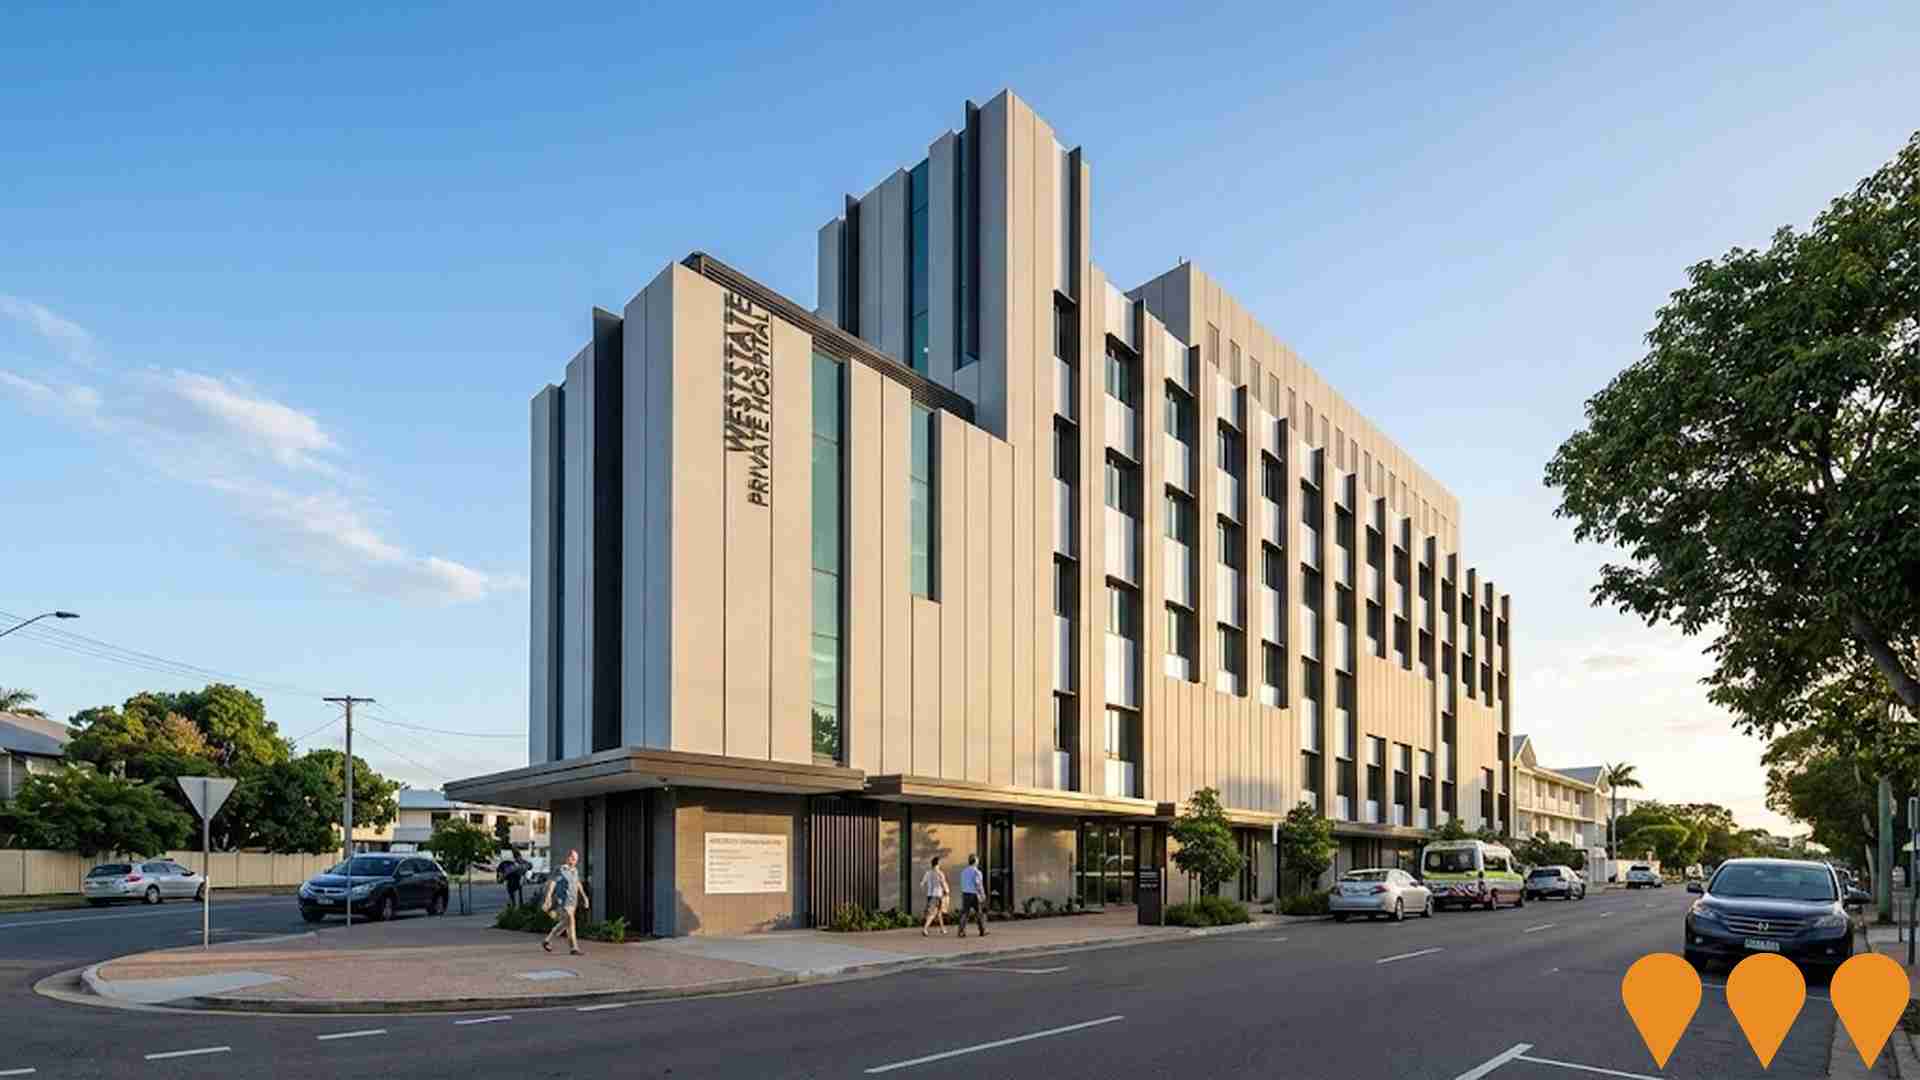
Weststate Private Hospital
A $60 million short-stay private hospital development transforming the heritage-listed former Townsville West State School into specialist consulting suites, with a new five-storey purpose-built hospital next door. The project includes four operating theatres, one procedure room, a HDU/ICU, 19 day beds, 26 overnight rooms, consulting rooms, cafe and 24/7 kitchen. Official project sources indicate construction has commenced and Centuria schedules completion for 2026.
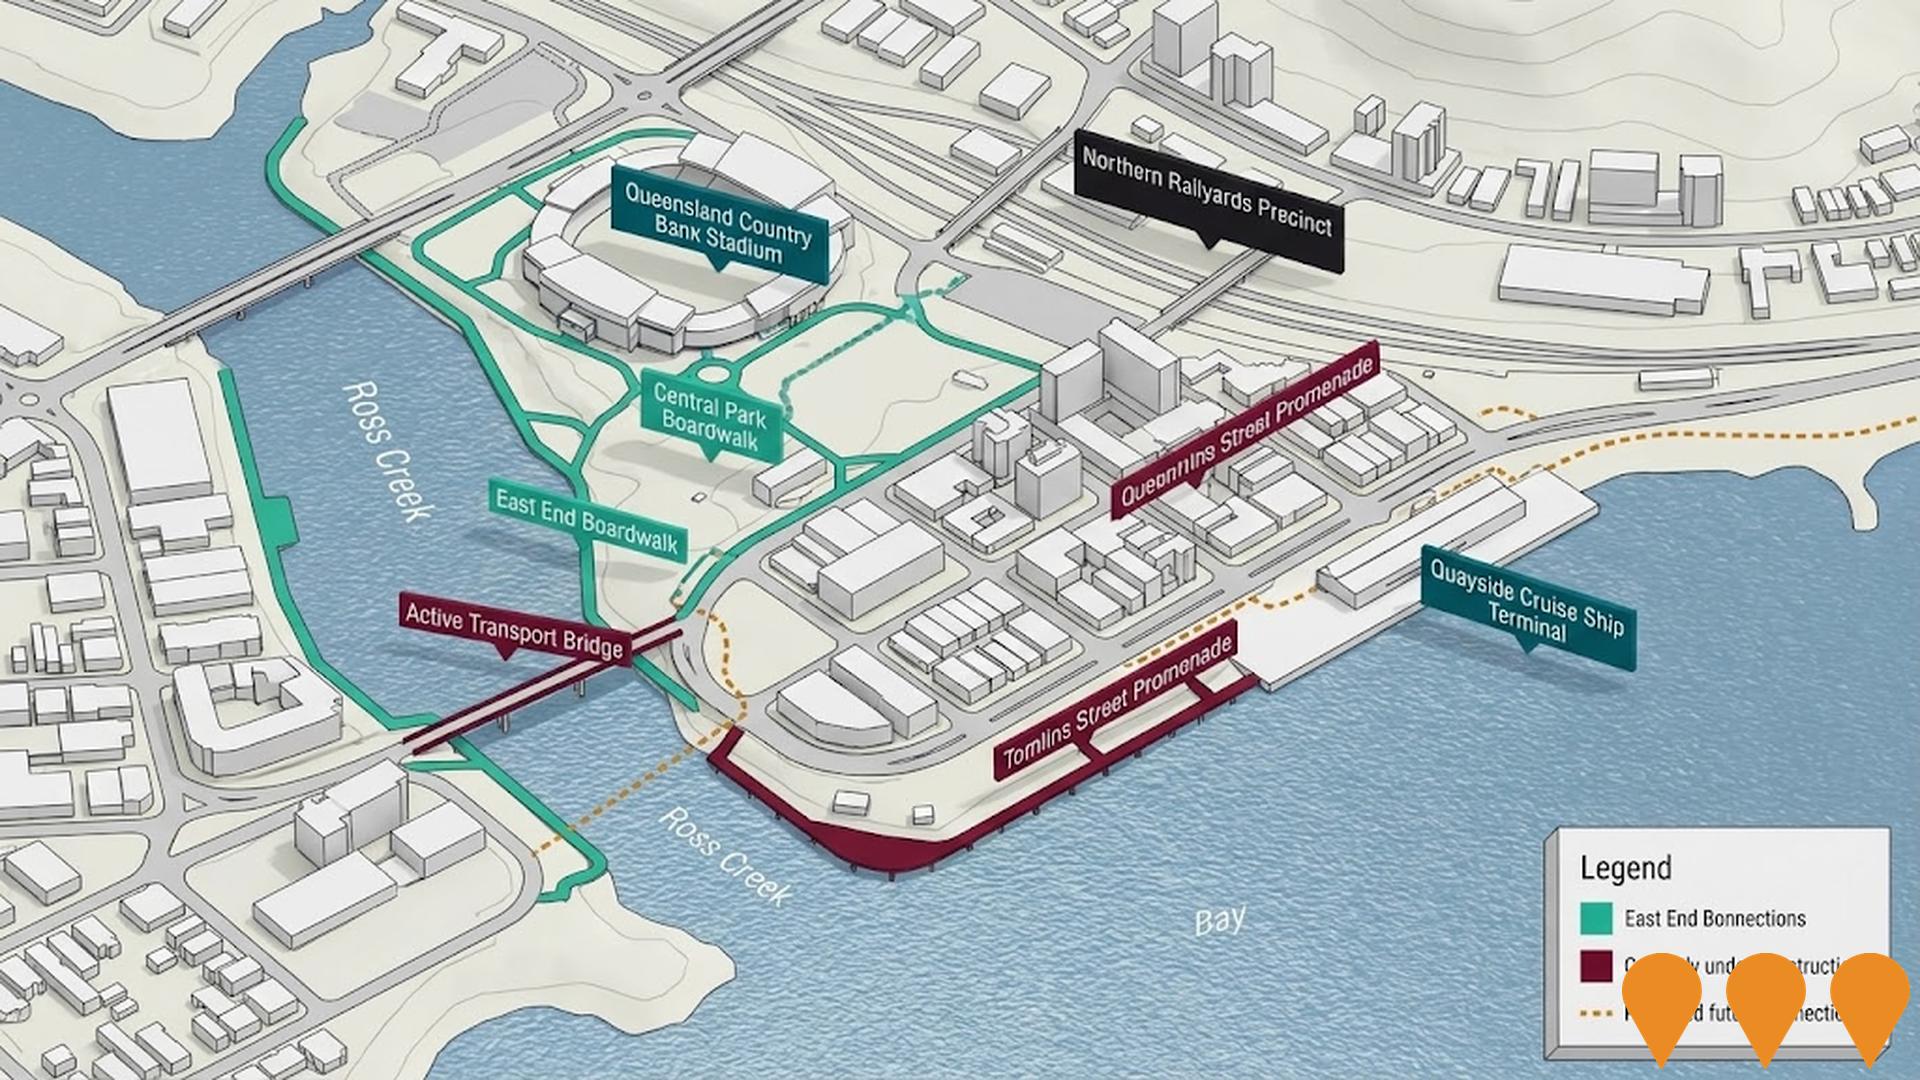
Francis Street Roadworks, West End
Townsville City Council is delivering roadworks on Francis Street between Henry Street and Leigh Street, West End. Works form part of Council's annual roadworks program and include removing and replacing the kerb and channel, upgrading identified driveway crossovers, and renewing sections of concrete medians.
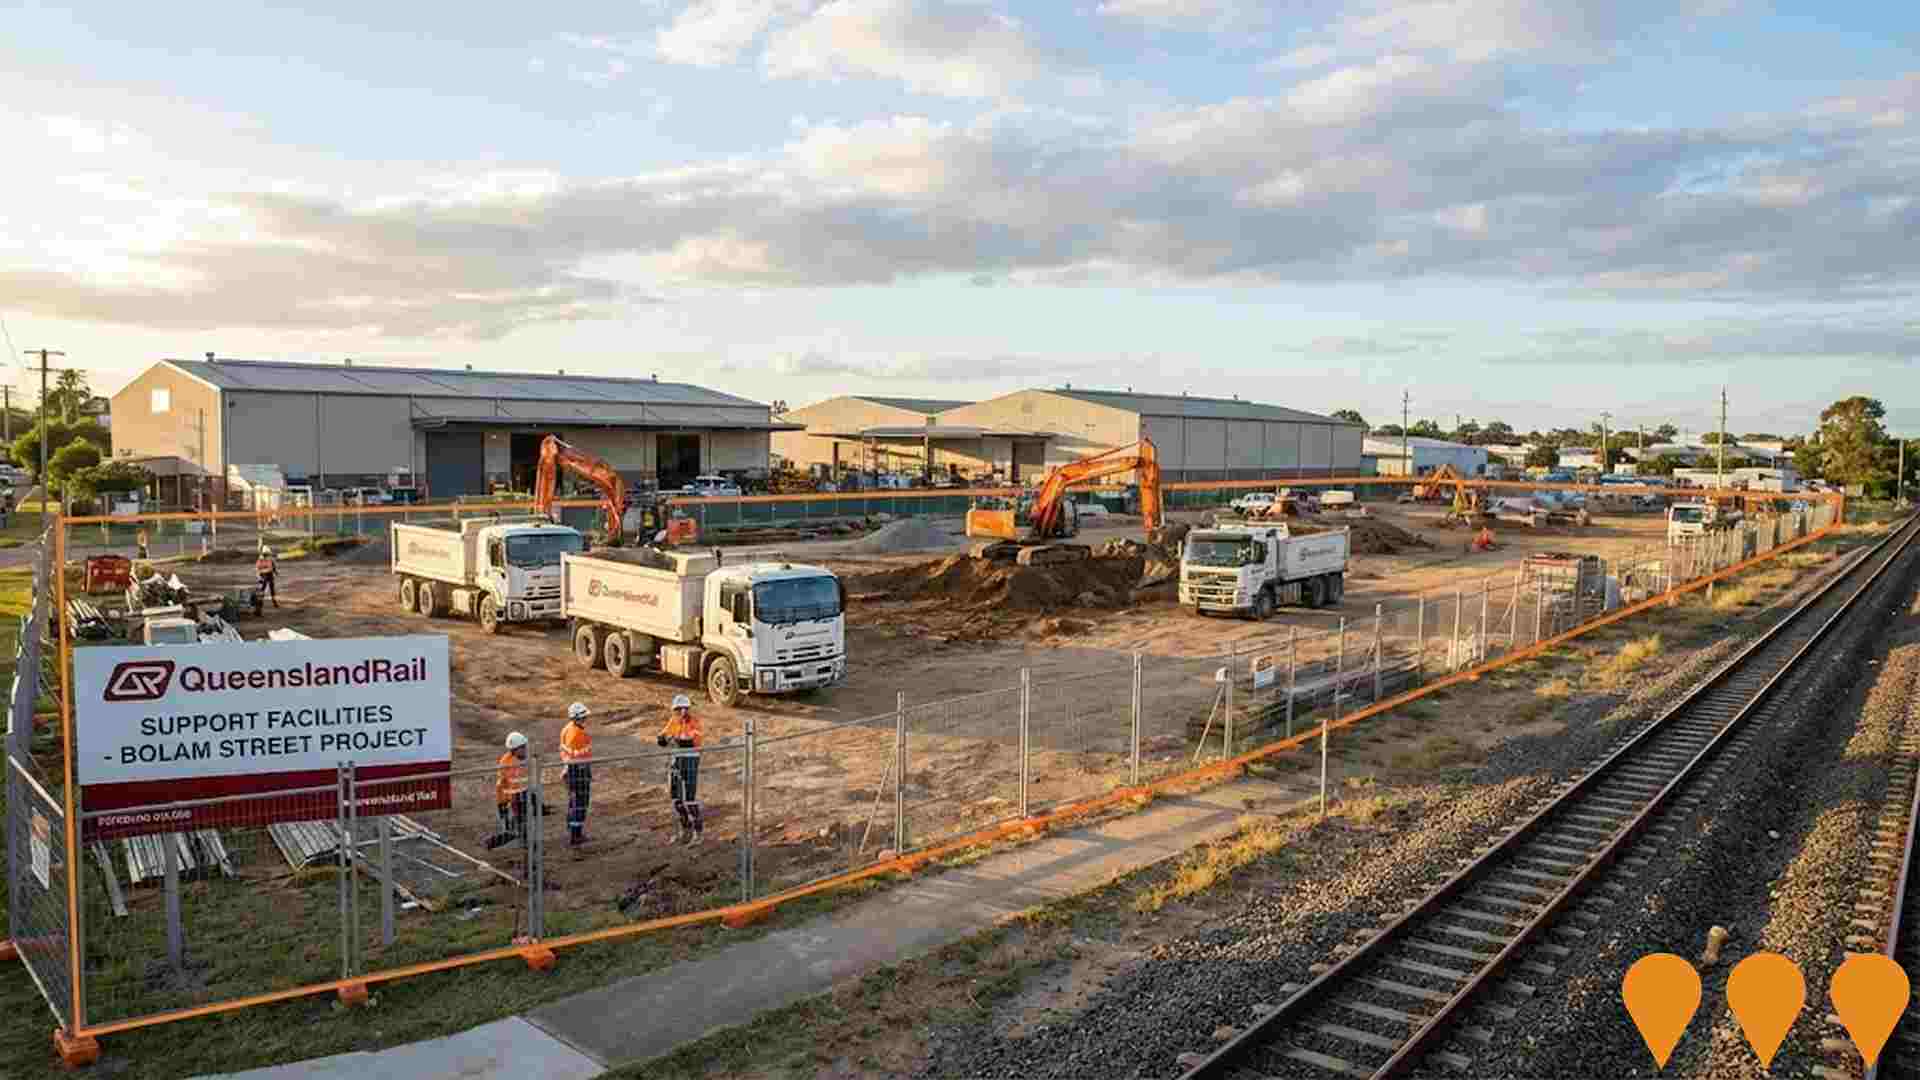
Queensland Rail Support Facilities, Bolam Street
Establishment of new rail support facilities adjacent to the rail corridor at 40 Bolam Street, Garbutt. Construction works include movement of trucks, project vehicles, and general construction noise.
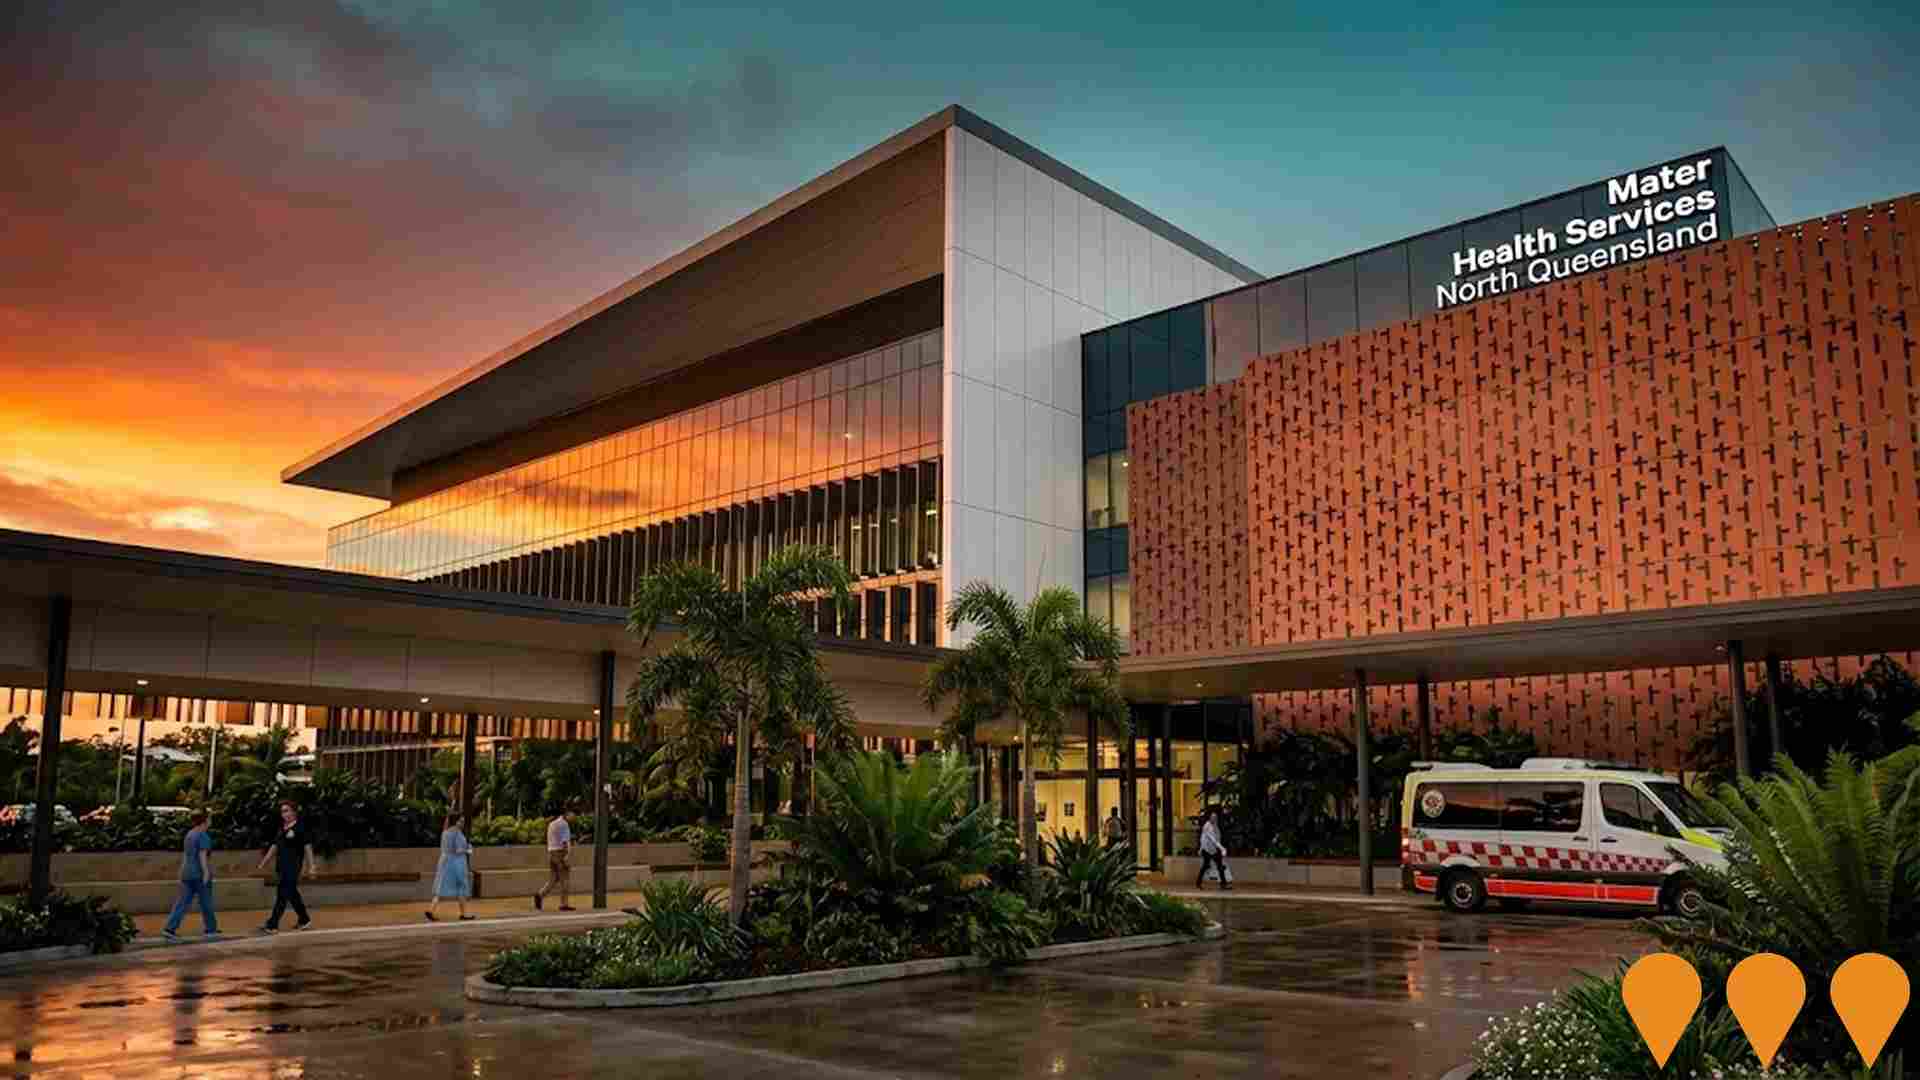
Mater Private Hospital Townsville Expansion & Relocation
A $40 million expansion of Mater Private Hospital Townsville consolidating all services onto the Pimlico campus. The project relocates maternity and renal services from the Hyde Park campus to two new purpose-built units at Pimlico. The renal unit (expanded from 8 to 12 dialysis chairs) opened November 2025, and Mater Mothers' Private Townsville (12 inpatient beds, 3 birthing suites, 6 special care nursery cots) is expected to open February 2026. The Emergency Department is also being expanded with four additional fast-track treatment bays.Maternity relocation is supported by the Australian Government Department of Health and Aged Care under the Community Health and Hospitals Program.
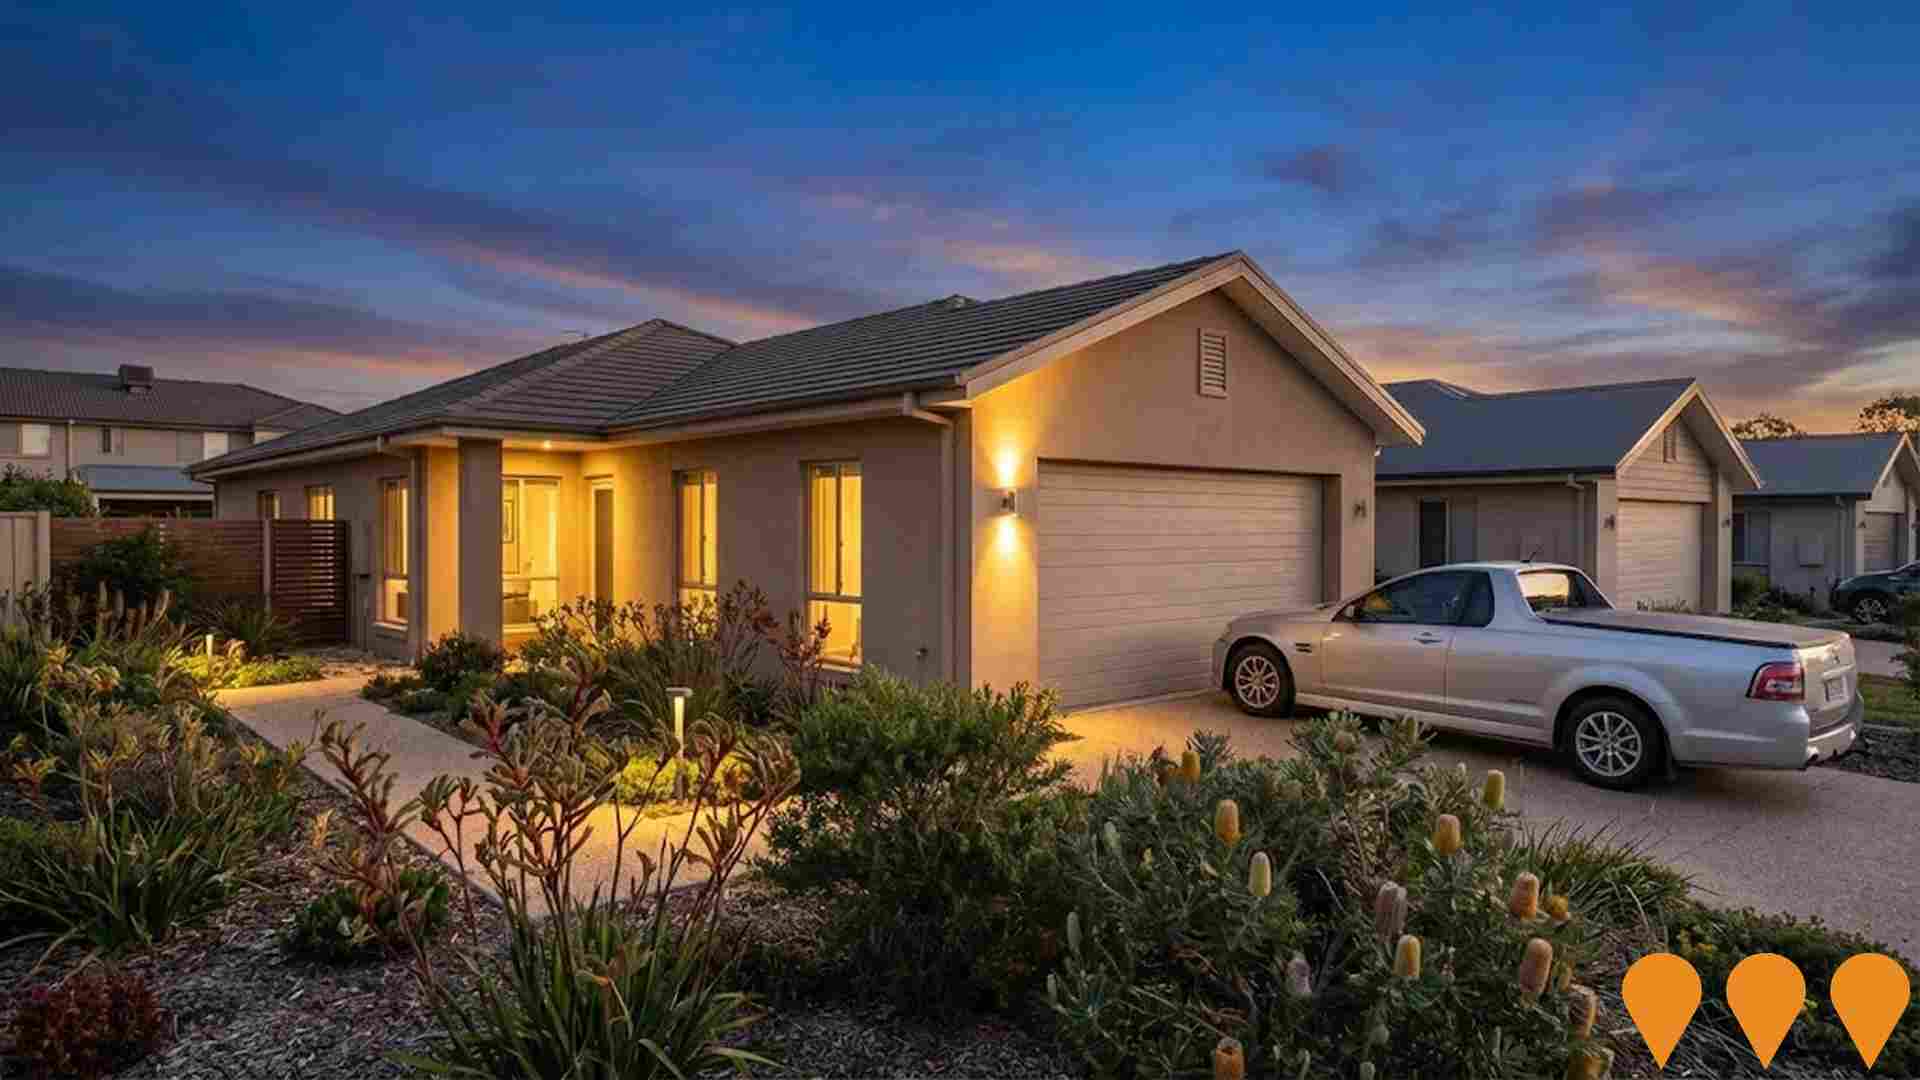
4A Plant Street
A recently completed, award-winning home in West End, constructed by Franzmann Constructions. The sophisticated home spans 282my on a 405my block and was recognized with the 2024 HIA Award for Interior Design.
Summerset Estate
Summerset Estate is an exciting new community nestled within Townsvilles established suburb of Mount Louisa. It is located just 8km from the CBD and is surrounded by existing amenities such as shops, schools, childcare, sporting grounds, parks, and playgrounds, making it a short distance from everything needed for a comfortable lifestyle.

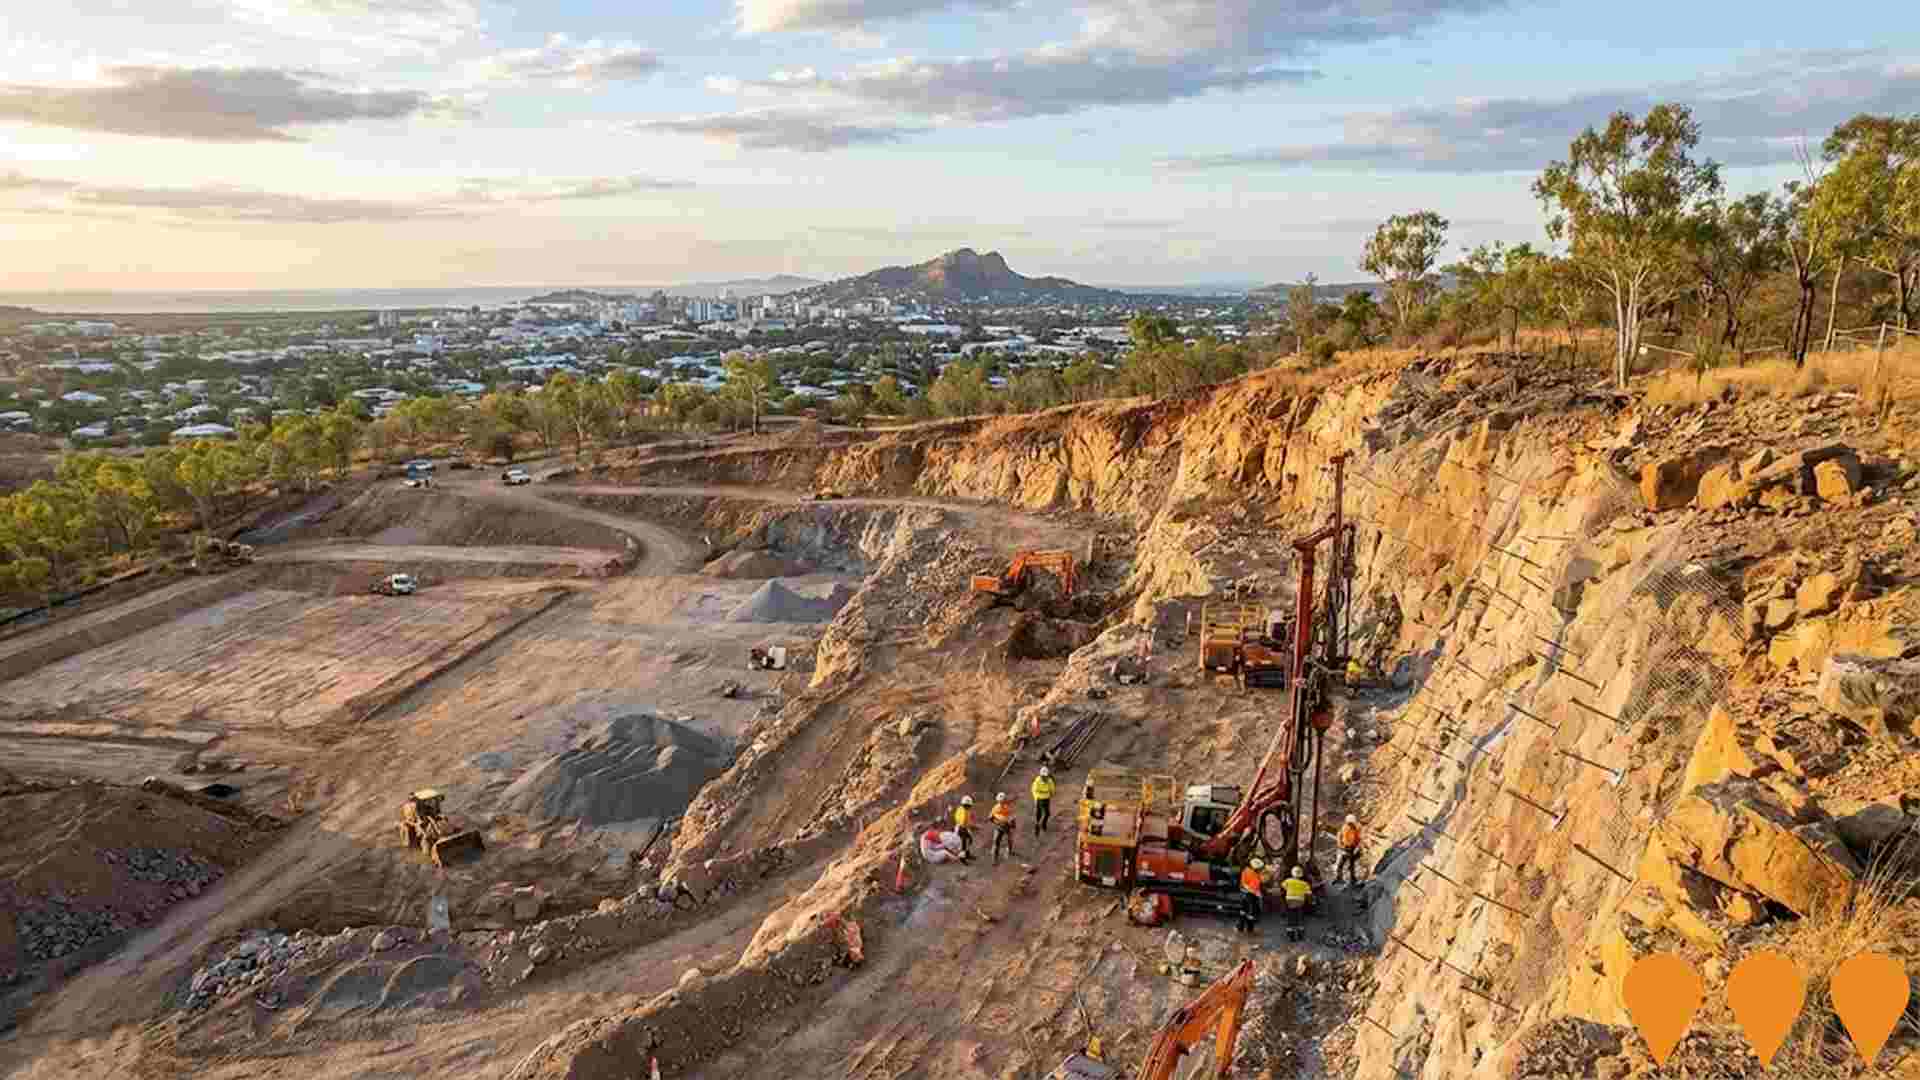
West End Reservoir Renewal
The Townsville City Council is planning the renewal of the West End Reservoir. The project aims to prepare the site for two future reservoirs as part of the CBD Utilities Upgrade, which will involve stabilising the rock face of the former quarry and preparing the site for the installation of the new water reservoirs.

3,091 residents of Garbutt - West End are employed, from a labour force of 3,430. Unemployment sits at 9.9%, with participation at 60.7%. Weighted for its industry mix, the area's sectors are forecast to grow about 6.6% nationally over five years. That reflects industry composition only and makes no allowance for local population growth. The working-day population is estimated at 11,597, about 176% of the resident population, so the area draws in more workers than it sends out. Unemployment and labour force come from ABS Small Area Labour Markets, updated quarterly; the industry and occupation profile is from the 2021 Census.
Detail
Garbutt - West End features a capable labour pool with notable strength in core public service sectors, alongside an unemployment rate of 9.9%. As of March 2026, employed residents count 3,091 individuals, while the local unemployment rate sits 6.0% higher than the Regional Qld benchmark of 3.9%, highlighting capacity for improvement; participation in the workforce is also slightly subdued at 60.7% versus 64.2% across Regional Qld. Census records indicated that a modest 6.0% of workers operated from home, though period-specific Covid-19 restrictions should be kept in mind. The primary employment sectors among local workers are health care & social assistance, public administration & safety, as well as education & training.
The area exhibits exceptional concentration in public administration & safety, with local representation reaching 2.1 times the regional average. Conversely, agriculture, forestry & fishing accounts for a minimal 0.3% employment footprint compared to 4.5% regionally. Recording 2.0 workers for every resident as at the Census, the locality serves as a major commercial center, providing more employment opportunities than resident workers and drawing commuters from adjacent suburbs. AreaSearch assessment of ABS and SALM figures indicates that over the year to March 2026, the local workforce contracted by 1.9% while employment dropped by 2.6%, pushing the unemployment rate up by 0.6 percentage points. Over the same period, Regional Qld recorded employment growth of 0.1% alongside labour force expansion of 0.3%, with a 0.1 percentage point increase in joblessness. National forecasts released by Jobs and Skills Australia from Mar-26 provide additional context regarding future labour demand in Garbutt - West End, with five- and ten-year projections mapped to local industry structures. Nationally, employment is anticipated to climb by 6.6% over five years and 13.7% over ten years, though trajectories diverge by sector. Applying these industry weighting assumptions to the local job profile projects employment in Garbutt - West End to grow by 6.6% over five years and 13.8% over ten years (representing an unadjusted sectoral model that does not factor in local demographic projections).
Frequently Asked Questions - Employment
Median household income in Garbutt - West End is $1,290 a week (about $67,000 a year), with median personal income at $820 a week. ATO records put median taxable income at $61,224 a year against an average of $76,532. Household income is from the 2021 Census; taxable income is from ATO Taxation Statistics for the latest financial year available, indexed forward using the ABS Wage Price Index.
Detail
ATO records at the postcode level for financial year 2023 analysed by AreaSearch show high personal earnings relative to the nation, with a median taxable income of $61,224 and an average income of $76,532. These results compare favourably to Regional Qld benchmarks of $53,146 (median) and $66,593 (average). Factoring in a Wage Price Index rise of 11.36% since financial year 2023, modelled values reach roughly $68,179 (median) and $85,226 (average) as of March 2026. At the Census 2021, household income sat in the 19th percentile nationally, while individual earnings placed higher in the 52nd percentile.
Distribution metrics show 29.2% of individuals (1,928 individuals) earning between $1,500 - 2,999, closely aligning with the regional share of 31.7%. Household budgets face considerable strain, with 82.9% of income remaining after housing obligations, ranking in the 19th percentile.
Frequently Asked Questions - Income
Garbutt - West End had 2,848 occupied dwellings at the 2021 Census, 54% detached houses and 7% apartments. 27% are owned with a mortgage, 55% rented and 19% owned outright. At that Census the median rent was $250 a week and the median mortgage repayment $1,354 a month. Rent absorbs 19.4% of household income here and mortgage repayments 24.2%. Dwelling stock, tenure and housing costs are 2021 Census measures — the only source that counts dwellings at this boundary size.
Detail
At the latest Census, the housing landscape in Garbutt - West End was split between 54.3% houses and 45.7% other dwellings (semi-detached, apartments, 'other' dwellings), contrasting with Regional Qld where 76.4% houses and 23.6% other dwellings were recorded. Outright home ownership in Garbutt - West End was below the regional benchmark at 18.7%, with remaining properties held under a mortgage (26.8%) or rented (54.6%). Typical monthly mortgage payments were notably lower than the Regional Qld average, sitting at $1,354 compared to $1,655, while weekly median rent stood at $250 against $345 regionally.
Relative to the Australian medians of $1,863 for mortgages and $375 for rent, housing costs across the suburb remain substantially lower.
Frequently Asked Questions - Housing
Garbutt - West End counted 2,848 households at the 2021 Census, an estimated 2,999 today, averaging 1.9 people each. 15% are couples with children, fewer than in 95% of areas nationally, against 21% couples without children. 45% of households are people living alone, and families average 1.5 children. Household and family composition is measured only by the Census, so these are 2021 figures.
Detail
Family units constitute 49.8% of all households, consisting of 14.7% couples with children, 21.1% couples without children, and 12.5% single parent families. Non-family households represent the remaining 50.2%, dominated by lone person households at 44.8% alongside group households at 5.5%. The average household size stands at 1.9 people, notably smaller than the Regional Qld standard of 2.5.
Frequently Asked Questions - Households
24.5% of adults in Garbutt - West End hold a university qualification, including 16.8% with a bachelor degree and 5.5% with postgraduate qualifications, lower than 84% of areas nationally. A further 28.3% hold a vocational qualification. 4 schools serve the area, with 404 enrolment places and an average ICSEA of 838 against a national benchmark of 1,000. Qualifications come from the 2021 Census; school enrolments, ICSEA and results come from ACARA's current release.
Detail
Tertiary attainment in Garbutt - West End sits lower than regional and national averages, with 24.5% of residents aged 15+ holding university qualifications against 30.4% in Australia, pointing to opportunities for upskilling. By specific degree level, Bachelor degrees comprise 16.8%, postgraduate qualifications account for 5.5%, and graduate diplomas represent 2.2%. Vocational training is well established, with 37.7% of residents aged 15+ holding trade credentials, consisting of advanced diplomas (9.4%) and certificates (28.3%). Engagement in learning is substantial, with 28.5% of the local population actively enrolled in an educational institution. This proportion includes 8.6% in primary education, 7.2% in tertiary education, and 6.6% pursuing secondary education.
Frequently Asked Questions - Education
Schools Detail
Public transport in Garbutt - West End reaches 53 stops on 6 routes, timetabled for about 700 services a week. The typical home sits about 210 m from its nearest stop. Buses carry the largest share of public transport commuters. Households keep an average of 1.0 vehicles. Stop and service counts are built from operators' published GTFS timetables and refresh with each timetable release; vehicle ownership is from the 2021 Census.
Detail
Public transit options in Garbutt - West End encompass 53 active transport stops providing bus connectivity. A network of 6 individual routes operates across these stops, delivering 702 weekly passenger trips. Overall public transport access is solid, with properties typically situated 211 meters from the nearest stop. Given its predominantly residential footprint, most workers travel outward, with private vehicles accounting for 89% of commutes and cycling representing 2%. Vehicle ownership sits below regional standards at an average of 1.0 per dwelling. Only 6.0% of residents work from home (2021 Census; may reflect COVID-19 conditions).
Transit schedules deliver an average of 100 trips per day across the network, corresponding to roughly 13 weekly trips per individual stop.
Frequently Asked Questions - Transport
Transport Stops Detail
64.5% of residents in Garbutt - West End report no long-term health condition, a less healthy profile than 85% of areas nationally. 6.9% need daily assistance with core activities, and 57.0% hold private health cover. The standardised death rate runs at 6.5 per 1,000 residents. Health conditions, assistance needs and insurance are 2021 Census measures; the death rate comes from current ABS releases.
Detail
Analysis of mortality statistics and chronic health patterns by AreaSearch indicates notable health considerations for Garbutt - West End, with elevated condition prevalence spanning younger and older residents alike. Private health insurance participation is pronounced, with approximately 57% of the total population (~3,765 people) maintaining coverage, exceeding the Regional Qld level of 52.5%. Mental health conditions and arthritis represent the primary diagnosed medical concerns locally, reported by 11.1 and 8.2% of residents, respectively, while 64.5% indicated no long-term illnesses compared to 67.6% across Regional Qld. Working-age cohorts experience elevated chronic illness burdens.
Residents aged 65 and over comprise 18.1% of the community (1,196 people), tracking below the 20.3% share in Regional Qld, with senior health indicators generally matching broader national trends.
Frequently Asked Questions - Health
Garbutt - West End is largely Australian-born, at 82.7% of residents, with 9.0% speaking a language other than English at home. The largest reported ancestries are English (27.5%) and Australian (24.1%). 6.1% of residents identify as Aboriginal and/or Torres Strait Islander. Ancestry, language and country of birth are counted only by the Census, so these are 2021 figures.
Detail
Garbutt - West End demonstrates lower cultural diversity relative to broader benchmarks, with 83.9% of residents holding Australian citizenship, 82.7% born in Australia, and 91.0% speaking English only at home. Christianity is the predominant religious affiliation, encompassing 49.8% of people in Garbutt - West End. The most visible proportional overrepresentation occurs in Other faiths, representing 0.9% of local residents versus 0.8% across Regional Qld. Regarding parental ancestry, the leading heritage backgrounds in Garbutt - West End are English at 27.5% of the population, Australian at 24.1% of the population, and Irish at 9.2% of the population.
Specific community groups show distinctive local representation: Australian Aboriginal residents make up 6.1% of Garbutt - West End (vs 3.9% regionally), Maori accounts for 0.8% (vs 0.8%), and German ancestry represents 4.3% (vs 4.7%).
Frequently Asked Questions - Diversity
The median resident of Garbutt - West End is 39. That is 1 year younger than at the 2021 Census. 30.0% of residents are aged 15 to 34. Age cohorts are not raw Census counts: the Census split is re-based to the latest ABS population estimates and state projections.
Detail
The age profile of Garbutt - West End leans toward younger demographics. Updated estimates to August 2026 show that 30.1% of the community consists of young to middle aged adults (25 - 44), compared to 25.5% across Regional Qld, while retiree and elderly cohorts (65+) make up 18.1% against 20.4% regionally. The estimated median age is 39, shifting down from 40 at the 2021 Census and remaining 2 years younger than the Regional Qld median of 41 recorded at that time. The most notable shift since the Census occurred among middle aged and young retiree cohorts (45 - 64), which dropped from 28.2% to an estimated 24.4% of residents.
Long-term forecasts to 2041 point to the largest growth occurring in retiree and elderly cohorts, expanding by 129 residents (11%) to 1,325, while children and young adults, as well as middle aged and young retiree cohorts, are projected to decrease.
Frequently Asked Questions - Age
Data & MethodBoundaries, Sources & Method for Garbutt - West End
9 of 14 data sections on this page were updated within the last 12 months — the newest current to Oct 2026.
Everything is aggregated to the SA2 boundary shown above, on a 2021 Census baseline. Only 3 sections — housing, households and cultural diversity — still wait on the 2026 Census.
The ledger — source, cycle and currency by section
| Section | Source & update cycle | Currency |
|---|---|---|
| Updated within the last 12 months 9 sections | ||
| Population | ABS, GNAF, Geoscience Australia Annual (ABS ERP) | Aug 2026 2 months ago headline measures · 2021 Census baseline |
| Re-based to the ABS Estimated Resident Population (June 2025 release) and updated with new dwellings from GNAF address data. Current to Aug 2026, with the 2021 Census supplying the small-area baseline. | ||
| Age profile | ABS, Geoscience Australia, State governments Annual | Aug 2026 2 months ago headline measures · 2021 Census baseline |
| Age cohorts are re-based to the latest ABS population estimates and state projections, current to Aug 2026. Each cohort is held as a Census baseline and a current estimate. | ||
| Development & approvals | ABS, GNAF Monthly (ABS approvals) | Aug 2026 2 months ago headline measures · Jul 2026 baseline |
| Property sales & rents | Valuer General, Rental Board, ABS Weekly sales, quarterly rents | Oct 2026 this month headline measures · Sep 2026 baseline |
| Sales from the state Valuer General register, refreshed weekly, and rents from quarterly rental bond lodgements. Both are read live each time this page loads, current to Oct 2026. | ||
| Infrastructure projects | Infrastructure Australia, State agencies, Local governments Daily | May 2026 5 months ago all 10 projects tracked here |
| Project pipeline maintained continuously from Infrastructure Australia, state agencies, local government and public announcements. Records are added and revised daily; this area was last updated May 2026. | ||
| Employment | ABS, DEWR, JSA Quarterly (ABS SALM) | Mar 2026 7 months ago headline measures · 2021 Census baseline |
| Unemployment and labour force from ABS Small Area Labour Markets, current to Mar 2026. The growth outlook applies Department of Employment (now Jobs and Skills Australia) forecasts for all 19 industry divisions to the local industry mix, so it measures sector composition rather than local expansion and makes no allowance for population growth. Job demand comes from the same agency via its Internet Vacancy Index; industry and occupation structure from the 2021 Census. | ||
| Education | ABS, ACARA Annual (ACARA) | Sep 2026 last month headline measures · 2021 Census baseline |
| Transport | ABS, State Transport Departments Each timetable release | Jul 2026 3 months ago headline measures · 2021 Census baseline |
| Services & amenities | Provider directories, ACECQA Continuous | Sep 2026 last month all 14 measures |
| Annual and financial-year sources 2 sections | ||
| Income | ABS, ATO Annual (ATO) | FY 2023 3 years ago headline measures · 2021 Census baseline |
| ATO taxable income statistics for FY 2023, indexed forward using the Wage Price Index. Census household income provides the distribution detail. | ||
| Health | ABS, ATO Annual | 2024 2 years ago headline measures · 2021 Census baseline |
| Census-measured — next update: 2026 Census 3 sections No more current small-area source exists for these, so they are labelled as Census-measured rather than implied to be current. | ||
| Housing | ABS 5-yearly (Census) | 2021 Census next update 2026 all 30 measures |
| Households | ABS 5-yearly (Census) | 2021 Census next update 2026 all 18 measures |
| Cultural diversity | ABS, Geoscience Australia 5-yearly (Census) | 2021 Census next update 2026 all 44 measures |
"Currency" is the most recent release feeding that section. Where the Census supplies the structural baseline underneath a current headline figure, the row says so.
How the numbers are built
Population
The Census provides the small-area baseline, aggregated from mesh blocks to this boundary. It is then re-based to the ABS Estimated Resident Population (June 2025 release), and new dwellings built since Census night are counted from address data — 90 validated new addresses here. The headline figure is therefore a current estimate for Aug 2026, not a 2021 count (6,273 at the 2021 Census → 6,606 now). Annual growth rates are compound (CAGR), not simple averages.
Age profile
Cohort shares are not raw Census counts. Every cohort is held as a pair — the Census baseline and a current estimate — and the split is re-based using ERP and state population projections, current to Aug 2026. Median age is the Census median plus modelled change since. Charts that show both are labelled "2021 Census vs Current Estimate".
Property sales
Sourced from the state valuation authority's sales register — current, not Census, and refreshed weekly. Medians are calculated from settled transactions in the period shown; periods with very low transaction counts are flagged or suppressed, because a handful of sales can move a median substantially.
Rents
Derived from state rental bond lodgement data, by dwelling type and bedroom count. Bonds are lodged at the start of a new tenancy, so this reflects new lettings, not the whole rented stock.
Development & infrastructure
Building approvals come from current ABS releases; development applications are collected from council and state planning portals; the infrastructure pipeline is compiled from Infrastructure Australia and local government sources. Applications are matched to this boundary by address or coordinates, so very recent lodgements may not yet appear.
Employment & income
Industry and occupation structure comes from the Census, but the headline labour-market indicators do not. Unemployment and labour force are derived from ABS Small Area Labour Markets (quarterly). The employment outlook applies Department of Employment forecasts for all 19 industry divisions to this area's own industry mix (the agency is now Jobs and Skills Australia), as does the Internet Vacancy Index used for job demand. Because it is weighted on industry composition alone, that outlook carries no allowance for local population growth — in fast-growing areas the real rise in local jobs will typically be higher. Income combines Census household income with ATO taxable-income statistics for FY 2023, indexed forward using the Wage Price Index.
Education, transport & amenities
School enrolments, ICSEA and performance come from ACARA's current release, not the Census. Public transport stops and service frequency are derived from GTFS timetable feeds published by state transport departments. Services and amenities are proximity and count scores built from provider directories, refreshed on their own cycle. The Census contributes only the travel-to-work and qualification measures.
Rankings and benchmarks. Where we rank this area, the comparison set is every area of the same boundary type — suburbs against suburbs, SA2s against SA2s. Benchmarks compare this area against its greater capital city region and the national figure for the same measure and period.
Limits worth knowing. Small areas carry larger error margins, and the ABS introduces small random adjustments to Census counts to protect confidentiality — so totals may not sum exactly. Estimates re-based from regional data describe the area's expected trajectory, not a direct count of it. Figures are indicative for research and are not financial, planning or valuation advice.
Cross-check us. The Census baseline for this boundary is at ABS 2021 Census QuickStats (318021475). QuickStats reports 2021 only — the figures on this page are more current wherever the ledger shows a later date.