Chart Color Schemes
This analysis uses ABS Statistical Areas Level 2 (SA2) boundaries, which can materially differ from Suburbs and Localities (SAL) even when sharing similar names.
SA2 boundaries are defined by the Australian Bureau of Statistics and are designed to represent communities for statistical reporting (e.g., census and ERP).
Suburbs and Localities (SAL) represent commonly-used suburb/locality names (postal-style areas) and may use different geographic boundaries. For comprehensive analysis, consider reviewing both boundary types if available.
est. as @ -- *
ABS ERP | -- people | --
2021 Census | -- people
Sales Activity
Curious about local property values? Filter the chart to assess the volume and appreciation (including resales) trends and regional comparisons, or scroll to the map below view this information at an individual property level.
Find a Recent Sale
Sales Detail
Population
Mundingburra has shown very soft population growth performance across periods assessed by AreaSearch
Mundingburra's population is around 3,628 as of Nov 2025. This reflects an increase of 34 people since the 2021 Census, which reported a population of 3,594 people. The change is inferred from the estimated resident population of 3,593 from the ABS as of June 2024 and an additional 22 validated new addresses since the Census date. This level of population equates to a density ratio of 1,374 persons per square kilometer, which is above the average seen across national locations assessed by AreaSearch. Population growth for the area was primarily driven by overseas migration that contributed approximately 63.0% of overall population gains during recent periods.
AreaSearch is adopting ABS/Geoscience Australia projections for each SA2 area, as released in 2024 with 2022 as the base year. For any SA2 areas not covered by this data, and for years post-2032, Queensland State Government's SA2 area projections are adopted, released in 2023 and based on 2021 data. It should be noted that these state projections do not provide age category splits; hence where utilised, AreaSearch is applying proportional growth weightings in line with the ABS Greater Capital Region projections for each age cohort, released in 2023 based on 2022 data. As we examine future population trends, lower quartile growth of regional areas nationally is anticipated, with the area expected to expand by 2 persons to 2041 based on the latest annual ERP population numbers, reflecting a decline of 0.9% in total over the 17 years.
Frequently Asked Questions - Population
Development
The level of residential development activity in Mundingburra is very low in comparison to the average area assessed nationally by AreaSearch
Mundingburra has received approximately 6 dwelling approvals per year. Over the past five financial years, from FY21 to FY25, around 30 homes were approved, with none so far in FY26. The population decline in recent years has resulted in adequate development activity relative to population changes, benefiting buyers.
New properties are constructed at an average cost of $343,000, aligning with broader regional trends. This year, $1.2 million in commercial approvals have been registered, indicating minimal commercial development activity. Compared to the rest of Queensland, Mundingburra has significantly lower building activity, 61.0% below the regional average per person. The scarcity of new dwellings typically strengthens demand and prices for existing properties. This is also below the national average, reflecting the area's maturity and possible planning constraints. New development consists of 20.0% detached houses and 80.0% townhouses or apartments, indicating a shift towards denser development to provide more affordable housing options. The location has approximately 1049 people per dwelling approval, demonstrating an established market.
With stable or declining population forecasts, Mundingburra may experience less housing pressure in the future, creating favourable conditions for buyers.
Frequently Asked Questions - Development
Infrastructure
Mundingburra has strong levels of nearby infrastructure activity, ranking in the top 30% nationally
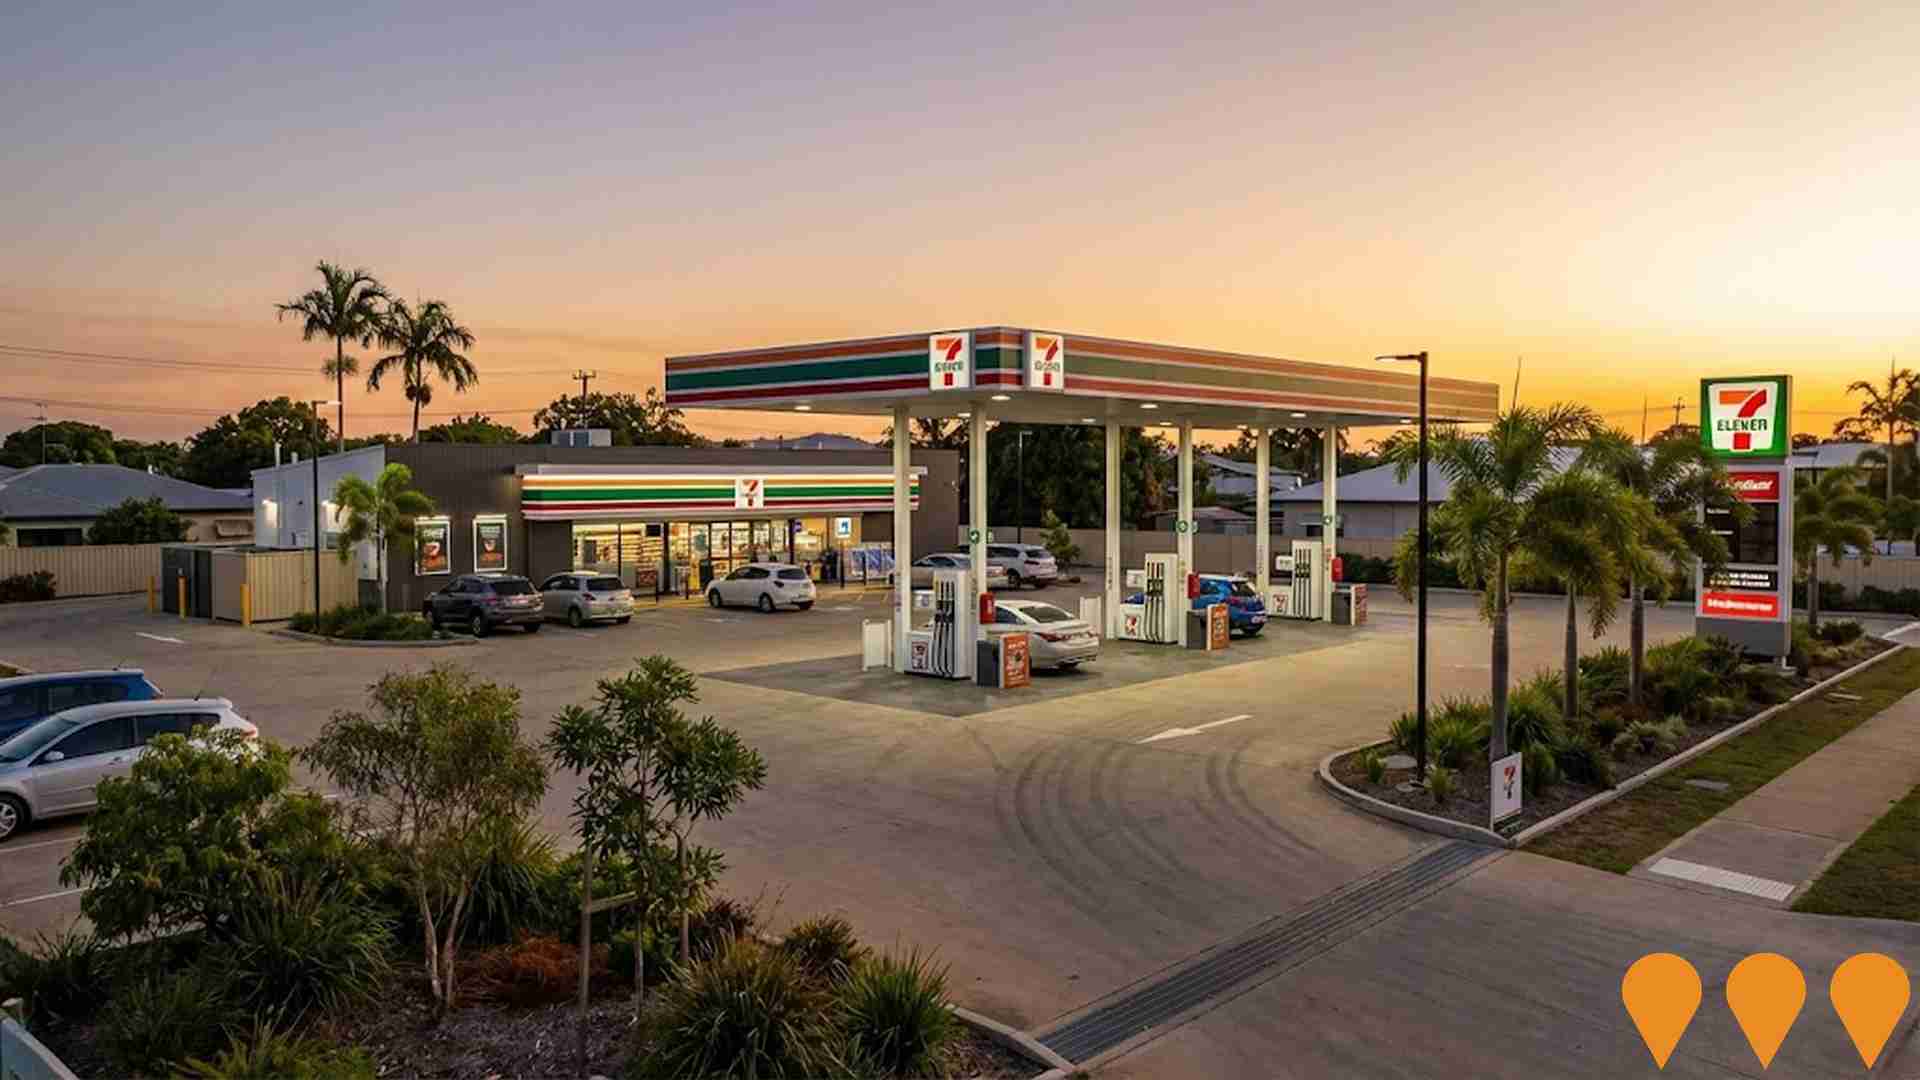
Changes in local infrastructure significantly affect an area's performance. AreaSearch has identified seven projects that could influence this region. Notable projects are Eden Park Estate, Harris Crossing Estate, 7-Eleven Mundingburra, and Sanctum Estate. The following details projects expected to have the most impact.
Professional plan users can use the search below to filter and access additional projects.
INFRASTRUCTURE SEARCH
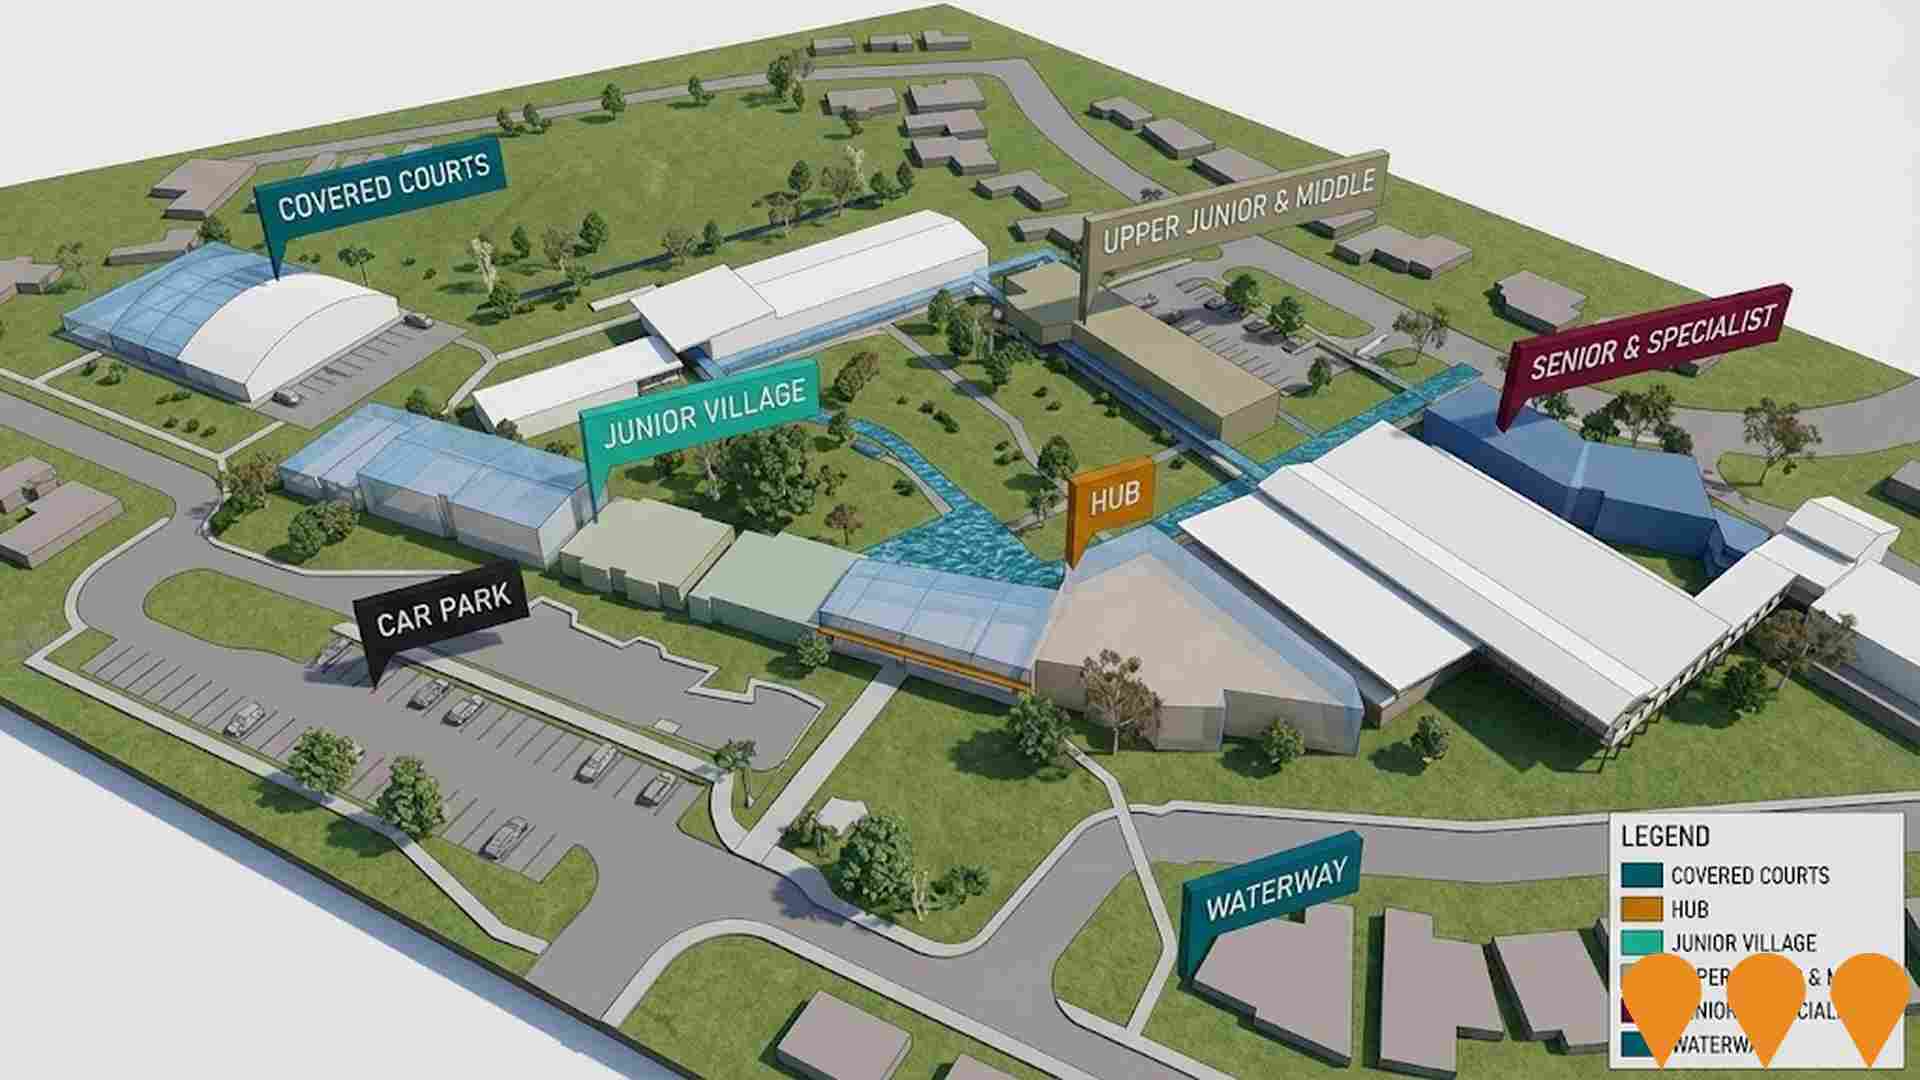
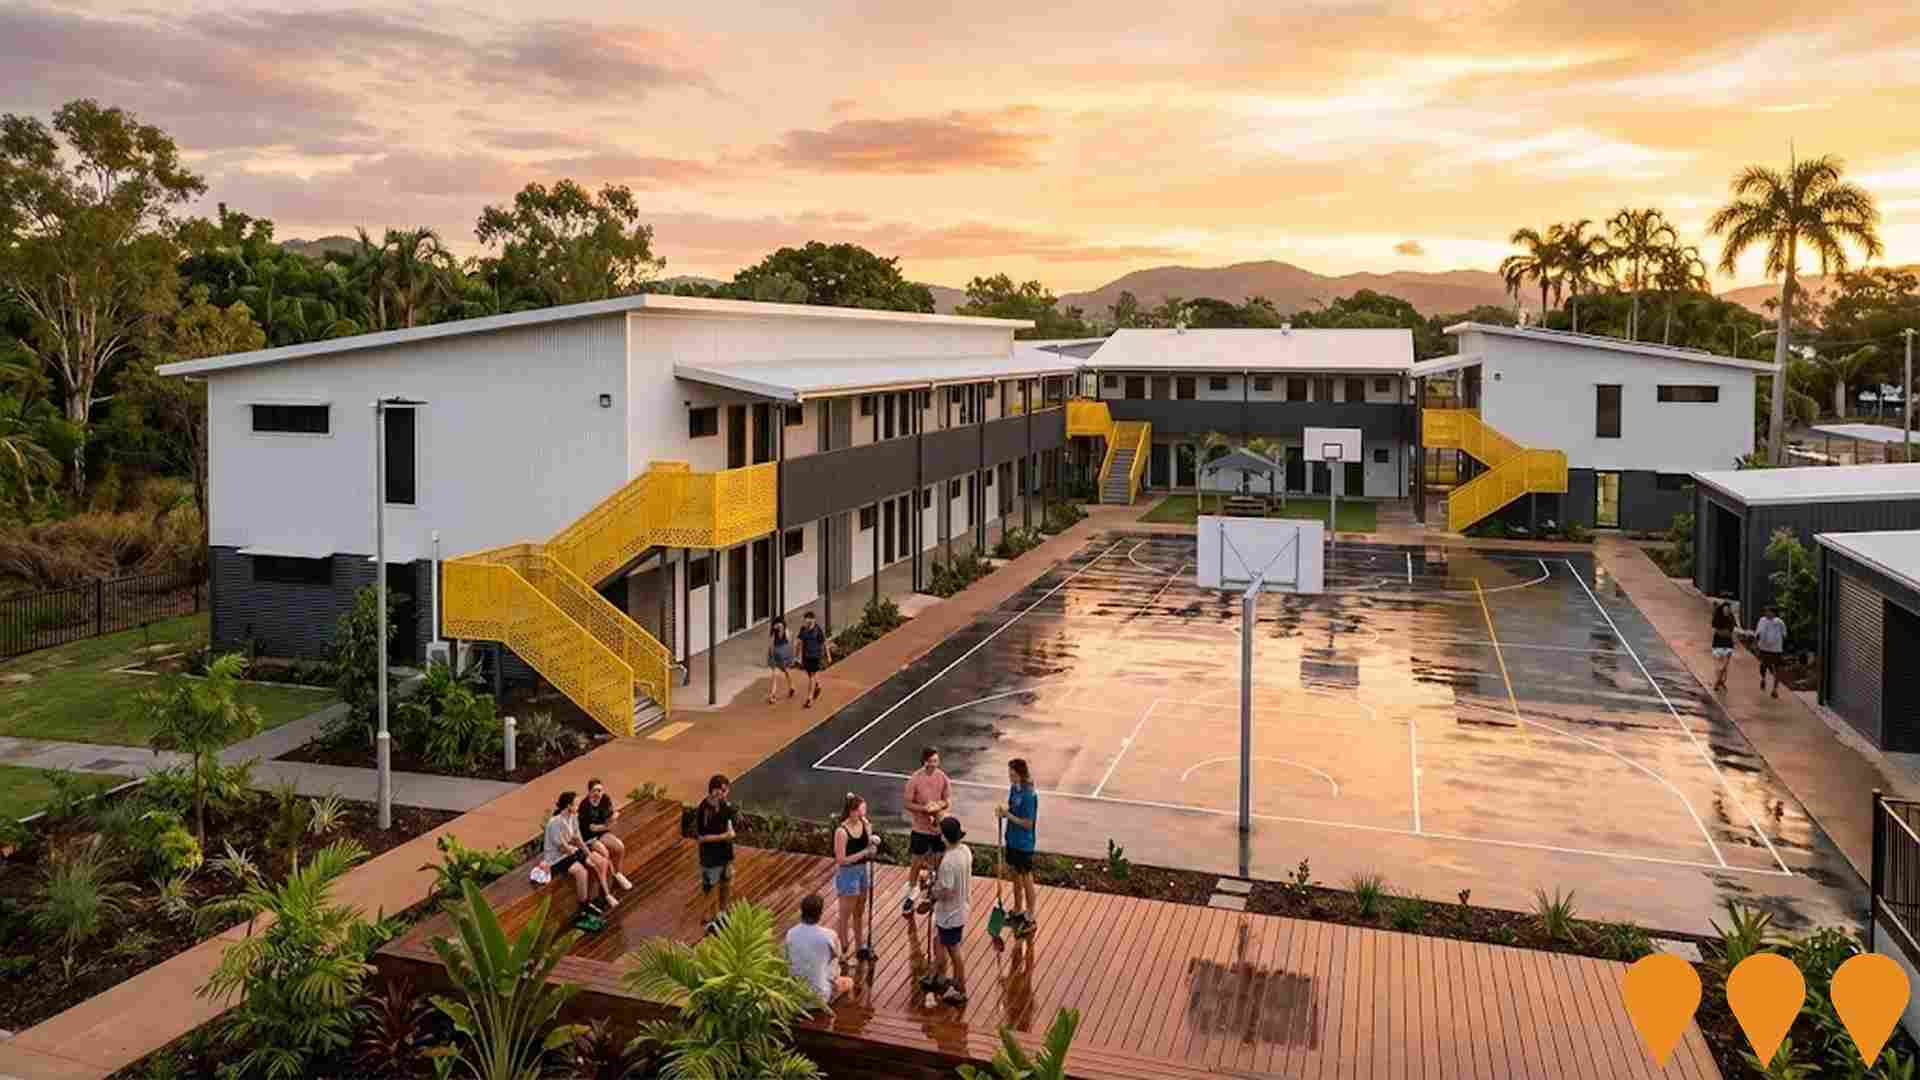
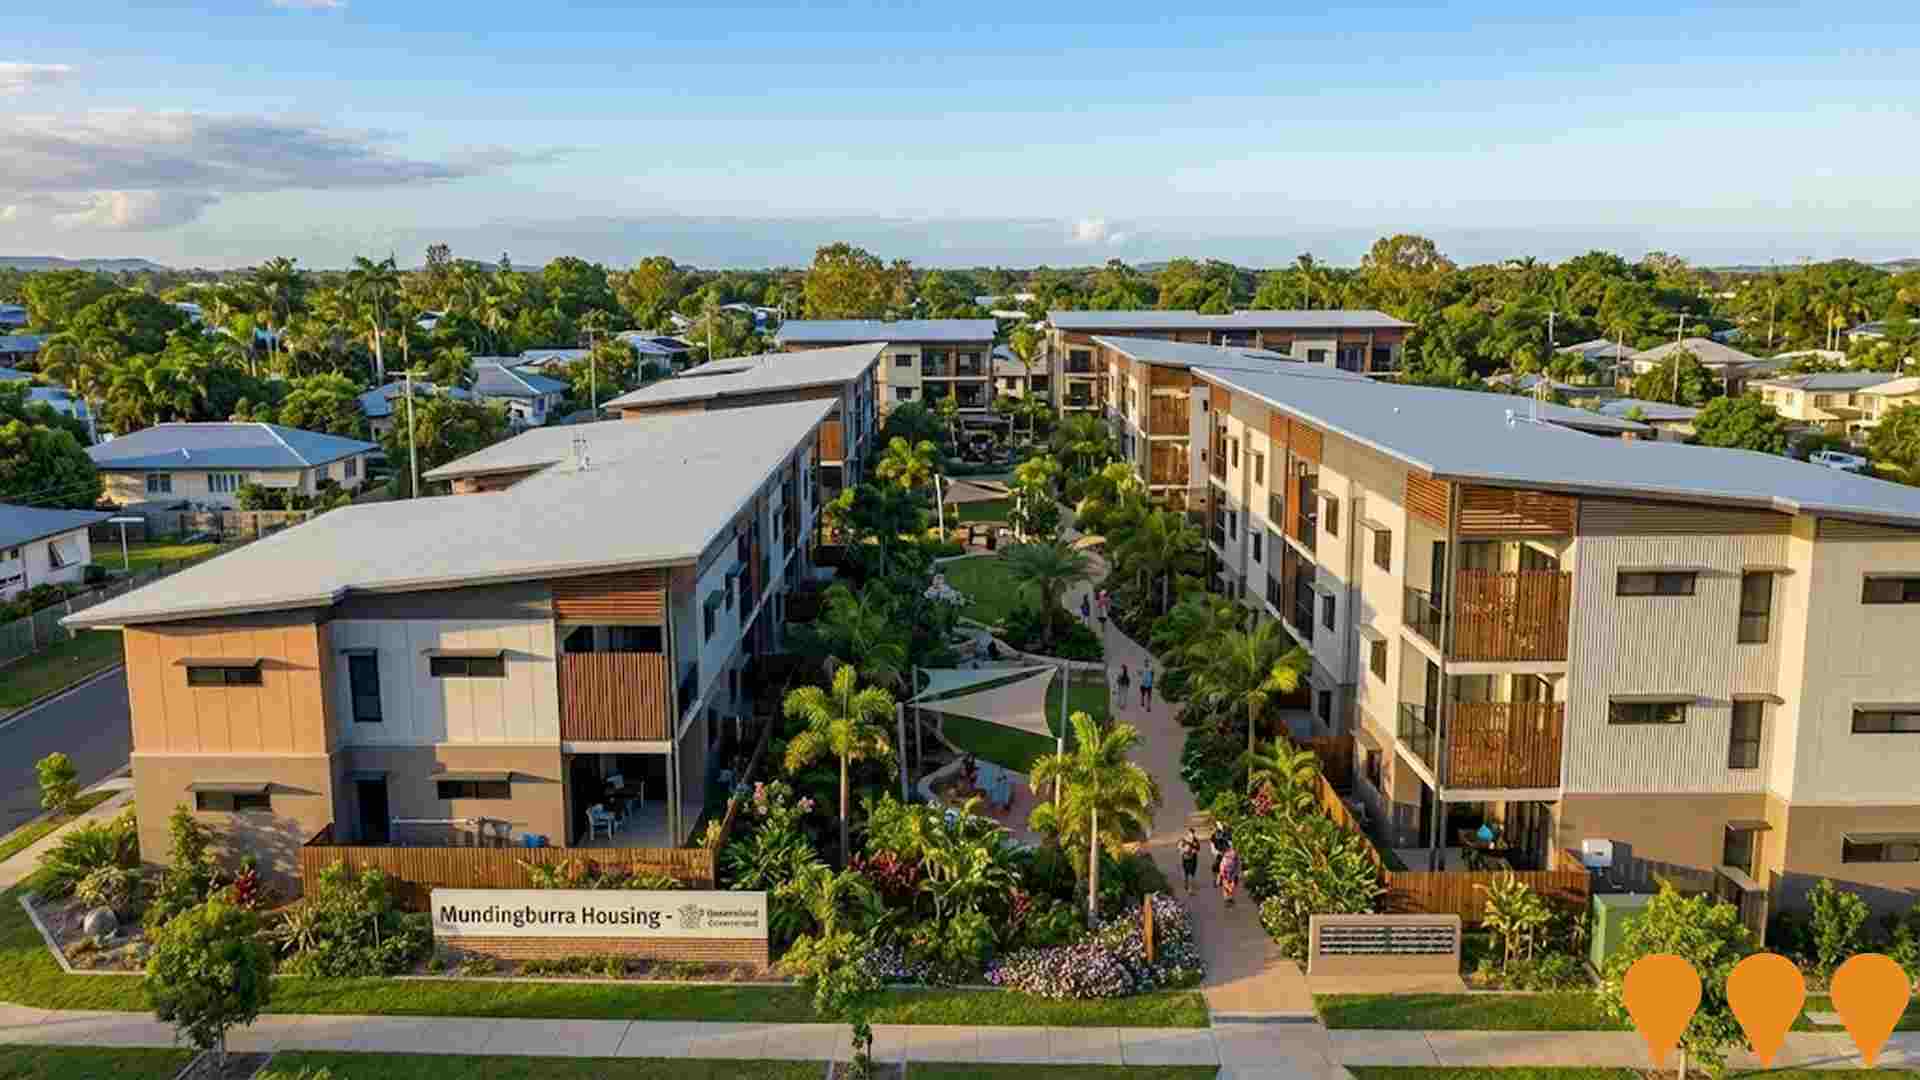
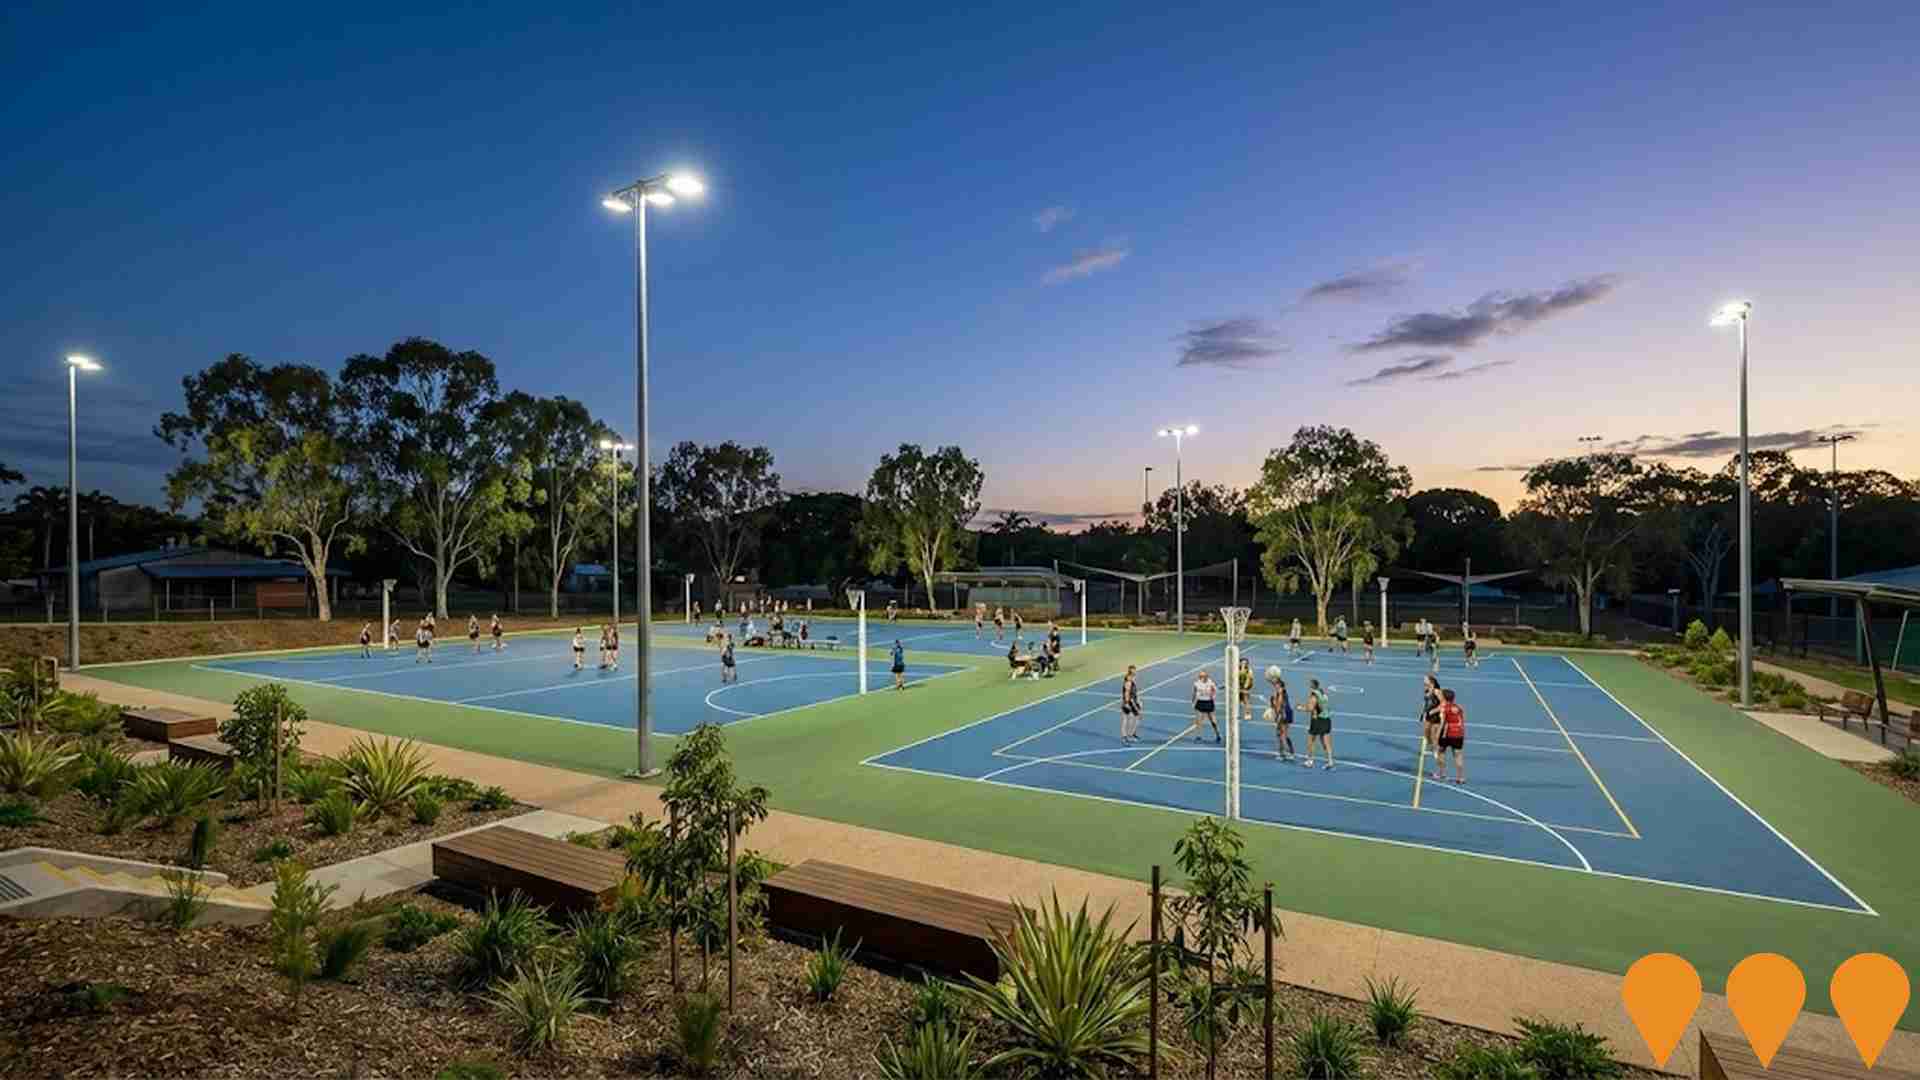
 Denotes AI-based impression for illustrative purposes only, not to be taken as definitive under any circumstances. Please follow links and conduct other investigations from the project's source for actual imagery. Developers and project owners wishing us to use original imagery please Contact Us and we will do so.
Frequently Asked Questions - Infrastructure
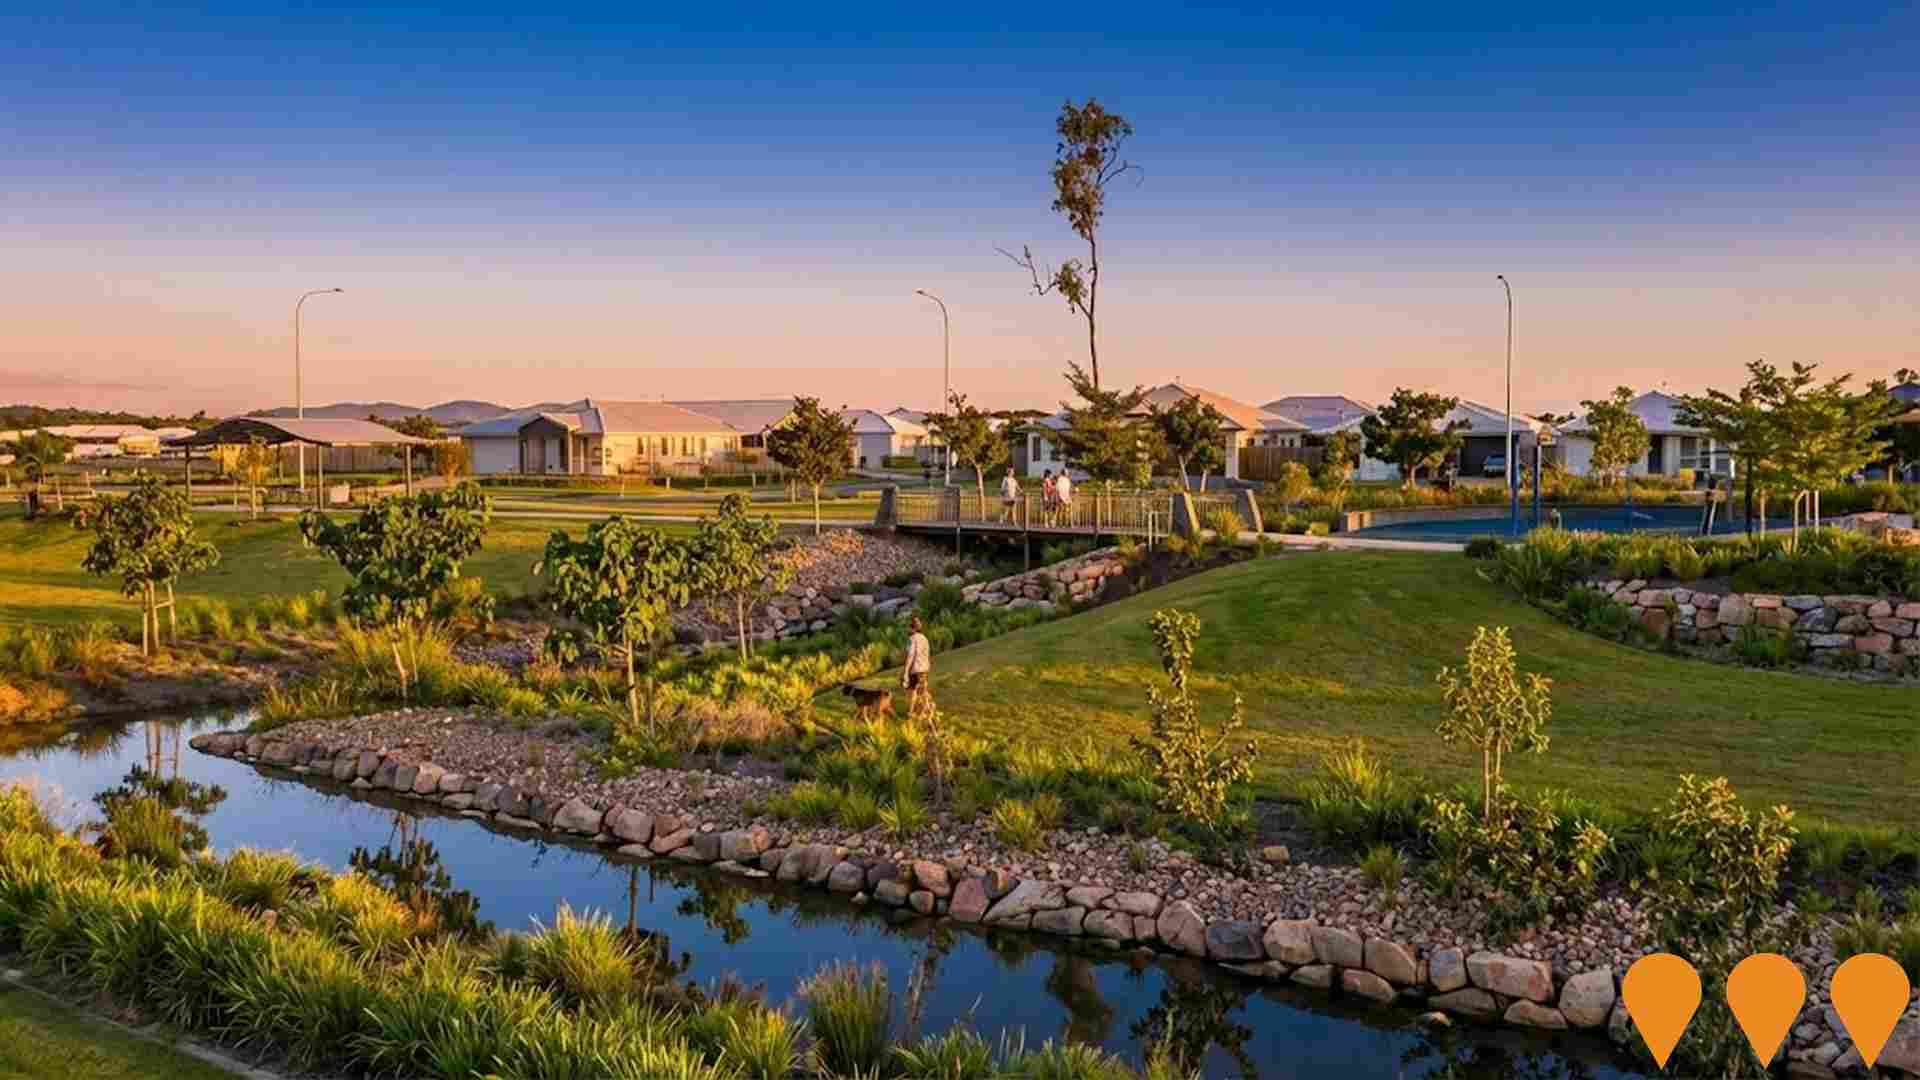
Sanctum Estate
Large-scale masterplanned community in Townsville's Northern Beaches, set to feature 4800 lots over a 700-hectare site. Features include 70 hectares of parkland, a 3km waterway, and lots up to 1300m2. Land is currently for sale, with roads open for new stages (e.g., Stage 24), and turn-key homes are under construction.
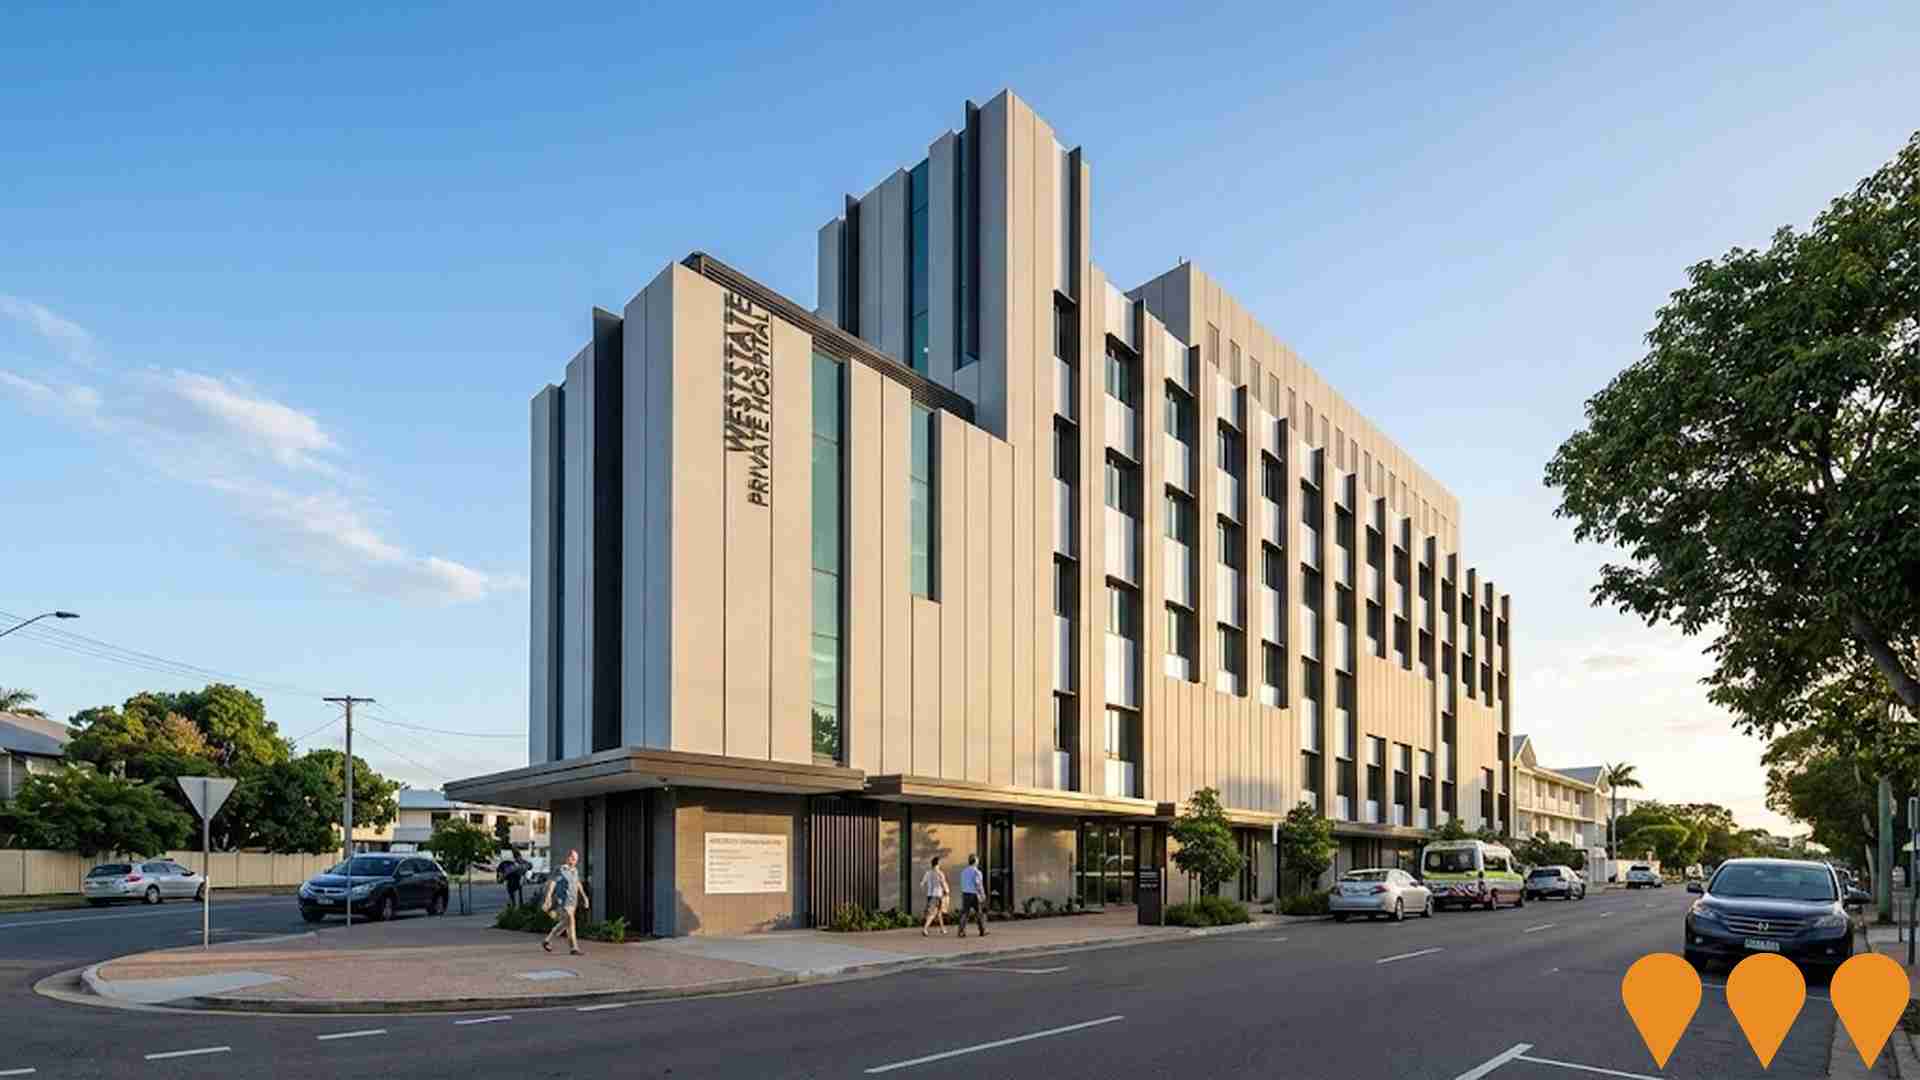
Weststate Private Hospital
New five-storey short-stay private hospital on the former West State School site in West End, Townsville. Features four operating theatres, one procedure room, 19 day-surgery beds and 26 overnight beds. Construction commenced February 2022. Despite reported disputes in 2024-2025 between fund-through developer Centuria Healthcare and operator partner, works remain active on site as of November 2025 with structural framing and facade installation progressing.
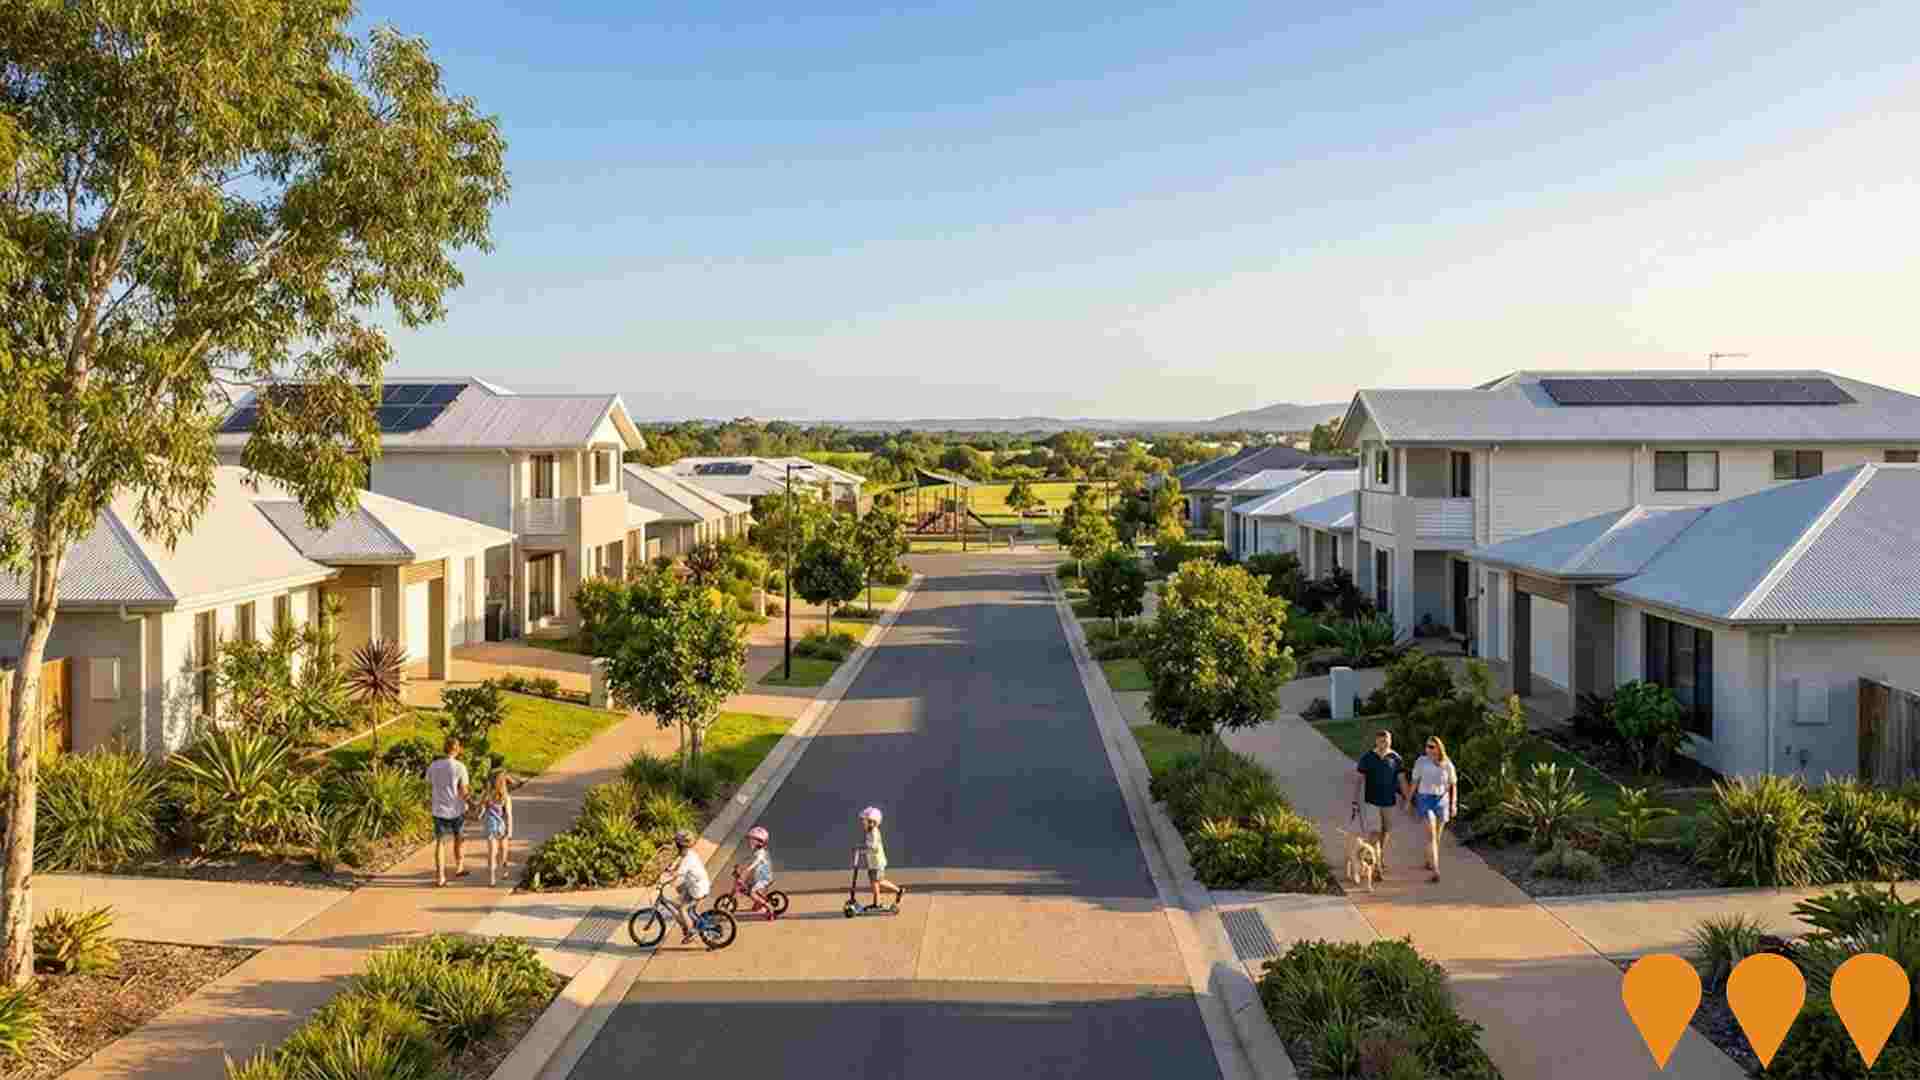
Harris Crossing Estate
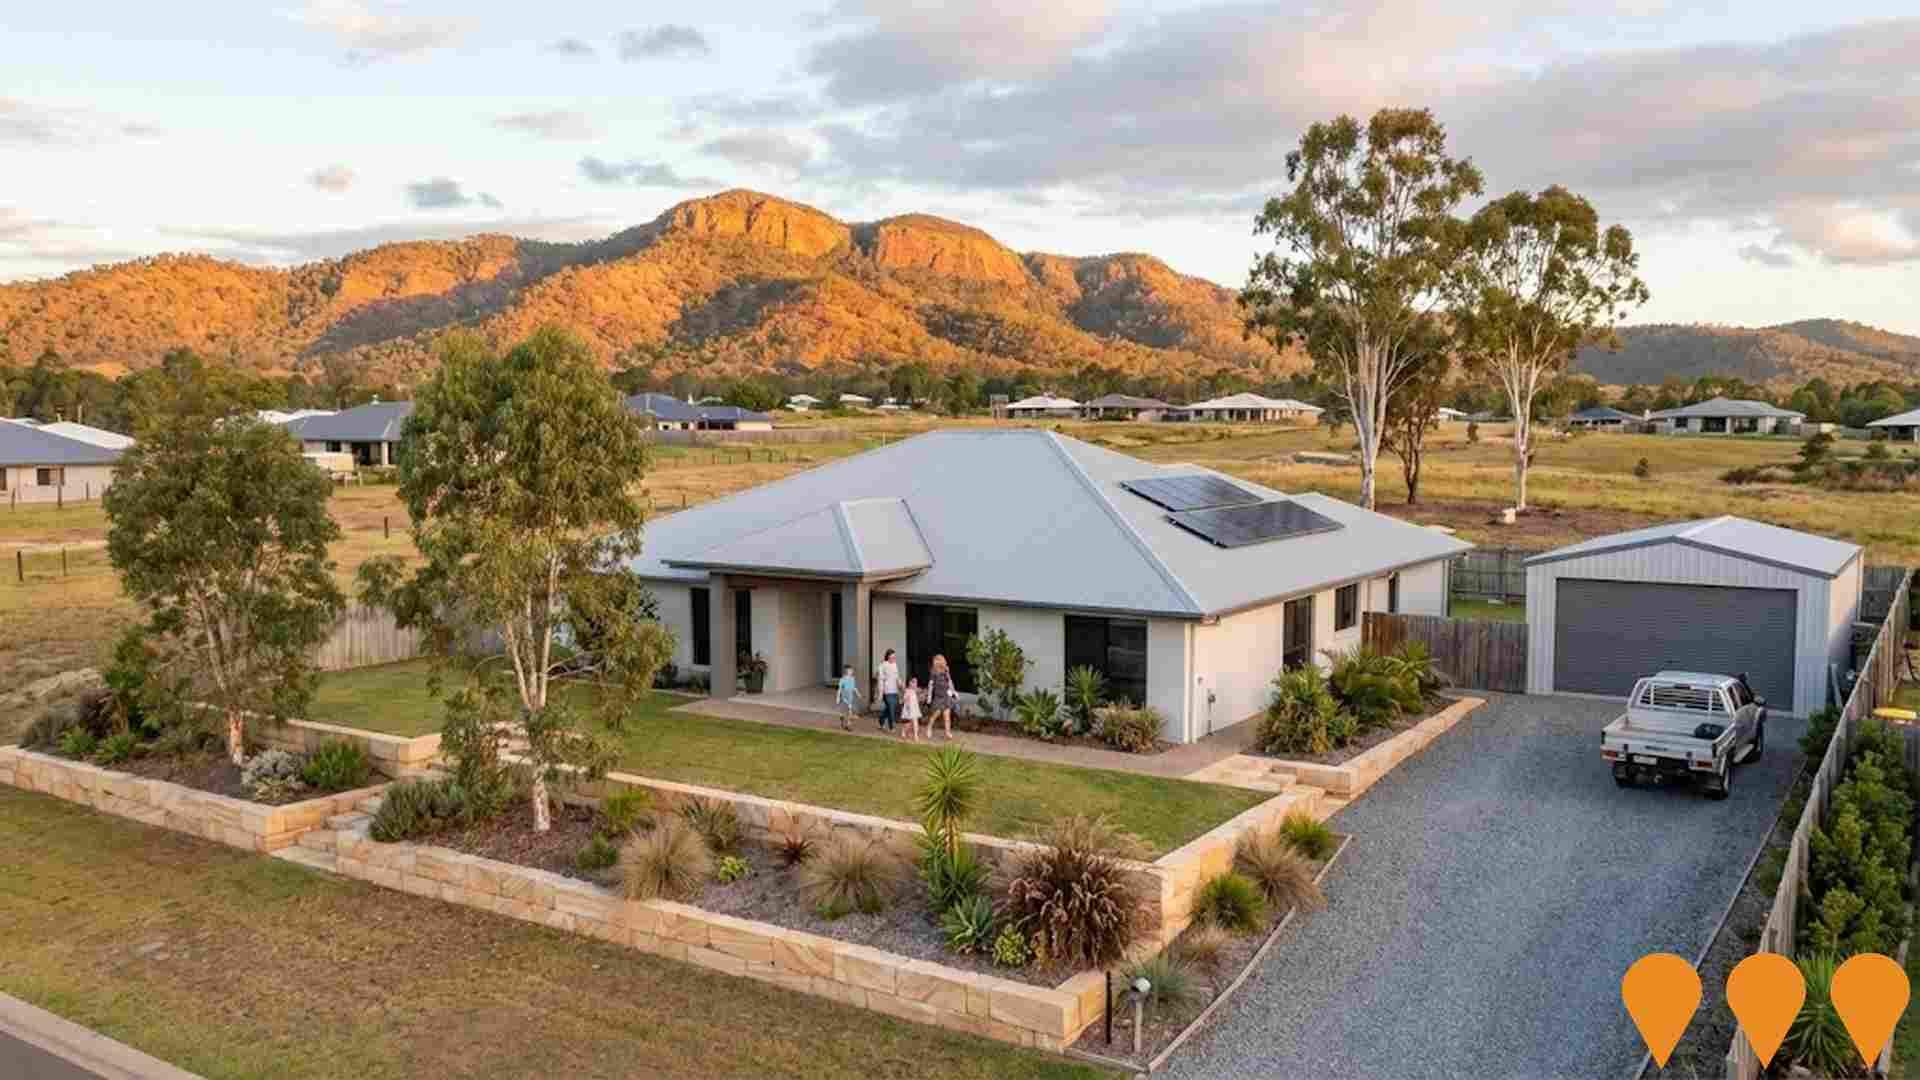
Masterplanned community in Townsville with a total of 800 lots (300m2 to 1280m2) along the Bohle River. Features over 70 hectares of parklands, a playground, and North Queensland's first Disc Golf Course. The estate includes a Display Village and a separate, approved 295-home Living Gems over-50s land lease community (99 Hogarth Drive) that commenced early works in 2025, complementing the family-oriented development. Land lots and house and land packages are currently selling in various releases.
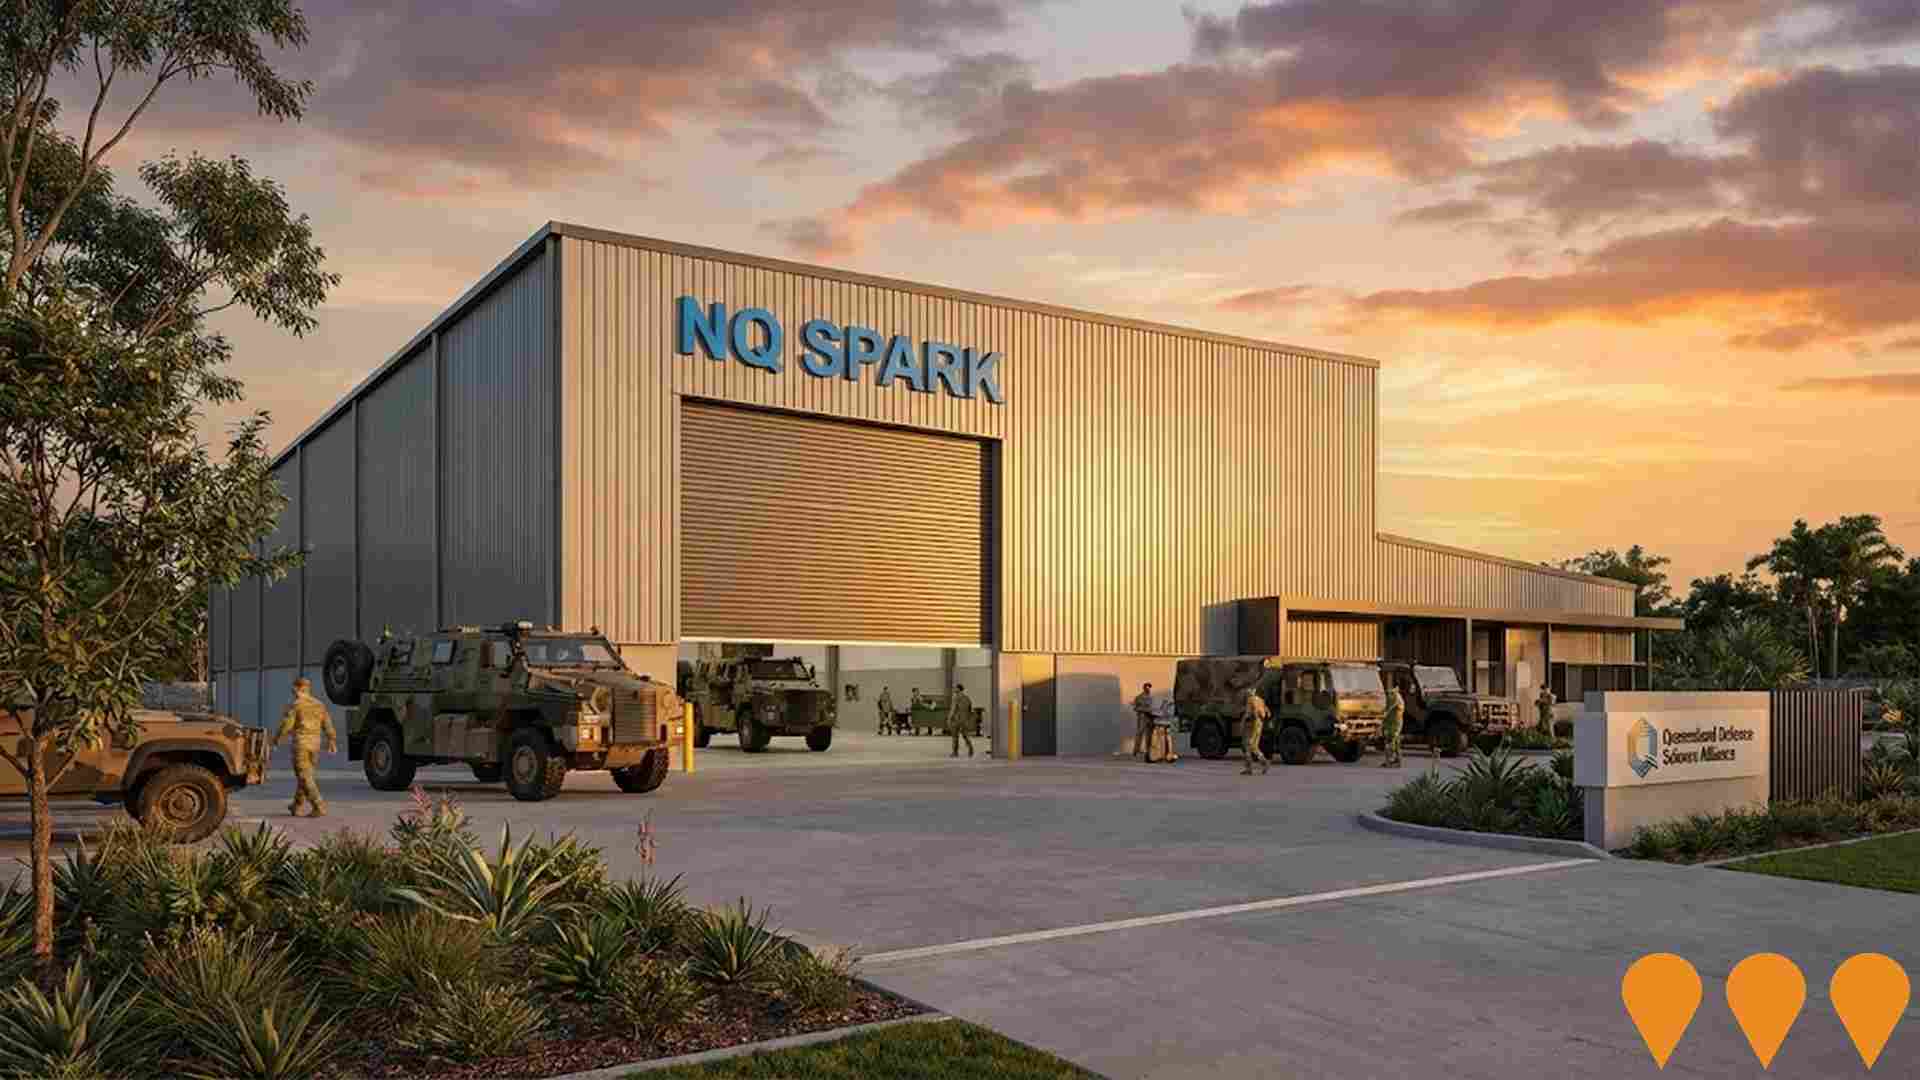
North Queensland Simulation Park (NQ SPARK)
The Advanced Environmental Simulation Facility (AESF) is a simulation innovation hub and technology-oriented collaborative precinct focused on supporting defence, health, medical, science, and technology industries with training, research, and test & evaluation capabilities.
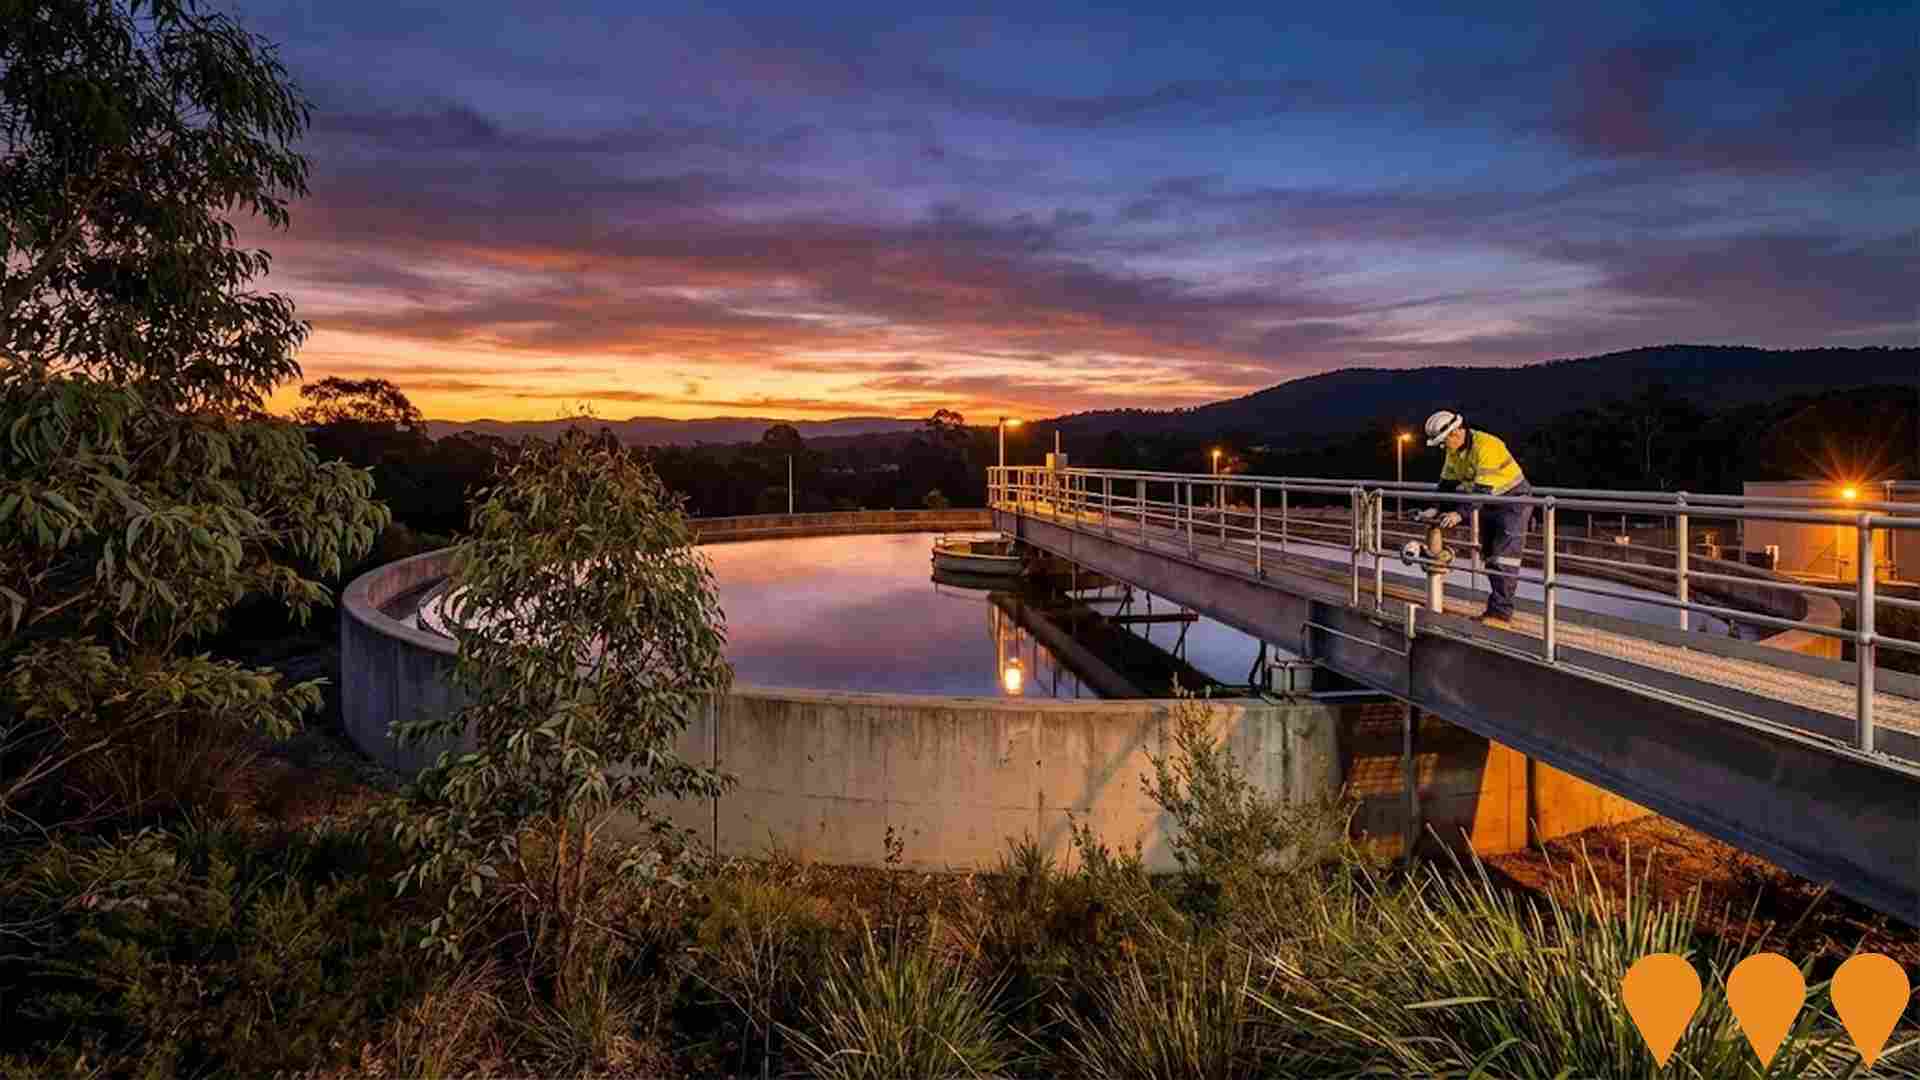
Douglas Water Treatment Plant Clarifiers Upgrade
The project involved the installation of two new clarifiers at the Douglas Water Treatment Plant to double the number of clarifiers, enhancing water treatment capacity during tropical weather events and providing additional water security for Townsvilles growing population. The new infrastructure treats 950 litres per second through Module 3 and 1100 litres per second through Module 4.
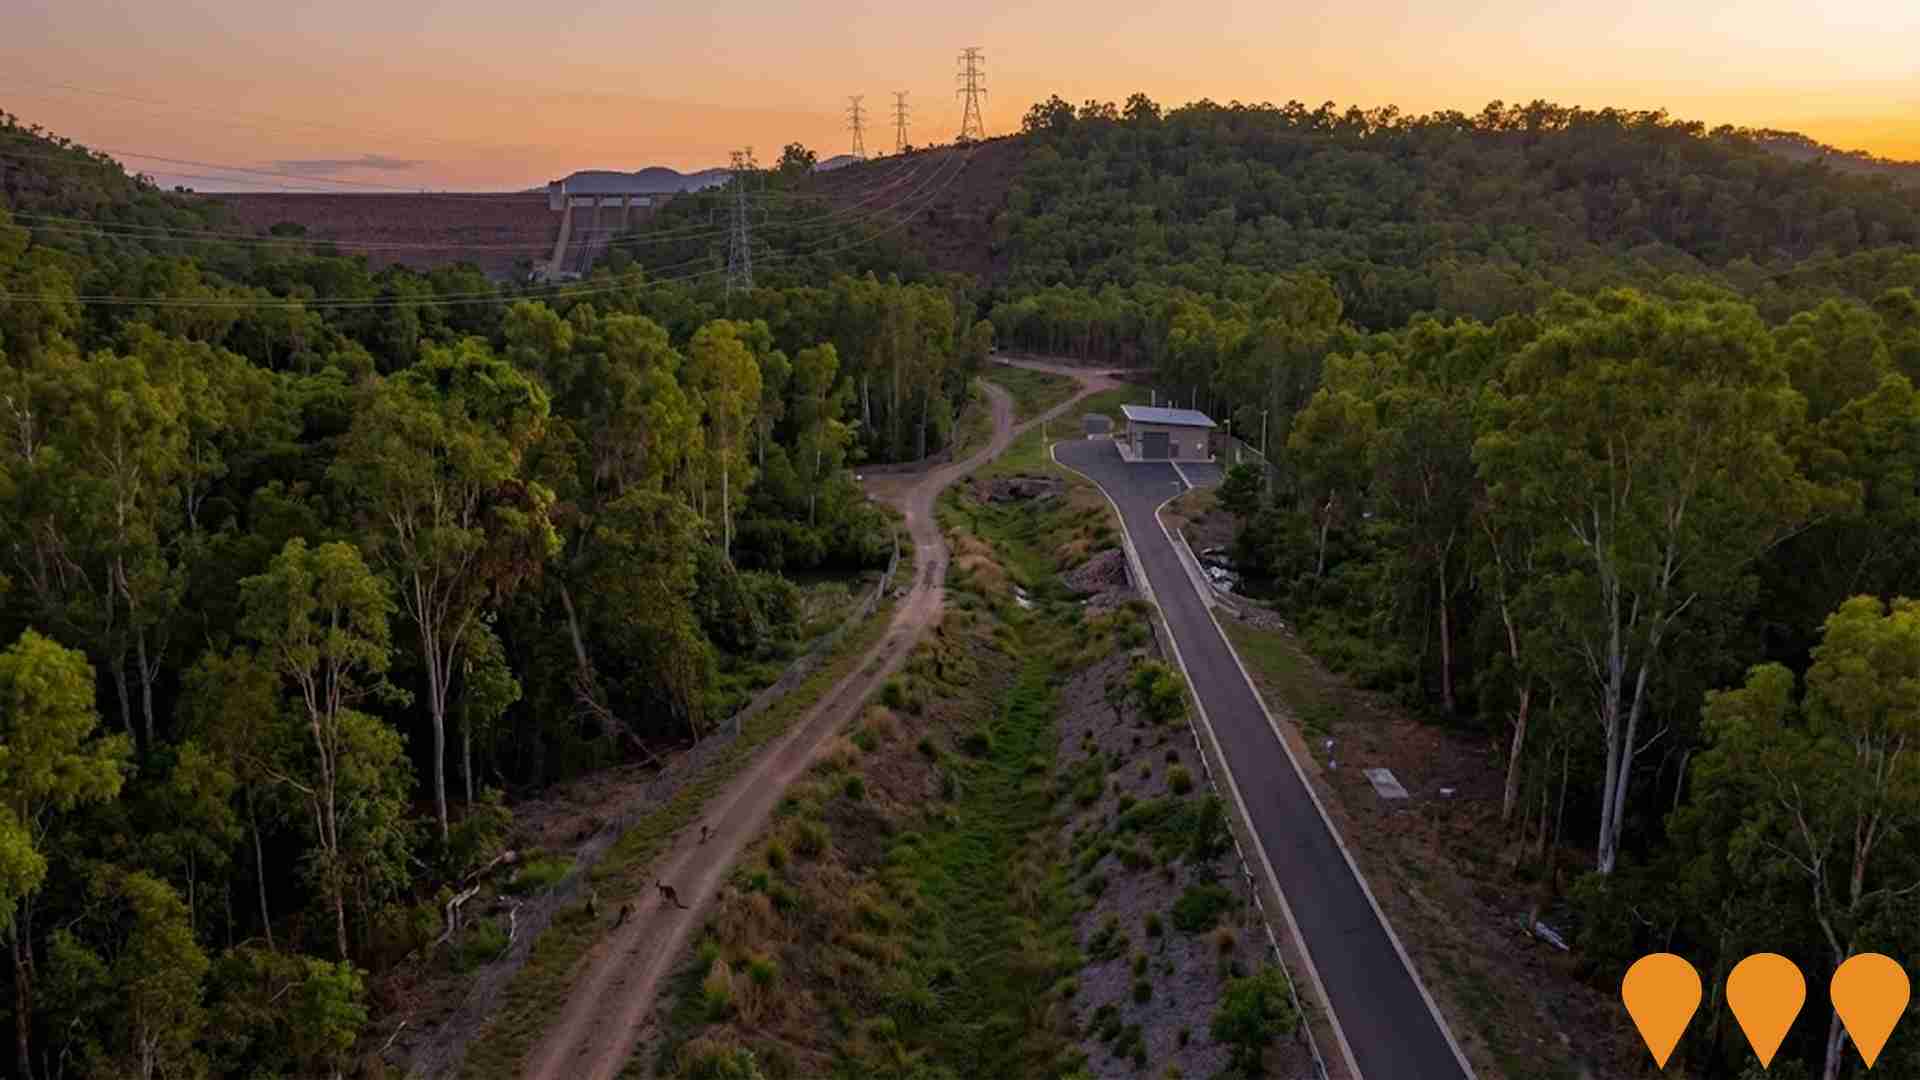
Ross River Dam to Douglas Water Treatment Plant Pipeline Renewal
Renewal and duplication of a 9.5km pipeline connecting Ross River Dam to Douglas Water Treatment Plant, enhancing resilience and water security for Townsville, which supplies approximately 85% of the city's water.
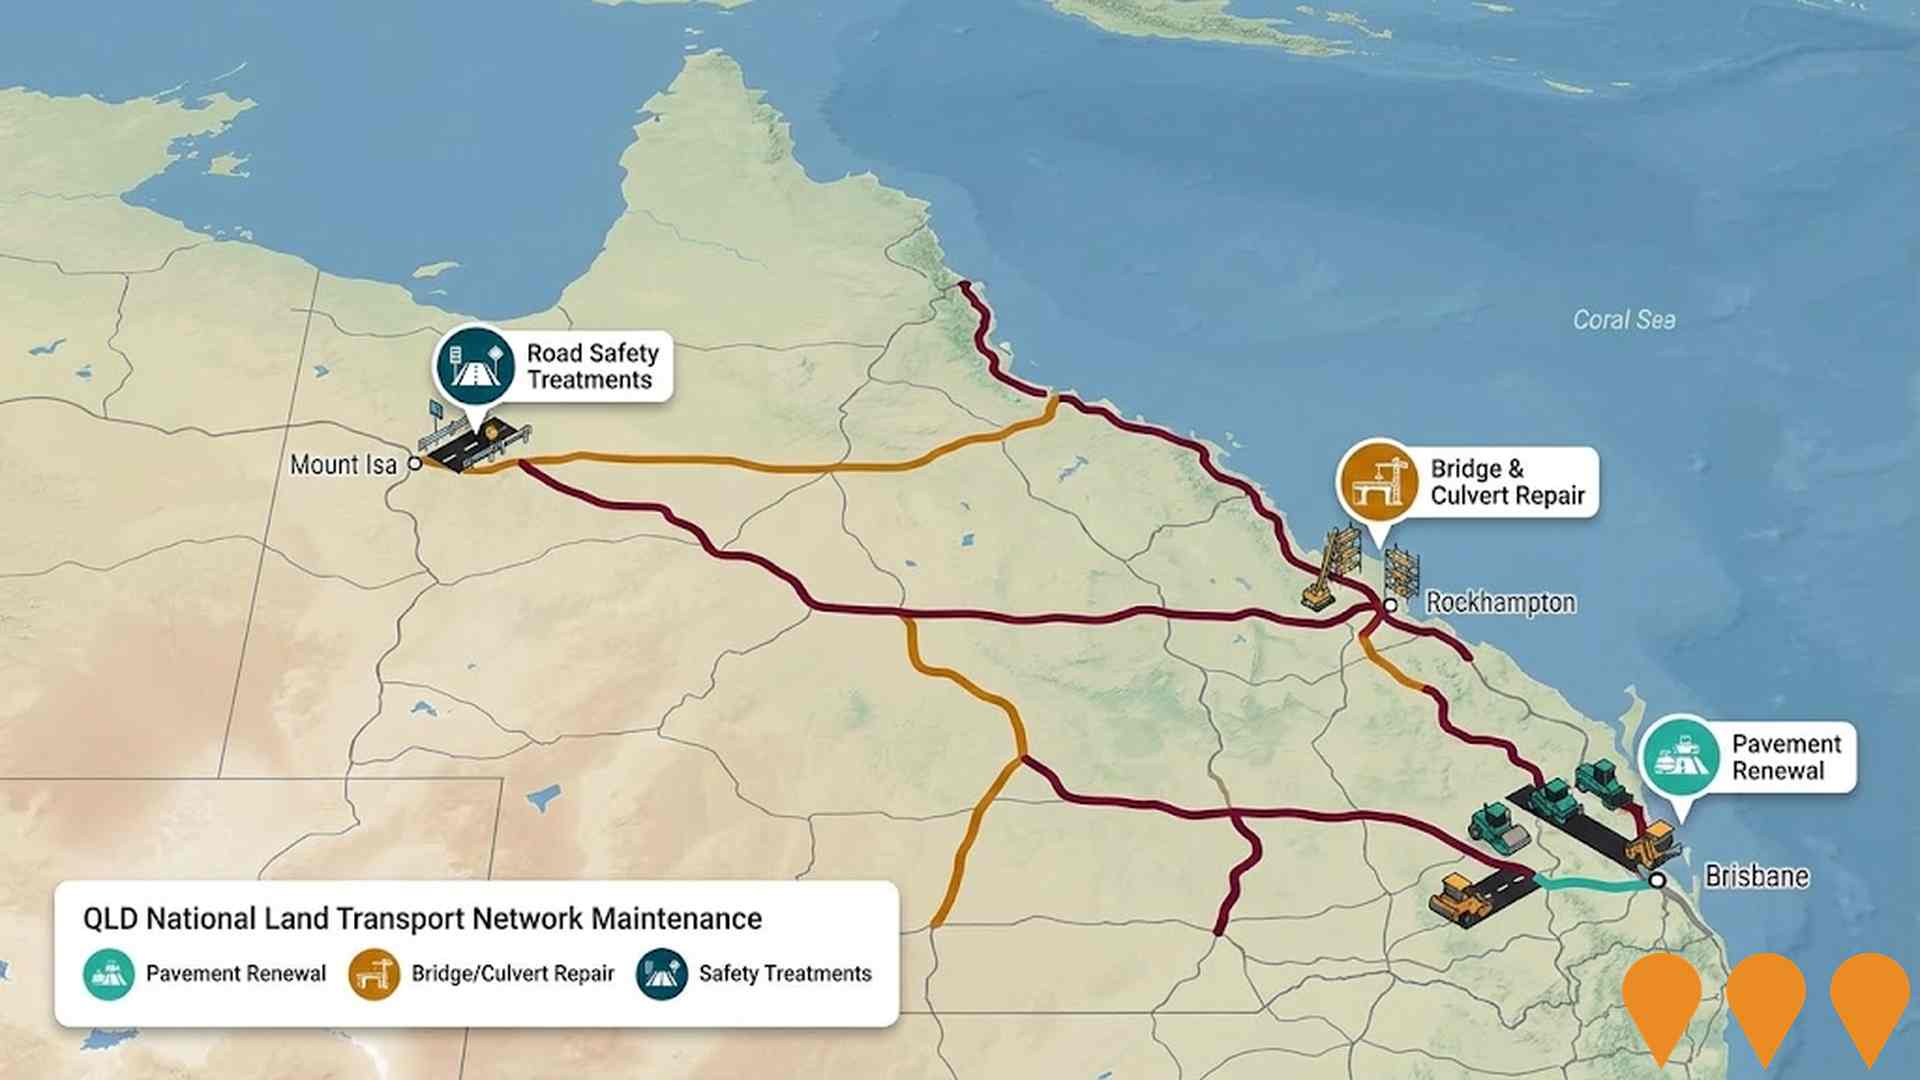
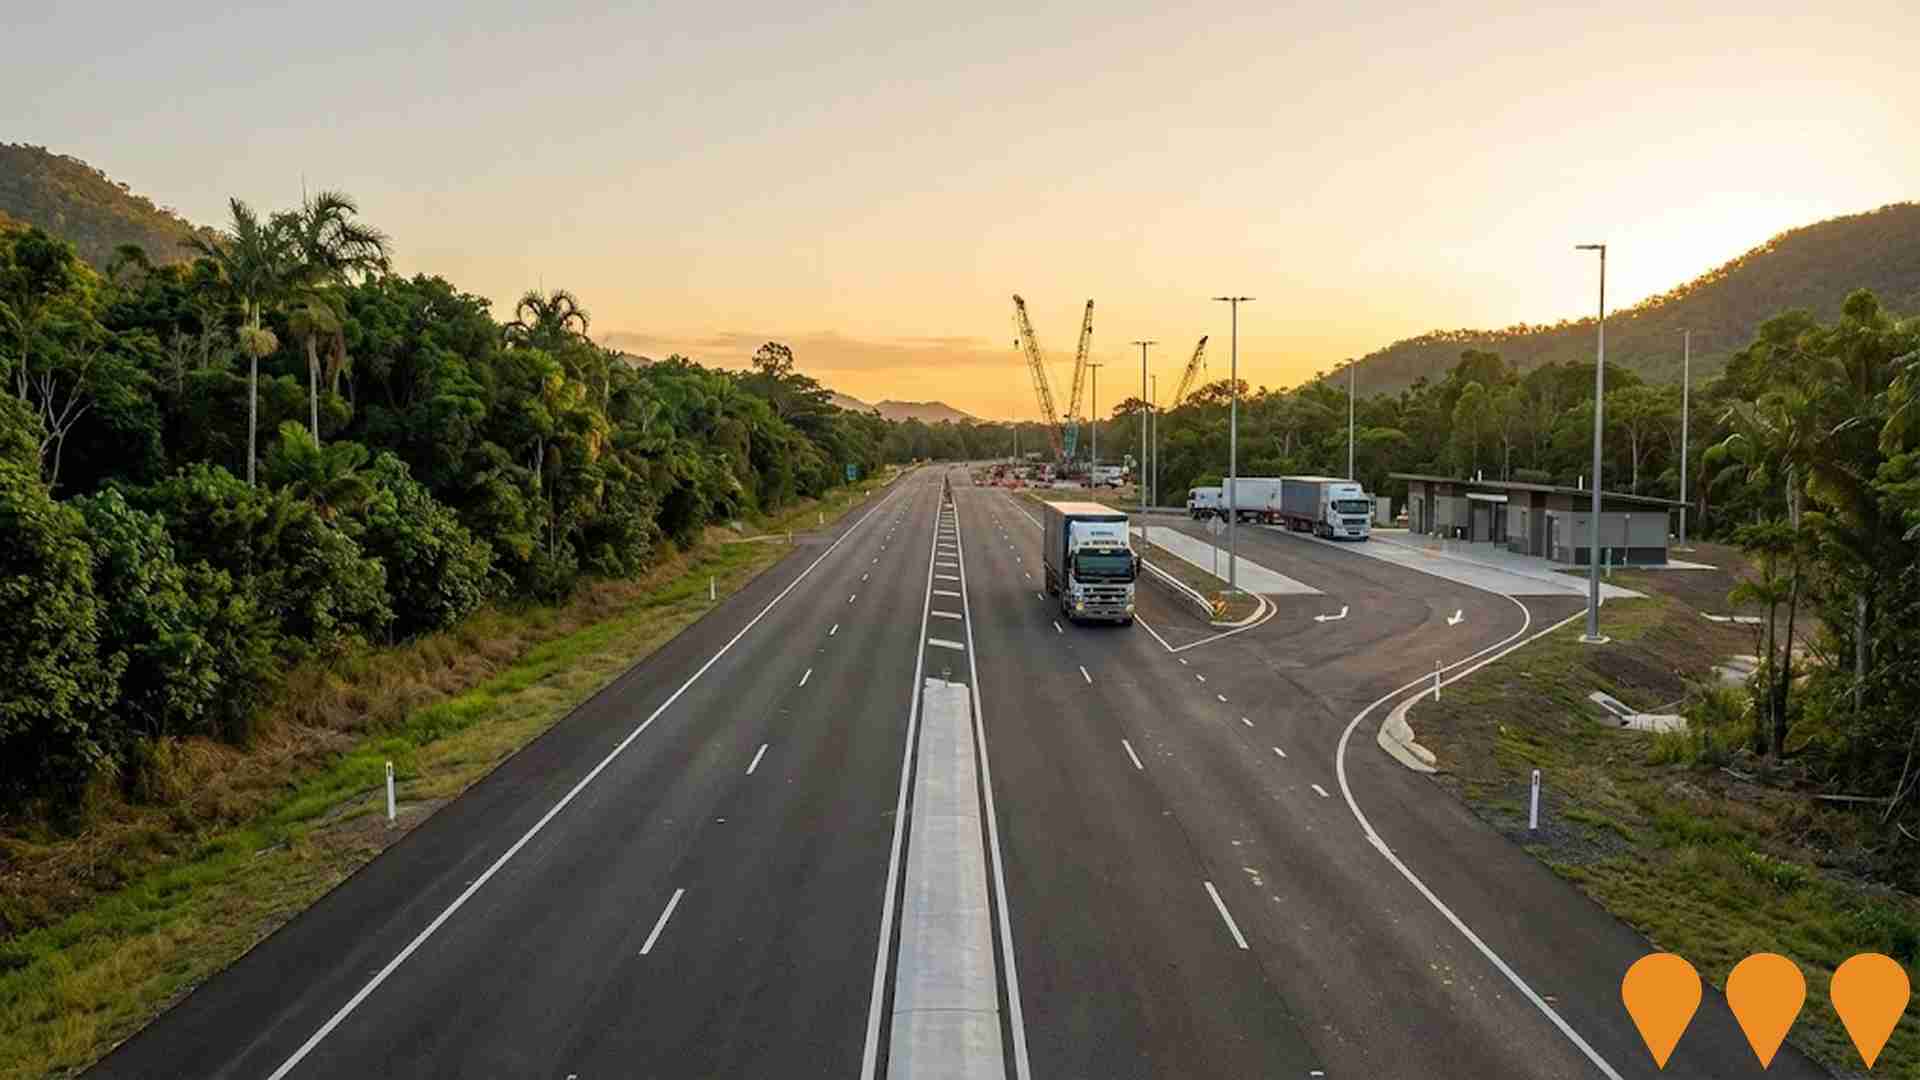
Bruce Highway (Townsville-Ingham) upgrade program
Concurrent upgrades to improve safety and efficiency on the Bruce Highway between Townsville and Ingham. Current scope includes a new northbound overtaking lane between Leichhardt Creek and Lilypond Creek, wide centre line treatments, pavement strengthening near Hencamp Creek, and upgrades to the Christmas Creek rest area (ablutions, turn lanes, heavy vehicle improvements).
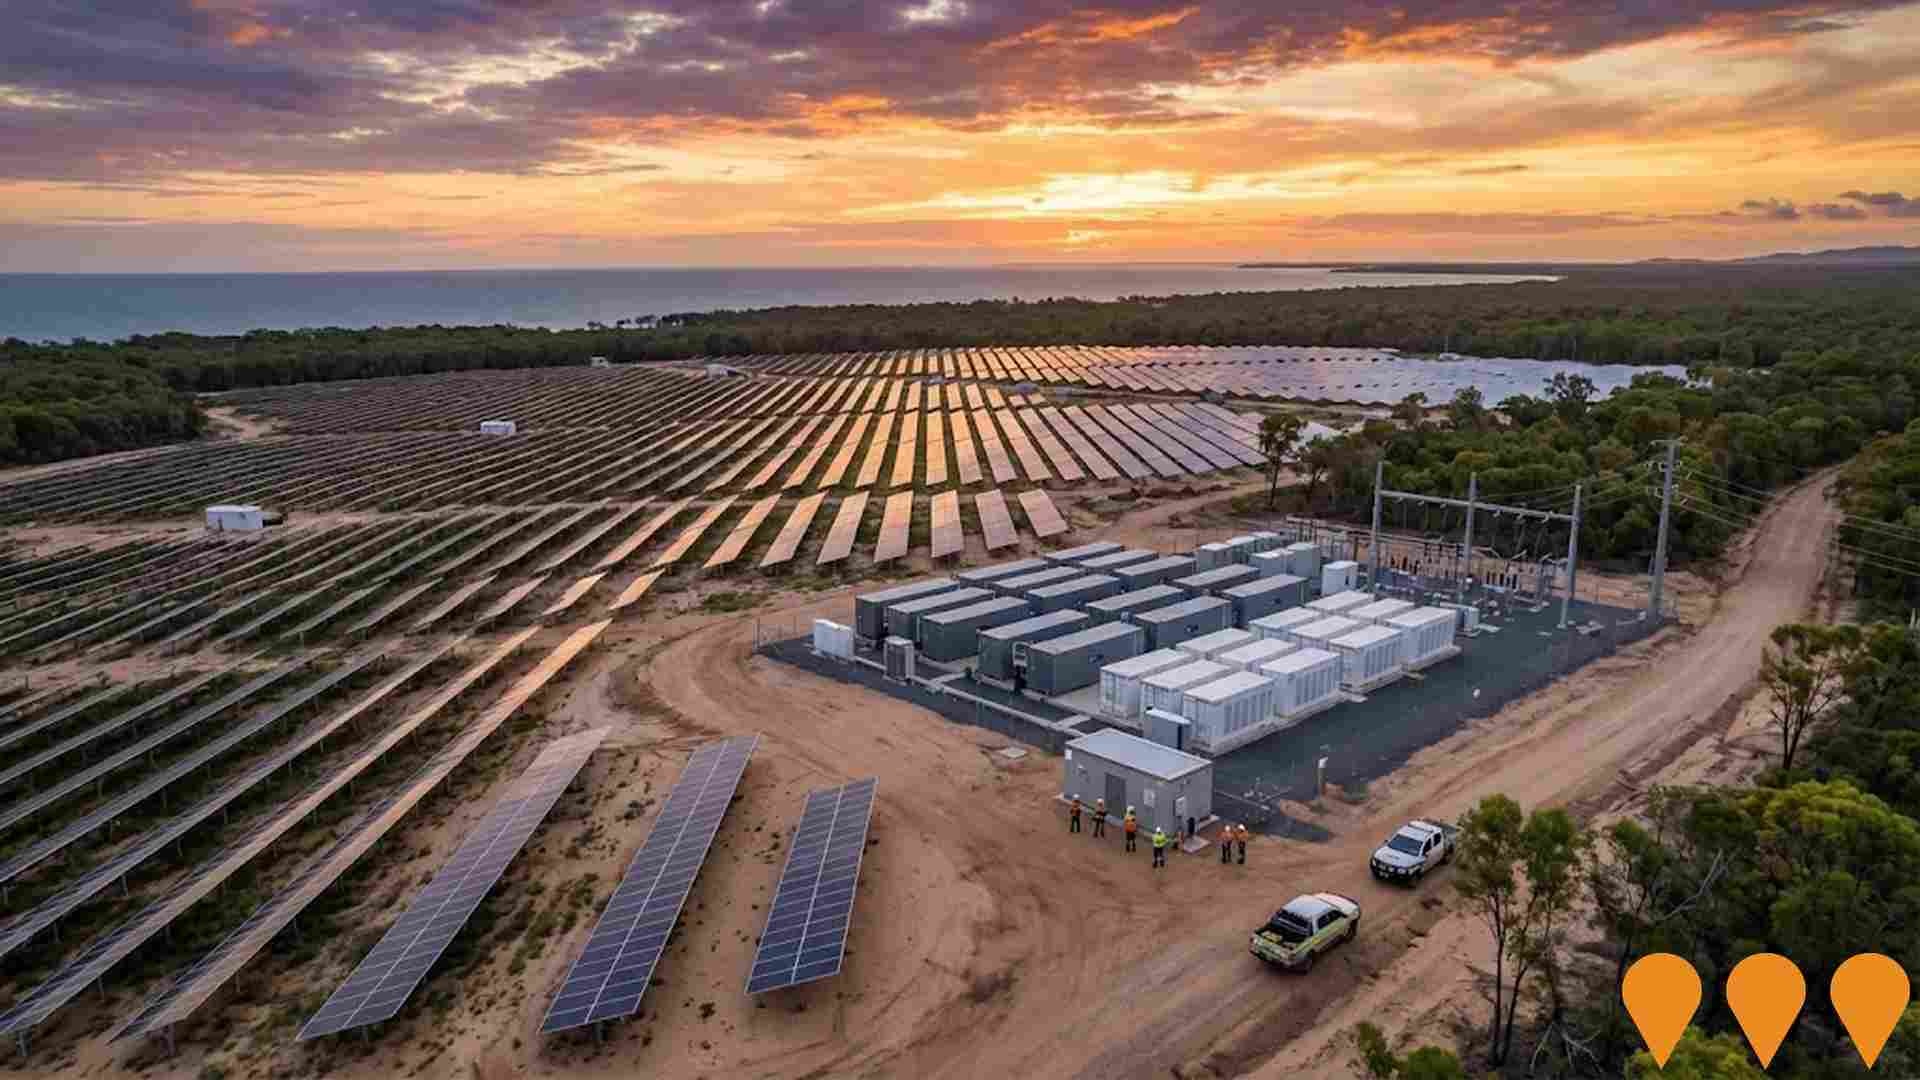
Sunshine State Solar Farm and Battery
A 128MW AC (150MW DC) solar farm with a 128MW/256MWh battery energy storage system on approximately 190 hectares, expected to power 55,000 homes and offset 200,000 tonnes of CO2 annually, contributing to Queensland's renewable energy targets.
Employment
AreaSearch assessment indicates Mundingburra faces employment challenges relative to the majority of Australian markets
Mundingburra has a well-educated workforce with significant representation in essential services sectors. Its unemployment rate is 5.7%.
Over the past year, employment has been relatively stable. As of September 2025, there are 1,567 residents employed, with an unemployment rate of 7.3%, 1.6% higher than Rest of Qld's rate of 4.1%. Workforce participation is lower at 54.6% compared to Rest of Qld's 59.1%. Employment is concentrated in health care & social assistance, education & training, and public administration & safety.
Education & training has a particularly strong presence with an employment share 1.6 times the regional level. Agriculture, forestry & fishing has limited presence at 0.7% compared to the regional level of 4.5%. Many residents commute elsewhere for work based on Census data. Over the year to September 2025, labour force levels increased by 0.2%, while employment decreased by 0.4%, leading to a rise in unemployment rate by 0.6 percentage points. In contrast, Rest of Qld saw employment grow by 1.7% and labour force expand by 2.1%, with unemployment rising by 0.3 percentage points. State-level data as of 25-Nov shows Queensland's employment contracted by 0.01%, losing 1,210 jobs, with the state unemployment rate at 4.2%, closely aligned with the national rate of 4.3%. National employment forecasts from May-25 suggest growth of 6.6% over five years and 13.7% over ten years. Applying these projections to Mundingburra's employment mix indicates local employment should increase by 6.8% over five years and 14.2% over ten years, using a simple weighting extrapolation for illustrative purposes.
Frequently Asked Questions - Employment
Income
Income levels align closely with national averages, indicating typical economic conditions for Australian communities according to AreaSearch analysis
AreaSearch's latest postcode level ATO data for financial year 2022 shows that Mundingburra SA2 has median income of $54,845 and average income of $64,321. This is comparable to national averages but differs from Rest of Qld's median income of $50,780 and average income of $64,844. Based on Wage Price Index growth of 13.99% since financial year 2022, estimated incomes for September 2025 are approximately $62,518 (median) and $73,320 (average). Census 2021 income data ranks Mundingburra modestly in household, family, and personal incomes, between the 23rd and 33rd percentiles. Predominant income cohort spans 27.5% of locals (997 people) in $1,500 - 2,999 category, aligning with metropolitan region at 31.7%. After housing, 85.1% of income remains, ranking at 25th percentile nationally. Mundingburra's SEIFA income ranking places it in the 4th decile.
Frequently Asked Questions - Income
Housing
Mundingburra displays a diverse mix of dwelling types, with above-average rates of outright home ownership
Mundingburra's dwelling structure, as per the latest Census, consisted of 64.7% houses and 35.2% other dwellings (semi-detached, apartments, 'other' dwellings). This compares to Non-Metro Qld's 81.3% houses and 18.7% other dwellings. Home ownership in Mundingburra was at 32.8%, with mortgaged dwellings at 32.5% and rented ones at 34.7%. The median monthly mortgage repayment was $1,413, lower than Non-Metro Qld's average of $1,517. The median weekly rent in Mundingburra was $270, compared to Non-Metro Qld's $305. Nationally, Mundingburra's mortgage repayments were significantly lower at $1,413 than the Australian average of $1,863, while rents were substantially below the national figure of $375.
Frequently Asked Questions - Housing
Household Composition
Mundingburra features high concentrations of lone person households, with a lower-than-average median household size
Family households account for 58.6% of all households, including 21.7% couples with children, 23.6% couples without children, and 11.3% single parent families. Non-family households constitute the remaining 41.4%, with lone person households at 39.0% and group households comprising 2.8%. The median household size is 2.2 people, which is smaller than the Rest of Qld average of 2.5.
Frequently Asked Questions - Households
Local Schools & Education
Educational attainment in Mundingburra aligns closely with national averages, showing typical qualification patterns and performance metrics
The area's educational profile is notable regionally with university qualification rates at 28.4% for residents aged 15+, surpassing the SA4 region average of 20.1% and the Rest of Qld figure of 20.6%. Bachelor degrees are most prevalent at 19.8%, followed by postgraduate qualifications (5.7%) and graduate diplomas (2.9%). Vocational credentials are held by 34.3% of residents aged 15+, with advanced diplomas accounting for 10.1% and certificates for 24.2%.
Educational participation is high at 31.6%, including secondary education (12.6%), primary education (9.3%), and tertiary education (5.2%).
Frequently Asked Questions - Education
Schools Detail
Nearby Services & Amenities
Transport
Transport servicing is moderate compared to other areas nationally based on assessment of service frequency, route connectivity and accessibility
The analysis of public transport in Mundingburra shows that there are 16 active transport stops currently operating. These stops serve a mix of bus routes, with a total of 5 individual routes providing service to the area. The combined weekly passenger trips across these routes amount to 749.
Residents in Mundingburra have good access to public transport, with an average distance of 281 meters to the nearest transport stop. The service frequency averages 107 trips per day across all routes, which equates to approximately 46 weekly trips per individual stop.
Frequently Asked Questions - Transport
Transport Stops Detail
Health
Health performance in Mundingburra is well below average with a range of health conditions having marked impacts on both younger and older age cohorts
Mundingburra faces significant health challenges, as indicated by its health data.
A variety of health conditions affect both younger and older age groups in the area. The rate of private health cover is approximately 52%, which is higher than the average SA2 area. The most prevalent medical conditions are arthritis and mental health issues, affecting 9.7% and 9.7% of residents respectively. Conversely, 63.4% of residents report having no medical ailments, compared to 67.8% in Rest of Qld. Mundingburra has a higher proportion of seniors aged 65 and over, at 22.4% (811 people), than the 14.9% seen in Rest of Qld. The health outcomes among seniors present some challenges, generally mirroring those of the broader population's health profile.
Frequently Asked Questions - Health
Cultural Diversity
Mundingburra ranks below the Australian average when compared to other local markets across a number of language and cultural background related metrics
Mundingburra had a low level of cultural diversity, with 87.6% of its residents being citizens, 82.7% born in Australia, and 90.6% speaking English only at home. Christianity was the predominant religion in Mundingburra, accounting for 55.7% of the population, compared to 52.7% across the rest of Queensland. The top three ancestral groups were English (28.5%), Australian (25.8%), and Irish (10.0%).
Notably, Scottish ancestry was higher than average at 8.4%, while German was 4.1% and Australian Aboriginal was 3.4%.
Frequently Asked Questions - Diversity
Age
Mundingburra's median age exceeds the national pattern
The median age in Mundingburra was close to Rest of Qld's average of 41 years in 2021, both figures being well above Australia's median age of 38 years. The percentage of people aged 85 and over was notably higher in Mundingburra at 5.0%, compared to the Rest of Qld average. Conversely, the percentage of people aged 65 to 74 was lower in Mundingburra at 8.7%. Between the 2016 Census and the 2021 Census, the population aged 25 to 34 grew from 9.5% to 11.9%, while the 0 to 4 age group increased from 3.4% to 4.5%. During this period, the percentage of people aged 5 to 14 decreased from 13.6% to 11.3%, and the 85+ cohort dropped from 6.2% to 5.0%. Population forecasts for Mundingburra in 2041 indicate significant demographic changes. The 25 to 34 age group is projected to expand by 108 people, increasing from 433 to 542. Meanwhile, the 45 to 54 and 65 to 74 age cohorts are expected to experience population declines.
