Chart Color Schemes
This analysis uses ABS Statistical Areas Level 2 (SA2) boundaries, which can materially differ from Suburbs and Localities (SAL) even when sharing similar names.
SA2 boundaries are defined by the Australian Bureau of Statistics and are designed to represent communities for statistical reporting (e.g., census and ERP).
Suburbs and Localities (SAL) represent commonly-used suburb/locality names (postal-style areas) and may use different geographic boundaries. For comprehensive analysis, consider reviewing both boundary types if available.
est. as @ -- *
ABS ERP | -- people | --
2021 Census | -- people
Sales Activity
Curious about local property values? Filter the chart to assess the volume and appreciation (including resales) trends and regional comparisons, or scroll to the map below view this information at an individual property level.
Find a Recent Sale
Sales Detail
Population
Tumbarumba is positioned among the lower quartile of areas assessed nationally for population growth based on AreaSearch's assessment of recent, and medium term trends
Tumbarumba's population is approximately 3,613 as of November 2025. This represents an increase of 91 people since the 2021 Census, which recorded a population of 3,522. The change is inferred from the estimated resident population of 3,544 in June 2024 and an additional 62 validated new addresses since the Census date. This results in a population density ratio of 0.80 persons per square kilometer. Tumbarumba's growth rate of 2.6% since the 2021 census exceeded the SA3 area's growth rate of 2.1%. Overseas migration contributed approximately 93.8% of overall population gains during recent periods.
AreaSearch uses ABS/Geoscience Australia projections for each SA2 area, released in 2024 with a base year of 2022. For areas not covered by this data, AreaSearch utilises NSW State Government's SA2 level projections, released in 2022 with a base year of 2021. Growth rates by age group from these aggregations are applied to all areas for years 2032 to 2041. Projections indicate an overall population decline of 11 persons by 2041, but growth is anticipated in specific age cohorts, notably the 75 to 84 age group which is projected to expand by 82 people.
Frequently Asked Questions - Population
Development
AreaSearch assessment of residential development drivers sees a low level of activity in Tumbarumba, placing the area among the bottom 25% of areas assessed nationally
Tumbarumba has received approximately 12 dwelling approvals annually. Over the past five financial years, from FY-21 to FY-25, a total of 63 homes were approved, with an additional 2 approved in FY-26 so far. On average, each year brought about 0.6 new residents per dwelling constructed during these five years.
This pace suggests that new construction is keeping up with or exceeding demand, providing more options for buyers and potentially driving population growth beyond current projections. The average expected construction cost of new homes was $295,000. In FY-26, commercial development approvals totaled $7.0 million, indicating Tumbarumba's primarily residential nature. Comparatively, Tumbarumba has seen somewhat higher construction activity than the rest of NSW over the past five years, with a 15% increase per capita.
This balance supports buyer choice while maintaining current property values, although building activity has slowed in recent years. Notably, this level remains below the national average, reflecting Tumbarumba's established character and suggesting potential planning constraints. All recent development in Tumbarumba has consisted of detached houses, preserving its low-density nature and attracting space-seeking buyers. As of now, there are an estimated 737 people per dwelling approval in the area, indicating a quiet, low-activity development environment. With population projections showing stability or decline, housing demand pressures in Tumbarumba are expected to remain reduced, benefiting potential buyers.
Frequently Asked Questions - Development
Infrastructure
Tumbarumba has strong levels of nearby infrastructure activity, ranking in the top 40% nationally
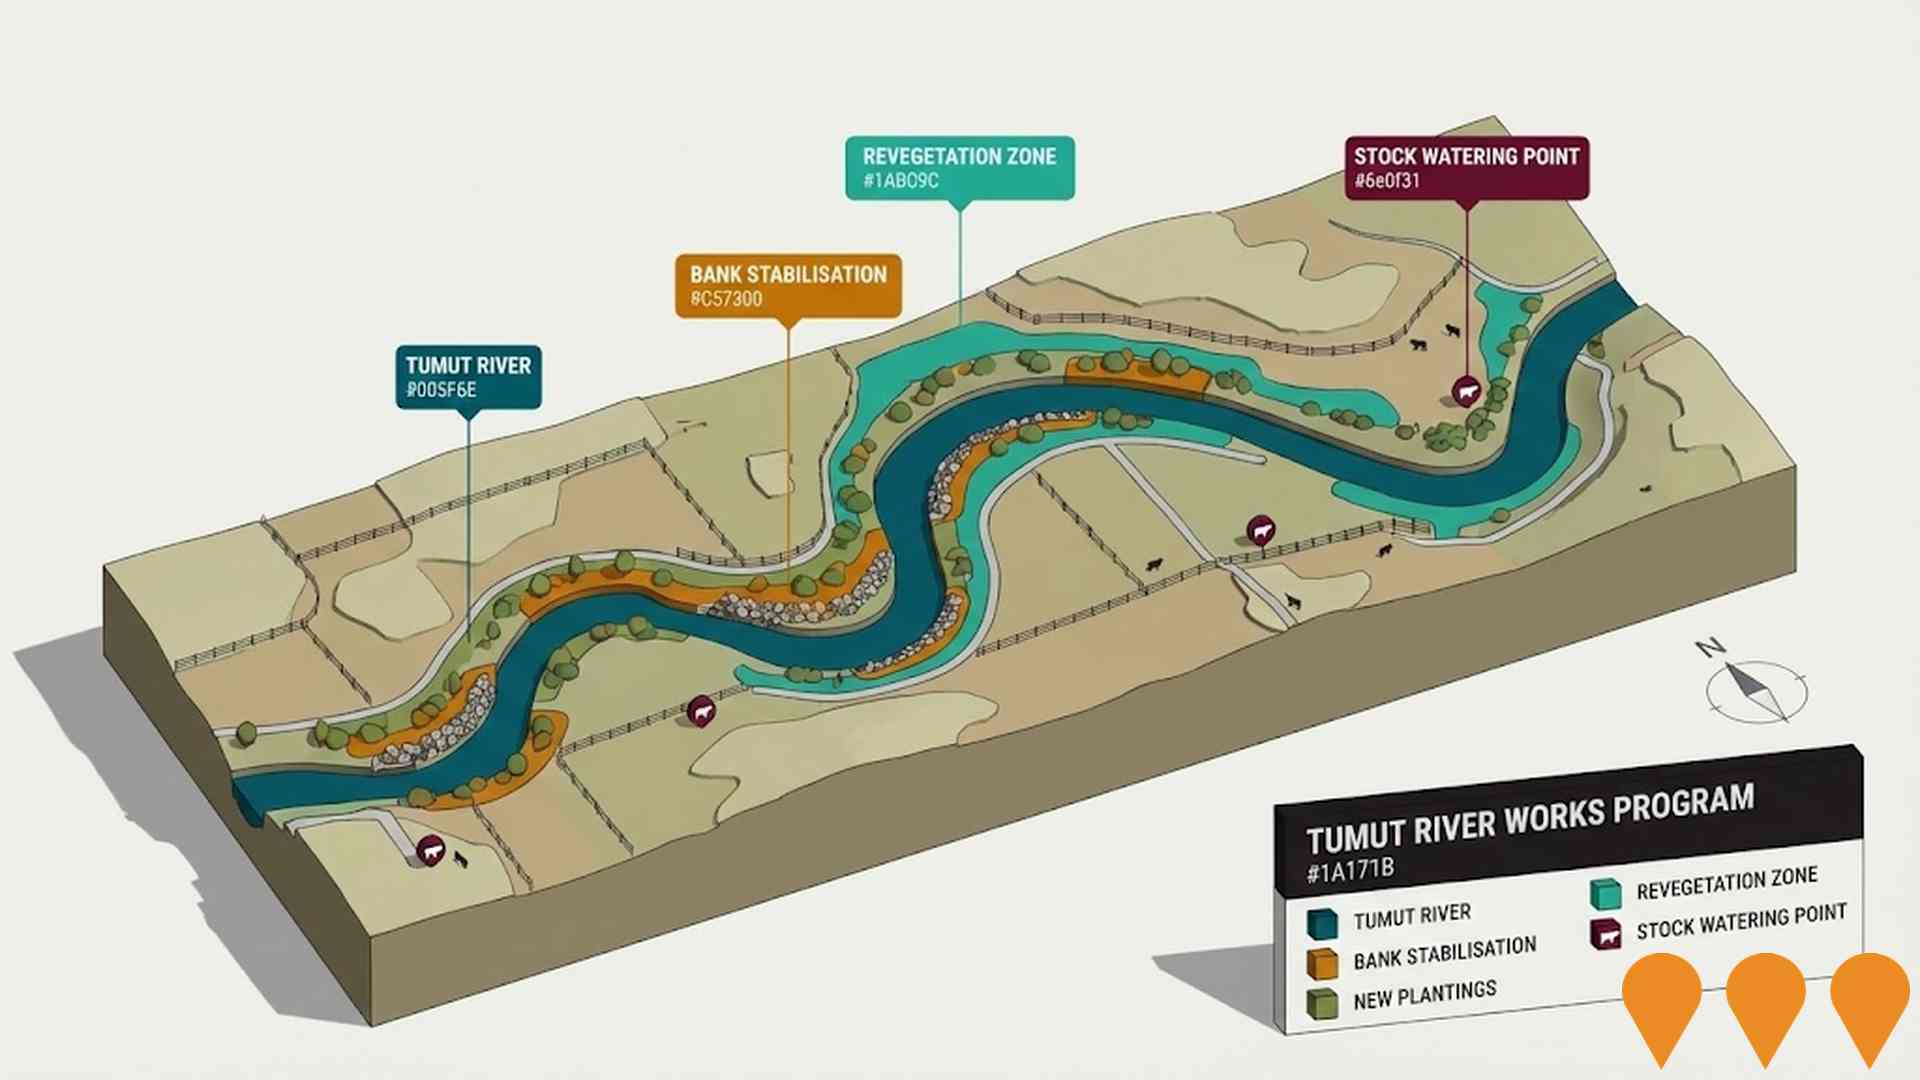
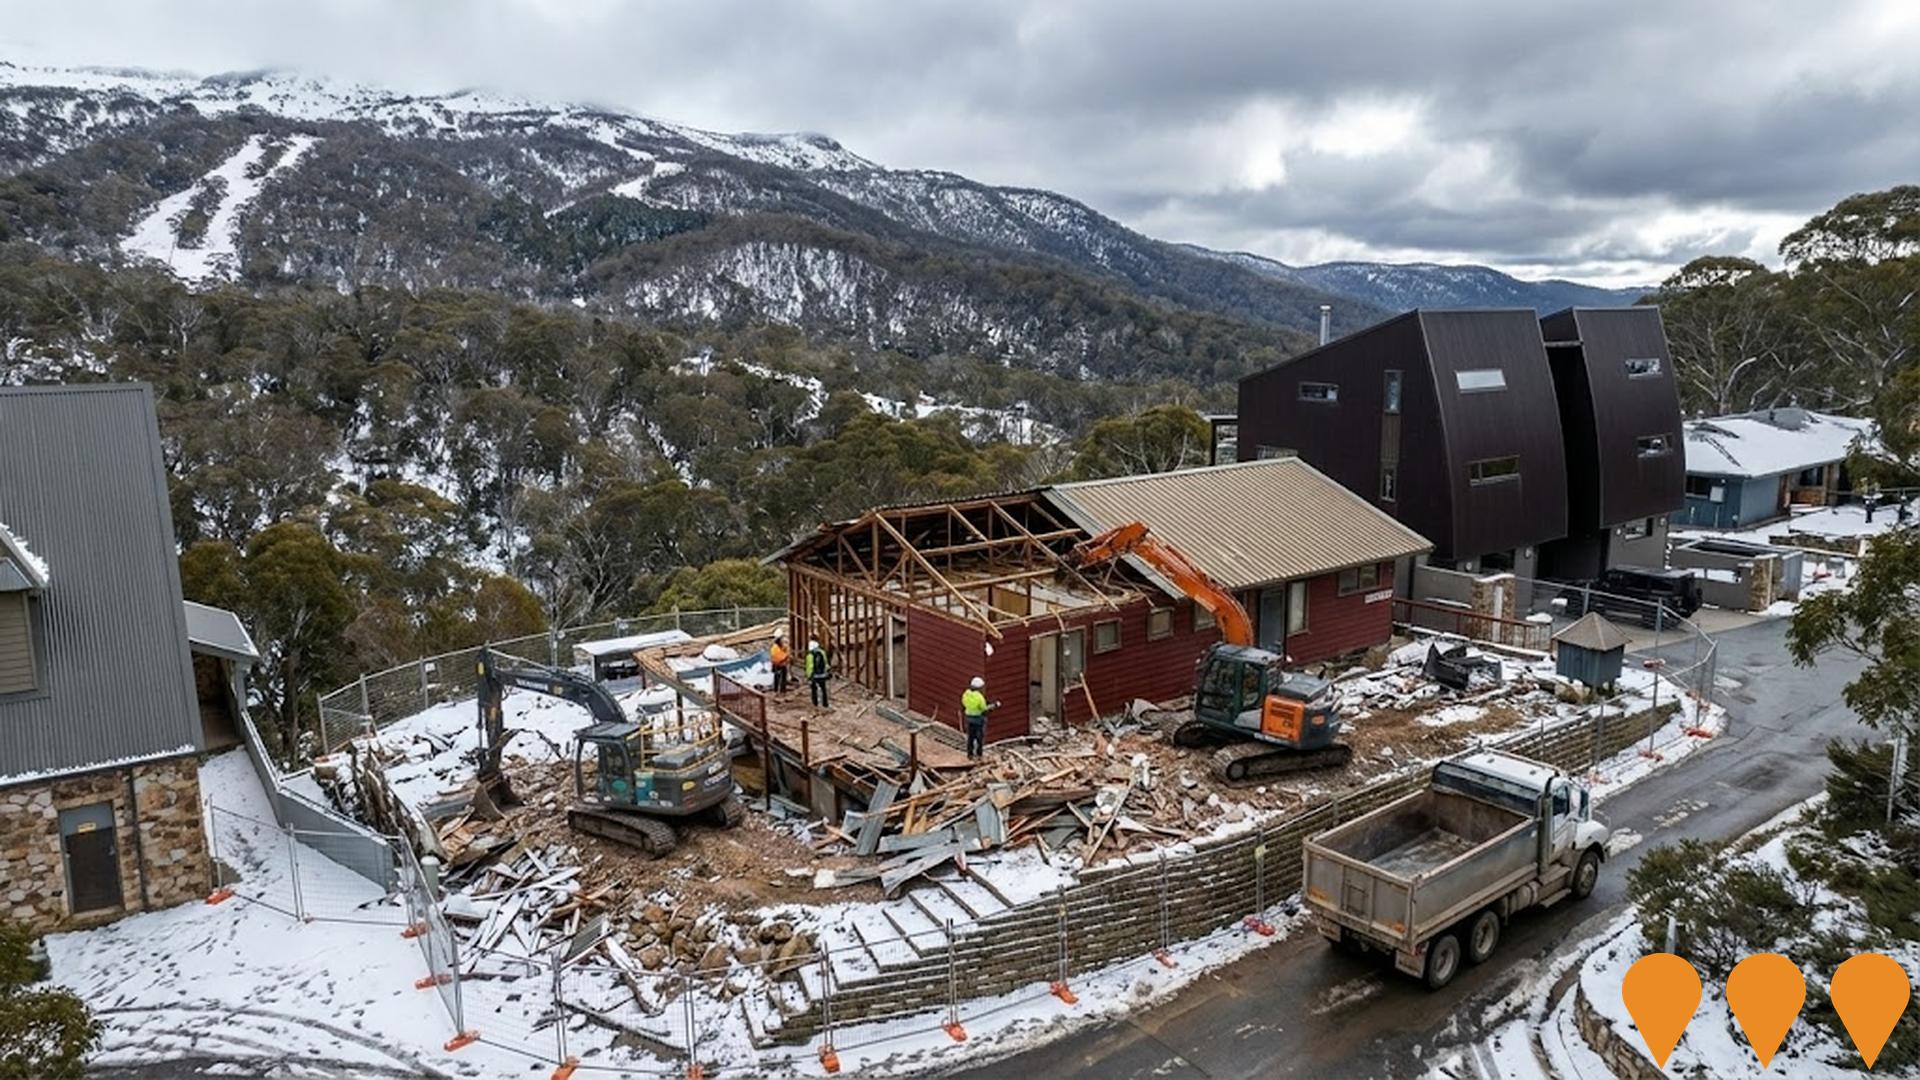
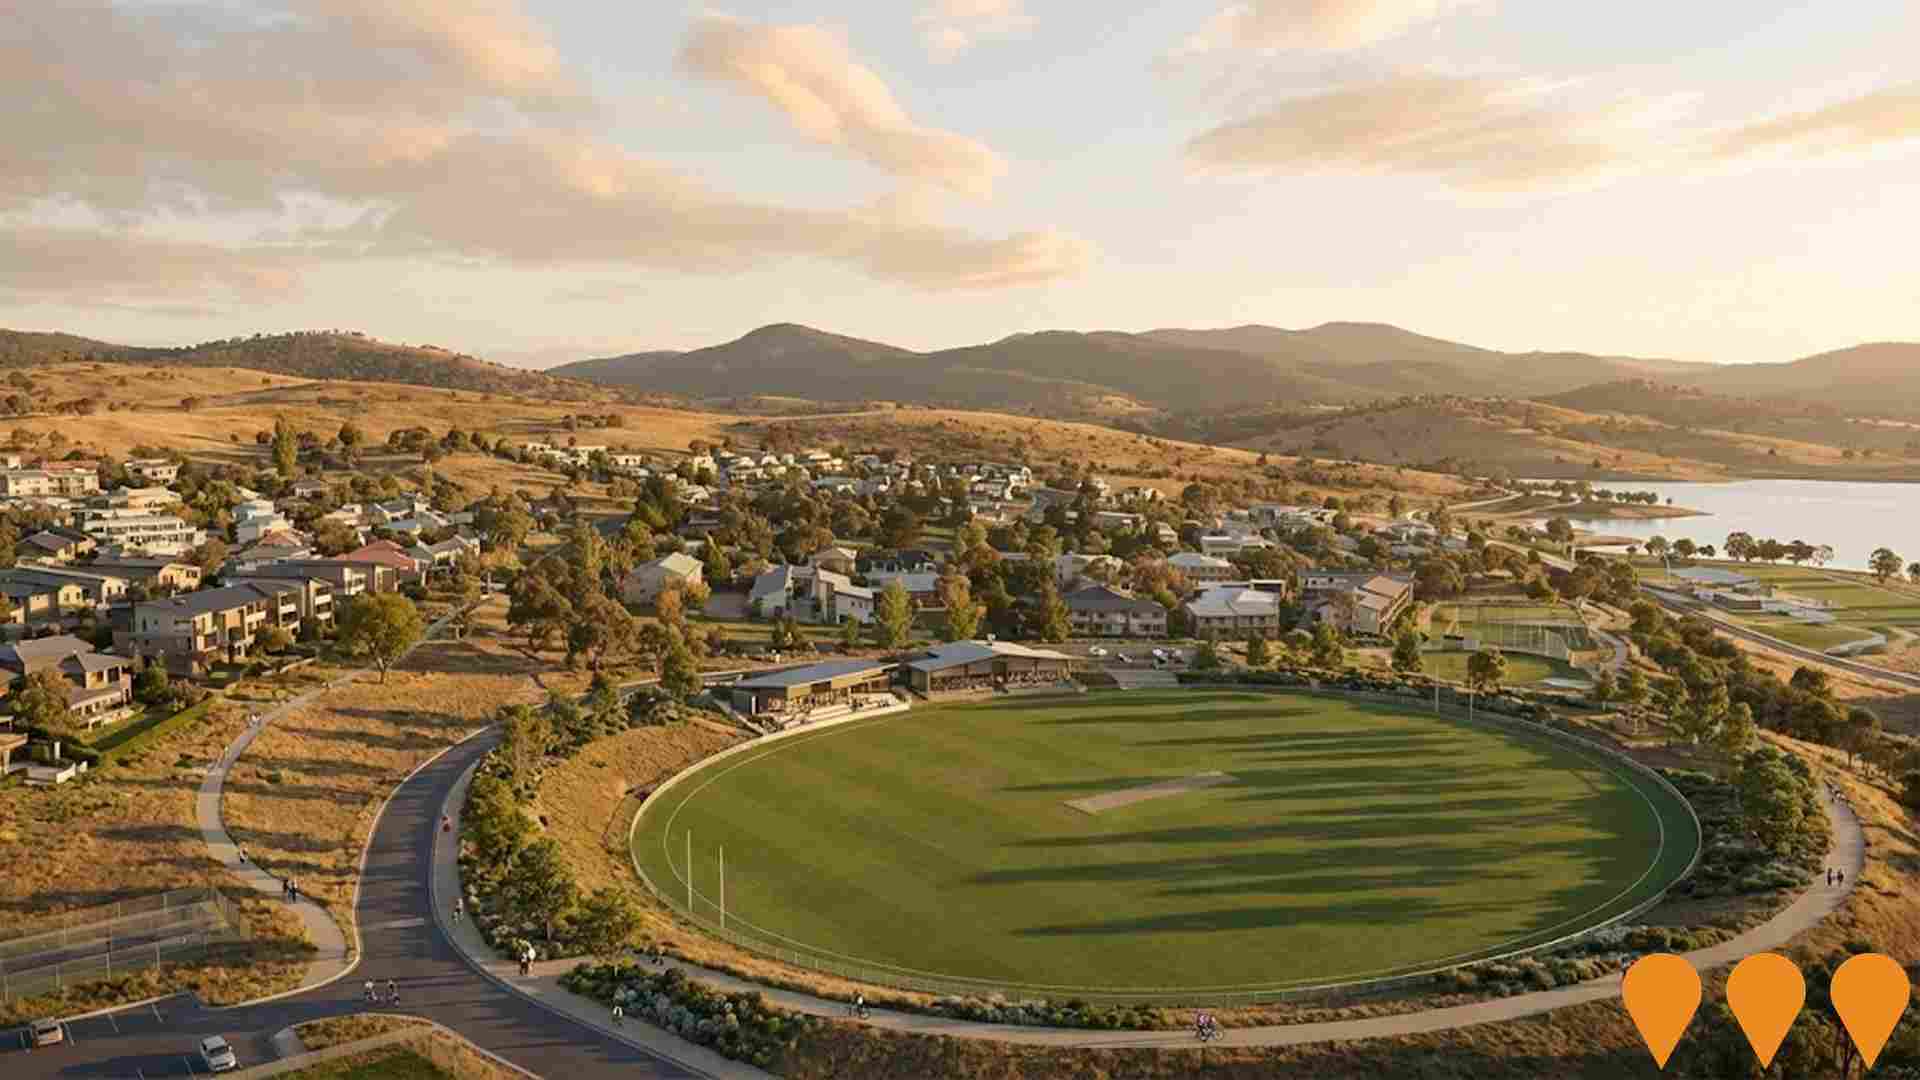
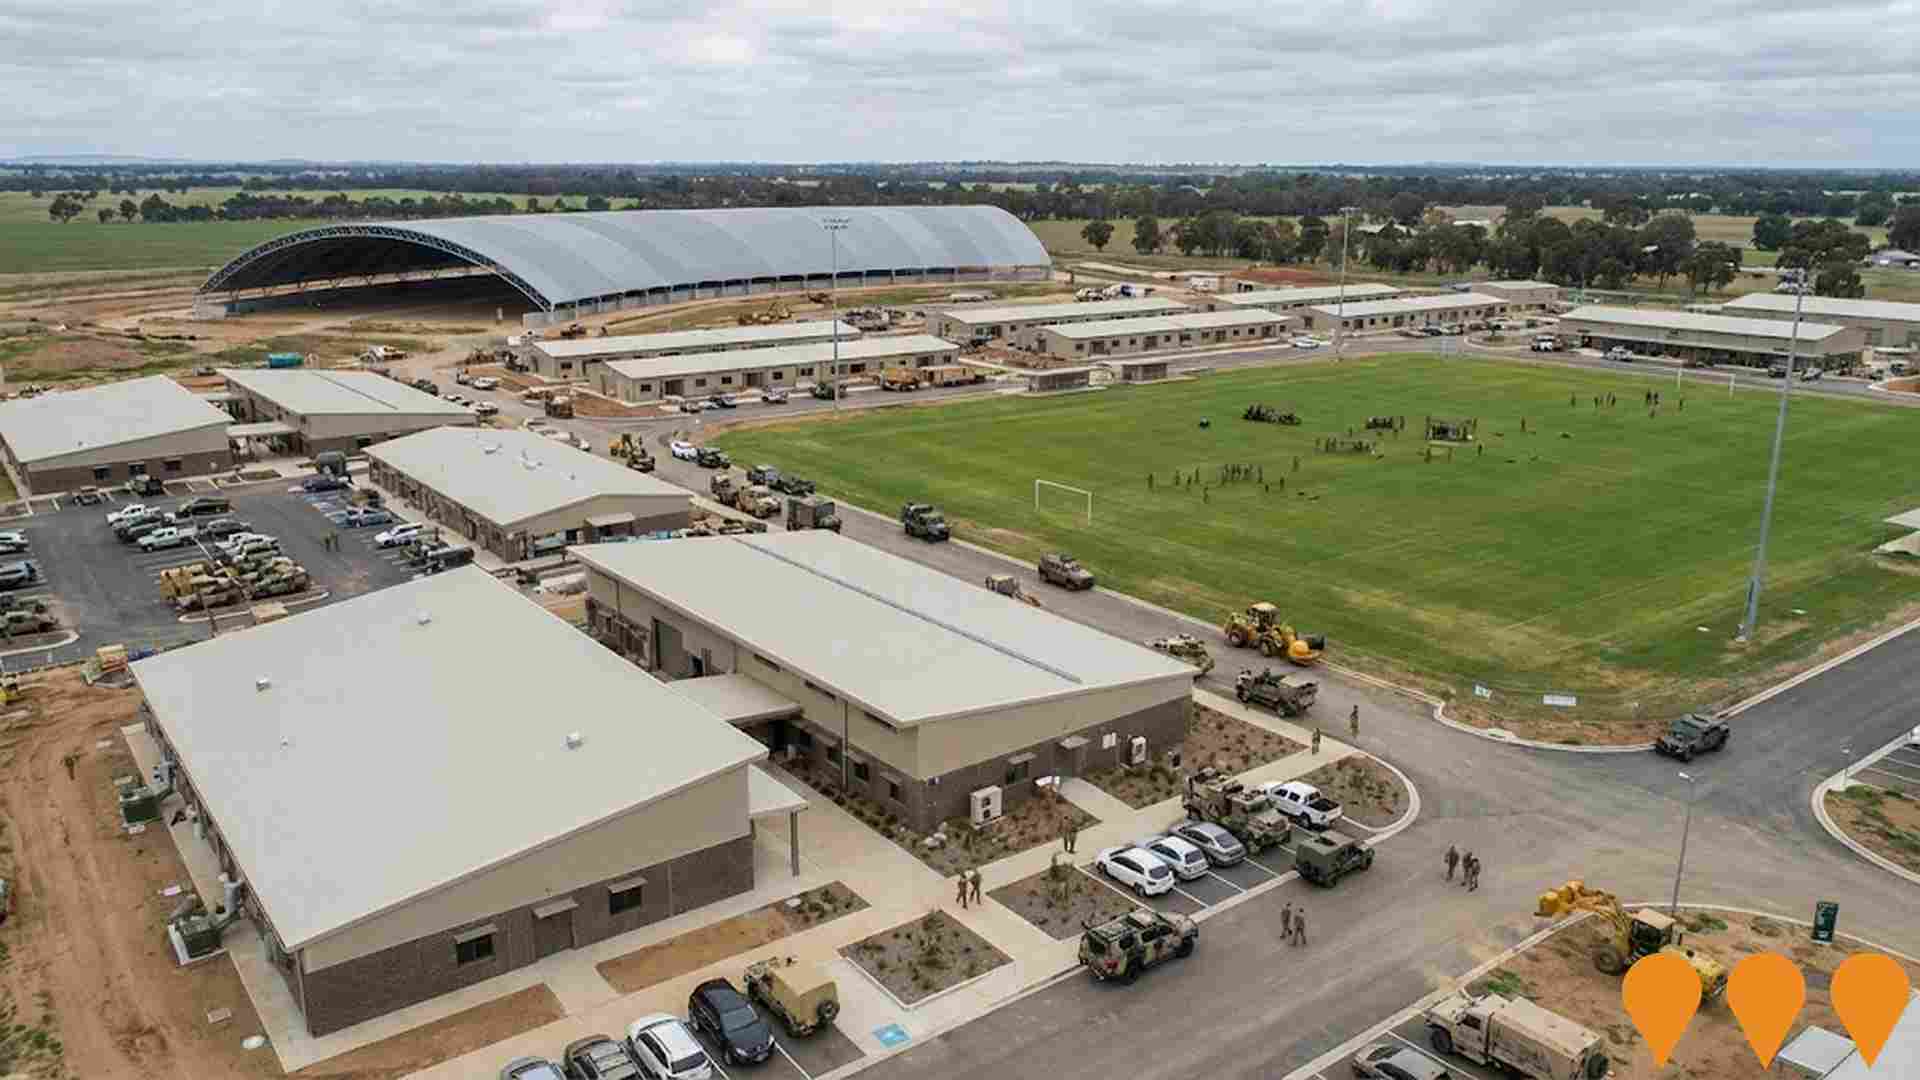
The performance of a region is significantly influenced by changes in local infrastructure, major projects, and planning initiatives. AreaSearch has identified fifteen such projects that are expected to impact the area. Notable among these are the Batlow Water Security (Concept Design) Project, Talbingo Battery Energy Storage System, Snowy 2.0 Transmission Connection Project, and Tumut River Works Program. The following list provides details on those projects deemed most relevant.
Professional plan users can use the search below to filter and access additional projects.
INFRASTRUCTURE SEARCH
 Denotes AI-based impression for illustrative purposes only, not to be taken as definitive under any circumstances. Please follow links and conduct other investigations from the project's source for actual imagery. Developers and project owners wishing us to use original imagery please Contact Us and we will do so.
Frequently Asked Questions - Infrastructure
Snowy 2.0 Pumped Hydro Project
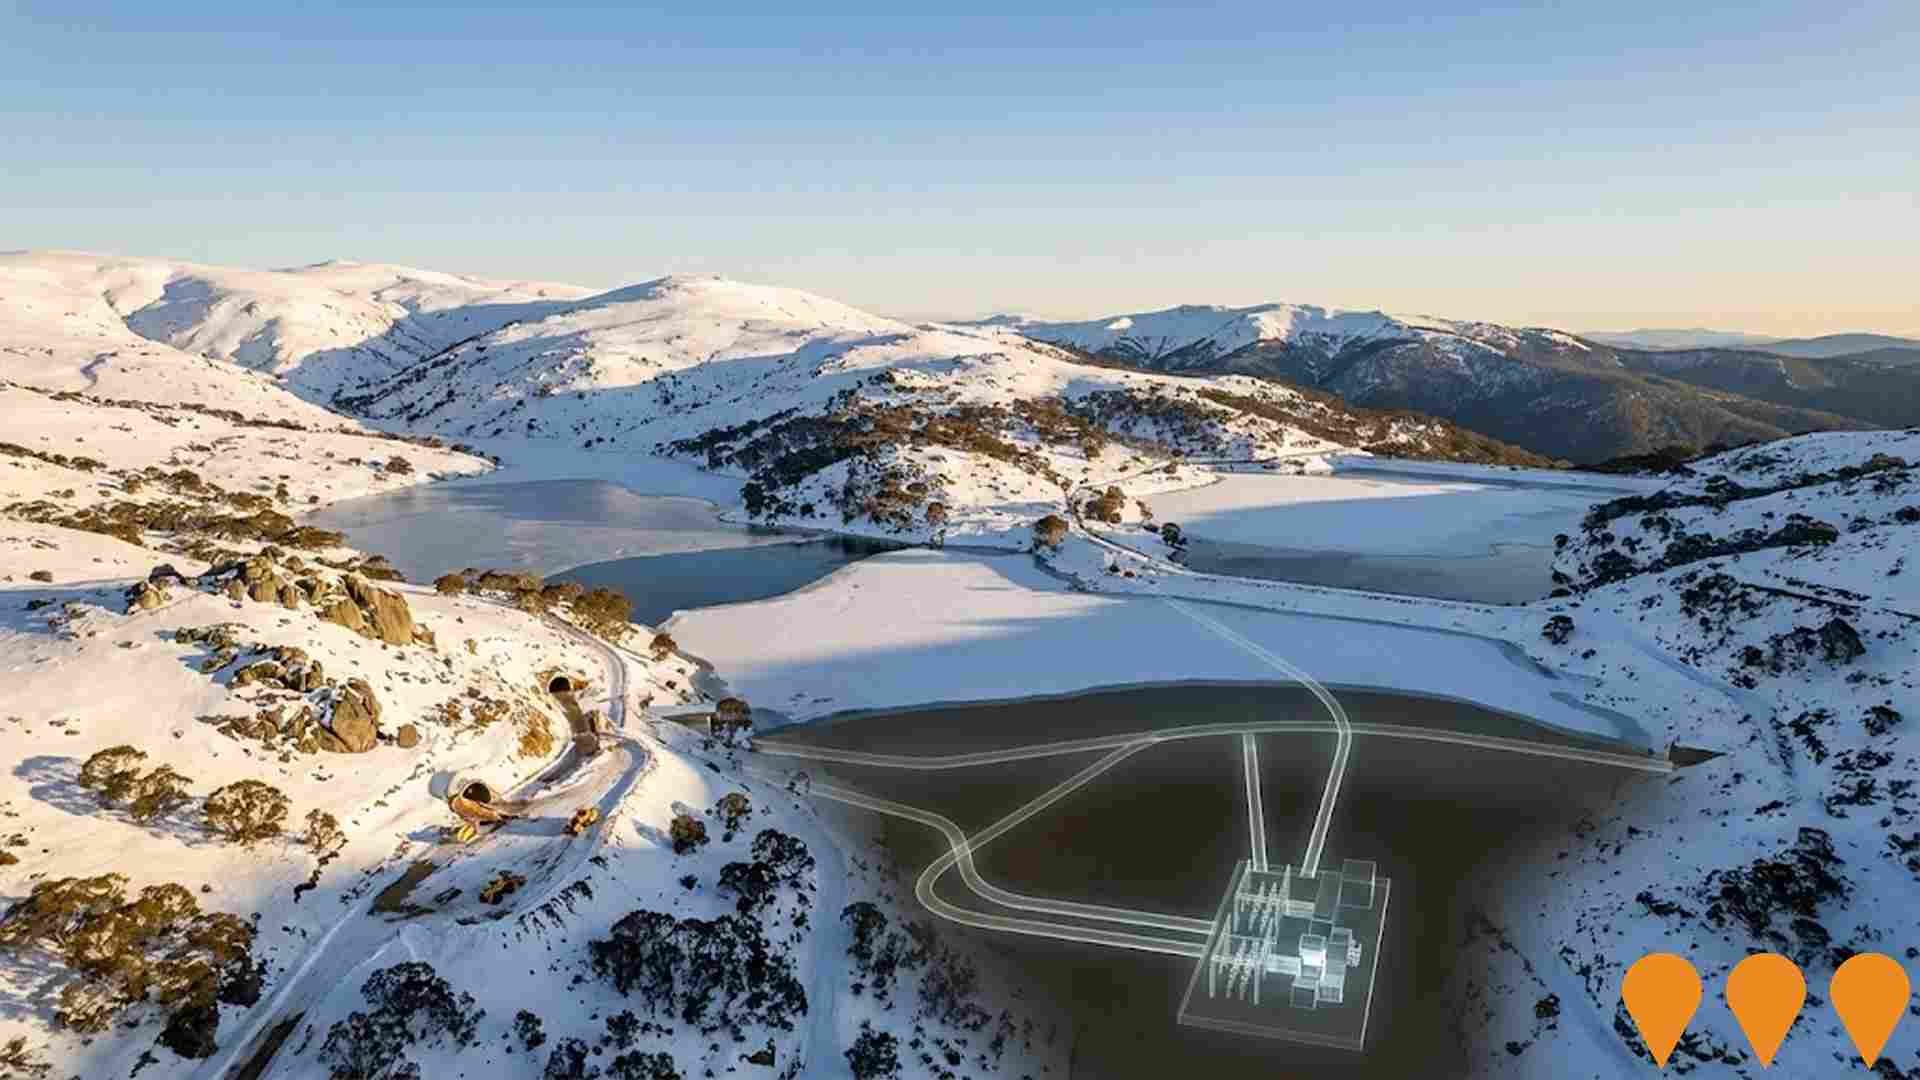
Snowy 2.0 is a 2,200 MW pumped-hydro expansion of the existing Snowy Mountains Scheme, connecting Tantangara and Talbingo reservoirs via 27 km of tunnels and a new underground power station capable of storing 350 GWh. Major works include three TBMs (Florence, Kirsten, Lady Eileen Hudson), excavation of the underground powerhouse cavern, intake/outlet structures, and new 500 kV transmission connections. As of December 2025, tunnelling is approximately 60% complete, with Florence and Kirsten progressing steadily after earlier soft-ground challenges. Powerhouse excavation is advancing, and first power remains targeted for late 2028 with full commercial operations in 2029.
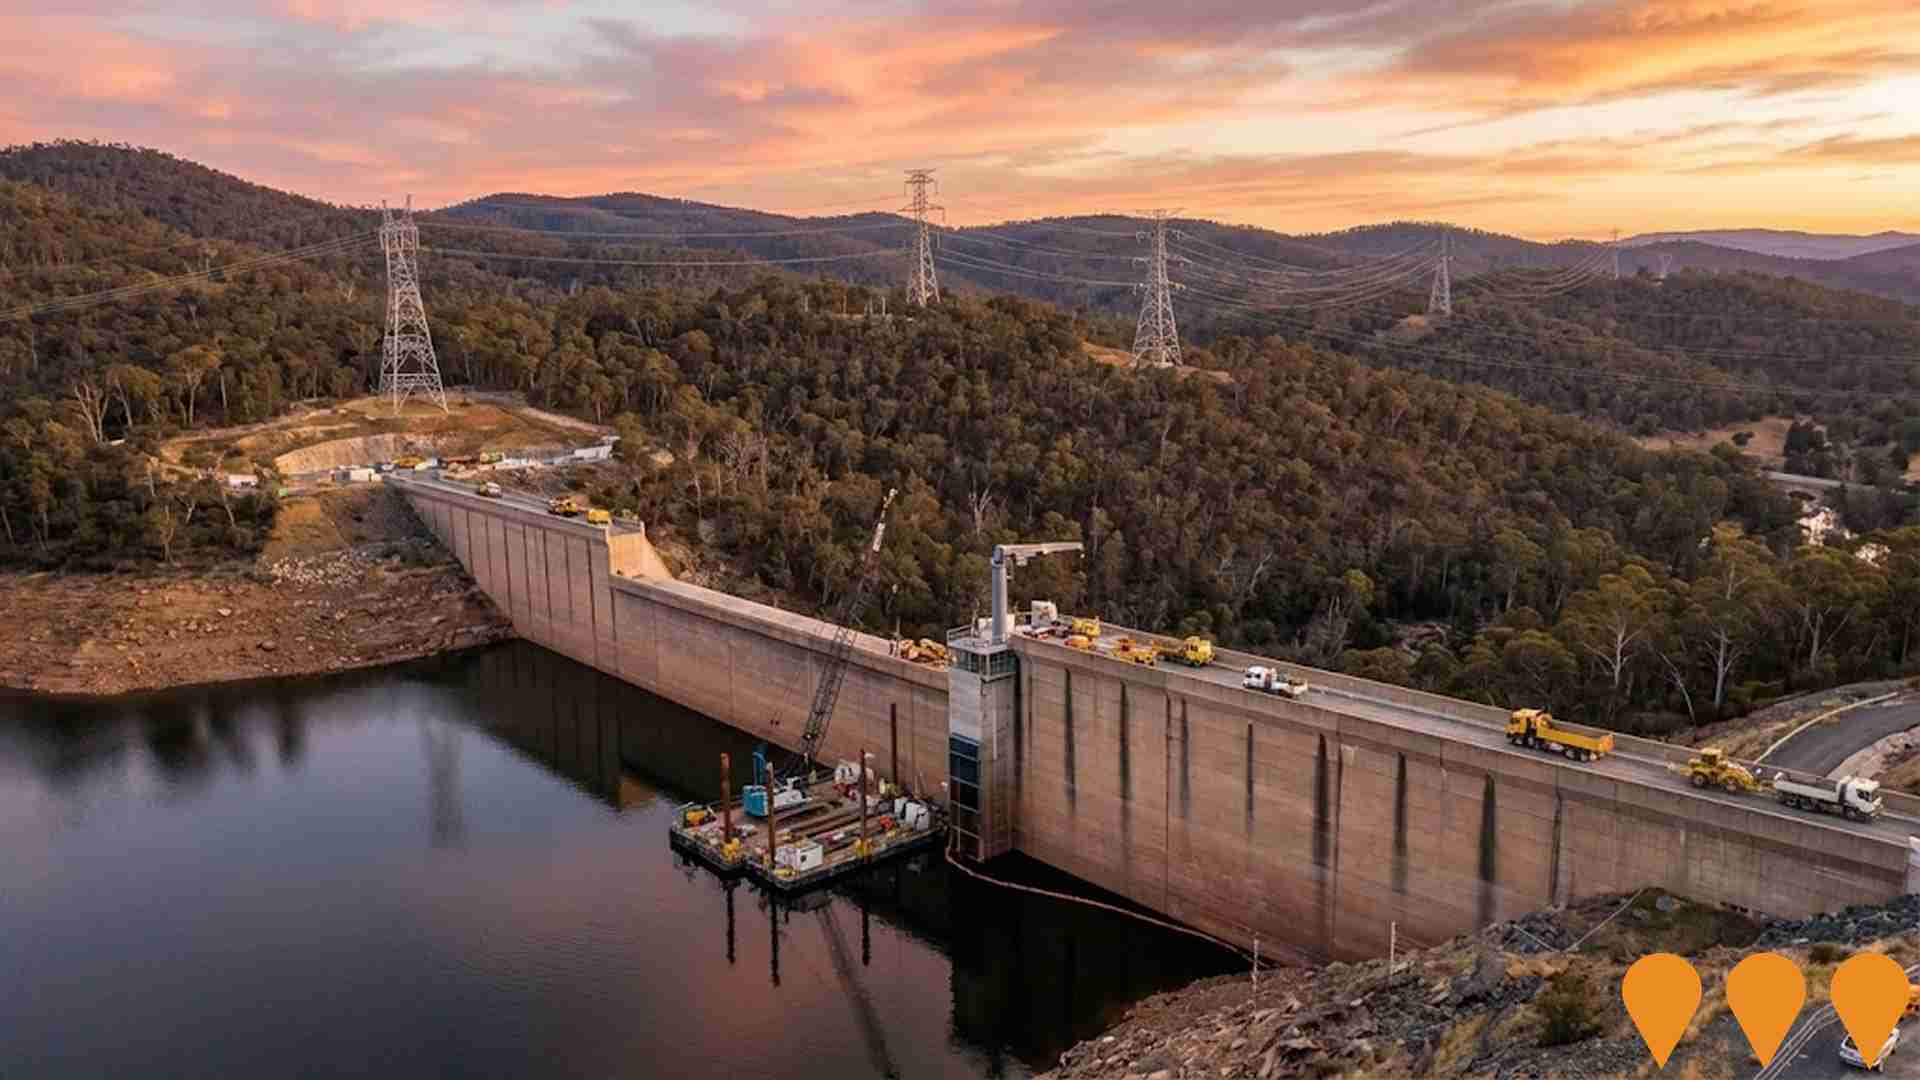
Snowy 2.0
Snowy 2.0 is a pumped-hydro expansion of the Snowy Scheme, linking two reservoirs with tunnels and an underground power station, providing 2,000 MW of power and 350,000 MWh of storage.
Jindabyne Education Campus
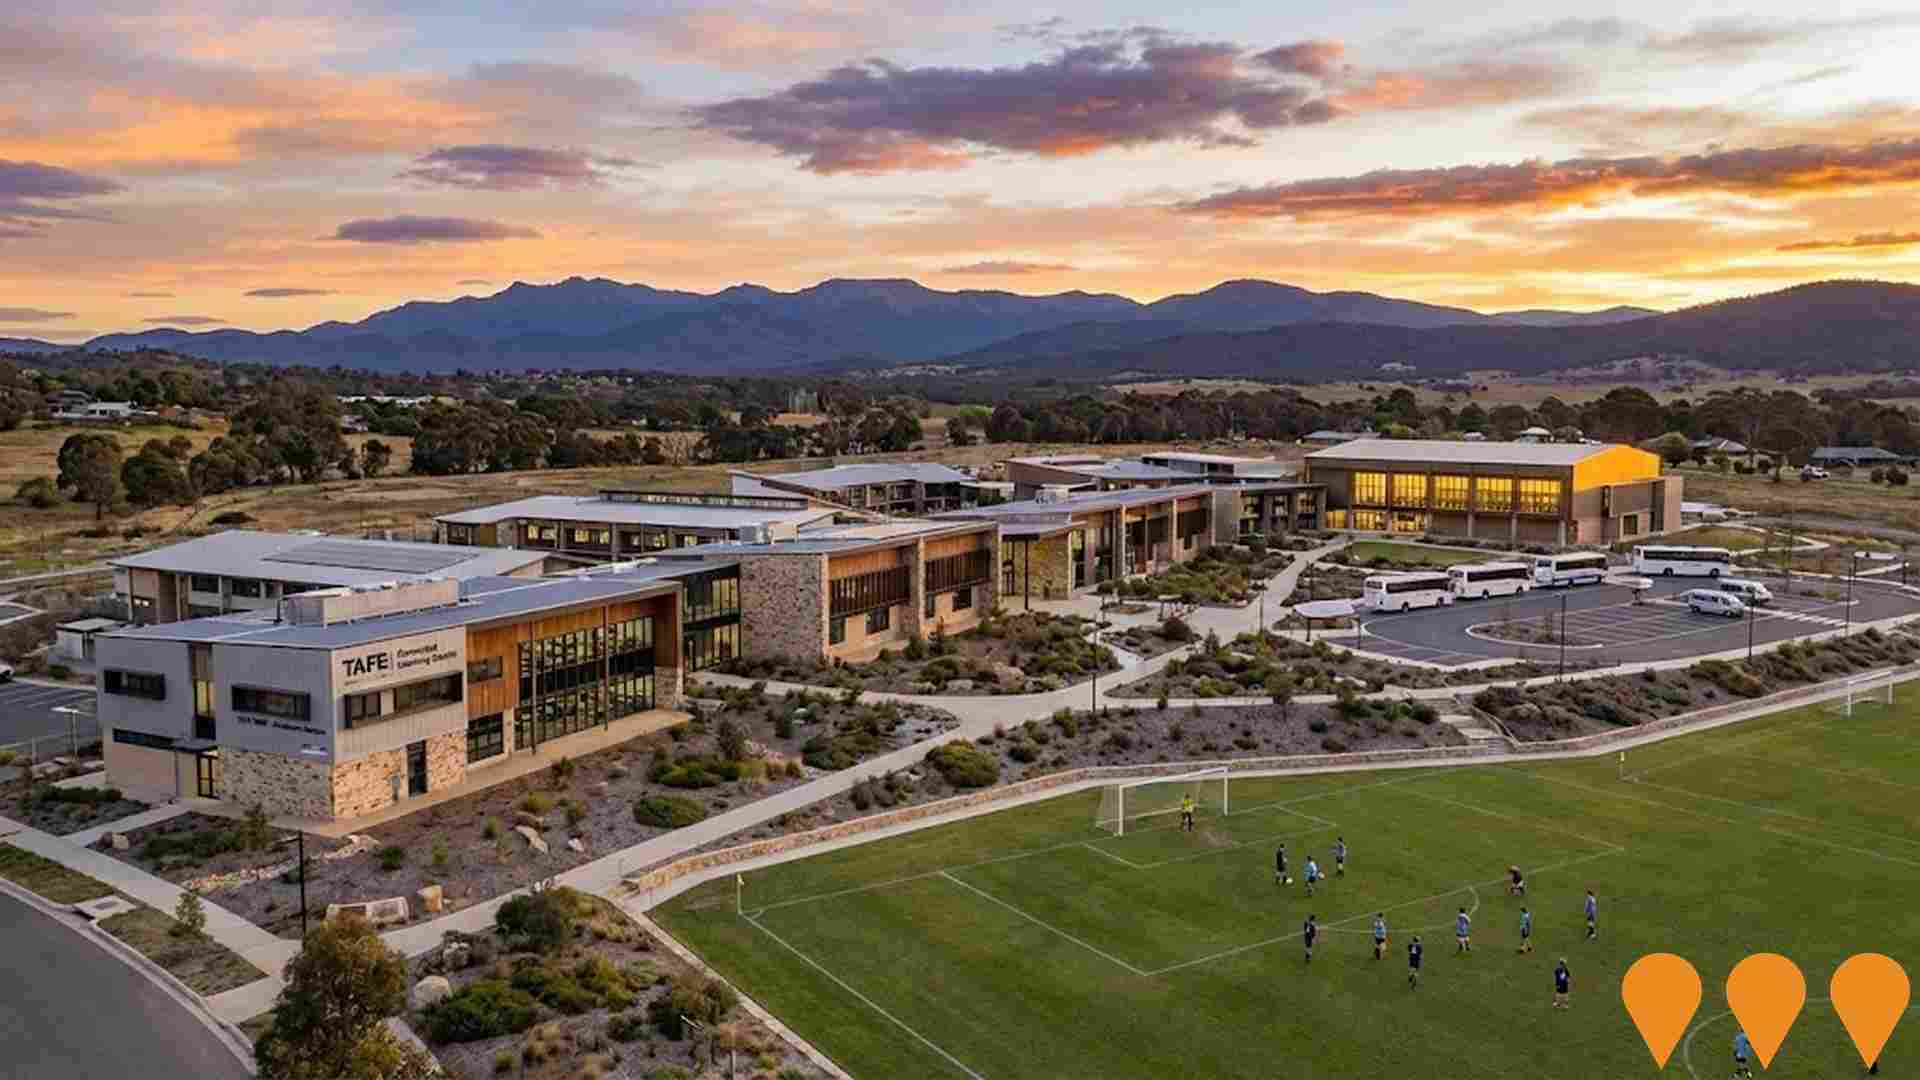
New purpose-built education campus including separate primary and high schools with modern facilities, libraries, halls, playing fields and specialist facilities for art, woodwork, metalwork, music, drama and science. Also includes TAFE NSW Connected Learning Centre. The campus will feature modern facilities to support students, teachers, and the community.
Batlow Water Security (Concept Design) Project
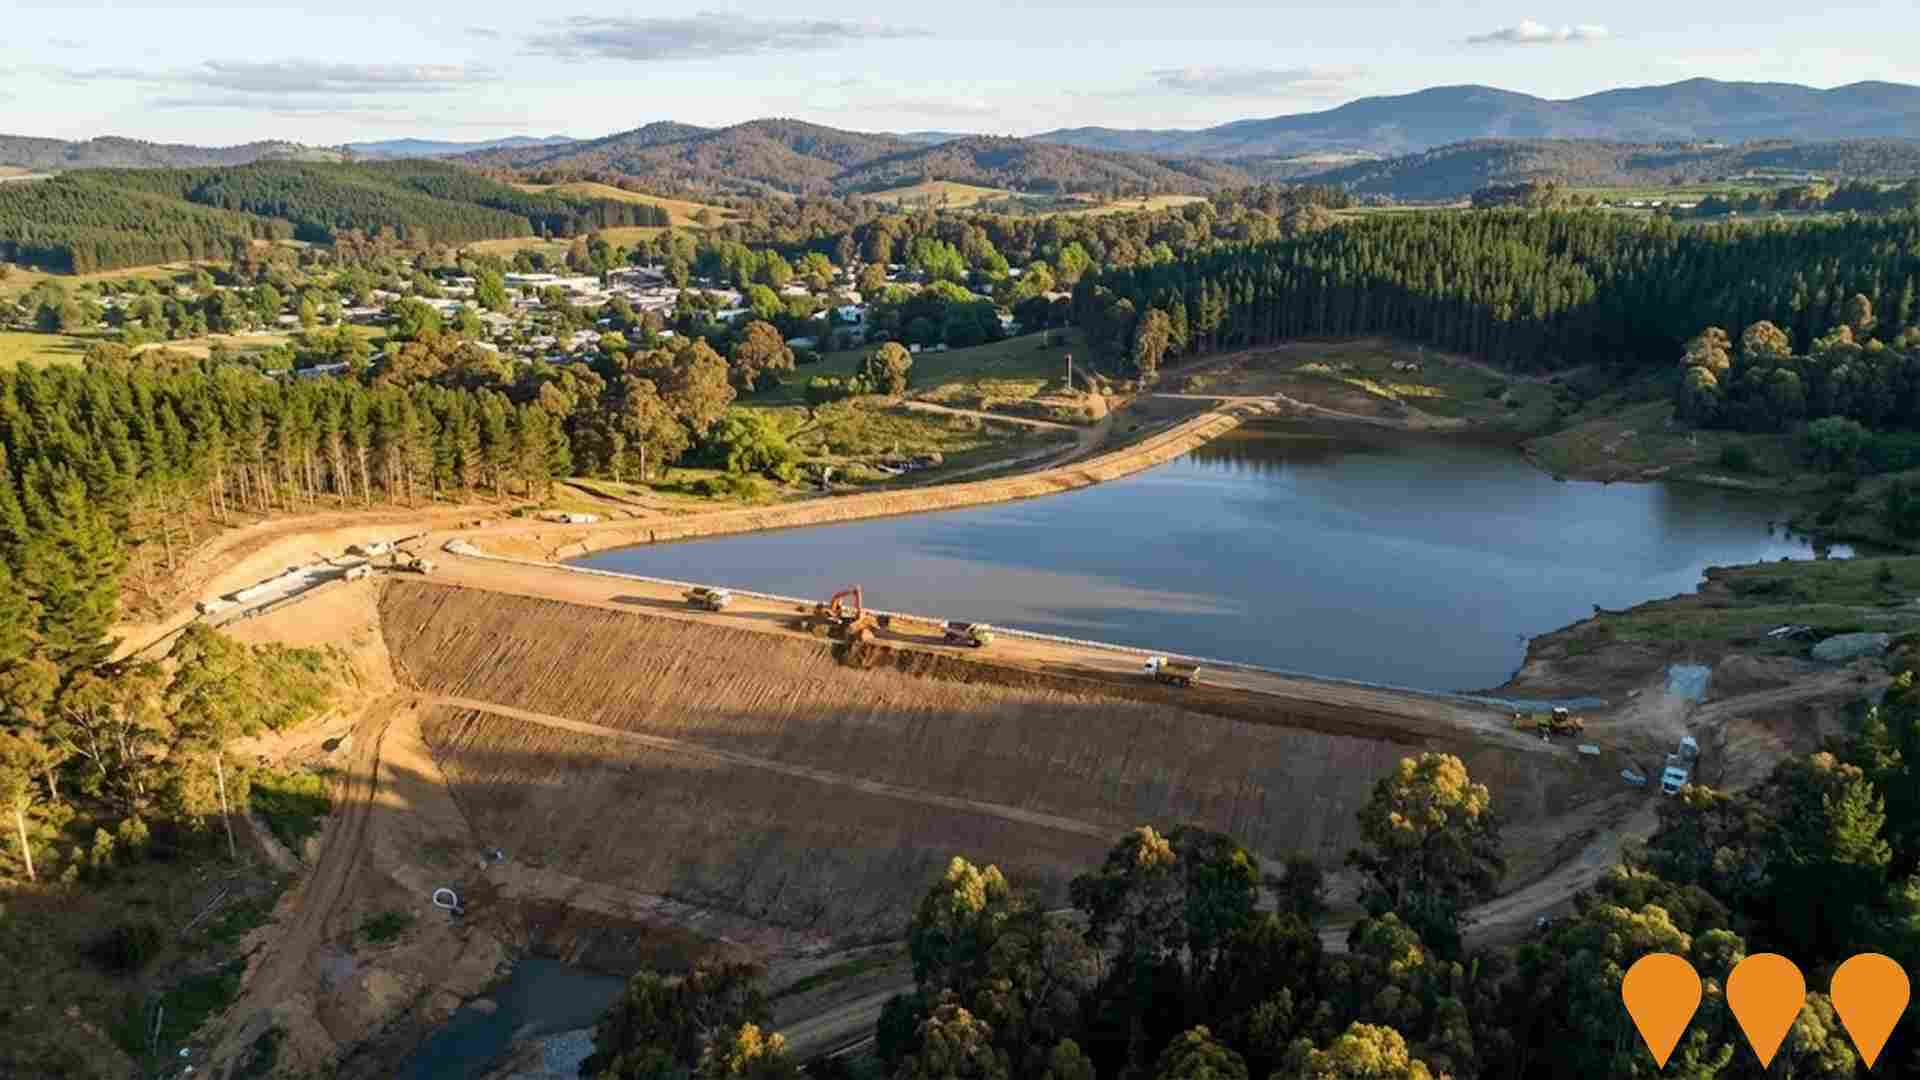
Concept design for a new 50 ML raw water storage to improve long term water security for Batlow. The work is guided by NSW DCCEEW's Regulatory Assurance Framework and delivered by Snowy Valleys Council with NSW Public Works, aiming to take the project to tender ready before detailed design and construction.
Snowy 2.0 Transmission Connection Project
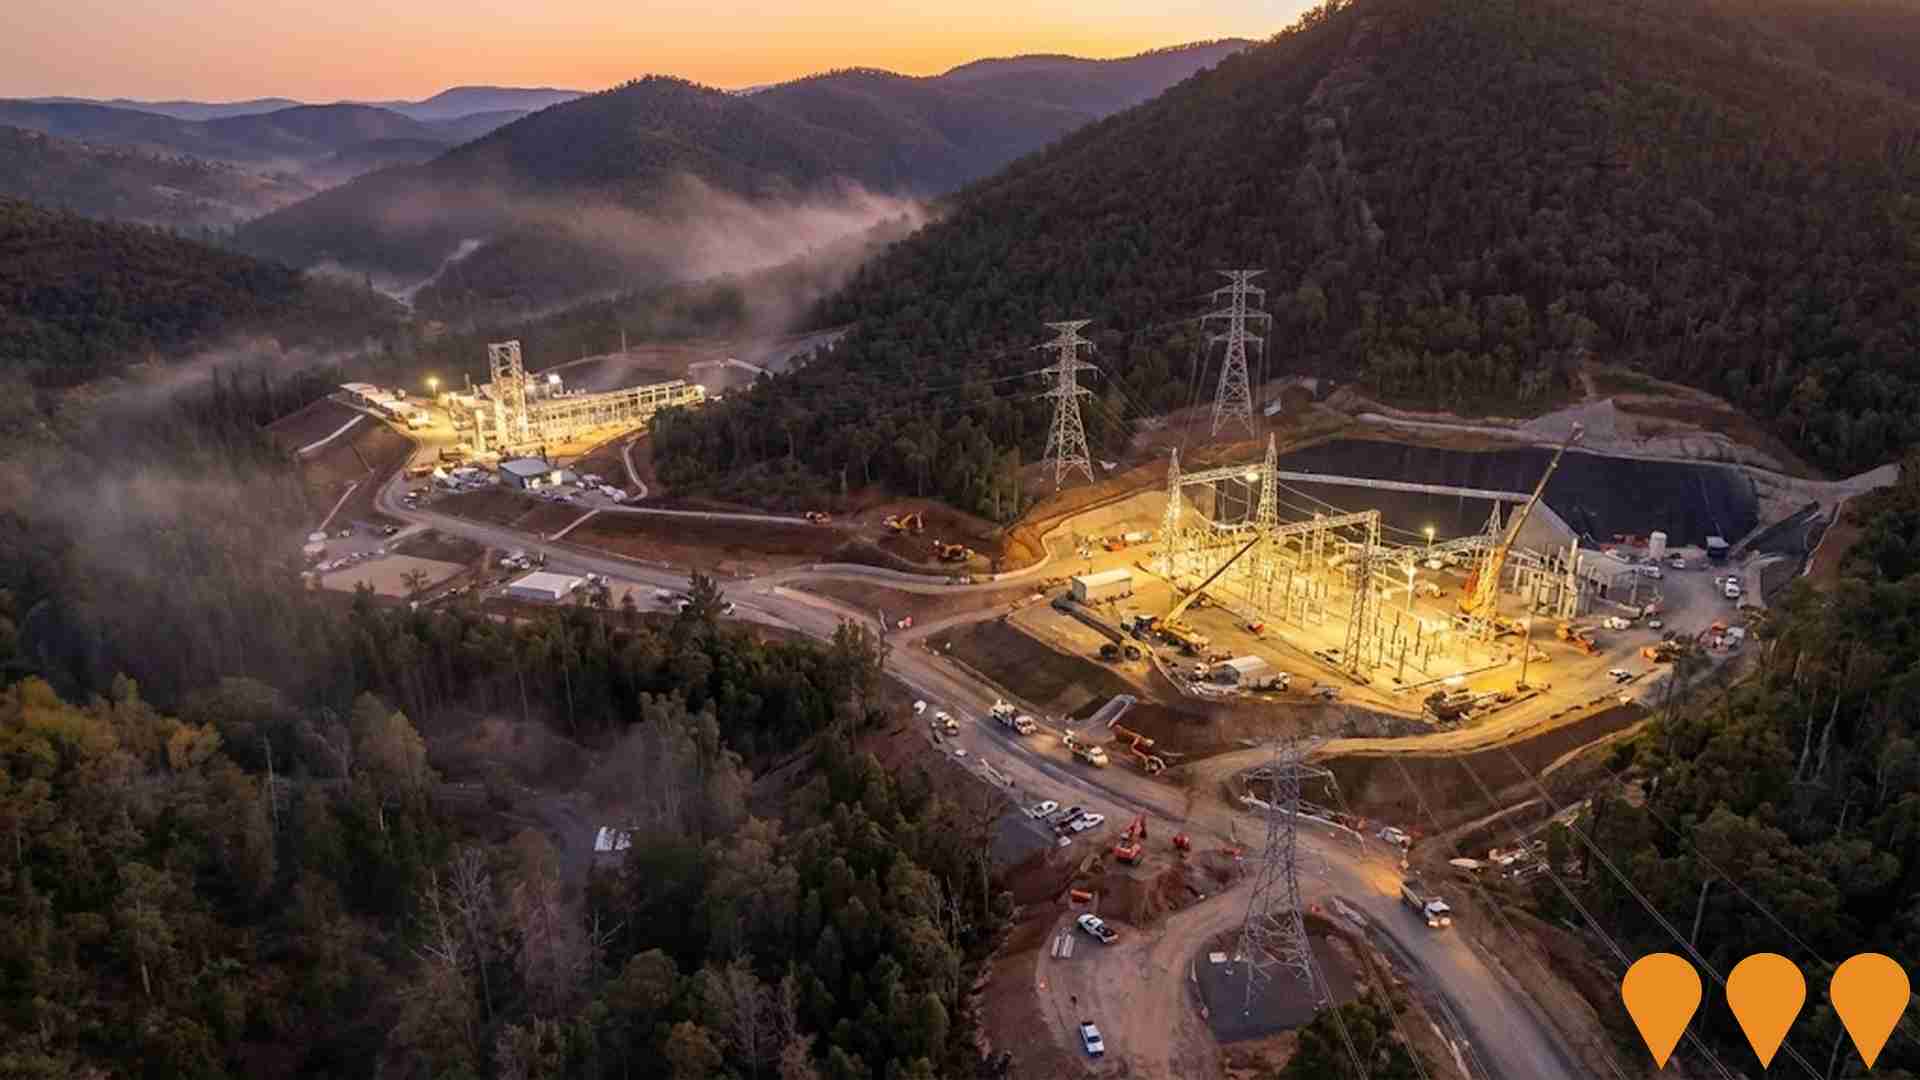
Approximately 9km of new 330kV double-circuit overhead transmission lines crossing the Tumut River and a new Maragle switching station to connect Snowy 2.0 to the NSW grid and the National Electricity Market. Works include access track upgrades and associated environmental management.
HumeLink
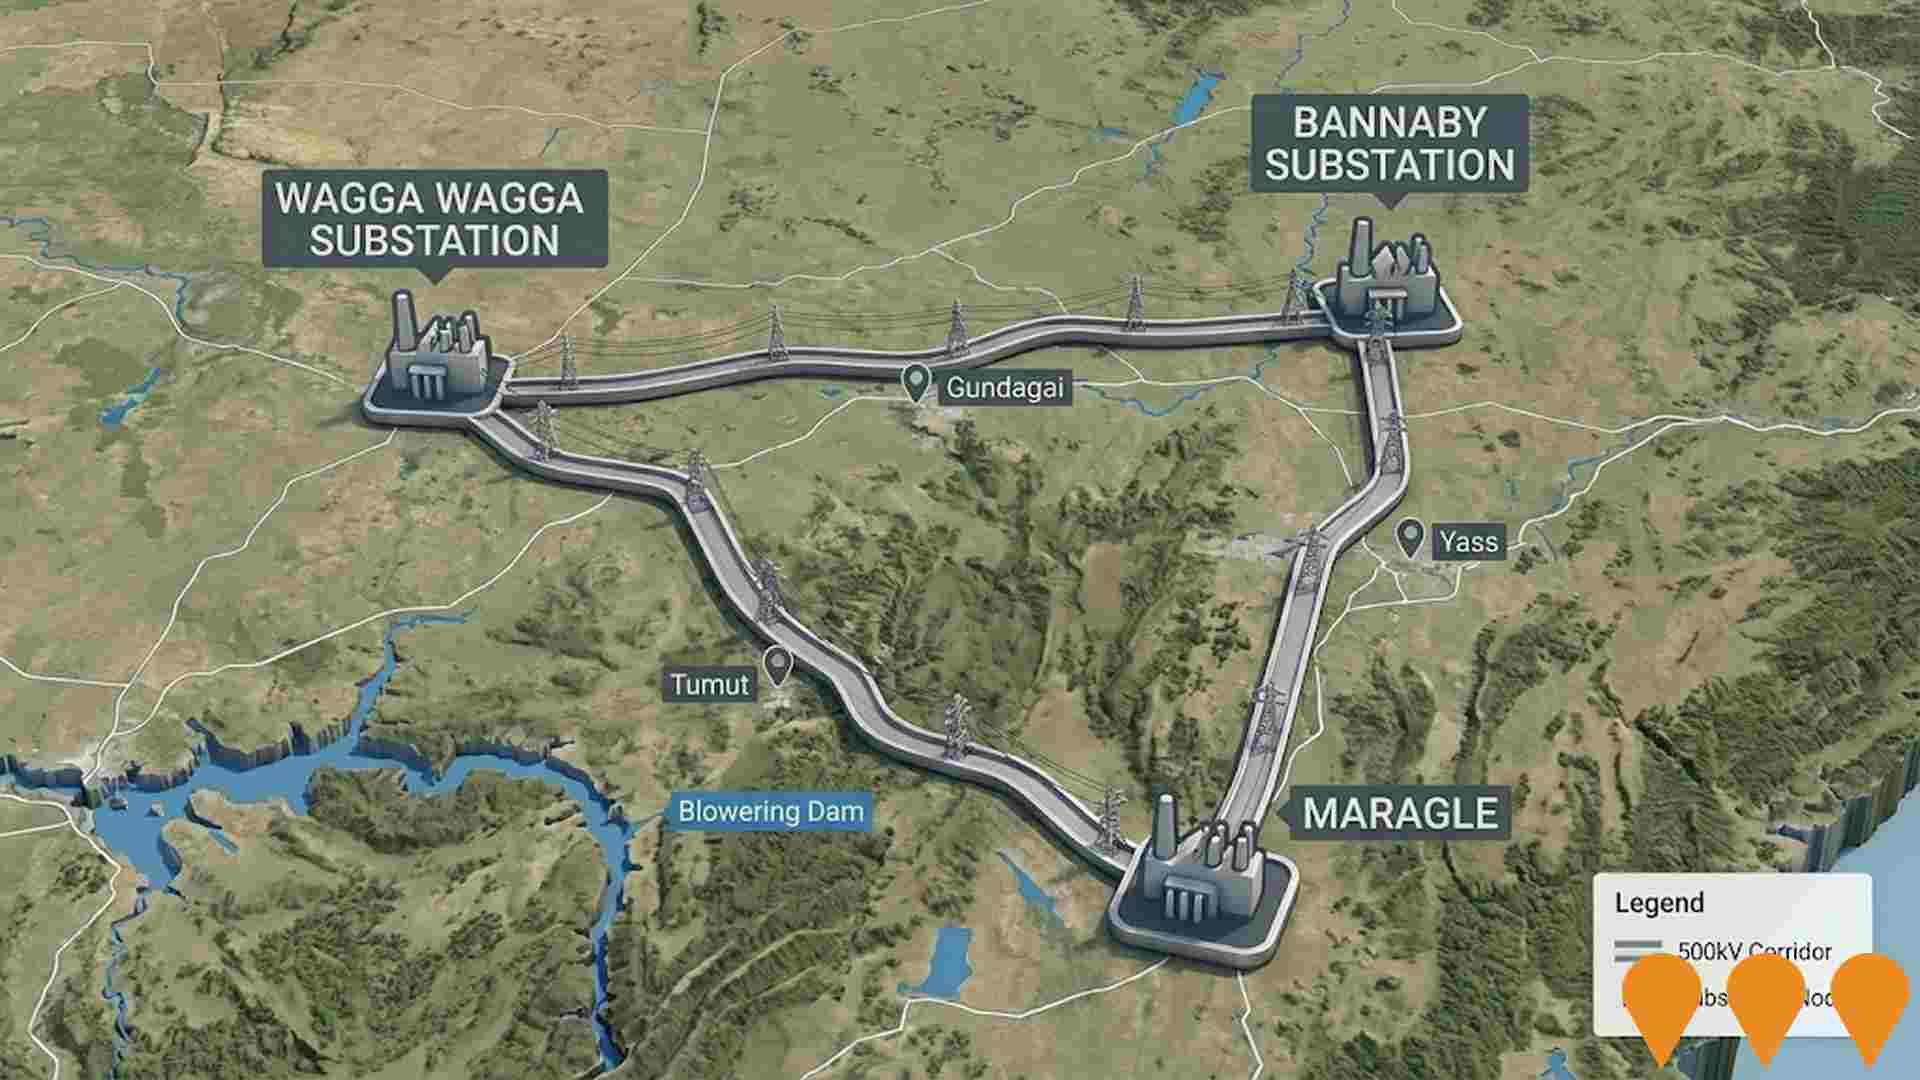
HumeLink is a new 500kV transmission line project connecting Wagga Wagga, Bannaby, and Maragle, spanning approximately 365 km. It includes new or upgraded infrastructure at four locations and aims to enhance the reliability and sustainability of the national electricity grid by increasing the integration of renewable energy sources such as wind and solar.
Talbingo Battery Energy Storage System
A 450 MW, 1,800 MWh (4-hour) battery energy storage system (BESS) proposed approximately 700 m from the Tumut 3 Power Station and immediately adjacent to Transgrid's 330 kV Lower Tumut Switching Station, about 2.8 km south of Talbingo. The project has received SEARs and is preparing an Environmental Impact Statement as a State Significant Development. The BESS will provide system services, firm renewable generation, relieve network constraints, and support grid stability.

Thredbo Alpine Coaster
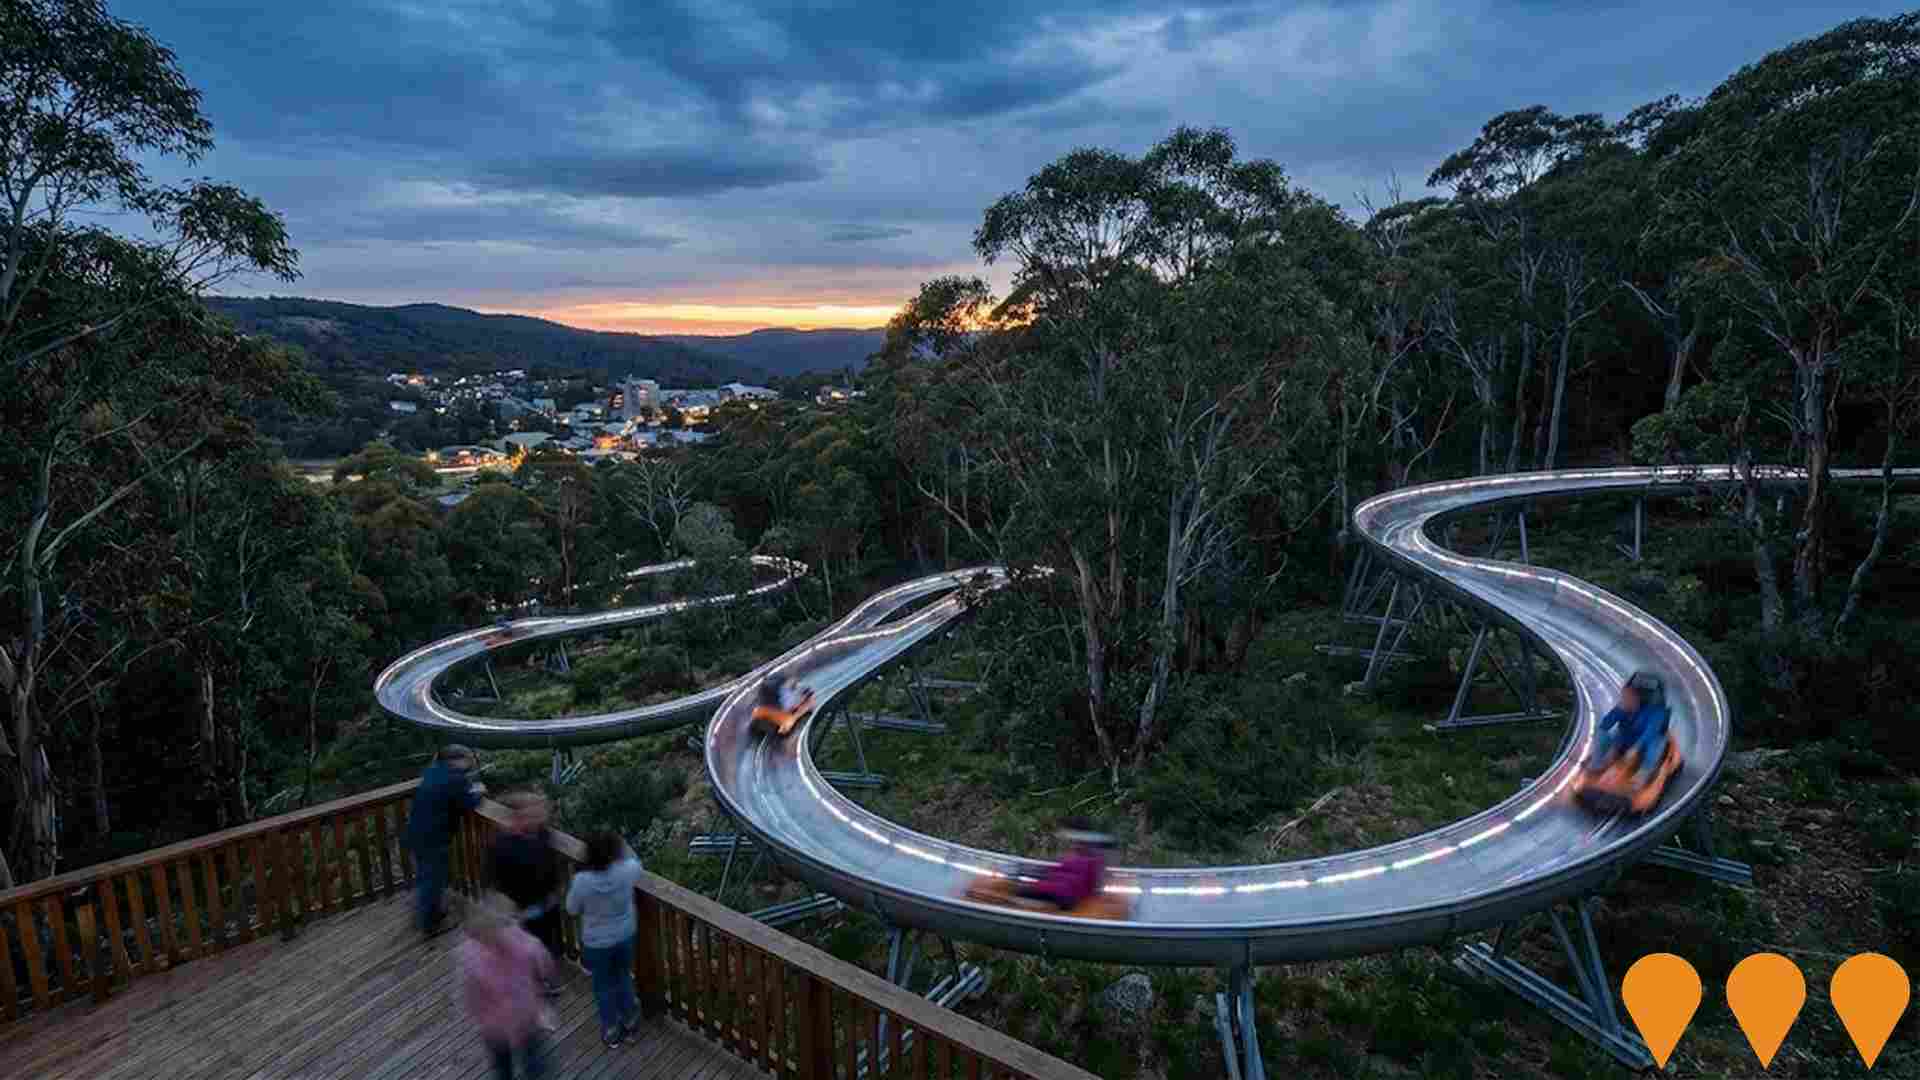
A 1.5km year-round alpine coaster at Thredbo Resort featuring uphill and downhill track sections with a tunnel and bridges. Riders control speed up to 40 km/h. First of its kind in the Southern Hemisphere; now open and operating year-round.
Employment
The employment environment in Tumbarumba shows above-average strength when compared nationally
Tumbarumba has a balanced workforce with both white and blue collar jobs, diverse sector representation, and an unemployment rate of 3.0%. In the year ending September 2025, employment growth was estimated at 4.2%.
As of this date, 1,630 residents were employed, with an unemployment rate of 0.8% lower than the Rest of NSW's rate of 3.8%. Workforce participation in Tumbarumba was somewhat below standard at 54.1%, compared to the Rest of NSW's 56.4%. Dominant employment sectors included agriculture, forestry & fishing, manufacturing, and public administration & safety. Agriculture, forestry & fishing had particularly notable concentration with employment levels at 5.0 times the regional average.
Conversely, health care & social assistance was under-represented, with only 8.1% of Tumbarumba's workforce compared to 16.9% in Rest of NSW. Many residents commute elsewhere for work based on Census data. Between September 2024 and September 2025, employment levels increased by 4.2%, labour force increased by 4.9%, resulting in an unemployment rise of 0.7 percentage points. In comparison, the Rest of NSW recorded an employment decline of 0.5% and a labour force decline of 0.1%, with unemployment rising by 0.4 percentage points. State-level data to 25-Nov-25 shows NSW employment contracted by 0.03% (losing 2,260 jobs), with the state unemployment rate at 3.9%. National employment forecasts from Jobs and Skills Australia show national employment expanding by 6.6% over five years and 13.7% over ten years. Applying these projections to Tumbarumba's employment mix suggests local employment should increase by 4.7% over five years and 10.8% over ten years, based on a simple weighting extrapolation for illustrative purposes.
Frequently Asked Questions - Employment
Income
Income levels sit below national averages according to AreaSearch assessment
AreaSearch's latest postcode level ATO data for financial year 2022 indicates Tumbarumba SA2 had a median income of $48,813 and an average income of $58,858. Nationally, these figures are lower than the average. Comparing with Rest of NSW, Tumbarumba's median is $49,459 and average is $62,998. Based on a 12.61% increase since financial year 2022, estimated incomes as of September 2025 are approximately $54,968 (median) and $66,280 (average). In Tumbarumba, Census 2021 income data shows household, family, and personal incomes rank modestly between the 22nd and 29th percentiles. The majority of residents fall within the $1,500 - 2,999 bracket at 30.0% (1,083 people). Housing costs are manageable with 91.4% retained, but disposable income is below average at the 32nd percentile.
Frequently Asked Questions - Income
Housing
Tumbarumba is characterized by a predominantly suburban housing profile, with above-average rates of outright home ownership
Tumbarumba's dwellings, as per the latest Census, were 97.0% houses and 3.0% other dwellings (semi-detached, apartments, 'other' dwellings), compared to Non-Metro NSW's 92.0% houses and 8.0% other dwellings. Home ownership in Tumbarumba stood at 51.3%, with mortgaged dwellings at 26.3% and rented ones at 22.4%. The median monthly mortgage repayment was $1,127, lower than Non-Metro NSW's average of $1,300. Median weekly rent in Tumbarumba was $208, compared to Non-Metro NSW's $230. Nationally, Tumbarumba's mortgage repayments were significantly lower at $1,127 versus Australia's average of $1,863, and rents were substantially below the national figure of $375.
Frequently Asked Questions - Housing
Household Composition
Tumbarumba has a typical household mix, with a lower-than-average median household size
Family households account for 70.5% of all households, including 23.1% couples with children, 36.4% couples without children, and 10.1% single parent families. Non-family households comprise the remaining 29.5%, with lone person households at 27.8% and group households making up 2.0% of the total. The median household size is 2.3 people, which is smaller than the Rest of NSW average of 2.4.
Frequently Asked Questions - Households
Local Schools & Education
Tumbarumba faces educational challenges, with performance metrics placing it in the bottom quartile of areas assessed nationally
The area has university qualification rates of 16.6%, significantly lower than the NSW average of 32.2%. Bachelor degrees are most common at 12.2%, followed by graduate diplomas (2.3%) and postgraduate qualifications (2.1%). Vocational credentials are prevalent, with 41.3% of residents aged 15+ holding them, including advanced diplomas (9.7%) and certificates (31.6%). Educational participation is high, with 30.2% of residents currently enrolled in formal education, including primary (12.0%), secondary (8.8%), and tertiary (2.0%) levels.
Educational participation is notably high, with 30.2% of residents currently enrolled in formal education. This includes 12.0% in primary education, 8.8% in secondary education, and 2.0% pursuing tertiary education.
Frequently Asked Questions - Education
Schools Detail
Nearby Services & Amenities
Transport
Transport servicing is low compared to other areas nationally based on assessment of service frequency, route connectivity and accessibility
Tumbarumba has 195 active public transport stops. These are a mix of train and bus services. There are 16 different routes operating in total.
These routes provide 142 weekly passenger trips combined. The accessibility of these services is rated as good, with residents typically living just 205 meters away from the nearest stop. On average, there are 20 trips per day across all routes. This equates to approximately 0 weekly trips per individual stop.
Frequently Asked Questions - Transport
Transport Stops Detail
Health
Health performance in Tumbarumba is well below average with prevalence of common health conditions notable across both younger and older age cohorts
Health data indicates significant challenges for Tumbarumba, with high prevalence of common health conditions across both younger and older age groups. Approximately 49% (~1,773 people) have private health cover, lower than the national average of 55.3%.
The most prevalent medical conditions are arthritis (11.2%) and asthma (8.9%). About 62.8% report no medical ailments, similar to Rest of NSW at 62.9%. Tumbarumba has a higher proportion of residents aged 65 and over, at 28.7% (1,036 people), compared to 24.8% in Rest of NSW. Health outcomes among seniors are above average, better than the general population in health metrics.
Frequently Asked Questions - Health
Cultural Diversity
Tumbarumba is considerably less culturally diverse than average when assessed alongside AreaSearch's national rankings for language and cultural background related metrics
Tumbarumba had a lower cultural diversity compared to the average, with 85.8% of its population being citizens, 89.3% born in Australia, and 96.7% speaking English only at home. The predominant religion was Christianity, comprising 61.4% of Tumbarumba's population, compared to 65.3% across the Rest of NSW. The top three ancestry groups were Australian (32.2%), English (31.4%), and Scottish (9.0%).
Notably, German ancestry was overrepresented at 4.7%, while Australian Aboriginal was slightly lower at 4.4%. Maltese ancestry was also higher than average at 0.5%.
Frequently Asked Questions - Diversity
Age
Tumbarumba hosts an older demographic, ranking in the top quartile nationwide
Tumbarumba's median age is 47 years, significantly higher than the Rest of NSW average of 43 and the national average of 38 years. The age profile shows that those aged 65-74 are particularly prominent at 16.2%, while the 25-34 group is smaller at 8.5% compared to the Rest of NSW average. This concentration of the 65-74 age group is well above the national average of 9.4%. Between 2021 and present, the proportion of those aged 65-74 has increased from 13.9% to 16.2%, while the 15-24 cohort has risen from 8.8% to 10.2%. Conversely, the 55-64 group has decreased from 15.5% to 13.8%, and the 25-34 group has dropped from 9.7% to 8.5%. By 2041, Tumbarumba is expected to see notable shifts in its age composition. The 75-84 group is projected to grow by 17 people, reaching 387 from 332, leading the demographic shift. The aging population trend is clear, with those aged 65 and above comprising 72% of the projected growth. Conversely, population declines are projected for the 0-4 and 15-24 age cohorts.
