Chart Color Schemes
This analysis uses ABS Statistical Areas Level 2 (SA2) boundaries, which can materially differ from Suburbs and Localities (SAL) even when sharing similar names.
SA2 boundaries are defined by the Australian Bureau of Statistics and are designed to represent communities for statistical reporting (e.g., census and ERP).
Suburbs and Localities (SAL) represent commonly-used suburb/locality names (postal-style areas) and may use different geographic boundaries. For comprehensive analysis, consider reviewing both boundary types if available.
est. as @ -- *
ABS ERP | -- people | --
2021 Census | -- people
Sales Activity
Curious about local property values? Filter the chart to assess the volume and appreciation (including resales) trends and regional comparisons, or scroll to the map below view this information at an individual property level.
Find a Recent Sale
Sales Detail
Population
Newport - Bilgola is positioned among the lower quartile of areas assessed nationally for population growth based on AreaSearch's assessment of recent, and medium term trends
Newport-Bilgola's population, as per AreaSearch's analysis, is approximately 13,902 as of November 2025. This figure represents an increase of 221 people, a 1.6% rise from the 2021 Census total of 13,681 inhabitants. The change is inferred from the estimated resident population of 13,846 in June 2024 and the addition of 53 validated new addresses since the census date. This results in a population density ratio of 2,396 persons per square kilometer, placing Newport-Bilgola in the upper quartile relative to other locations assessed by AreaSearch. The area's 1.6% growth since the census is within 0.1 percentage points of its SA3 area (1.7%), indicating competitive growth fundamentals. Overseas migration contributed approximately 68.2% of overall population gains during recent periods, driving primary population growth in the area.
AreaSearch uses ABS/Geoscience Australia projections for each SA2 area, released in 2024 with a base year of 2022. For areas not covered by this data, AreaSearch employs NSW State Government's SA2 level projections, released in 2022 with a base year of 2021. Growth rates by age group from these aggregations are applied to all areas for years 2032 to 2041. Looking ahead, lower quartile growth is anticipated across statistical areas nationally, with Newport-Bilgola expected to grow by 94 persons by 2041 based on the latest annual ERP population numbers, reflecting a total gain of 0.3% over the 17 years.
Frequently Asked Questions - Population
Development
AreaSearch assessment of residential development drivers sees a low level of activity in Newport - Bilgola, placing the area among the bottom 25% of areas assessed nationally
Newport-Bilgola has received approximately 32 dwelling approvals annually over the past five financial years, totalling 164 homes. As of FY-26, six approvals have been recorded. Despite population decline during this period, development activity has been adequate relative to population change, which is positive for buyers. The average construction cost value of new properties is $674,000, indicating a focus on the premium segment with upmarket properties.
In FY-26, commercial approvals totalling $841,000 have been registered, reflecting the area's residential nature. Compared to Greater Sydney, Newport-Bilgola shows 19.0% lower construction activity per person and ranks in the 31st percentile nationally, suggesting limited buyer options but strengthening demand for established properties. This lower activity may reflect market maturity and potential development constraints. Building activity comprises 54.0% standalone homes and 46.0% medium and high-density housing, marking a shift from existing housing patterns (currently 73.0% houses), possibly due to diminishing developable land availability and evolving lifestyle preferences. With approximately 564 people per approval, Newport-Bilgola is a mature, established area.
Population forecasts indicate an increase of 38 residents by 2041. Current construction levels should meet demand adequately, creating favourable conditions for buyers while potentially enabling growth beyond current forecasts.
Frequently Asked Questions - Development
Infrastructure
Newport - Bilgola has strong levels of nearby infrastructure activity, ranking in the top 40% nationally
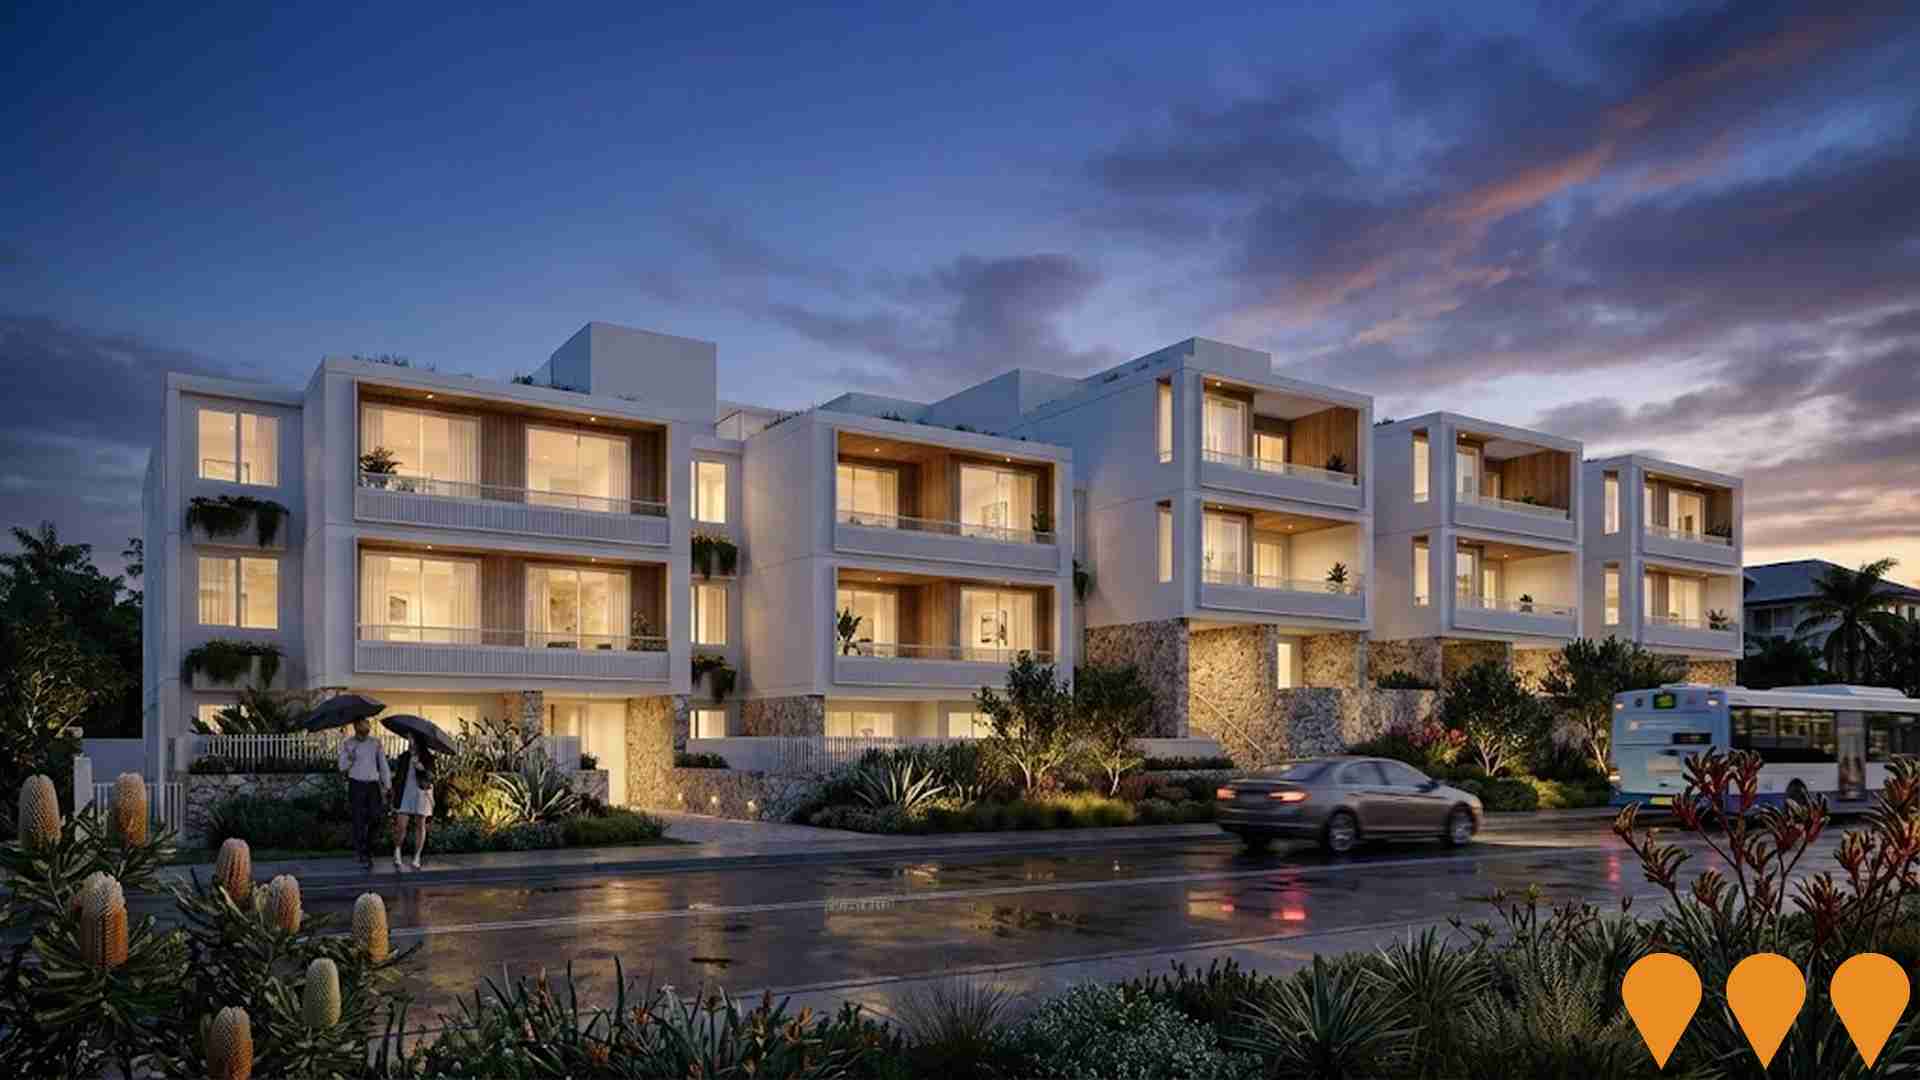
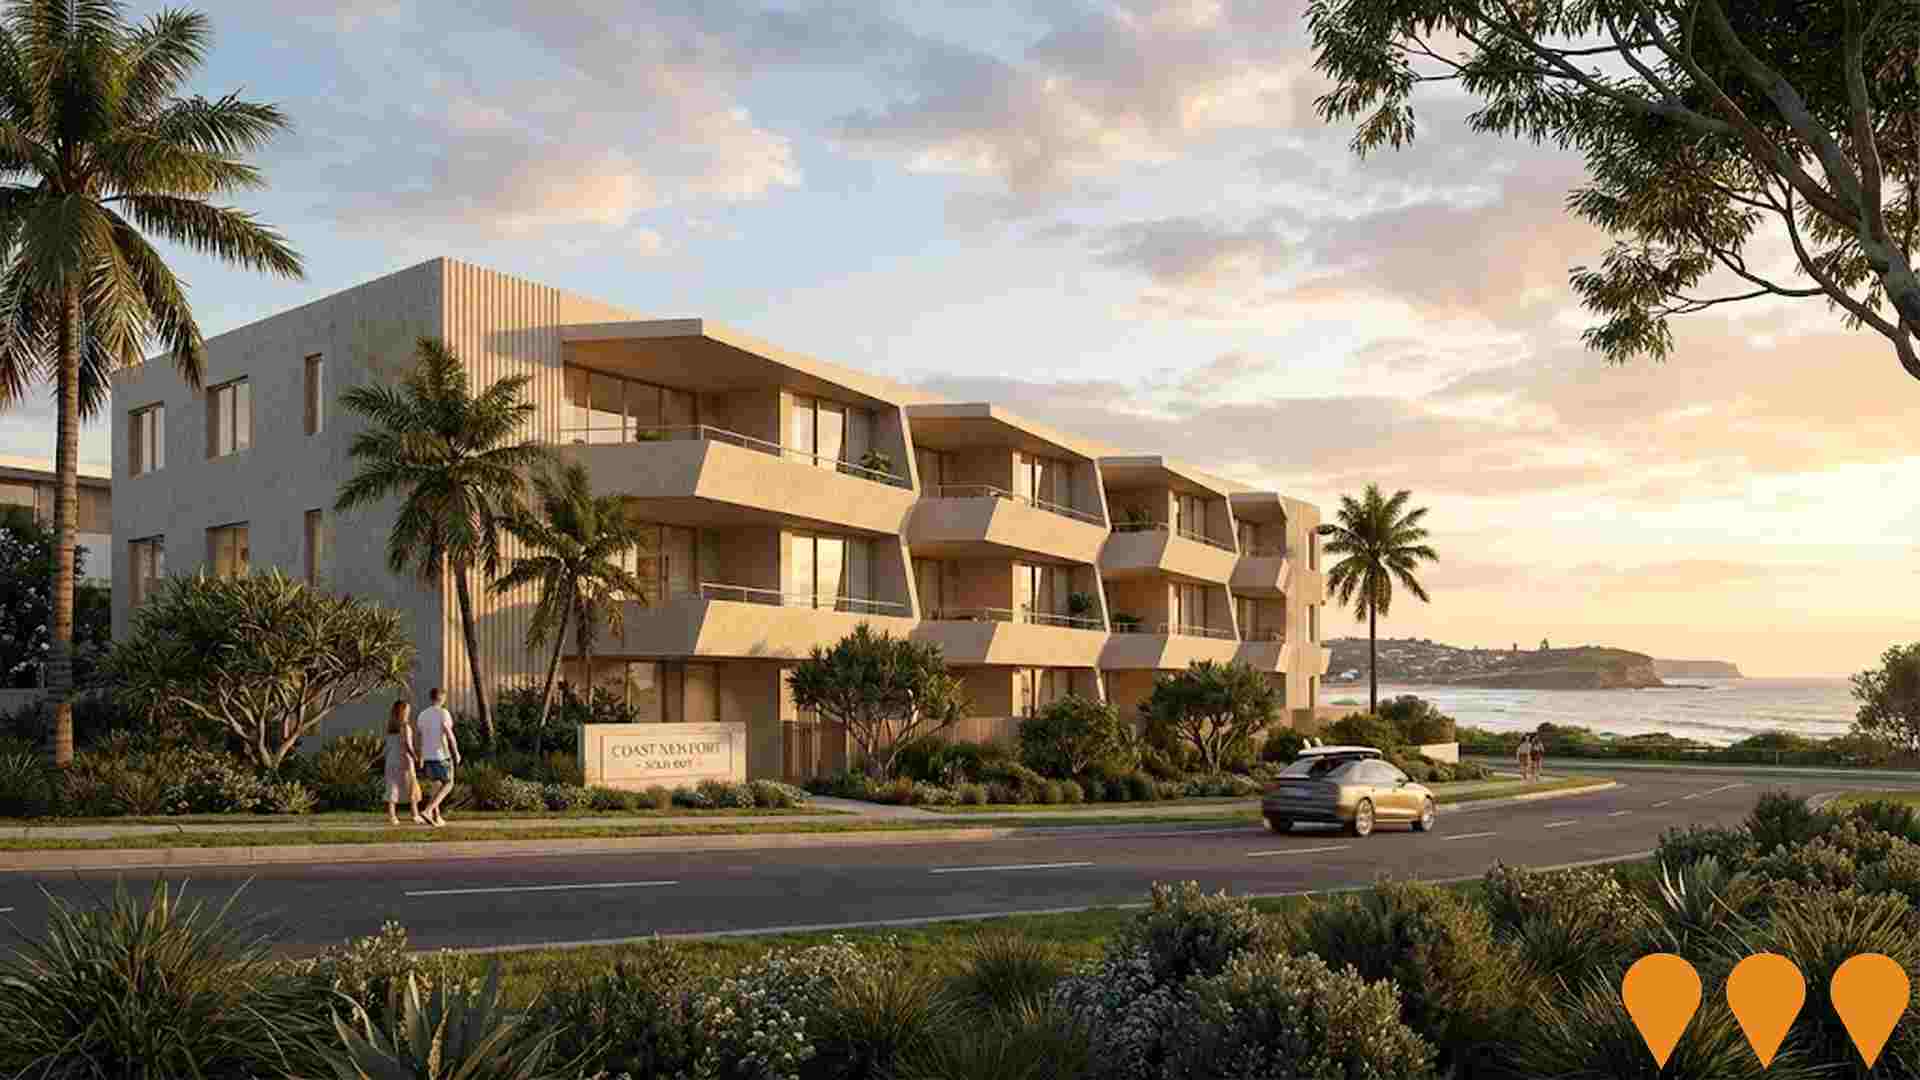
Changes in local infrastructure significantly affect an area's performance. AreaSearch has identified 14 projects that could impact this region. Notable ones include IPM Ocean Road Newport Development, Kenza Newport, The Moorings Newport, and Newport Surf Life Saving Club Alterations and Additions. The following list details those most likely to be relevant.
Professional plan users can use the search below to filter and access additional projects.
INFRASTRUCTURE SEARCH
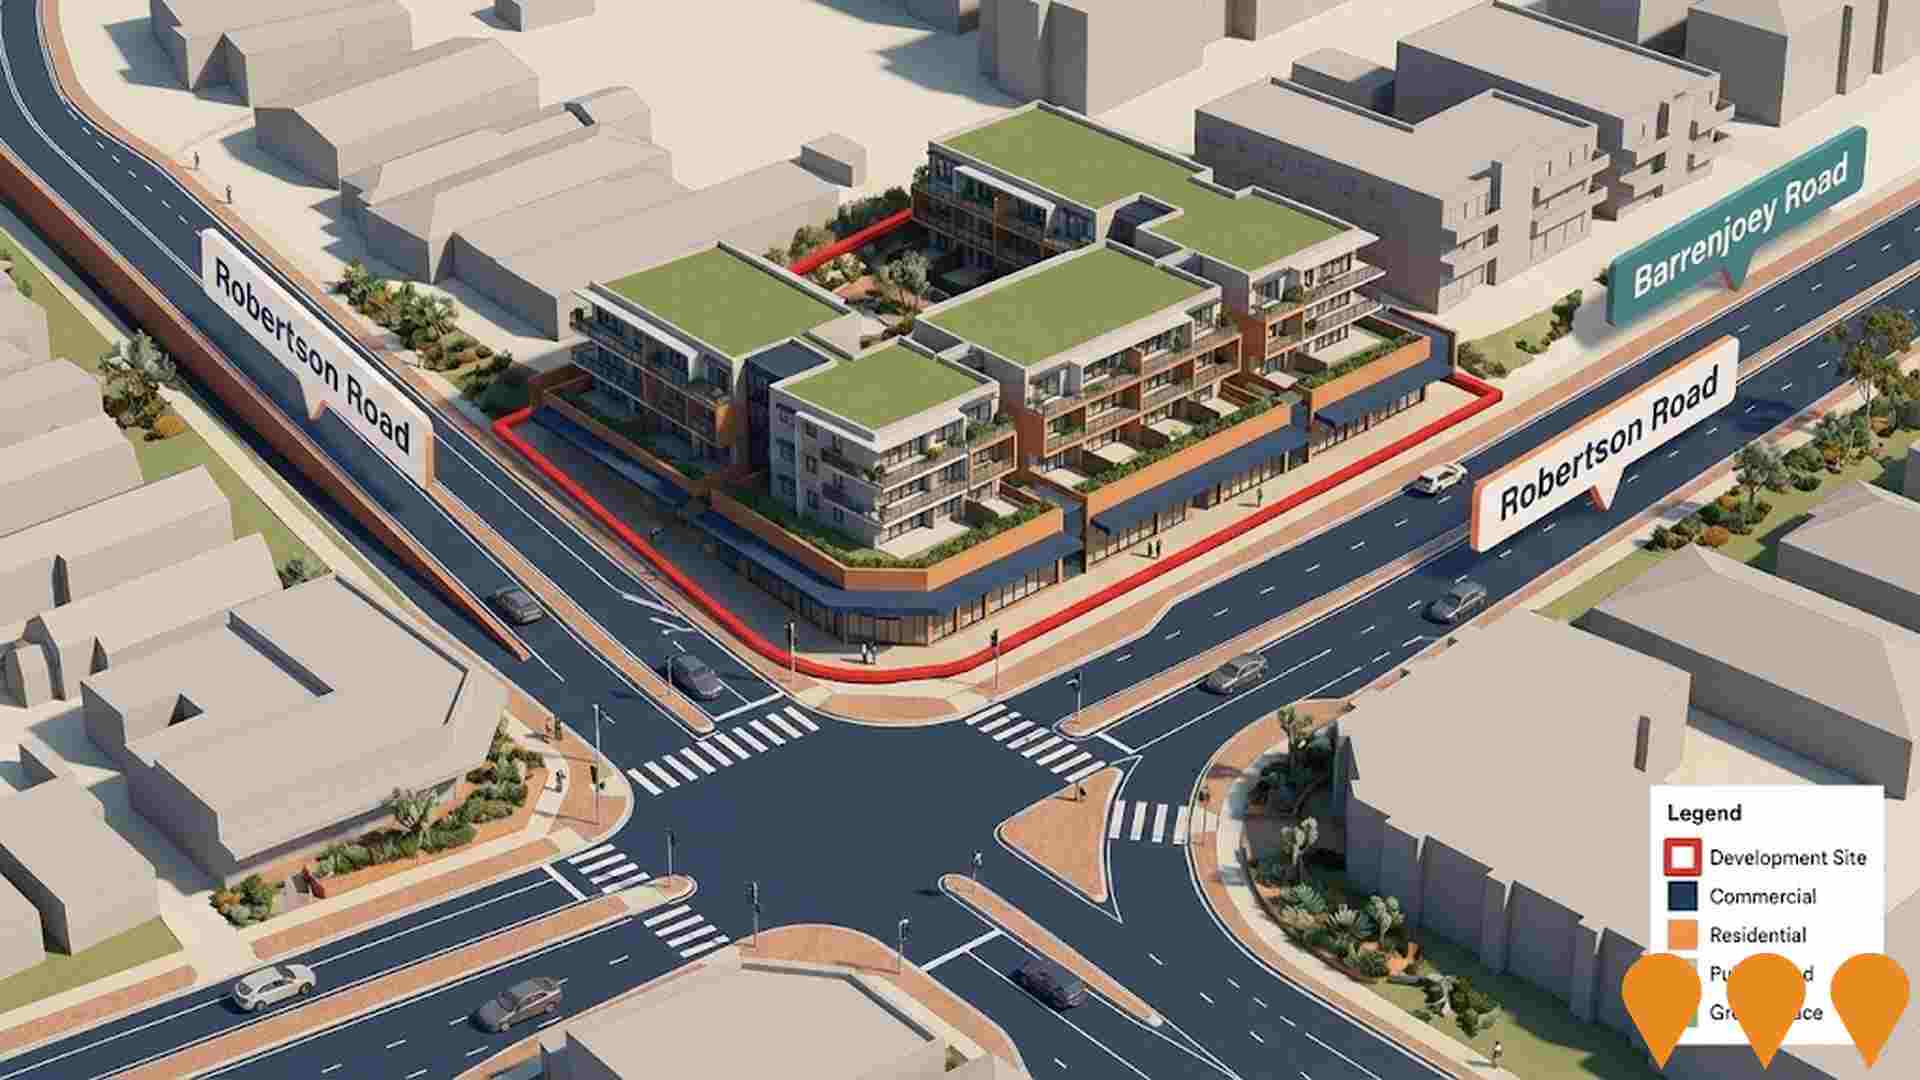
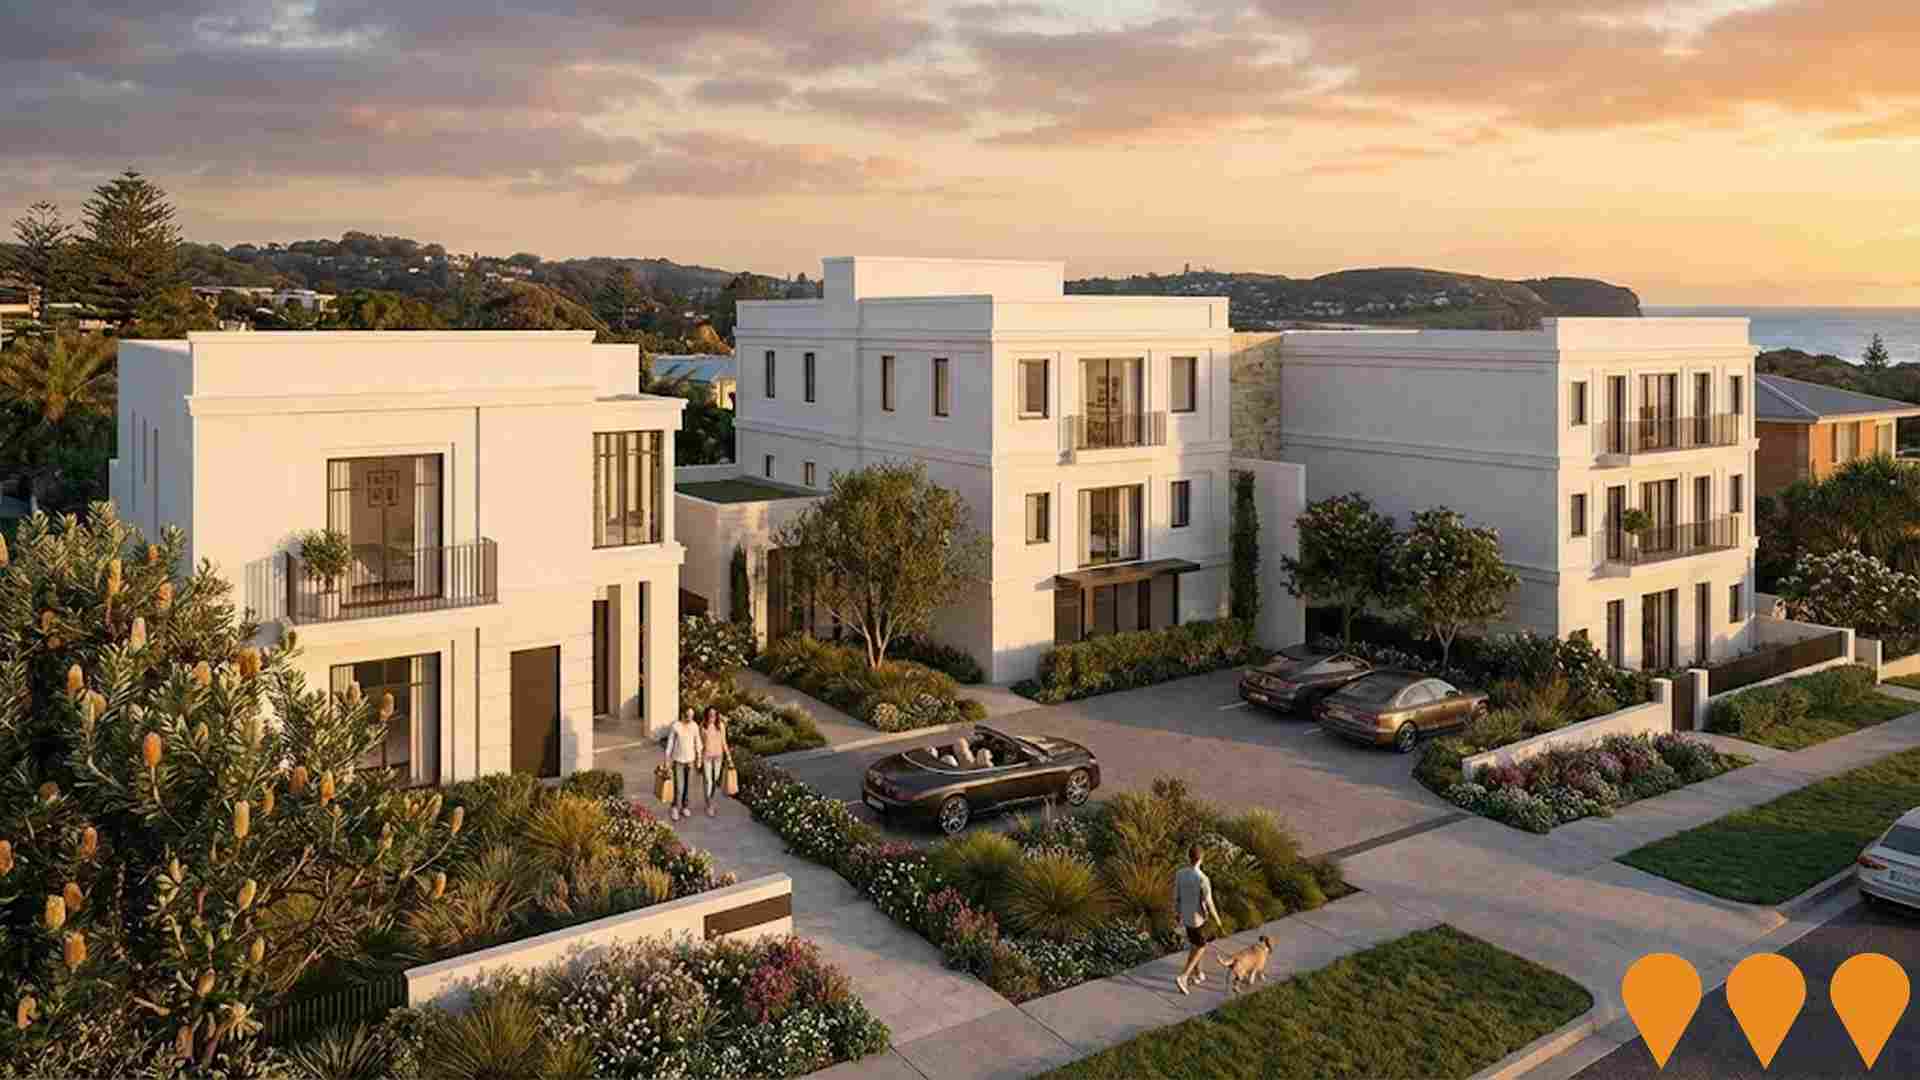
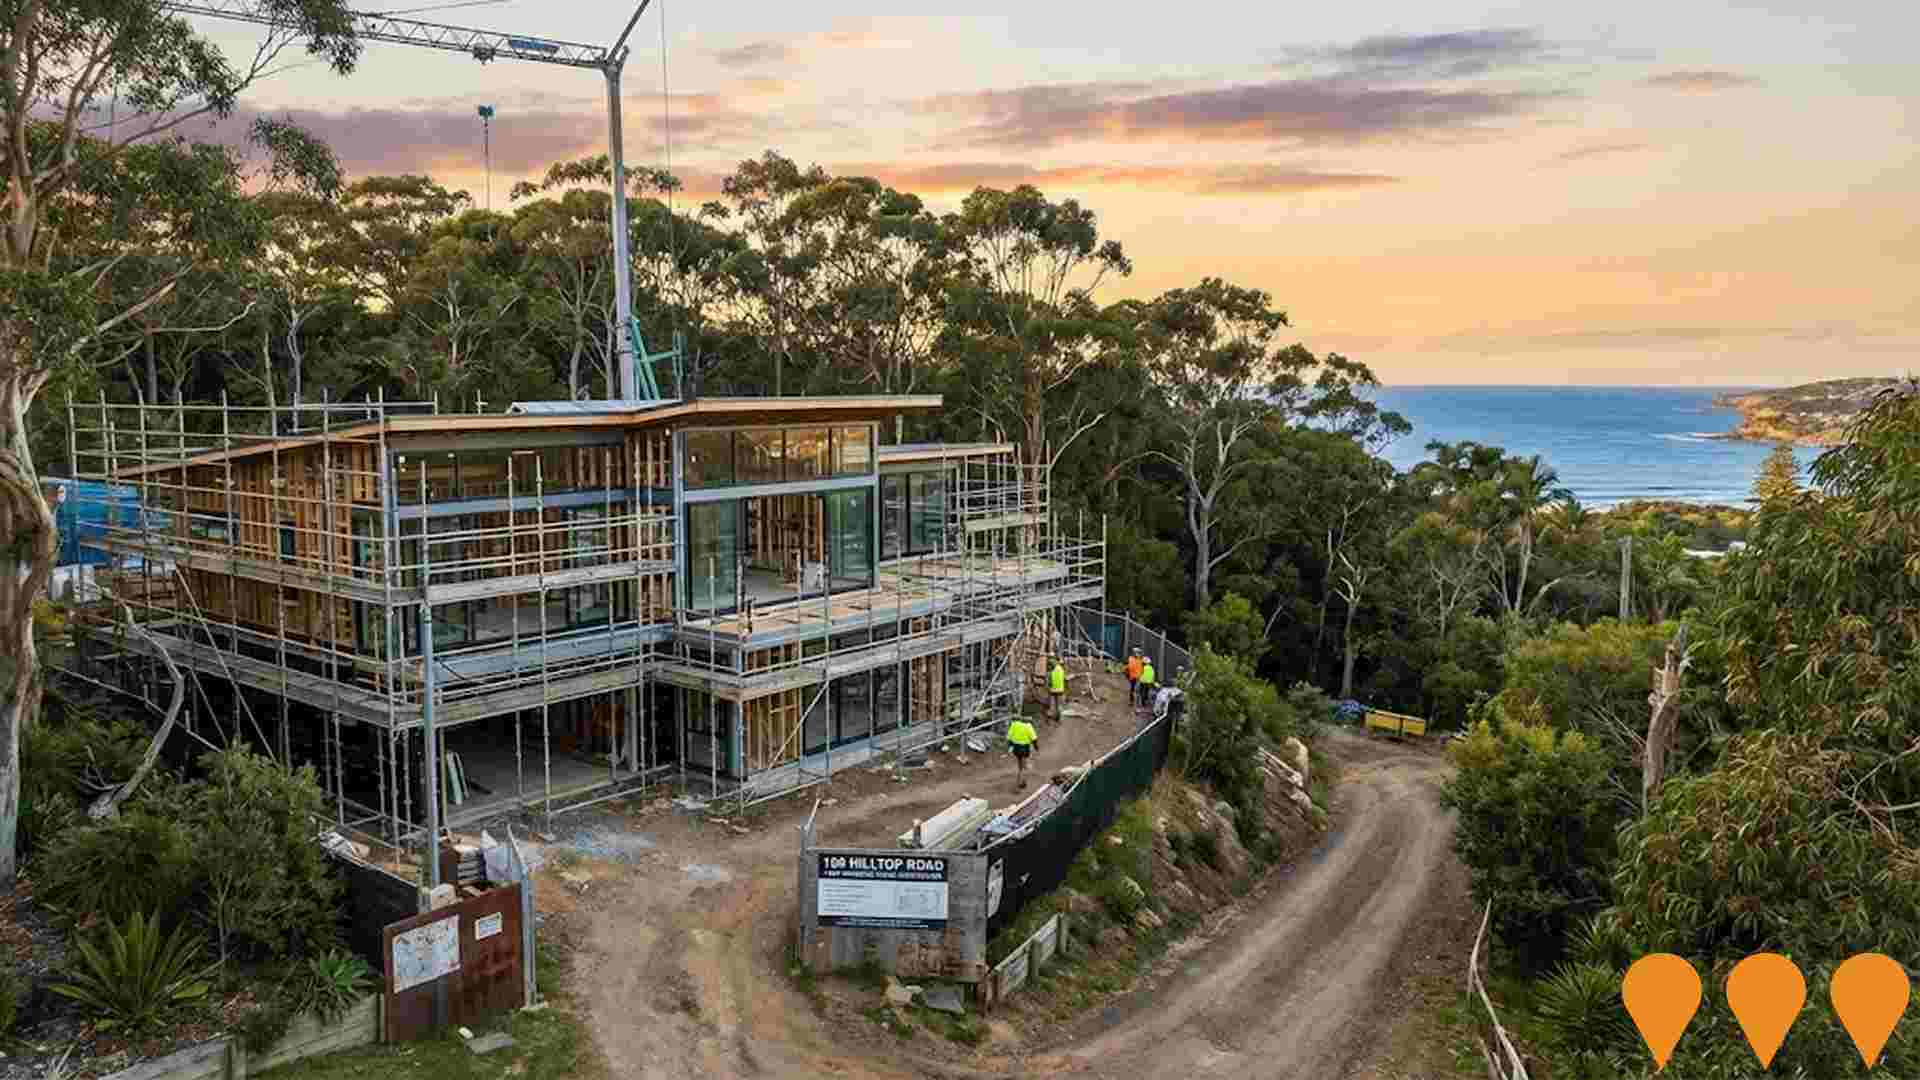
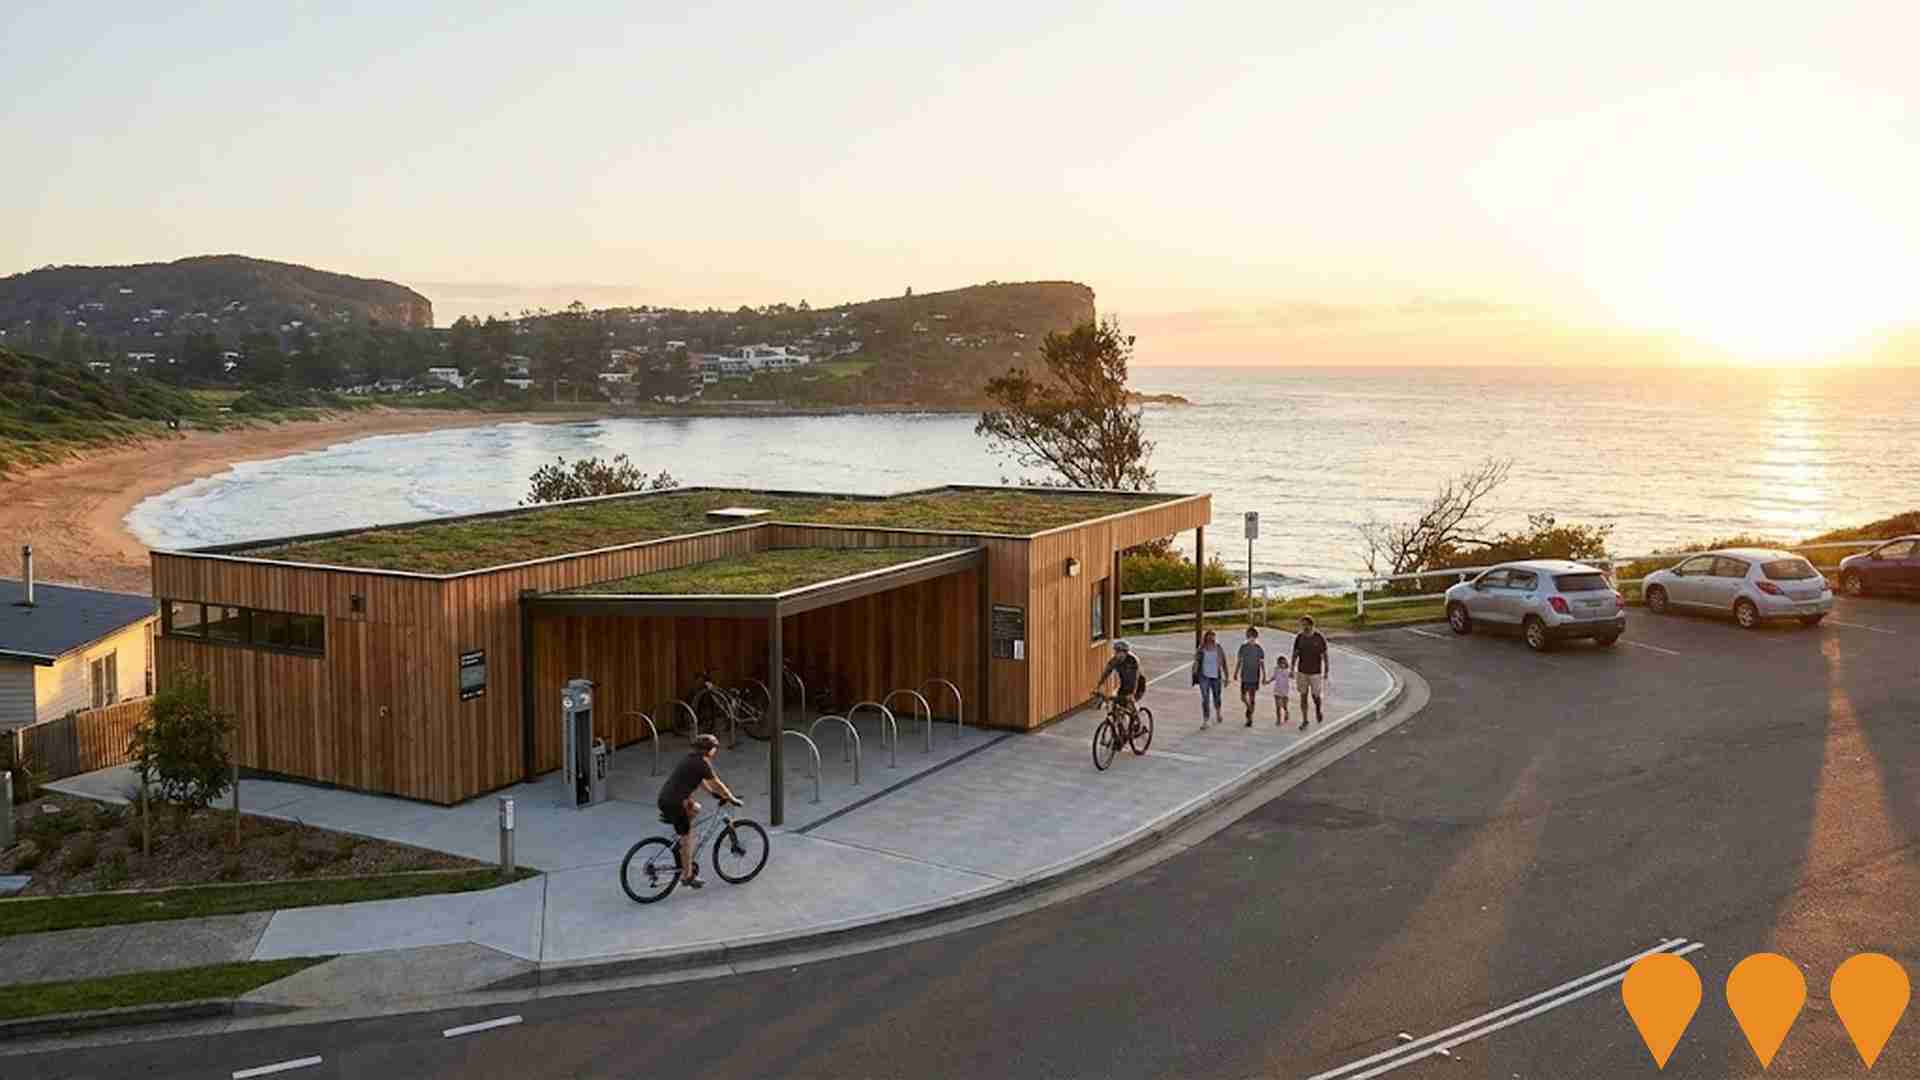
 Denotes AI-based impression for illustrative purposes only, not to be taken as definitive under any circumstances. Please follow links and conduct other investigations from the project's source for actual imagery. Developers and project owners wishing us to use original imagery please Contact Us and we will do so.
Frequently Asked Questions - Infrastructure
Mona Vale Hospital Reconfiguration
NSW Health Infrastructure has completed the reconfiguration of Mona Vale Hospital to focus on rehabilitation, sub-acute and community health services. Works included establishing a 20-bed geriatric evaluation and management and palliative care building (10-bed GEM and 10-bed palliative), creating an urgent care centre from the former ED, a new support services building, helipad relocation, and demolition of redundant buildings. The program complements services at Northern Beaches Hospital and ensures ongoing local access to appropriate care.

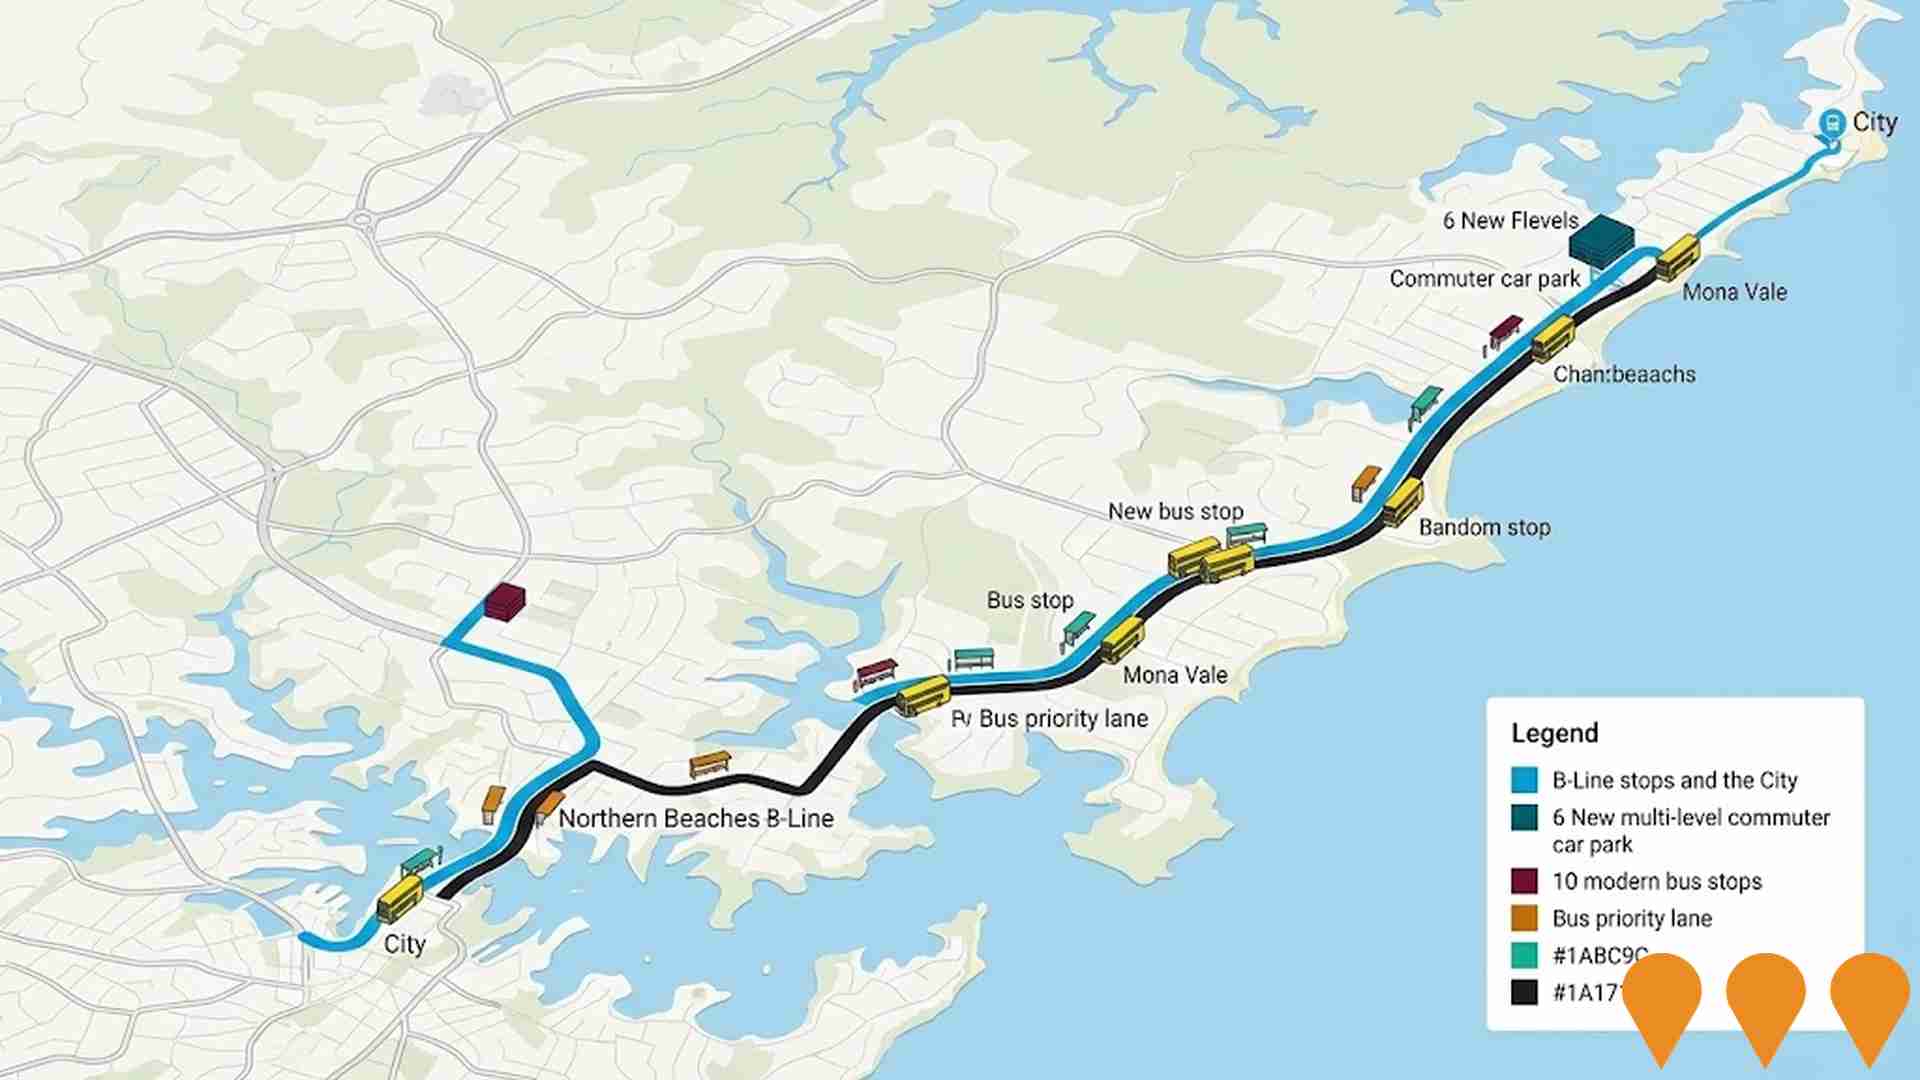
Northern Beaches B-Line Program
The B-Line Program was an integrated package of service and infrastructure improvements providing a frequent and reliable bus service between Mona Vale and the Sydney CBD. It included a new fleet of high-frequency double-decker buses, six new commuter car parks (providing around 900 new spaces), ten modern B-Line bus stops, roadwork, and bus priority measures to reduce congestion. All project construction and roadwork are complete, with the project largely operational by 2017-2020. Minor rectification works and public art installations were finalised in late 2019.
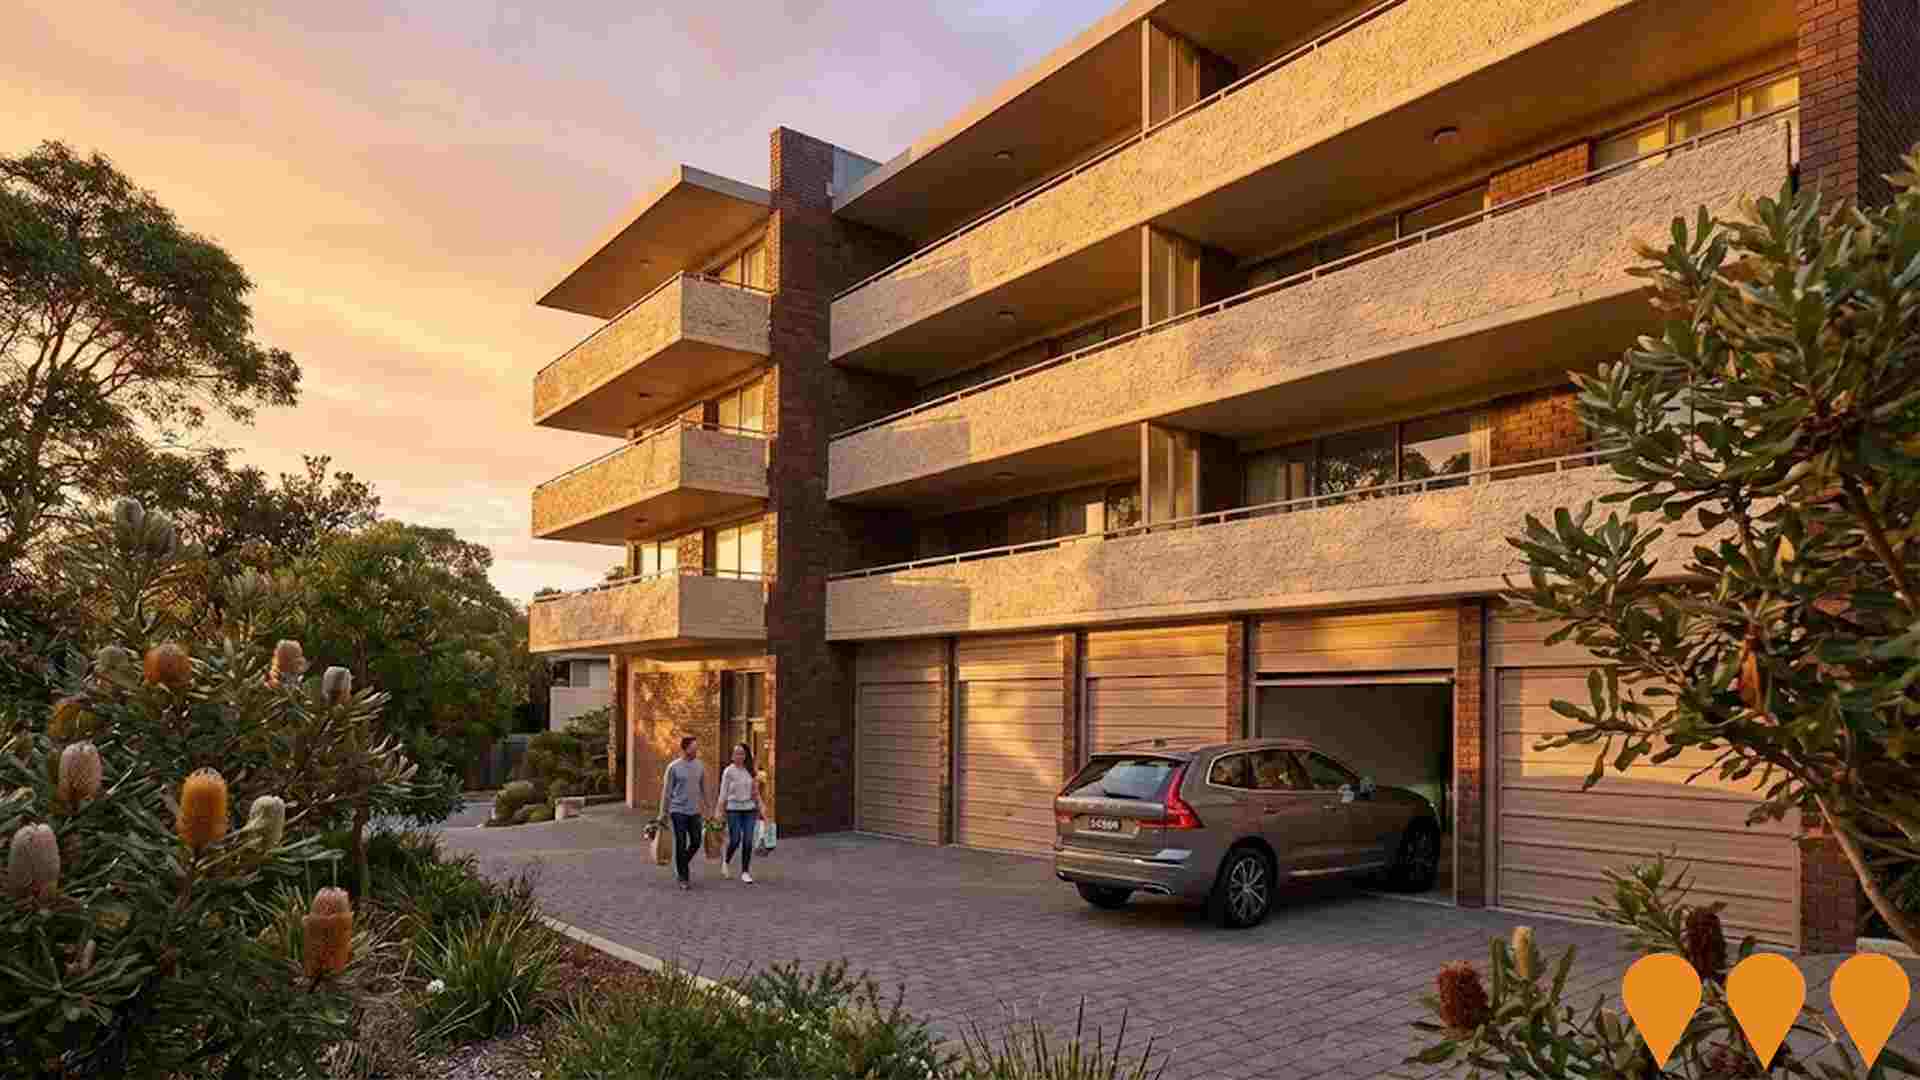
IPM Ocean Road Newport Development
Mixed-use development by IPM at Ocean Road Newport featuring residential apartments and commercial spaces. Part of IPM's $200 million Northern Beaches development pipeline.
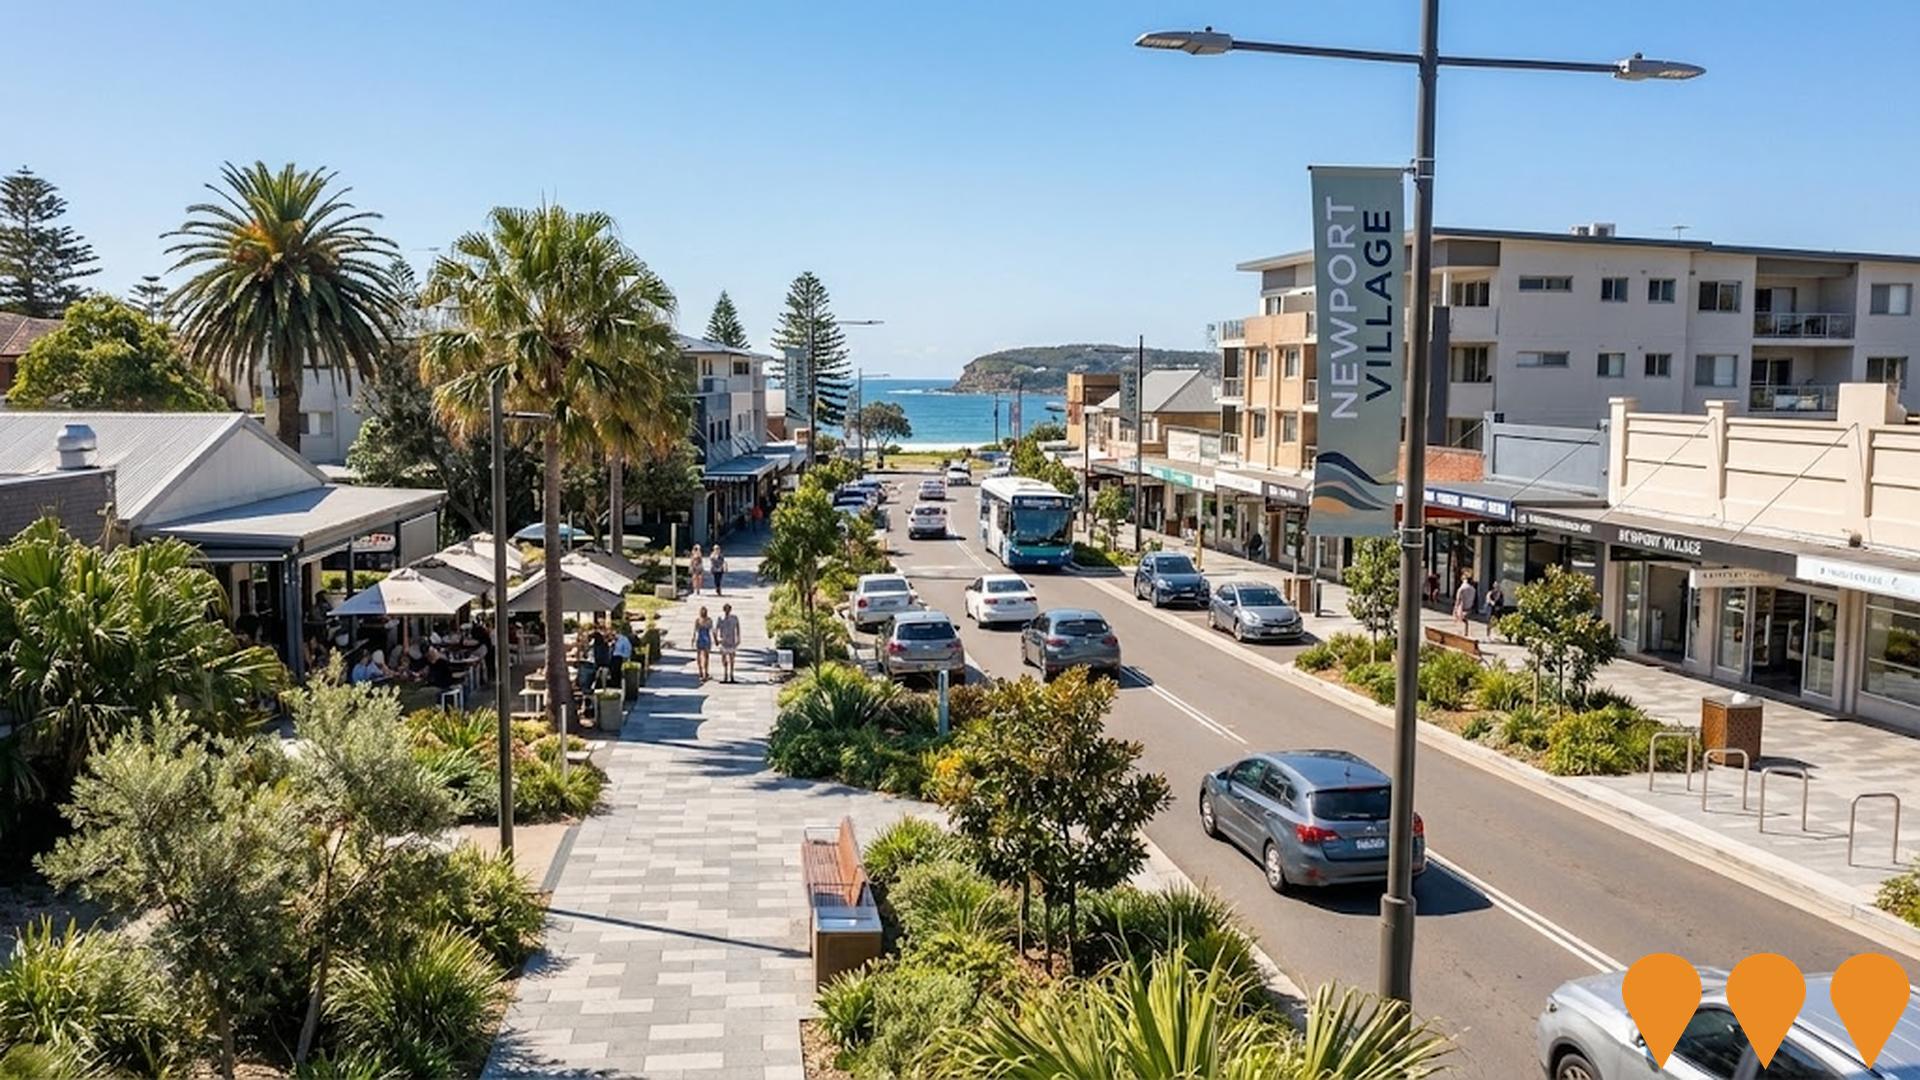
Newport Village Commercial Centre Masterplan
A masterplan adopted by the former Pittwater Council in November 2007 to establish a holistic vision for the Newport Village Commercial Centre. The plan focuses on enhancing public spaces, traffic calming, and mixed uses to create a vibrant seaside village hub. It provides an urban design framework, and its principles are incorporated into the Pittwater Development Control Plan (DCP) to guide future development in the area. The masterplan has been used to assess subsequent development applications in the village.
Mona Vale Place Plan
Comprehensive revitalisation plan for Mona Vale village centre. Currently on hold pending NSW Government Stage 2 housing reforms which were released February 2025.

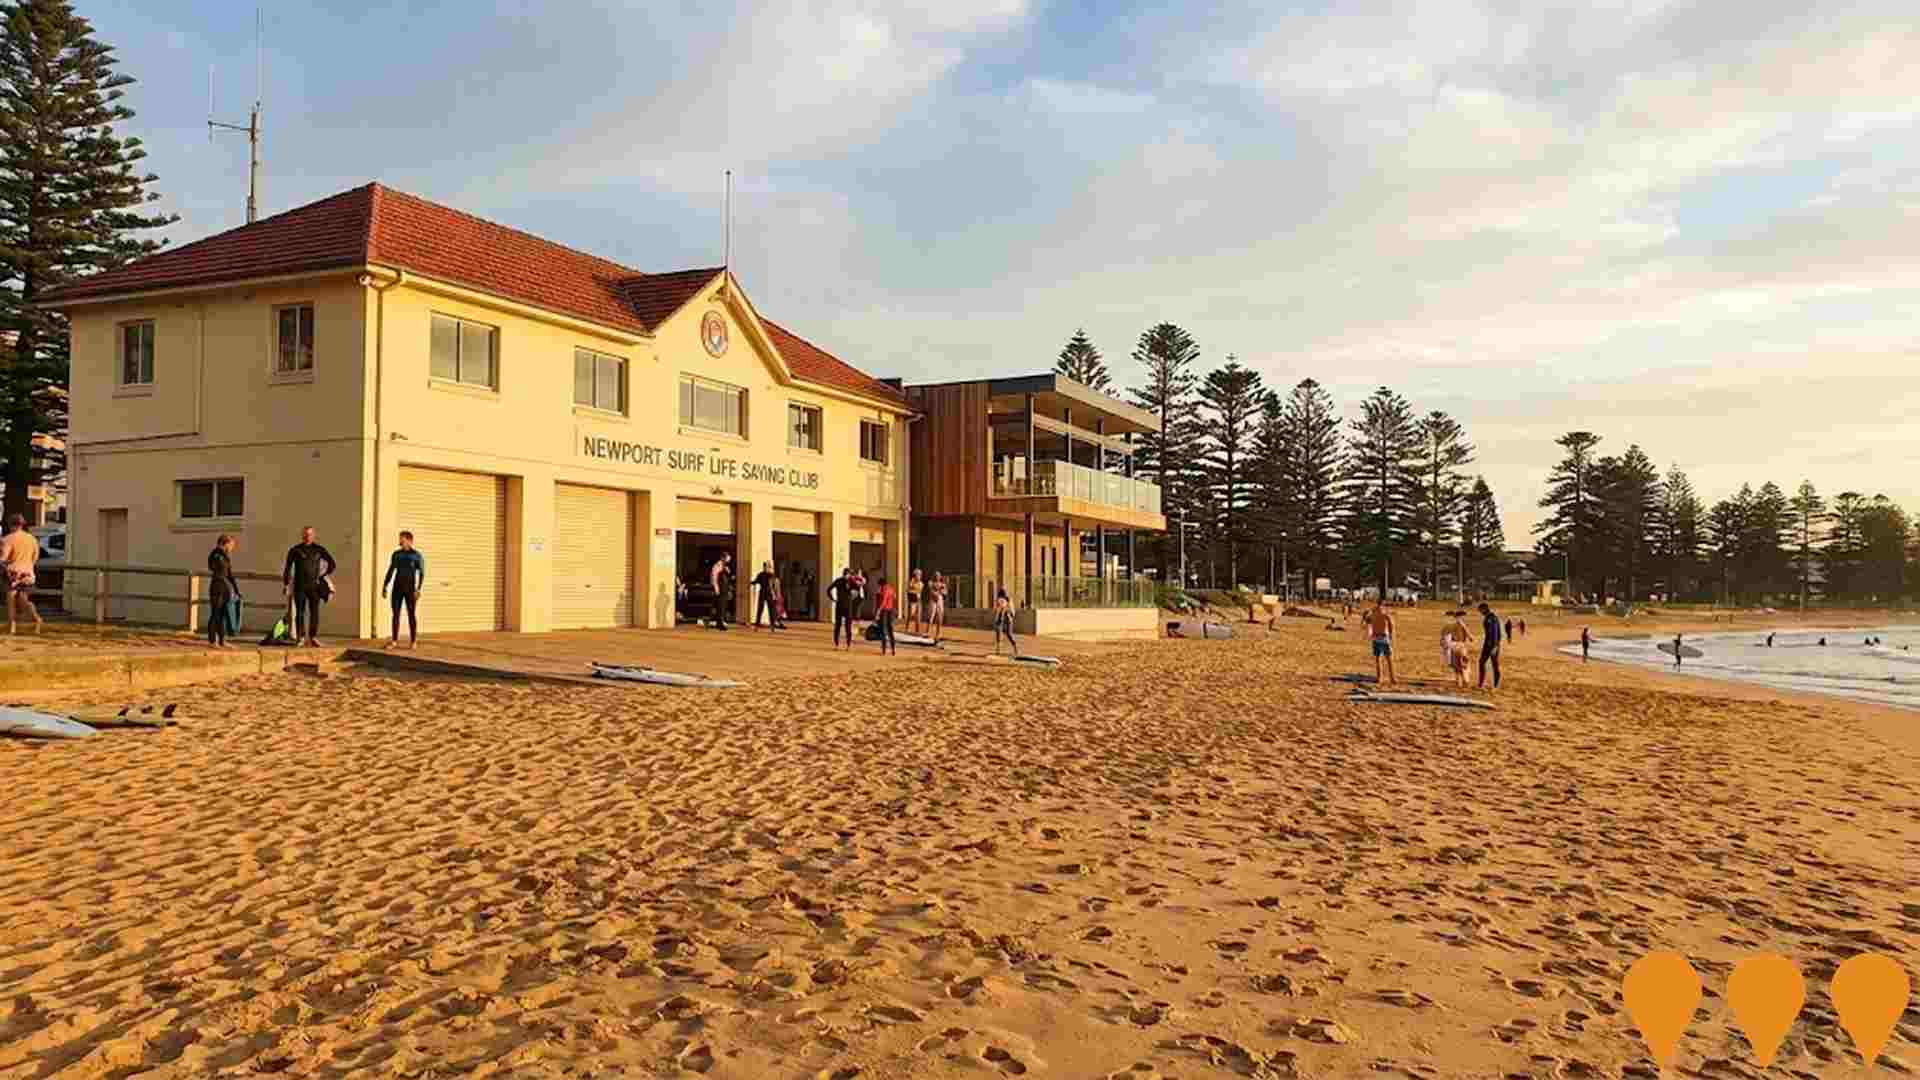
Newport Surf Life Saving Club Alterations and Additions
Alterations and additions to the heritage-listed surf club building, including a new contemporary northern extension to improve amenity and functionality, and coastal protection works in the form of a buried seawall along the length of the building to mitigate erosion risk. The project will provide increased storage, a new internal lift, dedicated training rooms, and enhanced community and club spaces.
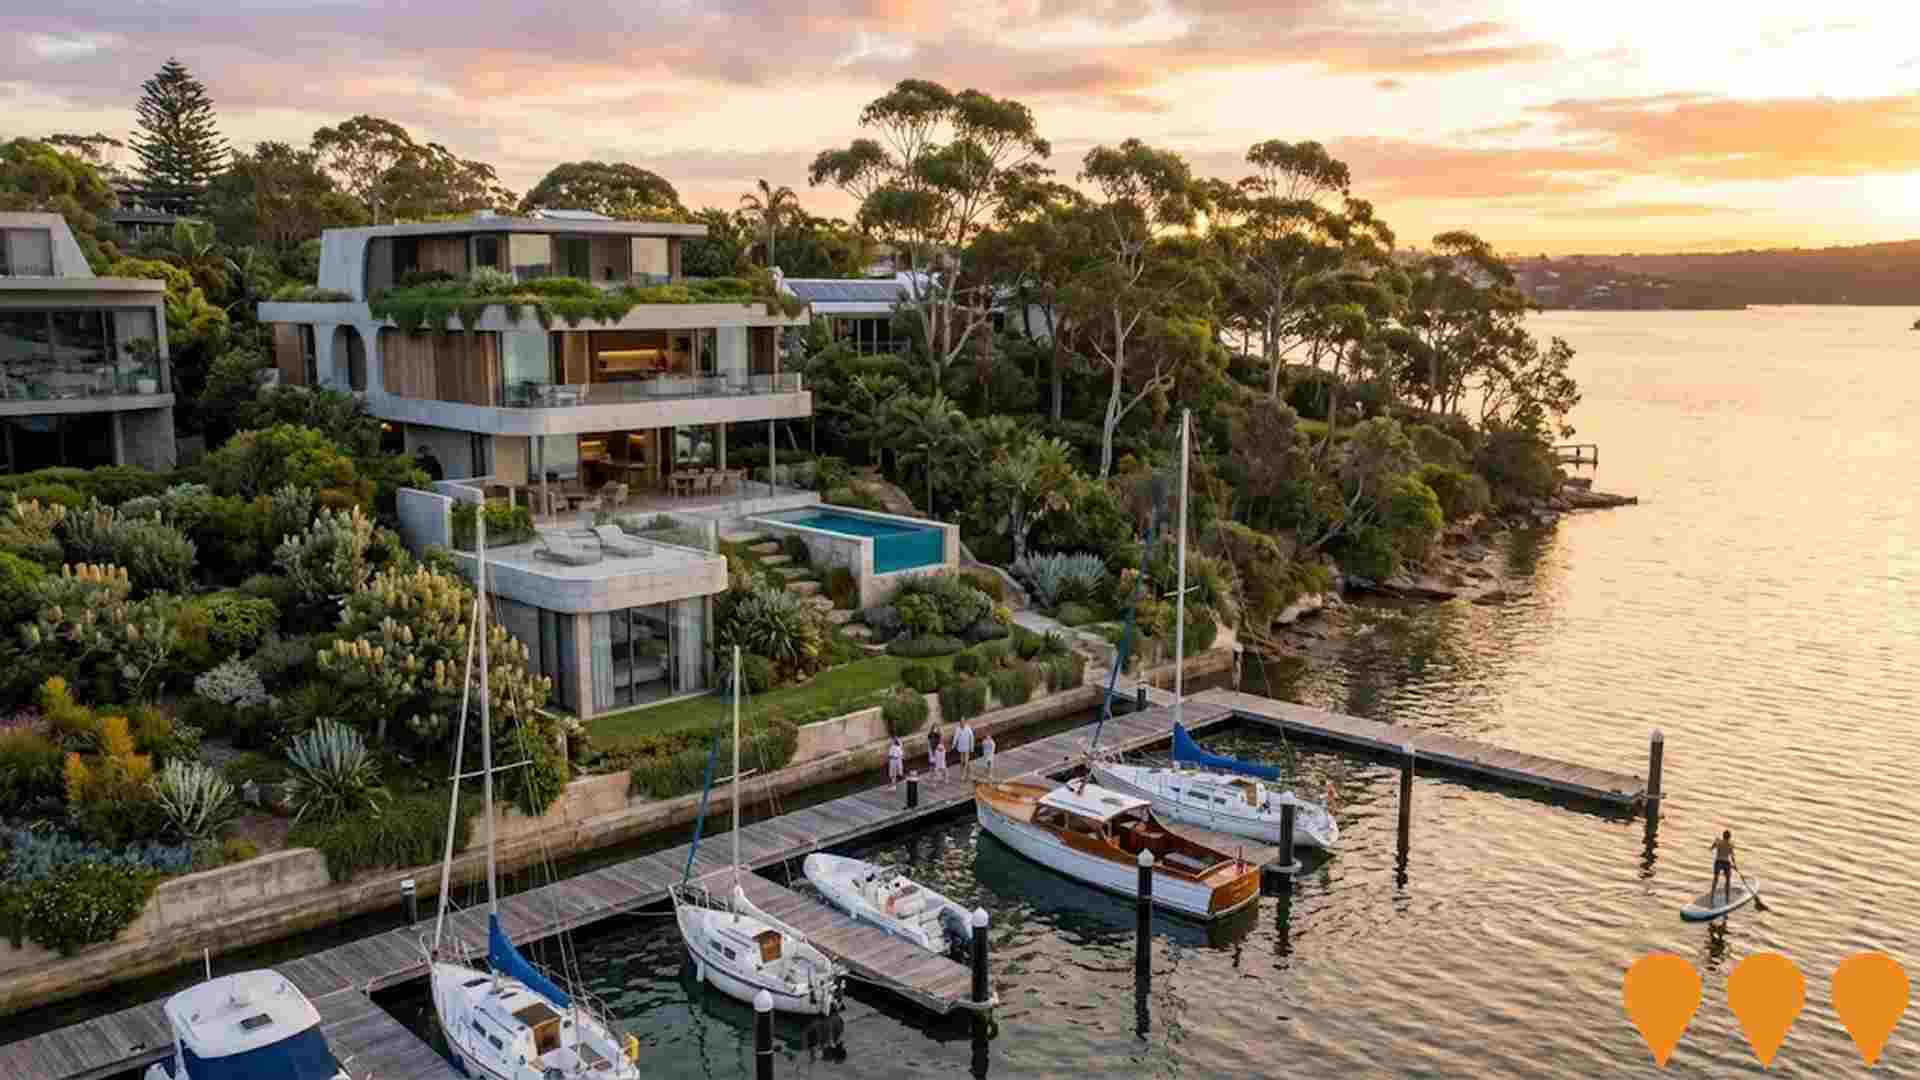
The Moorings Newport
An exclusive collection of eight luxury waterfront homes/lots with private 25-30 metre enclosed marina pens on Winji Jimmi Bay, Pittwater, offering buyers the option to acquire a custom-designed home by Scott Carver or to build their own. The development is on the site of the former Sirsi Marina.
Qubec Newport
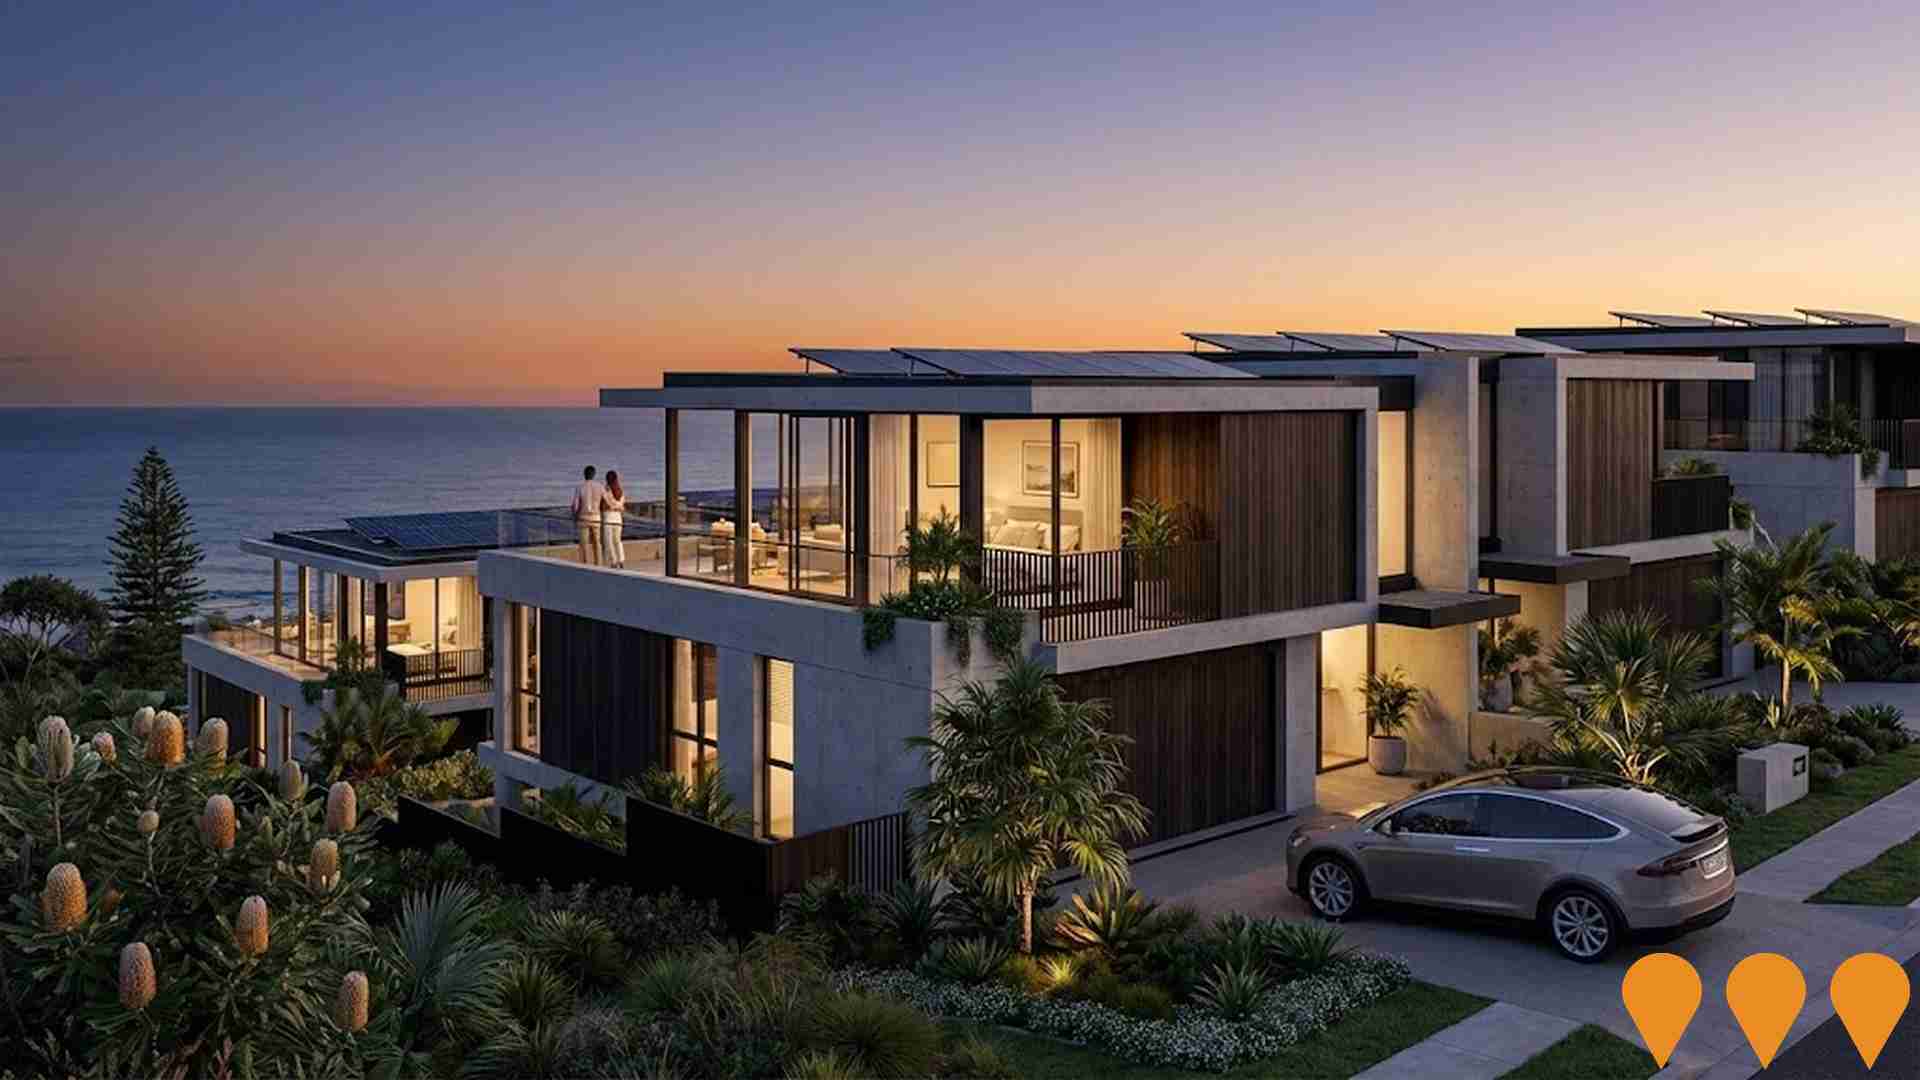
An exclusive, luxury, and sustainable townhome development with 18 residences in Newport, NSW. Features include polished concrete, smart home technology, private elevators, individual solar power and battery storage, EV charging, and biometric/numberplate recognition access. The project was completed in 2023.
Employment
Despite maintaining a low unemployment rate of 3.7%, Newport - Bilgola has experienced recent job losses, resulting in a below average employment performance ranking when compared nationally
Newport-Bilgola has a highly educated workforce with significant representation in the technology sector. As of September 2025, its unemployment rate is 3.7%.
In that month, 7,803 residents were employed, which was 0.5% below Greater Sydney's unemployment rate of 4.2%. Workforce participation in Newport-Bilgola was 65.1%, compared to Greater Sydney's 60.0%. The key industries of employment among residents are professional & technical, construction, and health care & social assistance. Construction is particularly strong, with an employment share 1.4 times the regional level.
However, transport, postal & warehousing is under-represented, at 2.6% compared to Greater Sydney's 5.3%. The area appears to offer limited local employment opportunities, as indicated by the difference between Census working population and resident population. In the 12 months prior, Newport-Bilgola's labour force decreased by 0.5%, with a 1.7% decline in employment leading to a 1.2 percentage point rise in unemployment. Meanwhile, Greater Sydney experienced employment growth of 2.1% and labour force growth of 2.4%. State-level data as of 25-Nov shows NSW employment contracted by 0.03%, with an unemployment rate of 3.9%, compared to the national rate of 4.3%. Jobs and Skills Australia's national employment forecasts from May-25 suggest that over five years, national employment is expected to expand by 6.6%, and over ten years, by 13.7%. Applying these projections to Newport-Bilgola's employment mix indicates potential local employment growth of 6.9% over five years and 14.0% over ten years.
Frequently Asked Questions - Employment
Income
Income metrics indicate excellent economic conditions, with the area achieving higher performance than 75% of national locations assessed by AreaSearch
The Newport - Bilgola SA2 had a median taxpayer income of $58,932 and an average income of $108,744 in the financial year 2022, according to postcode level ATO data aggregated by AreaSearch. This is notably higher than Greater Sydney's median income of $56,994 and average income of $80,856. By September 2025, estimates suggest a median income of approximately $66,363 and an average income of around $122,457, based on Wage Price Index growth of 12.61% since financial year 2022. As per the 2021 Census, incomes in Newport - Bilgola rank highly nationally, with household incomes at the 89th percentile, family incomes at the 86th percentile, and personal incomes at the 92nd percentile. Income analysis shows that the $4000+ bracket is dominant, with 32.4% of residents (4,504 people), contrasting with regional levels where the $1,500 - 2,999 bracket leads at 30.9%. The area exhibits significant affluence, with 44.5% earning over $3,000 per week, supporting premium retail and service offerings. High housing costs consume 15.2% of income, yet strong earnings place disposable income at the 92nd percentile nationally. The SEIFA income ranking places Newport - Bilgola in the 10th decile.
Frequently Asked Questions - Income
Housing
Newport - Bilgola is characterized by a predominantly suburban housing profile, with a higher proportion of rental properties than the broader region
Newport-Bilgola's dwelling structure, as per the latest Census, consisted of 73.0% houses and 26.9% other dwellings (semi-detached, apartments, 'other' dwellings). This compares to Sydney metro's 72.1% houses and 27.9% other dwellings. Home ownership in Newport-Bilgola stood at 41.5%, with mortgaged dwellings at 39.1% and rented ones at 19.4%. The median monthly mortgage repayment was $3,033, lower than Sydney metro's average of $3,200. Median weekly rent in the area was $628, compared to Sydney metro's $695. Nationally, Newport-Bilgola's mortgage repayments were higher at $3,033 compared to the Australian average of $1,863, and rents were substantially above the national figure of $375.
Frequently Asked Questions - Housing
Household Composition
Newport - Bilgola features high concentrations of family households, with a fairly typical median household size
Family households account for 78.1% of all households, including 37.2% couples with children, 31.7% couples without children, and 8.5% single parent families. Non-family households constitute the remaining 21.9%, with lone person households at 19.9% and group households comprising 2.0%. The median household size is 2.7 people, which aligns with the Greater Sydney average.
Frequently Asked Questions - Households
Local Schools & Education
Educational achievement in Newport - Bilgola places it within the top 10% nationally, reflecting strong academic performance and high qualification levels across the community
The area's educational profile is notable regionally, with university qualification rates of 39.7% among residents aged 15+, surpassing the Australian average of 30.4% and the NSW rate of 32.2%. Bachelor degrees are most prevalent at 27.4%, followed by postgraduate qualifications (9.0%) and graduate diplomas (3.3%). Vocational credentials are also prominent, with 33.1% of residents aged 15+ holding such skills – advanced diplomas account for 14.5% and certificates for 18.6%.
Educational participation is high, with 28.3% of residents currently enrolled in formal education, including 8.8% in primary, 8.8% in secondary, and 5.3% pursuing tertiary education.
Frequently Asked Questions - Education
Schools Detail
Nearby Services & Amenities
Transport
Transport servicing is moderate compared to other areas nationally based on assessment of service frequency, route connectivity and accessibility
Newport-Bilgola has 61 active public transport stops offering a mix of ferry and bus services. These stops are served by 36 different routes that collectively facilitate 1,839 weekly passenger trips. Transport accessibility is deemed good with residents located an average of 218 meters from the nearest stop.
Service frequency averages 262 trips per day across all routes, equating to roughly 30 weekly trips per individual stop.
Frequently Asked Questions - Transport
Transport Stops Detail
Health
Newport - Bilgola's residents boast exceedingly positive health performance metrics with very low prevalence of common health conditions across all age groups
Newport-Bilgola demonstrates excellent health outcomes with very low prevalence of common conditions across all ages. The private health cover rate is exceptionally high at approximately 75% (10,468 people), compared to the national average of 55.3%.
The most prevalent medical conditions are arthritis and asthma, affecting 7.6 and 6.3% of residents respectively. A total of 73.6% of residents report no medical ailments, slightly higher than Greater Sydney's 72.8%. In Newport-Bilgola, 22.9% of residents are aged 65 and over (3,180 people), lower than Greater Sydney's 24.1%. Health outcomes among seniors in the area are particularly strong, outperforming general population metrics.
Frequently Asked Questions - Health
Cultural Diversity
In terms of cultural diversity, Newport - Bilgola records figures broadly comparable to the national average, as found in AreaSearch's assessment of a number of language and cultural background related metrics
Newport-Bilgola's cultural diversity is similar to the wider region's average, with 75.6% of its population born in Australia, 91.0% being citizens, and 92.9% speaking English only at home. Christianity is the dominant religion in Newport-Bilgola, comprising 48.0% of the population. However, Judaism is overrepresented, making up 0.4% compared to the regional average of 0.3%.
The top three ancestry groups are English (33.6%), Australian (23.1%), and Irish (9.8%). Notably, French (0.9% vs 0.8%), South African (0.9% vs 0.8%), and Scottish (9.3% vs 8.7%) ethnicities are overrepresented in Newport-Bilgola compared to the regional averages.
Frequently Asked Questions - Diversity
Age
Newport - Bilgola hosts an older demographic, ranking in the top quartile nationwide
The median age in Newport-Bilgola is 46 years, which is notably higher than Greater Sydney's average of 37 years and also exceeds the Australian median of 38 years. Compared to Greater Sydney, the 55-64 age cohort is significantly over-represented in Newport-Bilgola at 16.5%, while the 25-34 age group is under-represented at 7.3%. The proportion of the 55-64 cohort is well above the national average of 11.2%. Between the 2021 Census and September 2022, the population aged 15 to 24 increased from 11.8% to 13.8%, while those aged 75 to 84 grew from 6.7% to 8.2%. Conversely, the proportion of those aged 5 to 14 decreased from 12.4% to 10.9%, and the 25-34 age group dropped from 8.5% to 7.3%. Population forecasts for Newport-Bilgola indicate significant demographic changes by 2041. The number of people aged 85 and above is projected to increase dramatically, rising from 316 to 728, an expansion of 411 people or 130%. The aging population trend is evident, with those aged 65 and above accounting for all projected growth. Conversely, the 55-64 and 25-34 age cohorts are expected to experience population declines.
