Chart Color Schemes
est. as @ -- *
ABS ERP | -- people | --
2021 Census | -- people
Sales Activity
Curious about local property values? Filter the chart to assess the volume and appreciation (including resales) trends and regional comparisons, or scroll to the map below view this information at an individual property level.
Find a Recent Sale
Sales Detail
Population
An assessment of population growth drivers in Cromer reveals an overall ranking slightly below national averages considering recent, and medium term trends
Cromer's population was approximately 8,299 as of November 2025. This figure represents an increase of 253 people, a 3.1% rise from the 2021 Census count of 8,046 residents. The change is inferred from the estimated resident population of 8,282 in June 2024 and an additional 10 validated new addresses since the Census date. This results in a population density ratio of 1,108 persons per square kilometer, comparable to averages across locations assessed by AreaSearch. Over the past decade, Cromer has shown resilient growth patterns with a compound annual growth rate of 0.8%, outperforming its SA3 area. Overseas migration contributed approximately 75.9% of overall population gains during recent periods.
AreaSearch is adopting ABS/Geoscience Australia projections for each SA2 area, released in 2024 with a base year of 2022. For areas not covered by this data, AreaSearch uses NSW State Government's SA2 level projections, released in 2022 with a base year of 2021. Growth rates by age group from these aggregations are applied to all areas for years 2032 to 2041. Based on projected demographic shifts, lower quartile growth is anticipated for statistical areas analysed by AreaSearch. Cromer is expected to grow by 89 persons to 2041, reflecting a total gain of 0.9% over the 17 years.
Frequently Asked Questions - Population
Development
Residential development activity is lower than average in Cromer according to AreaSearch's national comparison of local real estate markets
Cromer has recorded approximately 14 residential properties granted approval annually. Over the past five financial years, from FY21 to FY25, 72 homes have been approved, with one more approved so far in FY26. On average, for every home built over these five years, there are 3.5 new residents.
This indicates that demand significantly exceeds new supply, typically leading to price growth and increased buyer competition. New properties are constructed at an average expected construction cost of $238,000, which is below regional norms, offering more affordable housing options for purchasers. In FY26, there have been $7.8 million in commercial approvals, suggesting limited focus on commercial development. Compared to Greater Sydney, Cromer shows approximately 60% of the construction activity per person.
Nationally, it places among the 22nd percentile of areas assessed, indicating more limited choices for buyers and supporting demand for existing homes. This activity is also below average nationally, reflecting the area's maturity and possible planning constraints. Recent construction in Cromer comprises 64.0% standalone homes and 36.0% townhouses or apartments, showing an expanding range of medium-density options to create a mix of opportunities across price brackets. The location has approximately 753 people per dwelling approval, demonstrating an established market. Looking ahead, Cromer is expected to grow by 72 residents through to 2041, according to the latest AreaSearch quarterly estimate. At current development rates, new housing supply should comfortably meet demand, providing good conditions for buyers and potentially supporting growth beyond current population projections.
Frequently Asked Questions - Development
Infrastructure
Cromer has moderate levels of nearby infrastructure activity, ranking in the top 50% nationally
The performance of an area is significantly influenced by changes in local infrastructure, major projects, and planning initiatives. AreaSearch has identified 18 such projects that are expected to impact the area. Notable projects include Wakehurst Parkway Improvements (Frenchs Forest to Narrabeen), Casa Delmar, Northern Beaches Corridor Capacity: Seaforth To Mona Vale (A8), and Northern Beaches Bus Network Improvements. The following list details those projects likely to be most relevant.
Professional plan users can use the search below to filter and access additional projects.
INFRASTRUCTURE SEARCH
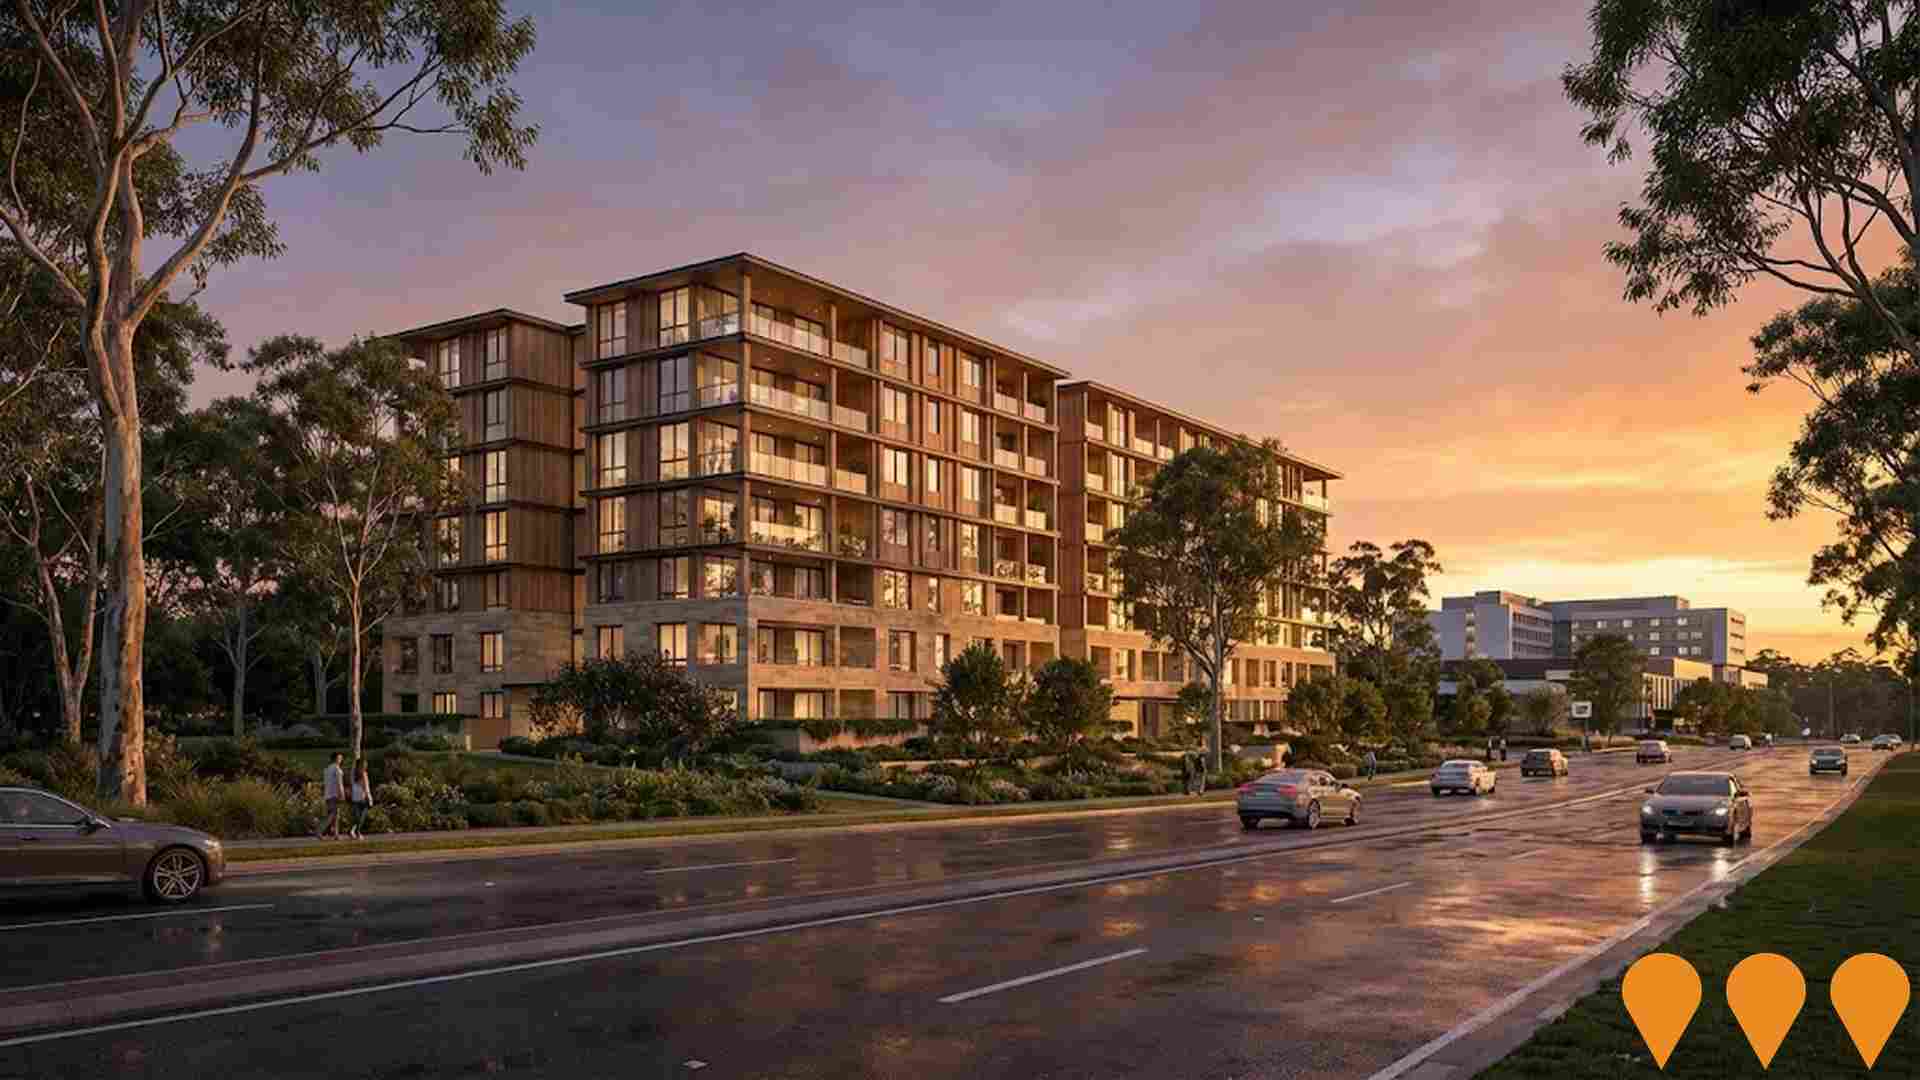
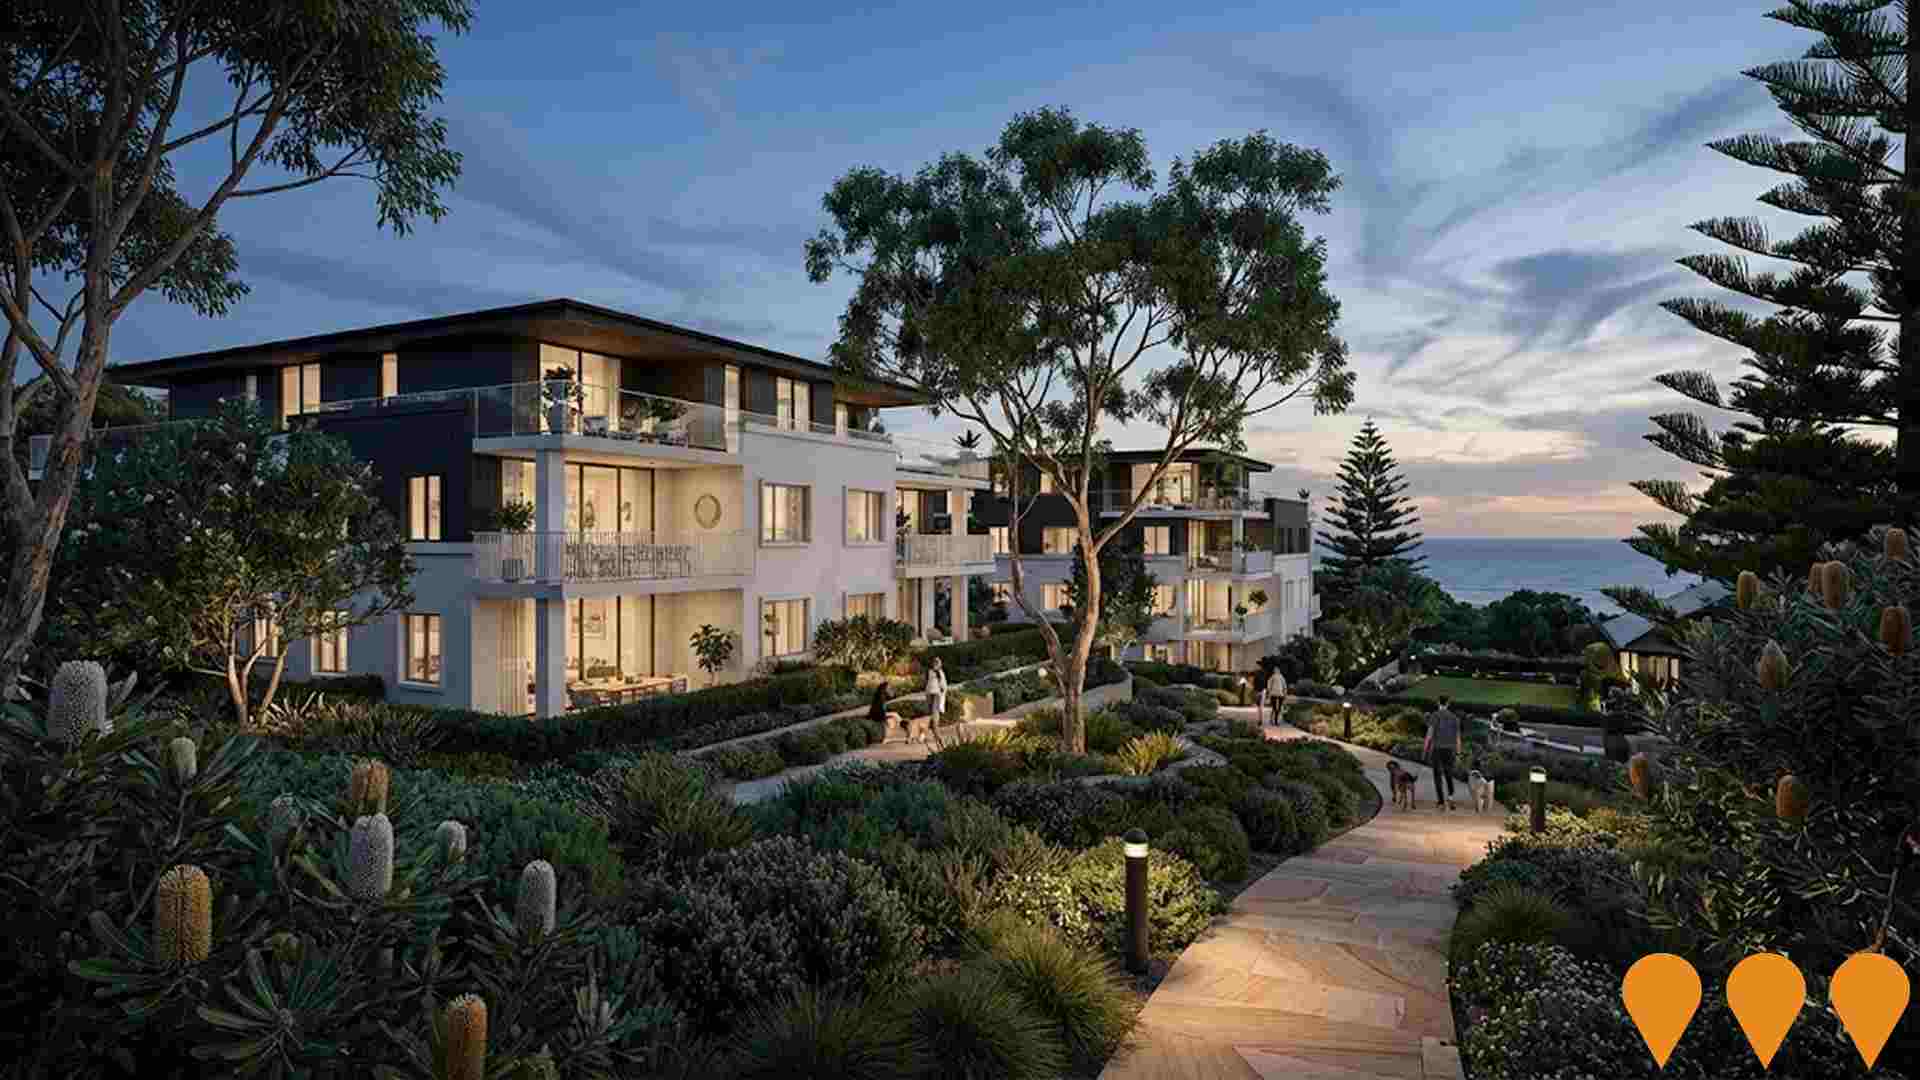
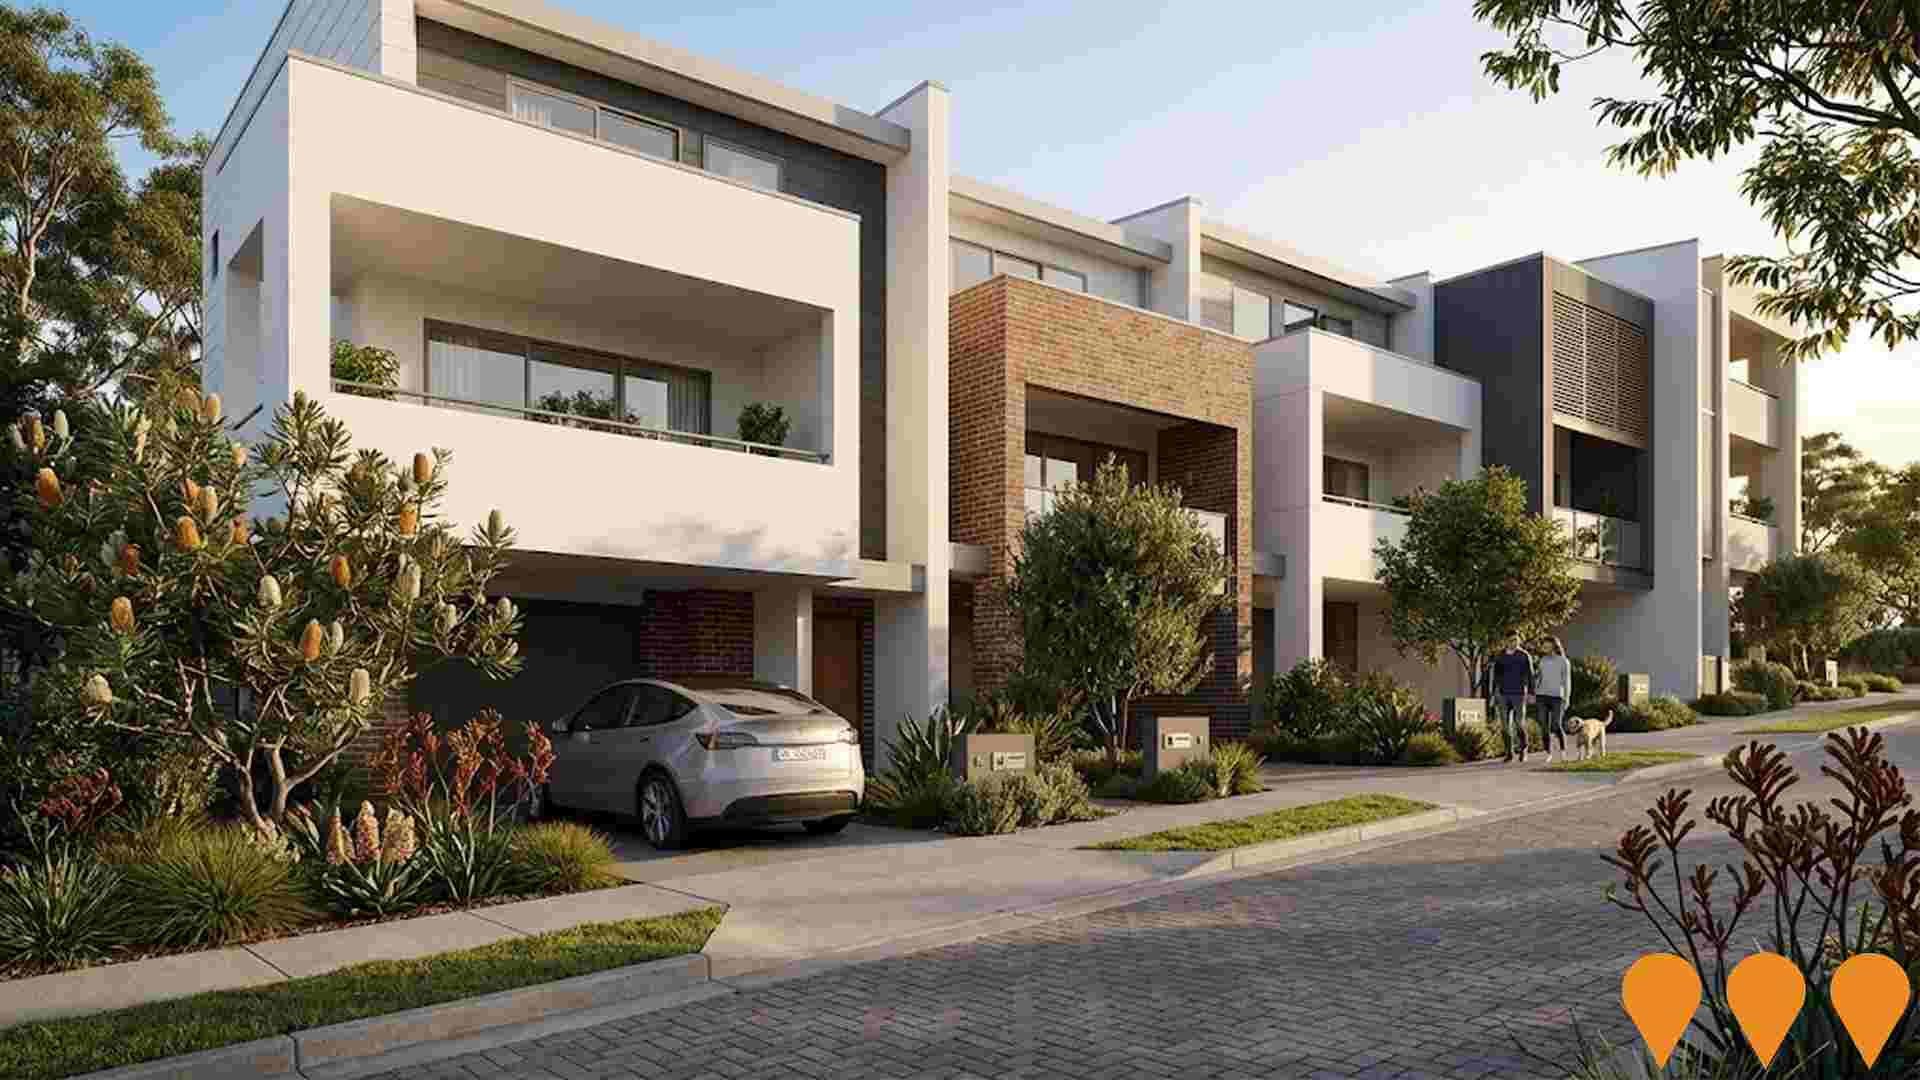
 Denotes AI-based impression for illustrative purposes only, not to be taken as definitive under any circumstances. Please follow links and conduct other investigations from the project's source for actual imagery. Developers and project owners wishing us to use original imagery please Contact Us and we will do so.
Frequently Asked Questions - Infrastructure
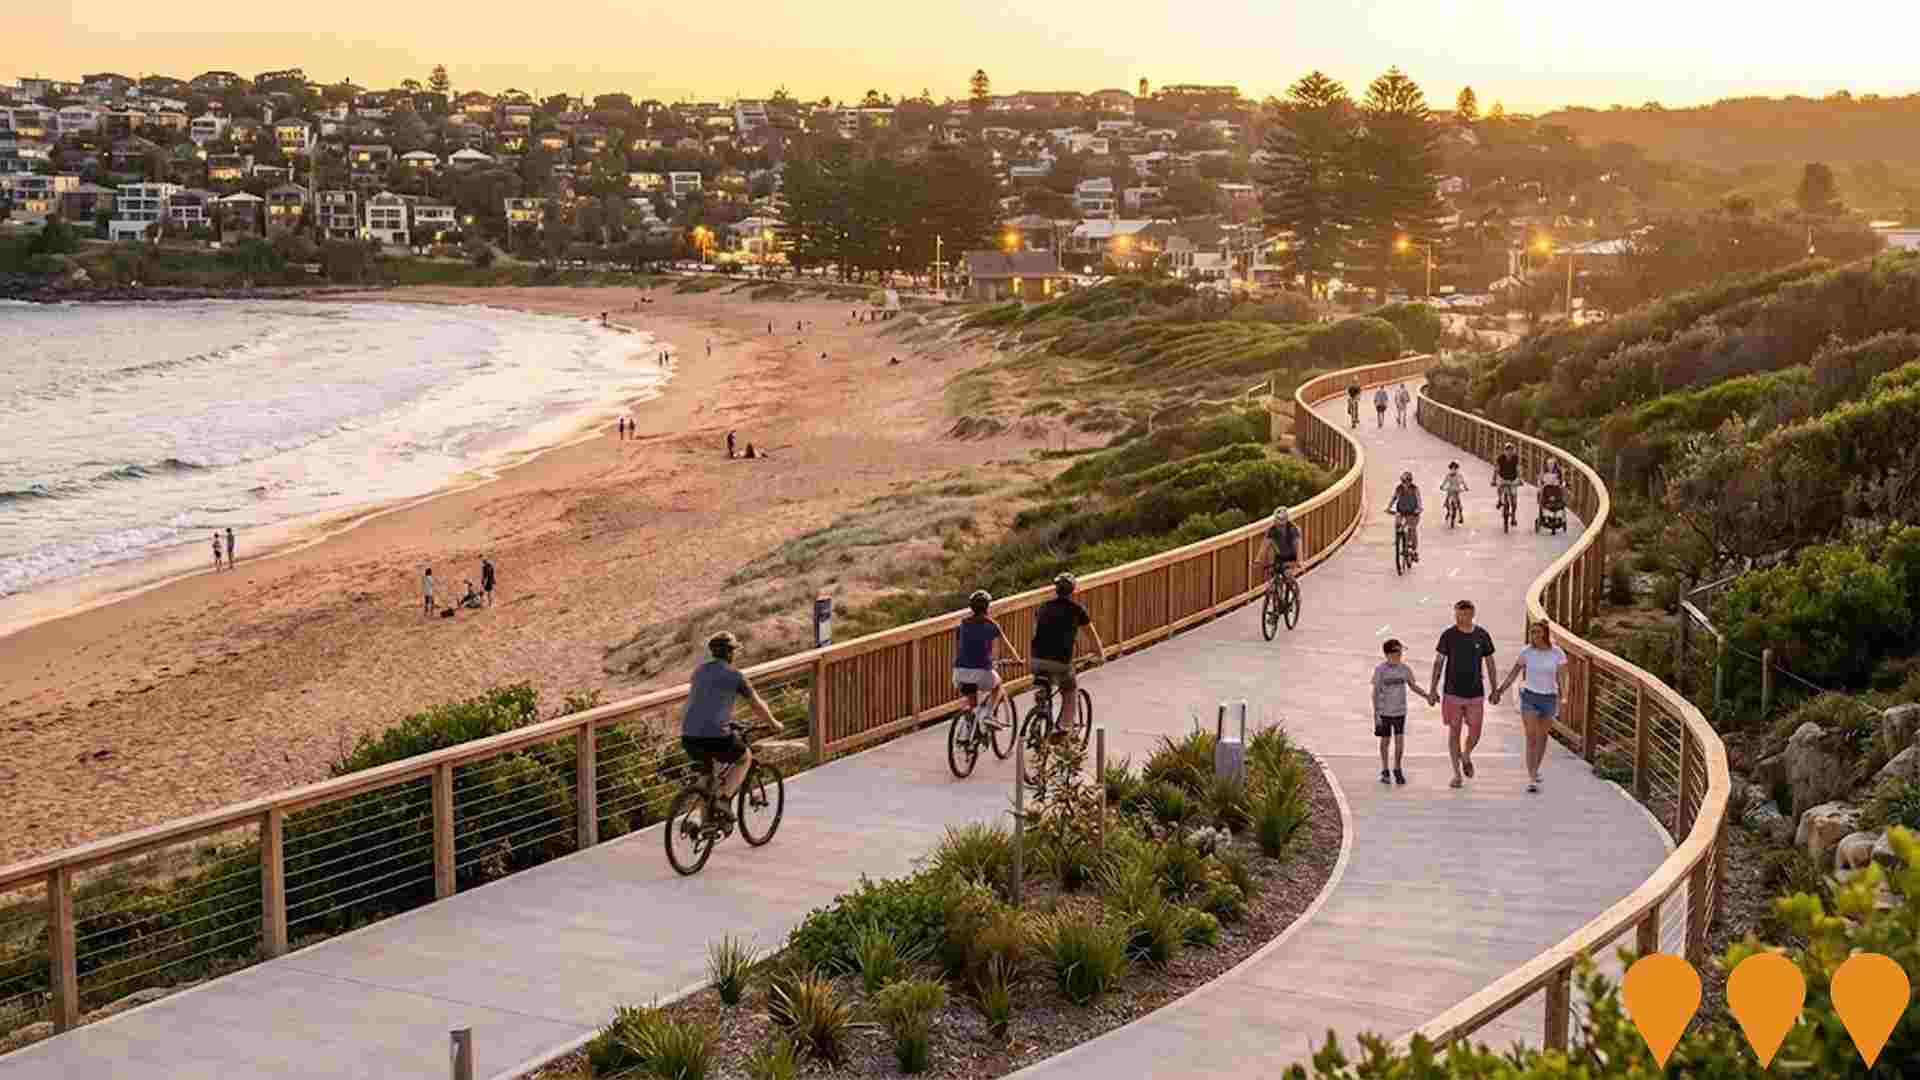
Northern Beaches Coast Walk
A 36km continuous coastal walking trail linking Manly to Palm Beach via beaches, headlands and existing paths. The project upgrades and connects existing sections with new boardwalks, viewing platforms, signage and accessibility improvements. Works are staged with multiple sections already complete and major construction underway on remaining gaps, particularly around Narrabeen, Warriewood and North Narrabeen.

Cromer Village Green (Proposed Mixed-Use Precinct)
Northern Beaches Council is investigating a new mixed-use town centre around the existing Cromer Village shops at the corner of South Creek Road and Fisher Road North, consolidating neighbourhood retail, medium-density housing, community facilities and upgraded public spaces into a walkable local centre integrated with recent road safety upgrades at the South Creek Road / Fisher Road North / Middleton Road intersection and the broader Northern Beaches Local Environmental Plan review. :contentReference[oaicite:0]{index=0} :contentReference[oaicite:1]{index=1} :contentReference[oaicite:2]{index=2}

Casa Delmar
Luxury coastal apartment development featuring 280 apartments across two buildings (6-7 storeys and 10 storeys), designed by Rothelowman with interiors by Alanna Smit. Includes 43 affordable housing units, rooftop facilities, gym, and BBQ areas. Located at the gateway to Dee Why town centre adjacent to Stony Range Botanical Garden. Developer: Landmark Group Pty Ltd (Level 25, Aurora Place, 88 Phillip Street, Sydney NSW 2000). Over 25 years experience with 10-year structural warranty.

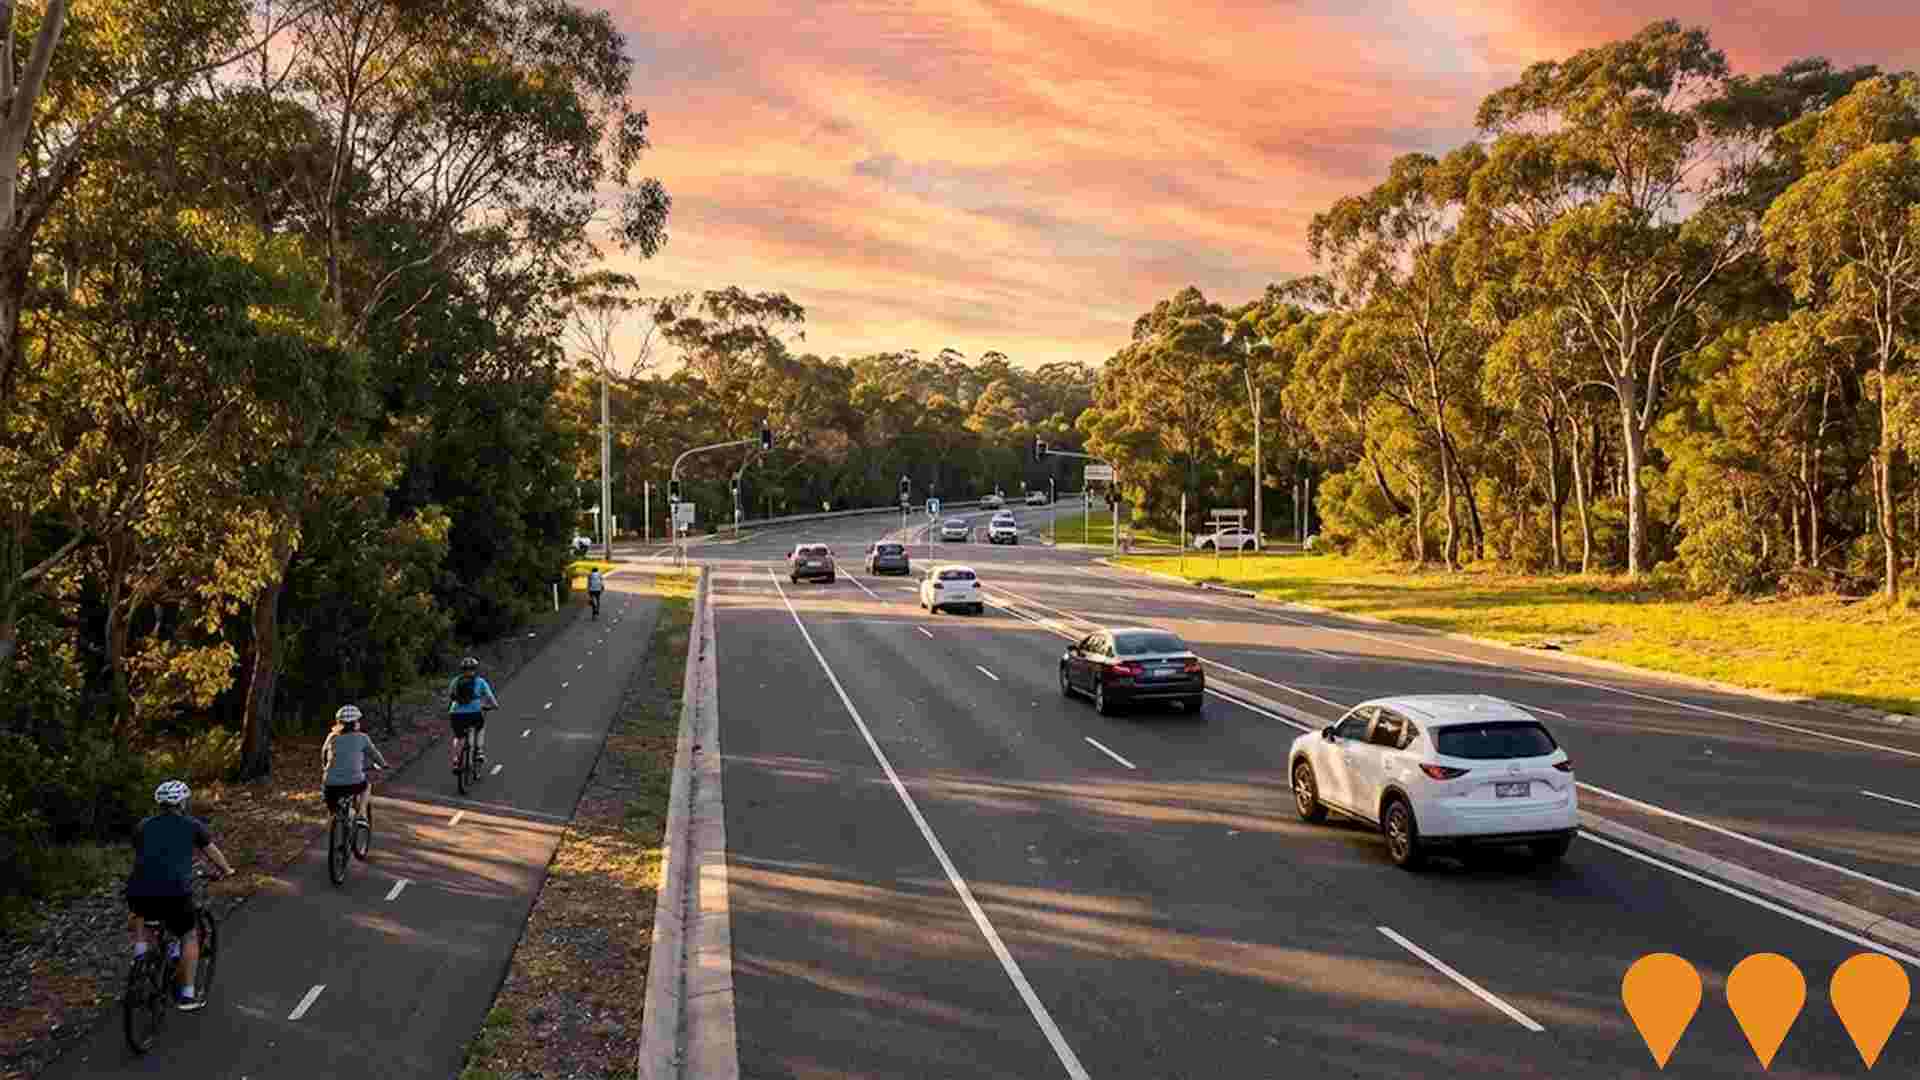
Wakehurst Parkway Improvements (Frenchs Forest to Narrabeen)
Improvements to Wakehurst Parkway between Frenchs Forest Road and Pittwater Road, North Narrabeen. The project involves intersection upgrades, lane widening for dual lanes in sections, new shared paths, and improved flood resilience to enhance safety, network efficiency, and capacity for future traffic growth on this key Northern Beaches corridor. Planning approval was received in August 2024, with early work and site investigations underway.

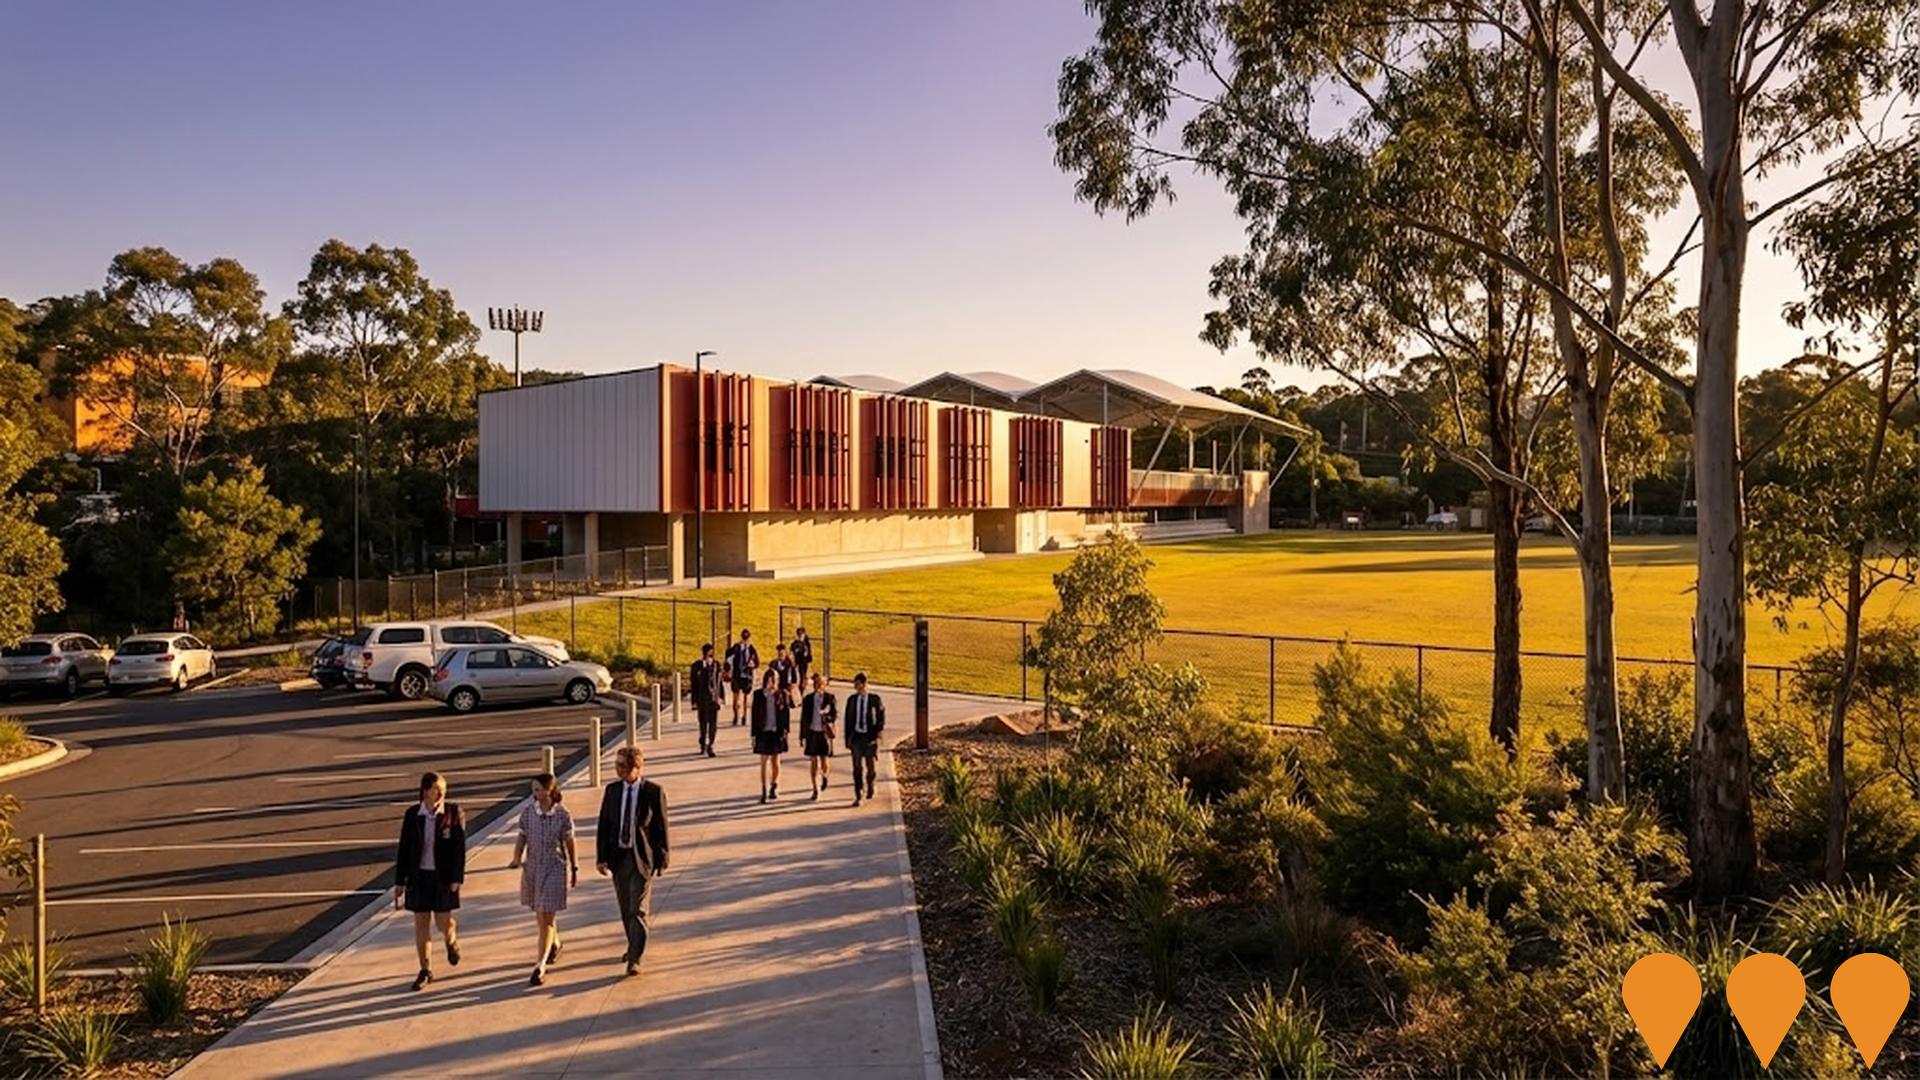
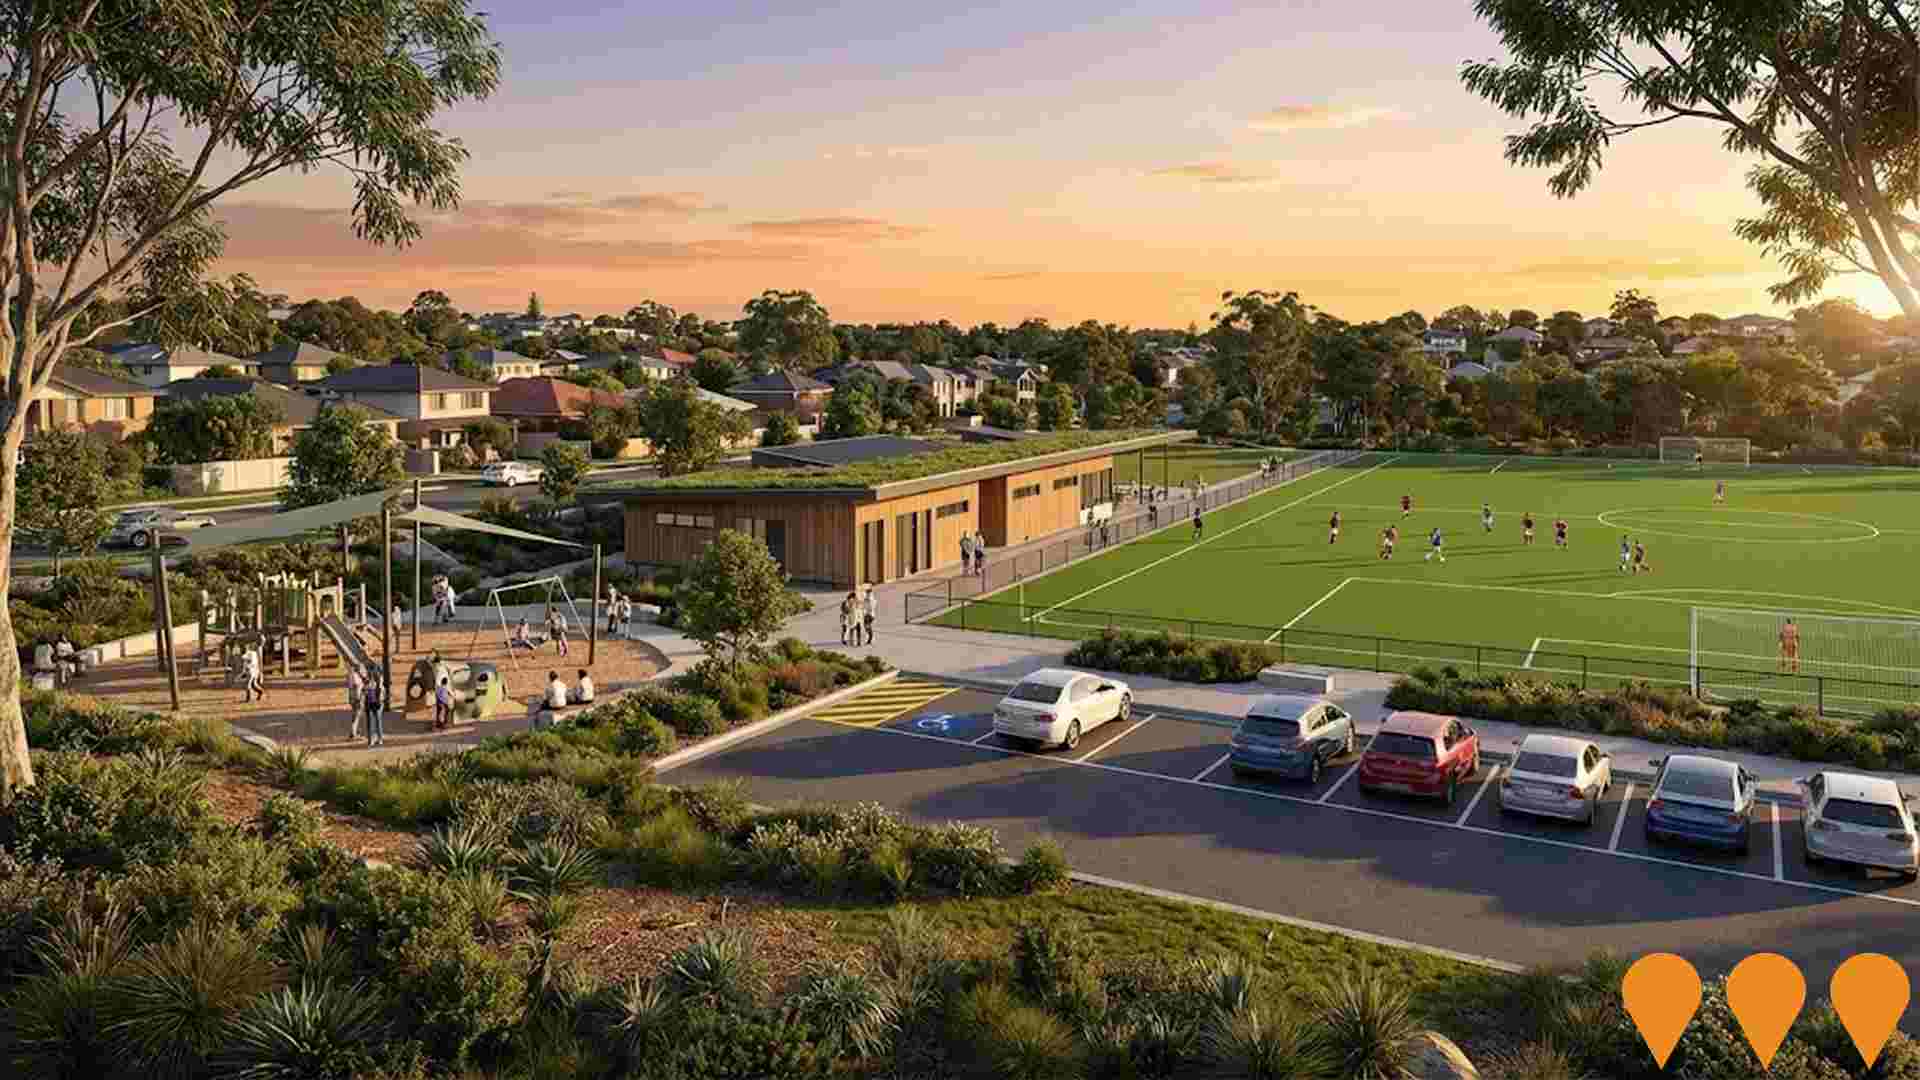
Beacon Hill Reserve Masterplan and Sportsfield Upgrade
Major upgrade of Beacon Hill Reserve, managed by Northern Beaches Council. The project includes a new synthetic sports field, an amenities building, a playground, landscaping, and improved parking facilities.
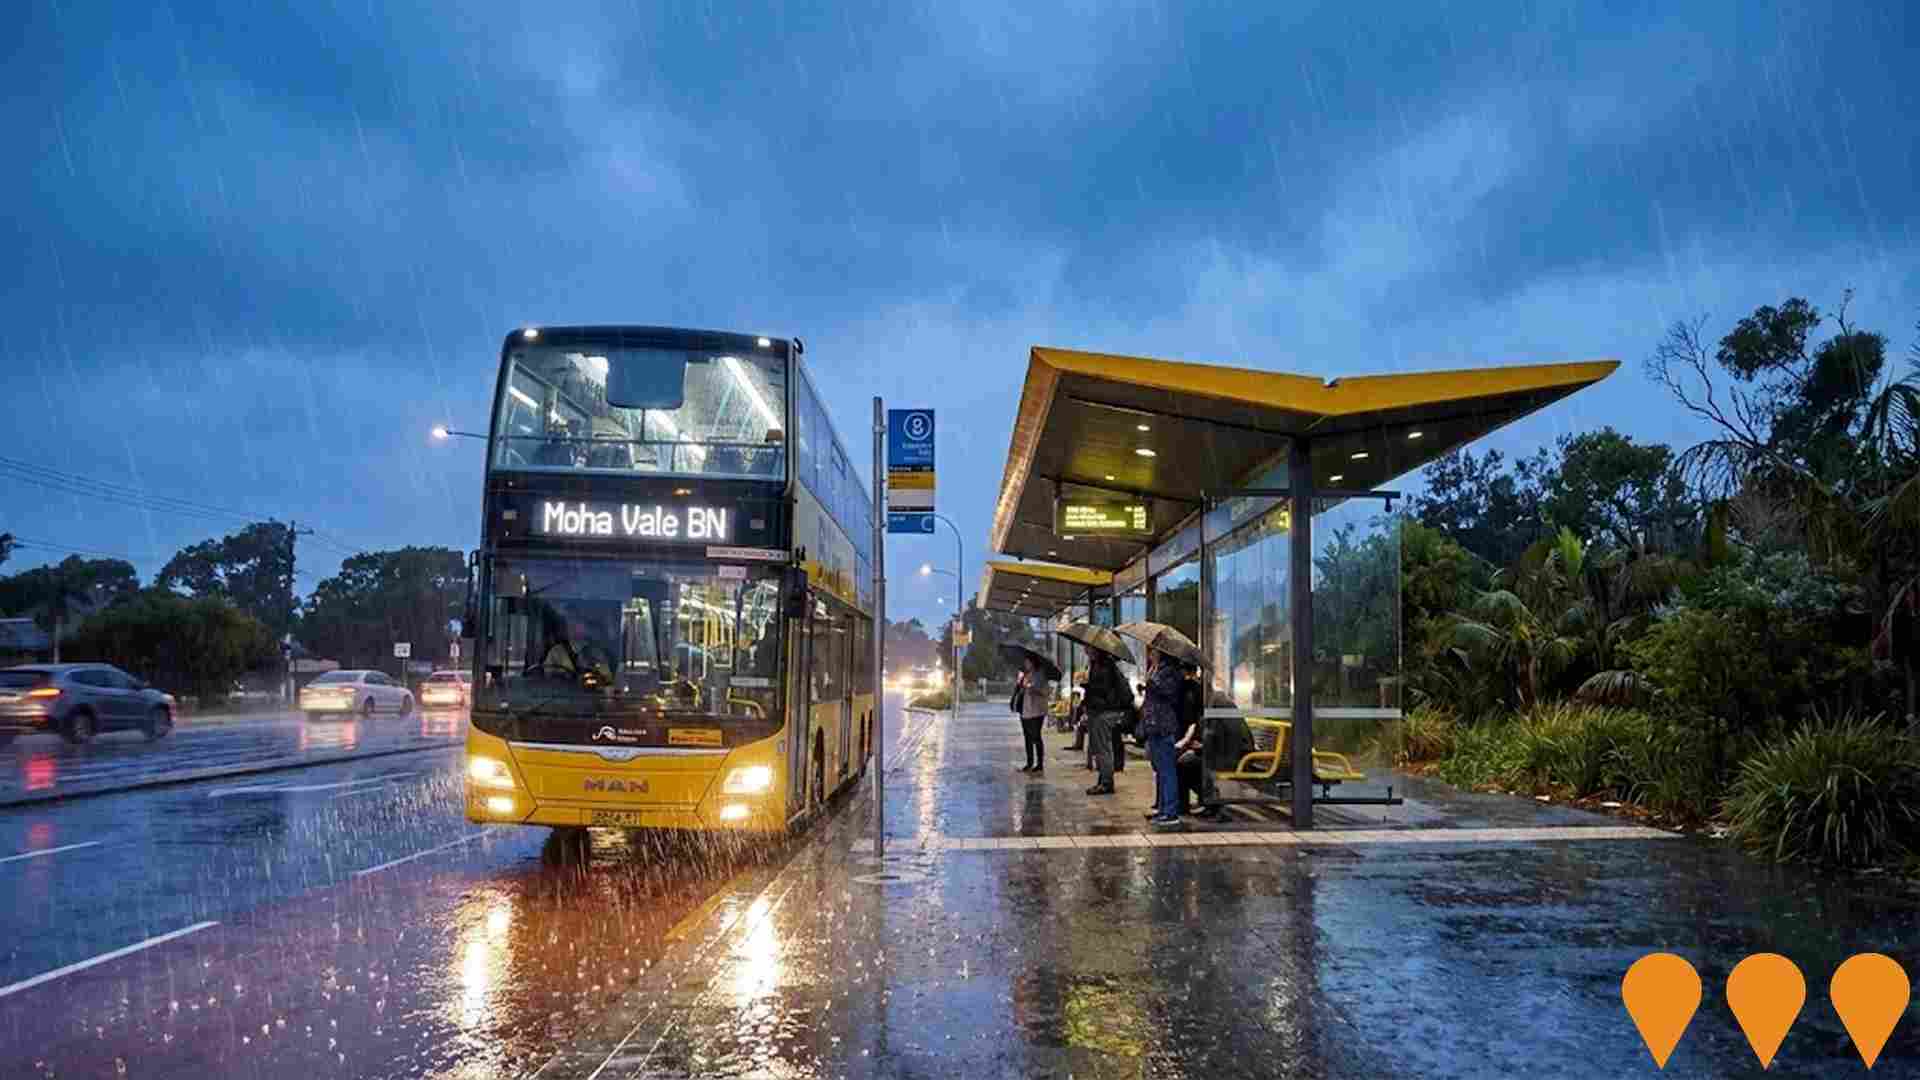
Northern Beaches Bus Network Improvements
Comprehensive upgrade to the Northern Beaches bus network to improve reliability and capacity. The project involves the procurement of 50 new articulated buses and 10 new double-decker B-Line buses, scheduled for delivery by mid-2026. Operational changes commencing January 2025 include new all-night services on Route 144 (Manly to Chatswood), extended services on Route 199, and frequency improvements on key corridors. The program runs in parallel with the $75M+ Wakehurst Parkway improvements to reduce flooding and improve transit reliability.
Wakehurst Parkway Improvements
Road safety and capacity improvements along Wakehurst Parkway including intersection upgrades, road widening, and improved cycling facilities. Completed as part of Northern Beaches Hospital road upgrades.
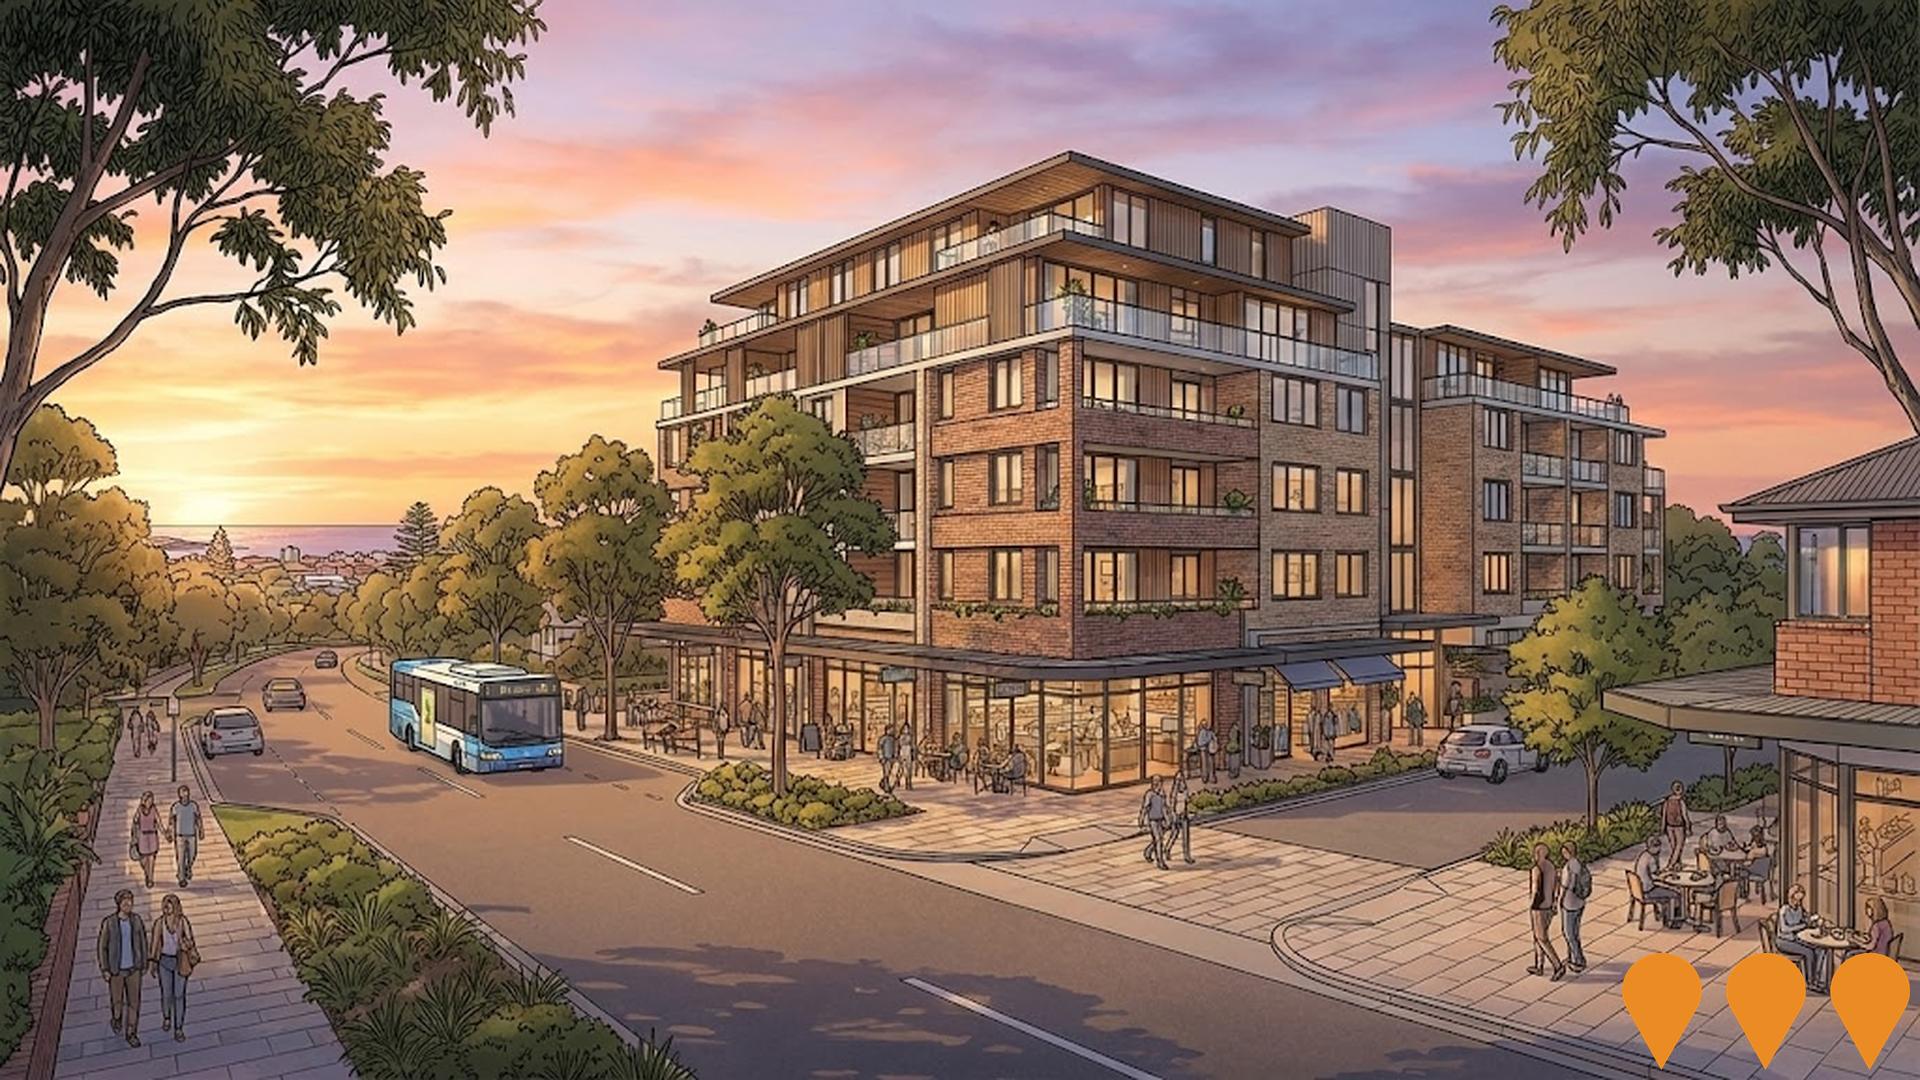
Beacon Hill Road Mixed-Use Precinct (Potential)
Council-identified potential opportunity site for future mixed-use development, including ground-floor retail and residential apartments, as part of the Northern Beaches Local Housing Strategy (LHS). Future detailed master-planning for Beacon Hill is contingent on a second B-Line bus route to Chatswood, as per the LHS adopted in April 2021.
Employment
While Cromer retains a healthy unemployment rate of 3.6%, recent employment declines have impacted its national performance ranking
Cromer's workforce is highly educated with significant representation in the technology sector. Its unemployment rate stands at 3.6%, lower than Greater Sydney's 4.2%.
As of June 2025, 4,328 residents are employed, with an unemployment rate of 0.6% below Greater Sydney's. Workforce participation is similar to Greater Sydney's at 62.2%. Employment is concentrated in health care & social assistance, construction, and professional & technical services. Construction employment is particularly high at 1.4 times the regional average, while transport, postal & warehousing shows lower representation at 2.9% compared to the regional average of 5.3%.
Over the year to June 2025, labour force levels decreased by 0.0%, employment declined by 1.3%, and unemployment rose by 1.2 percentage points in Cromer. In comparison, Greater Sydney saw employment grow by 2.6% and labour force expand by 2.9%. As of Nov-25, NSW's employment contracted by 0.03% (losing 2,260 jobs), with an unemployment rate of 3.9%, lower than the national rate of 4.3%. National employment forecasts from May-25 project a growth of 6.6% over five years and 13.7% over ten years. Applying these projections to Cromer's employment mix suggests local employment should increase by 6.8% over five years and 13.8% over ten years, assuming constant population projections for illustrative purposes.
Frequently Asked Questions - Employment
Income
Income metrics indicate excellent economic conditions, with the area achieving higher performance than 75% of national locations assessed by AreaSearch
According to AreaSearch's aggregation of the latest postcode level ATO data released for financial year 2022, Cromer SA2 had a median income among taxpayers of $59,497. The average income stood at $89,414. This is among the highest in Australia when compared to levels of $56,994 and $80,856 across Greater Sydney respectively. Based on Wage Price Index growth of 12.61% since financial year 2022, current estimates for median income would be approximately $67,000 and average income at $100,689 as of September 2025. From the 2021 Census, household incomes rank exceptionally at the 87th percentile with a weekly income of $2,379. Income analysis reveals that the $4000+ earnings band captures 27.6% of the community, consisting of 2,290 individuals. This contrasts with the region where the $1,500 - 2,999 bracket leads at 30.9%. The district demonstrates considerable affluence with 40.8% earning over $3,000 per week, supporting premium retail and service offerings. High housing costs consume 17.8% of income, though strong earnings still place disposable income at the 83rd percentile. The area's SEIFA income ranking places it in the 9th decile.
Frequently Asked Questions - Income
Housing
Cromer is characterized by a predominantly suburban housing profile, with above-average rates of outright home ownership
Cromer's dwelling structure, as per the latest Census, consists of 75.9% houses and 24.1% other dwellings (semi-detached, apartments, 'other' dwellings). This compares to Sydney metro's 57.6% houses and 42.4% other dwellings. Home ownership in Cromer is at 40.4%, with mortgaged dwellings at 44.1% and rented ones at 15.5%. The median monthly mortgage repayment in the area is $3,179, higher than Sydney metro's average of $3,000. The median weekly rent figure for Cromer is $650, compared to Sydney metro's $592. Nationally, Cromer's mortgage repayments are significantly higher at $3,179 compared to the Australian average of $1,863. Similarly, rents in Cromer are substantially above the national figure of $375 at $650.
Frequently Asked Questions - Housing
Household Composition
Cromer features high concentrations of family households, with a higher-than-average median household size
Family households constitute 78.1% of all households, consisting of 44.5% couples with children, 24.3% couples without children, and 8.8% single parent families. Non-family households make up the remaining 21.9%, with lone person households at 20.1% and group households comprising 1.7%. The median household size is 2.9 people, larger than the Greater Sydney average of 2.7.
Frequently Asked Questions - Households
Local Schools & Education
Cromer shows strong educational performance, ranking in the upper quartile nationally when assessed across multiple qualification and achievement indicators
The area's university qualification rate is 30.0%, significantly lower than the SA4 region average of 41.5%. This presents both a challenge and an opportunity for targeted educational initiatives. Bachelor degrees are the most common, at 21.5%, followed by postgraduate qualifications (5.9%) and graduate diplomas (2.6%). Trade and technical skills are prominent, with 36.2% of residents aged 15+ holding vocational credentials – advanced diplomas (13.6%) and certificates (22.6%).
Educational participation is high, with 30.8% of residents currently enrolled in formal education. This includes 10.5% in primary education, 9.8% in secondary education, and 4.2% pursuing tertiary education.
Frequently Asked Questions - Education
Schools Detail
Nearby Services & Amenities
Transport
Transport servicing is high compared to other areas nationally based on assessment of service frequency, route connectivity and accessibility
Cromer has 61 active public transport stops, all of which are bus stops. These stops are served by 41 different routes that together facilitate 2,318 weekly passenger trips. The accessibility of these services is rated as excellent, with residents on average being located just 144 meters from the nearest stop.
On a daily basis, there are an average of 331 trips across all routes, which equates to approximately 38 weekly trips per individual stop.
Frequently Asked Questions - Transport
Transport Stops Detail
Health
The level of general health in Cromer is notably higher than the national average with both young and old age cohorts seeing low prevalence of common health conditions
Cromer shows superior health outcomes, with both youth and elderly experiencing low prevalence of common health conditions. The rate of private health cover stands at approximately 64%, comprising 5,311 individuals, compared to Greater Sydney's 71.5%. Nationally, the average is 55.3%.
Arthritis and asthma are the prevalent medical conditions, affecting 7.2% and 6.3% of residents respectively. A total of 72.9% report no medical ailments, slightly lower than Greater Sydney's 74.7%. The area has a higher proportion of seniors aged 65 and over at 21.6%, or 1,790 individuals, compared to Greater Sydney's 17.8%. Health outcomes among seniors align with the general population's health profile.
Frequently Asked Questions - Health
Cultural Diversity
The level of cultural diversity witnessed in Cromer was found to be slightly above average when compared nationally for a number of language and cultural background related metrics
Cromer, as per data from the 2016 Census, showed higher than average cultural diversity with 13.0% of its population speaking a language other than English at home and 25.3% born overseas. Christianity was found to be the predominant religion in Cromer, accounting for 56.6% of people. Notably, Judaism had an overrepresentation in Cromer compared to Greater Sydney, with 0.3% of the population identifying as Jewish.
In terms of ancestry, English was the most represented group at 29.9%, followed by Australian at 25.1% and Irish at 7.7%. Some ethnic groups showed notable differences: Serbian had an overrepresentation in Cromer at 1.0% compared to the regional average of 0.6%, Welsh at 0.8% (regional average 0.7%), and French at 0.8% (regional average 1.1%).
Frequently Asked Questions - Diversity
Age
Cromer's median age exceeds the national pattern
The median age in Cromer is 42 years, significantly higher than Greater Sydney's average of 37 years and Australia's national average of 38 years. The 75-84 age group comprises 8.9% of Cromer's population compared to Greater Sydney's percentage. Conversely, the 25-34 age cohort makes up only 7.5% of Cromer's population. According to post-2021 Census data, the 15 to 24 age group has increased from 12.1% to 14.2%, while the 85+ cohort has risen from 3.2% to 4.8%. However, the 65 to 74 age cohort has decreased from 9.4% to 7.9%. Population forecasts for Cromer in 2041 indicate substantial demographic changes. Notably, the 85+ group is projected to grow by 99%, reaching 792 people from its current figure of 397. By 2041, the combined 65+ age groups will account for 99% of total population growth, reflecting Cromer's aging demographic trend. In contrast, the 25 to 34 and 0 to 4 age cohorts are expected to experience population declines.
