Chart Color Schemes
This analysis uses ABS Statistical Areas Level 2 (SA2) boundaries, which can materially differ from Suburbs and Localities (SAL) even when sharing similar names.
SA2 boundaries are defined by the Australian Bureau of Statistics and are designed to represent communities for statistical reporting (e.g., census and ERP).
Suburbs and Localities (SAL) represent commonly-used suburb/locality names (postal-style areas) and may use different geographic boundaries. For comprehensive analysis, consider reviewing both boundary types if available.
est. as @ -- *
ABS ERP | -- people | --
2021 Census | -- people
Sales Activity
Curious about local property values? Filter the chart to assess the volume and appreciation (including resales) trends and regional comparisons, or scroll to the map below view this information at an individual property level.
Find a Recent Sale
Sales Detail
Population
Belrose is positioned among the lower quartile of areas assessed nationally for population growth based on AreaSearch's assessment of recent, and medium term trends
Belrose's population was around 8,652 people as of 2021 Census. By Nov 2025, it is estimated to be approximately 8,821, reflecting an increase of 169 people (2.0%) since the census. This growth is inferred from the ABS's estimated resident population of 8,787 as of June 2024 and an additional 67 validated new addresses since the Census date. The current population density ratio is 656 persons per square kilometer. Belrose's 2.0% growth since census places it within 1.2 percentage points of its SA4 region (3.2%), indicating competitive growth fundamentals. Overseas migration contributed approximately 66.7% of overall population gains during recent periods.
AreaSearch uses ABS/Geoscience Australia projections for each SA2 area, released in 2024 with a base year of 2022. For areas not covered by this data, it utilises NSW State Government's SA2 level projections, released in 2022 with a base year of 2021. Growth rates by age group from these aggregations are applied to all areas for years 2032 to 2041. Based on the latest annual ERP population numbers, Belrose is projected to expand by 316 persons to 2041, reflecting an increase of 3.2% in total over the 17-year period.
Frequently Asked Questions - Population
Development
The level of residential development activity in Belrose is very low in comparison to the average area assessed nationally by AreaSearch
Belrose has seen approximately 19 new homes approved annually over the past five financial years ending June 2021, totalling 96 homes. As of February 2022, two approvals have been recorded in FY-26. The area's population decline suggests that new supply has likely kept pace with demand, providing good options for buyers. New homes are being built at an average expected construction cost value of $661,000, indicating a focus on the premium market segment with higher-end properties.
This financial year, $4.6 million in commercial approvals have been registered, reflecting limited commercial development focus compared to Greater Sydney. Belrose has around three-quarters the rate of new dwelling approvals per person and ranks among the 14th percentile of areas assessed nationally, suggesting somewhat limited buyer options while strengthening demand for established dwellings. Recent construction comprises 37.0% detached dwellings and 63.0% townhouses or apartments, a shift from the current housing mix of 79.0% houses, reflecting reduced availability of development sites and addressing shifting lifestyle demands and affordability requirements. The estimated population per dwelling approval in Belrose is 1218 people, indicating a quiet, low activity development environment. According to AreaSearch's latest quarterly estimate, Belrose is expected to grow by 281 residents through to 2041. Based on current development patterns, new housing supply should readily meet demand, offering good conditions for buyers and potentially facilitating population growth beyond current projections.
Looking ahead, Belrose is expected to grow by 281 residents through to 2041 (from the latest AreaSearch quarterly estimate). Based on current development patterns, new housing supply should readily meet demand, offering good conditions for buyers and potentially facilitating population growth beyond current projections.
Frequently Asked Questions - Development
Infrastructure
Belrose has emerging levels of nearby infrastructure activity, ranking in the 39thth percentile nationally
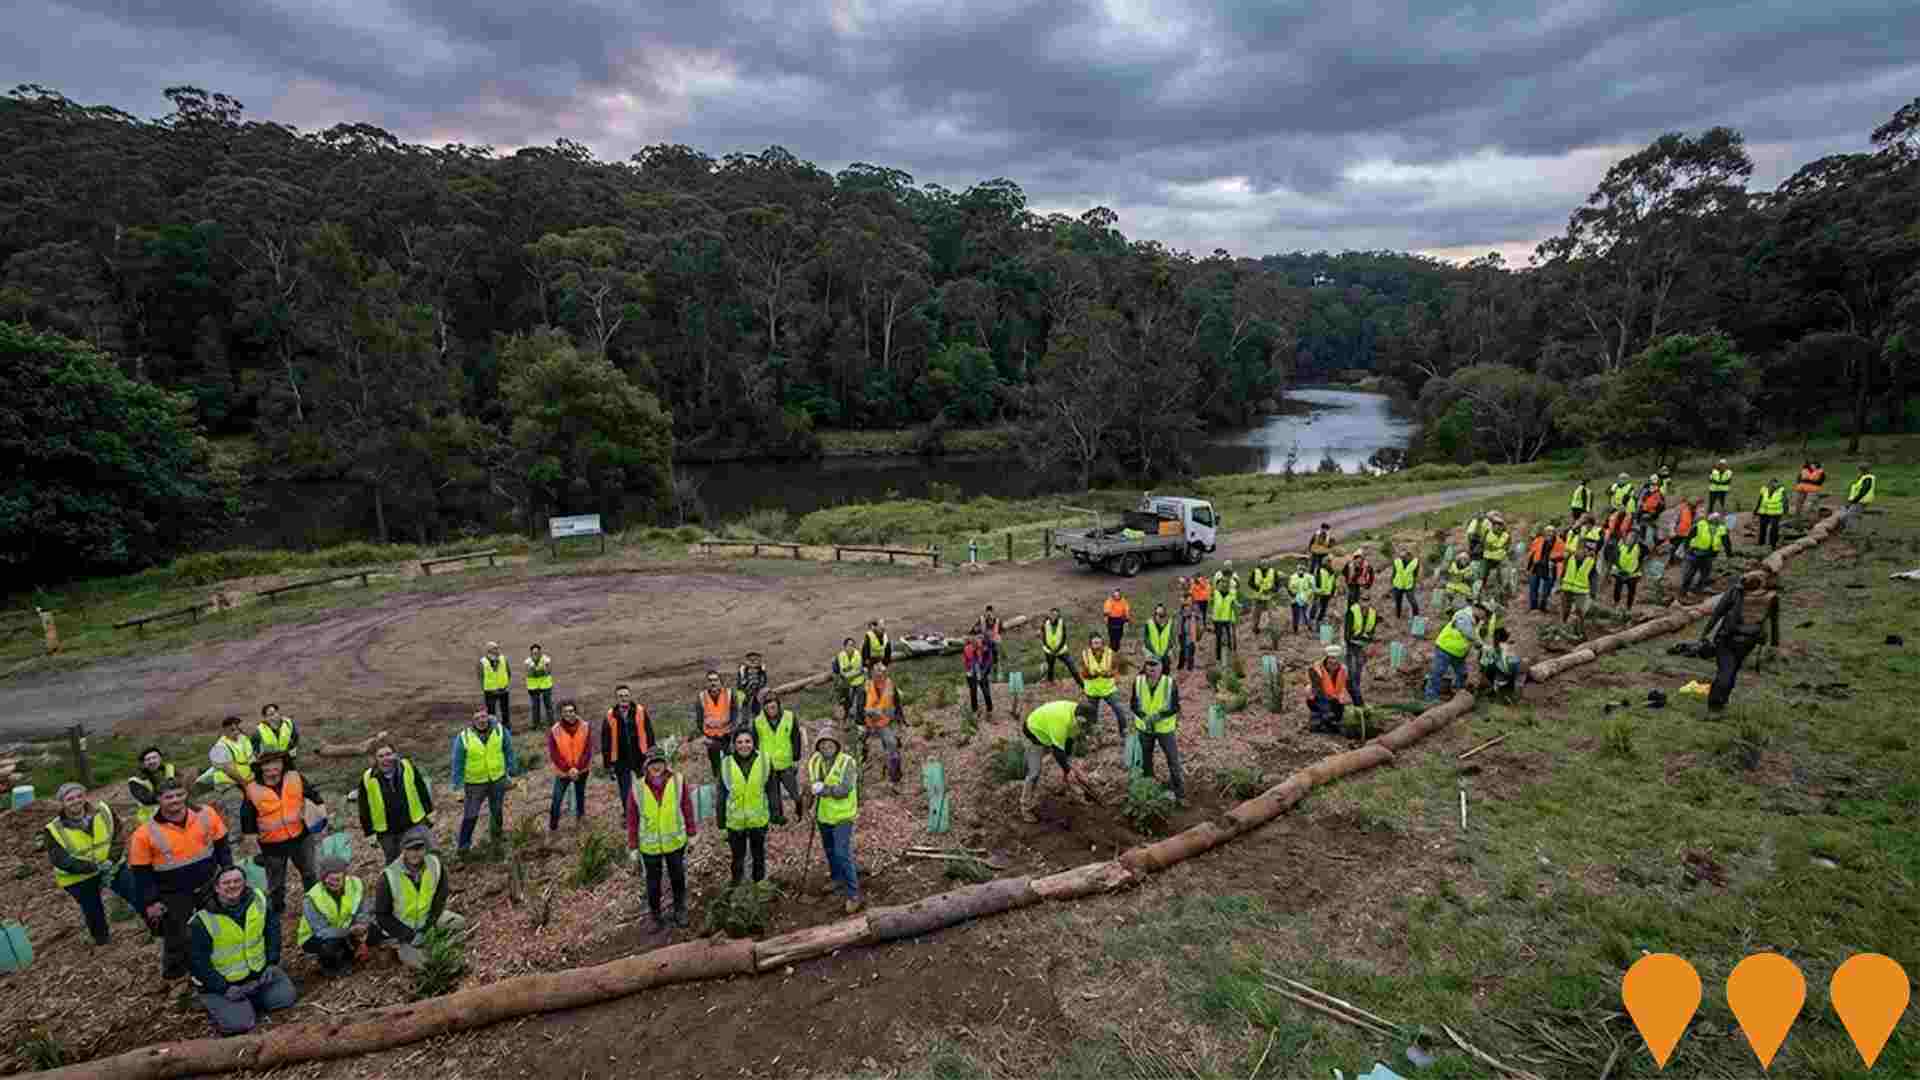
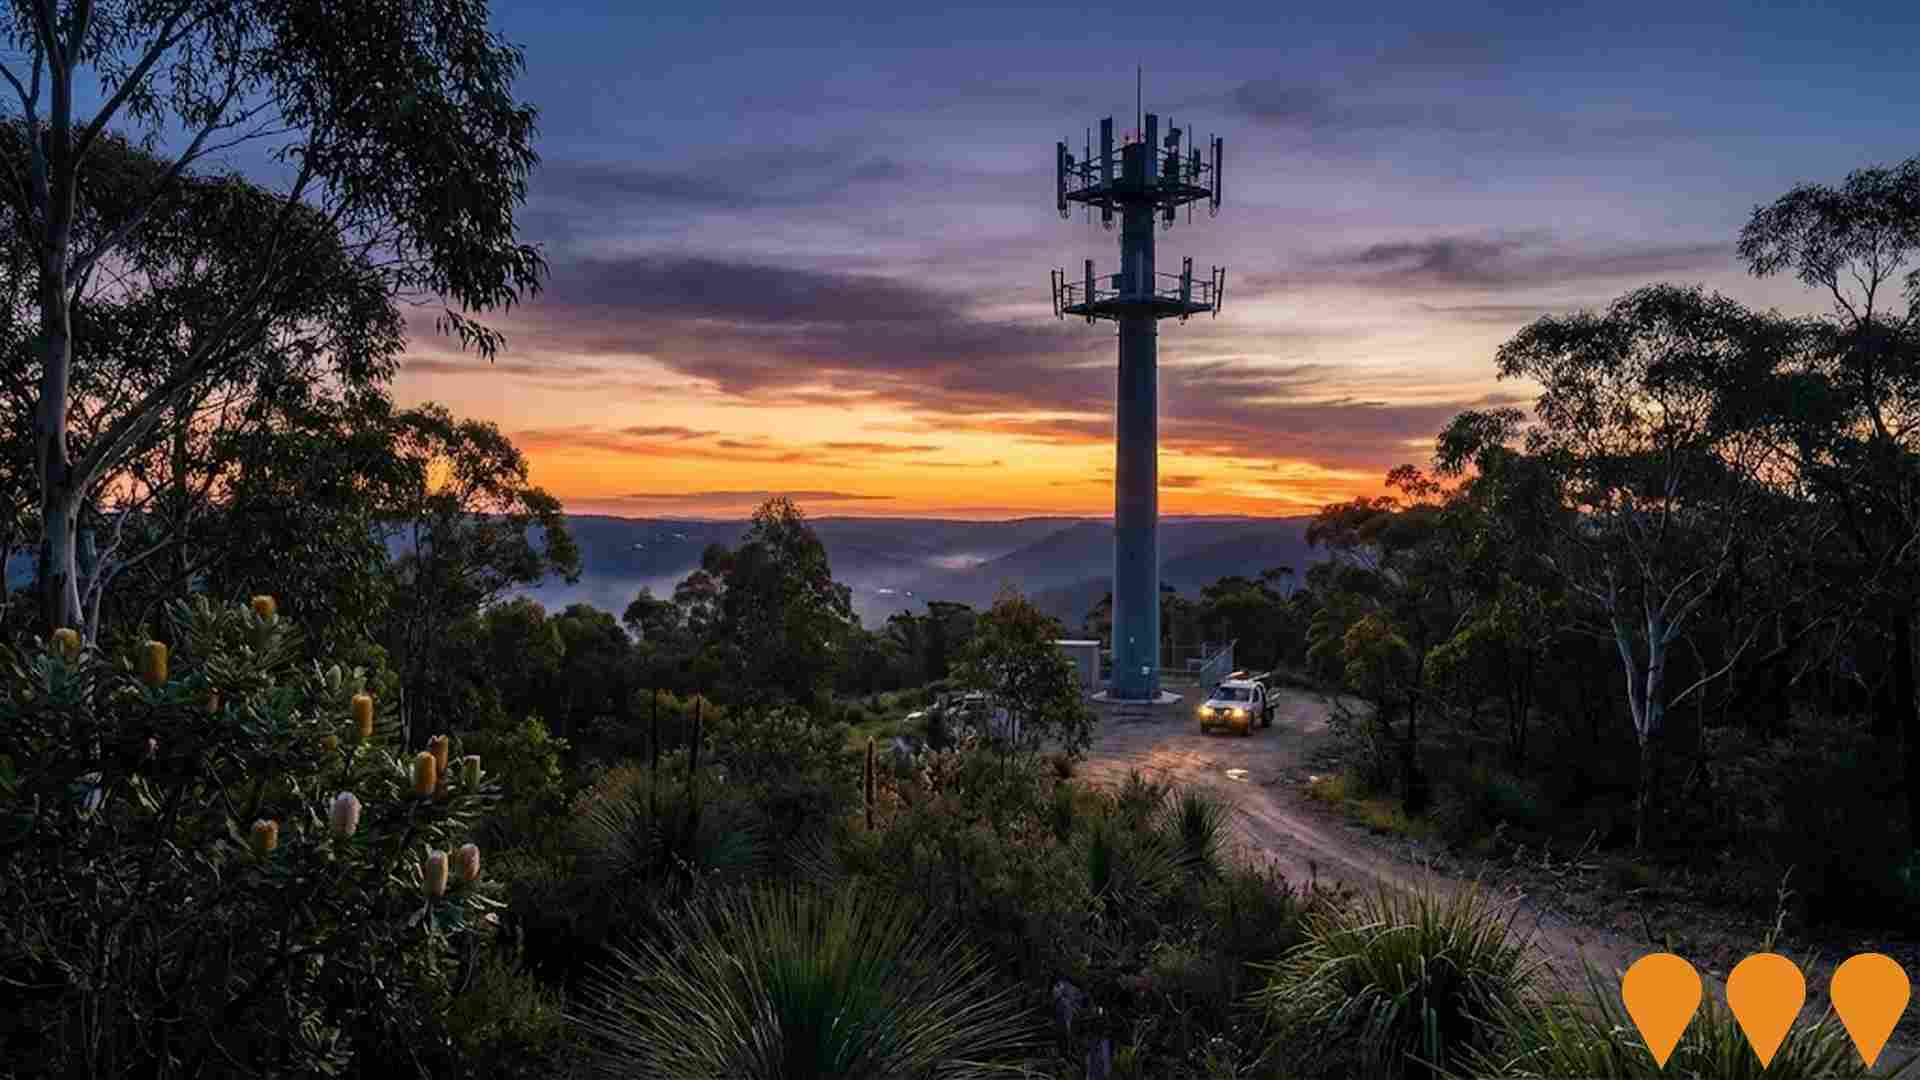
Changes to local infrastructure significantly influence an area's performance. AreaSearch has identified 22 projects that could impact this region. Notable ones include Belrose Village Green, Belrose North Residential Release, Davidson Park Environmental Restoration, and Forestway Shopping Centre Redevelopment, with the following list focusing on those most relevant.
Professional plan users can use the search below to filter and access additional projects.
INFRASTRUCTURE SEARCH
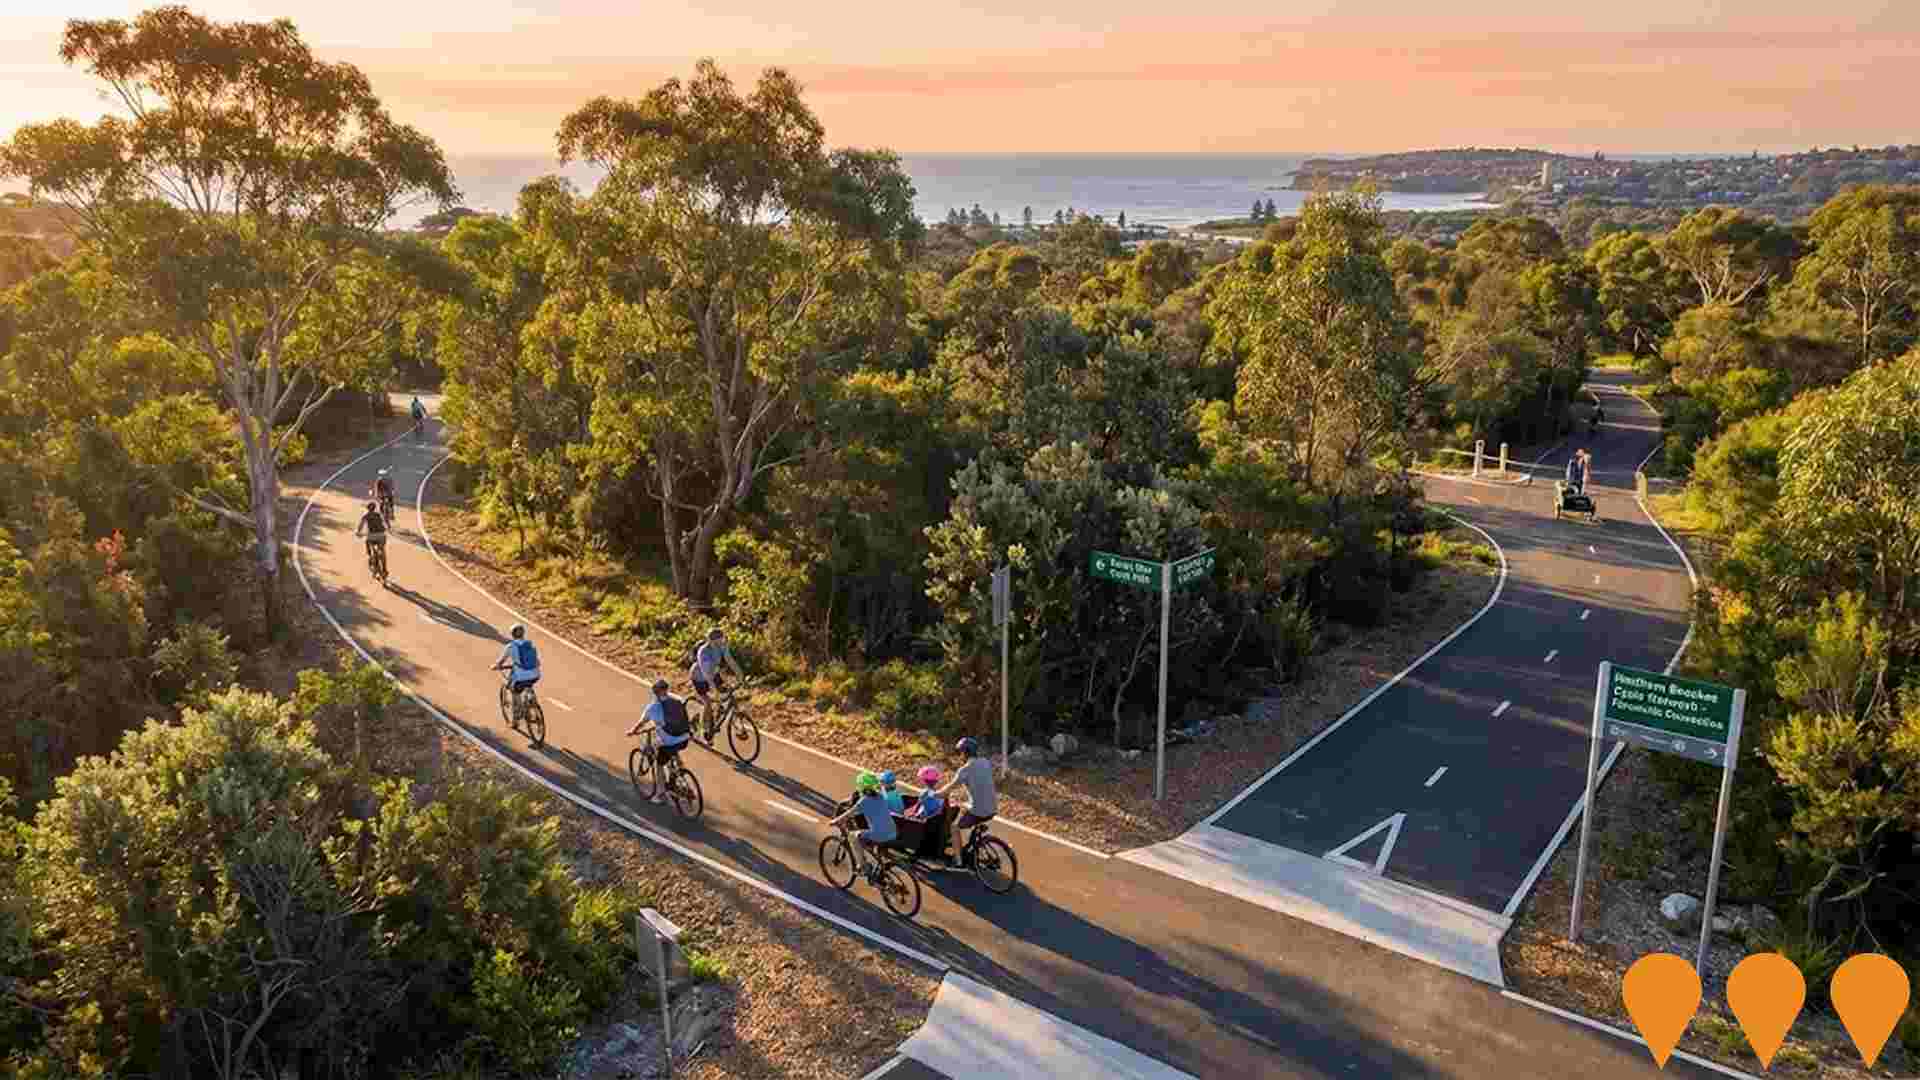
 Denotes AI-based impression for illustrative purposes only, not to be taken as definitive under any circumstances. Please follow links and conduct other investigations from the project's source for actual imagery. Developers and project owners wishing us to use original imagery please Contact Us and we will do so.
Frequently Asked Questions - Infrastructure
Frenchs Forest Housing and Productivity Contribution (HPC)
The Housing and Productivity Contribution (HPC) is an infrastructure funding scheme that replaced the former Special Infrastructure Contribution (SIC) on 1 October 2023. It supports delivery of the Frenchs Forest 2041 Place Strategy by funding roads, public transport, cycling paths, health facilities, emergency services, schools and open space. The HPC applies to new residential, commercial and industrial development in the Frenchs Forest precinct with rates for FY2025-26 of $7,801 per additional dwelling (Charge Area 1) and $23,403 per additional dwelling (Charge Area 2), indexed annually.
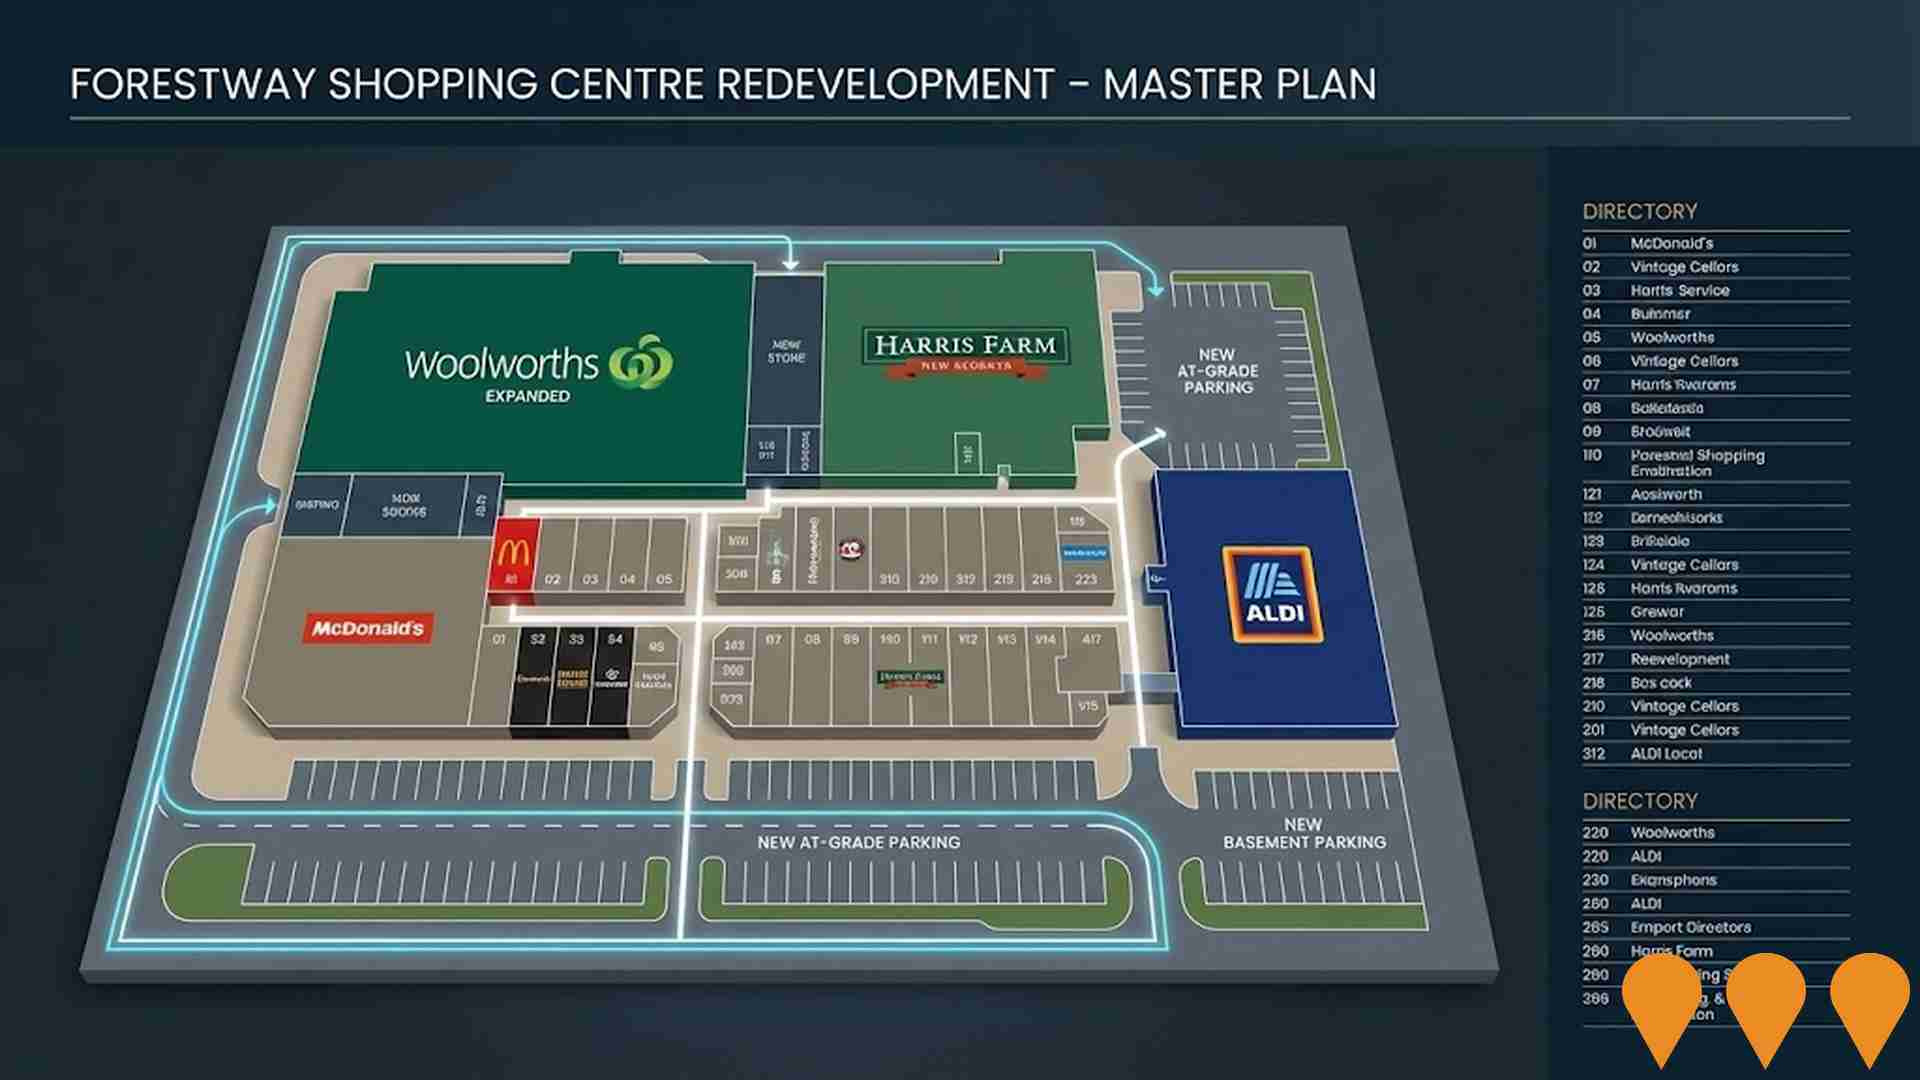
Forestway Shopping Centre Redevelopment
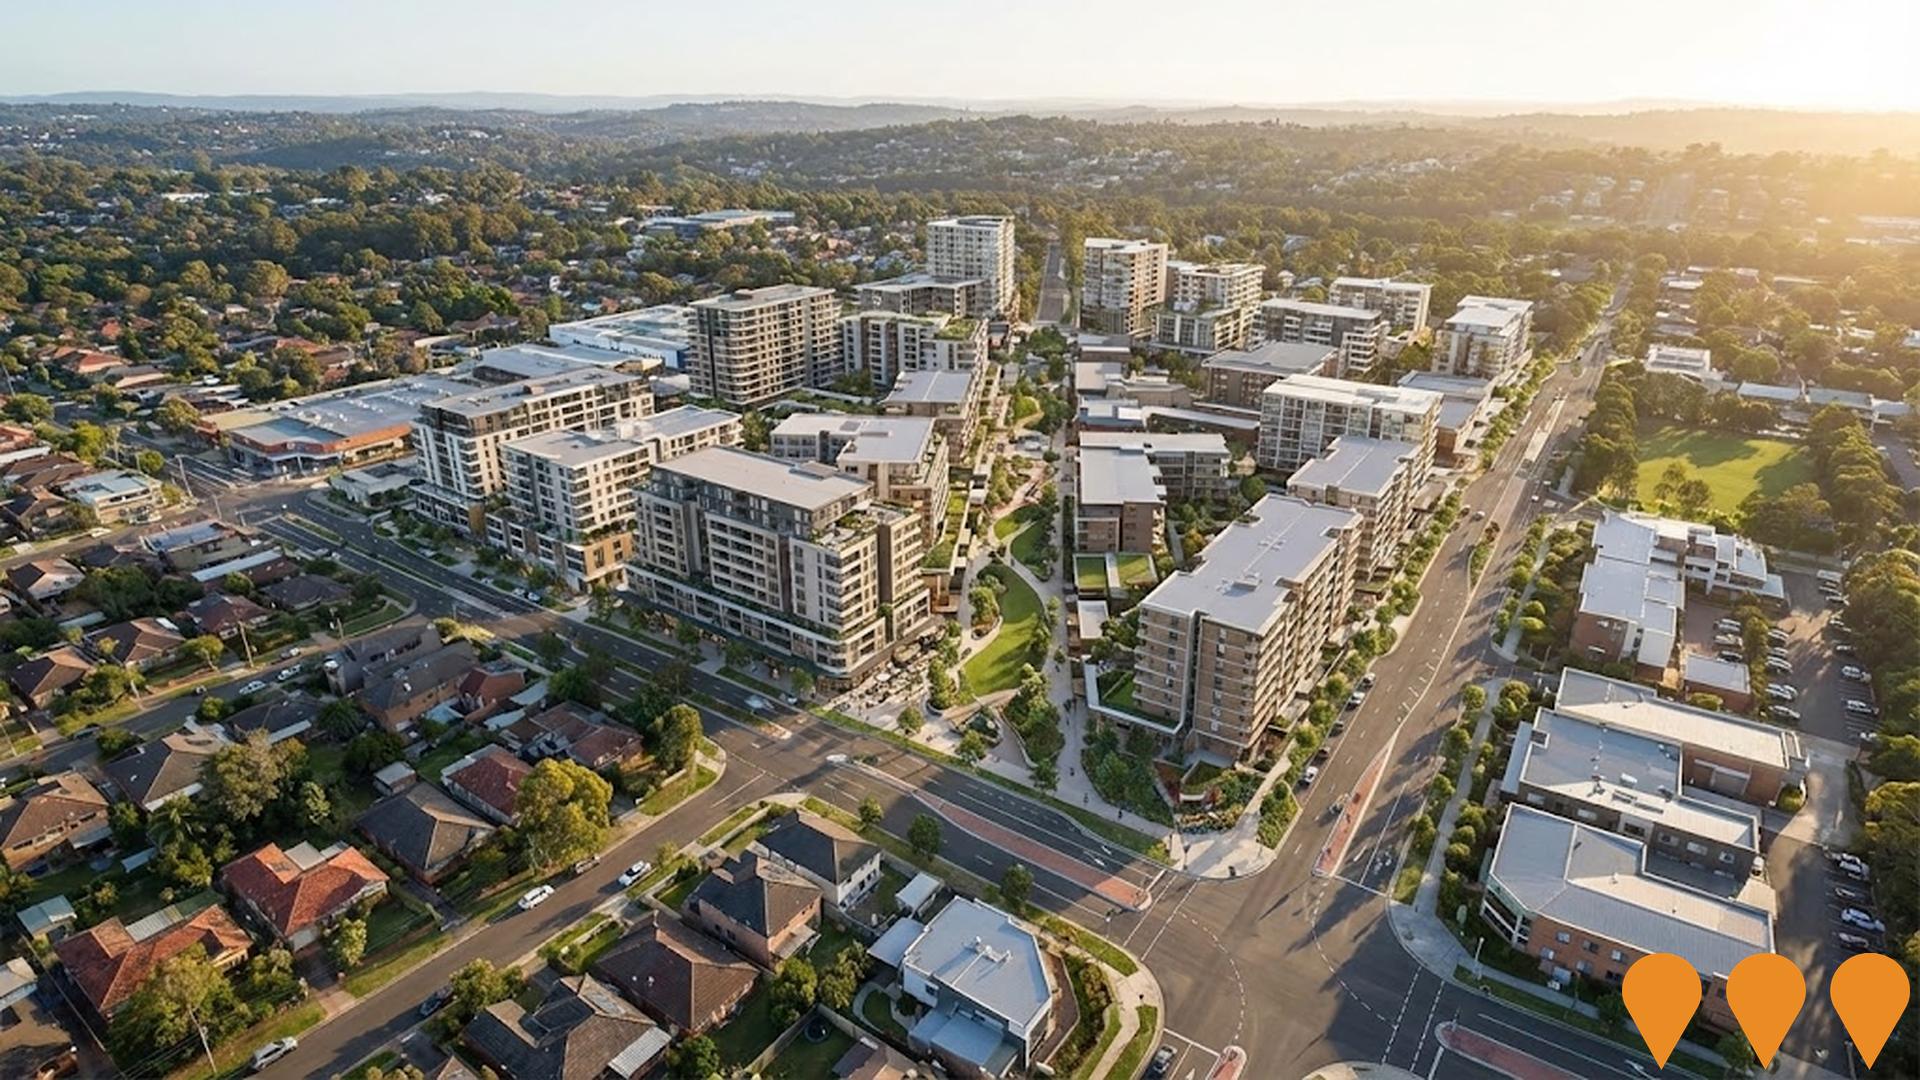
Sydney North Planning Panel approved DA2023/1757 on 10 June 2025 for major alterations and additions to Forestway Shopping Centre (approx $34m). The staged upgrade includes doubling supermarket space with room for a Harris Farm, internal mall refresh, new amenities, a swim school and gym, improved entries, and replacement of the multi-storey car park with at-grade and basement parking plus associated road works. Revelop notes Stage 1 internal works are complete and Stage 2 external works target completion by December 2027.
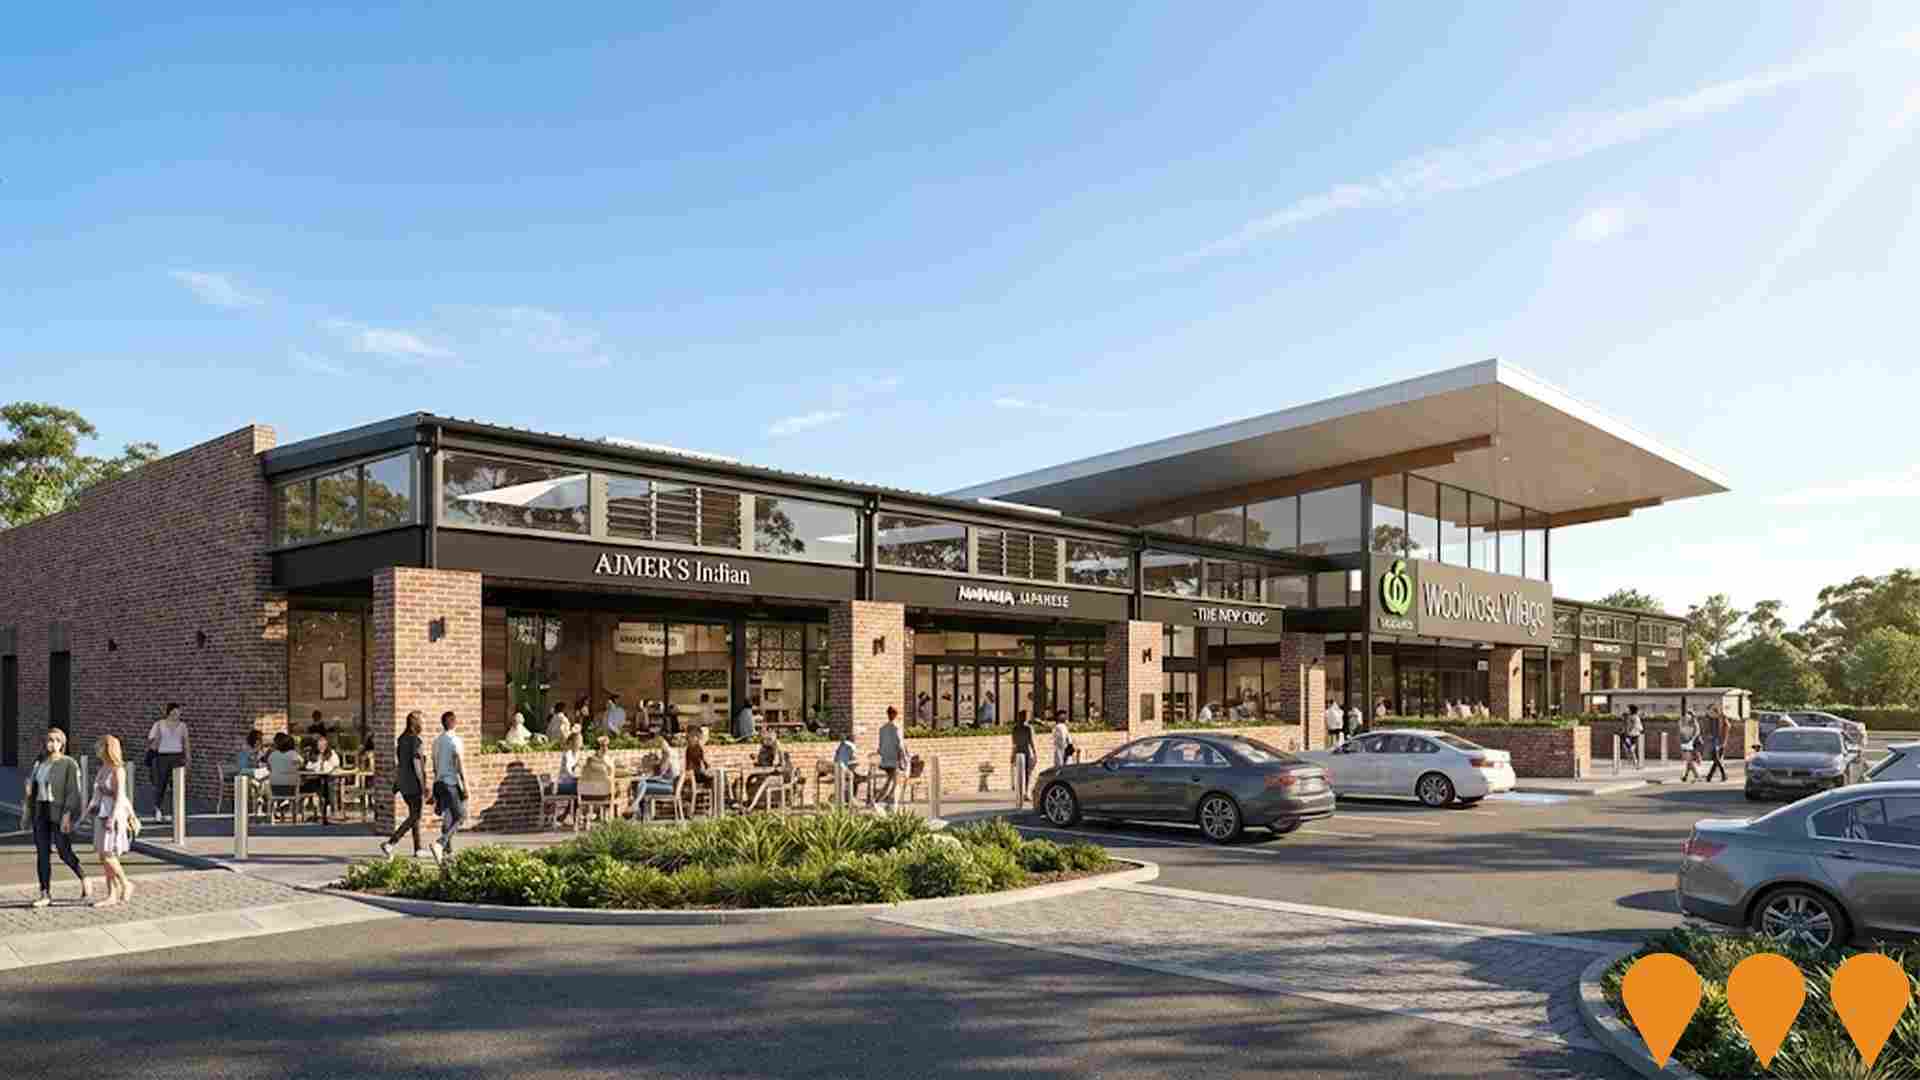
Glenrose Village Shopping Centre Redevelopment and Expansion
Redevelopment and expansion of the Glenrose Village neighbourhood shopping centre in Belrose, including a new Woolworths supermarket of about 4,200 sqm, an ALDI supermarket, additional specialty retail tenancies, upgraded on grade and undercover parking, and a new dining precinct fronting Glen Street. The multi stage project, delivered for Woolworths as centre owner with ADCO Constructions as builder, has created an open air village style centre with improved access, parking and a mix of everyday retail and food venues that support the nearby Glen Street Theatre and community facilities. Works were completed around 2016 to 2017 and the centre is now trading with ongoing tenancy refresh and minor fitout activity.
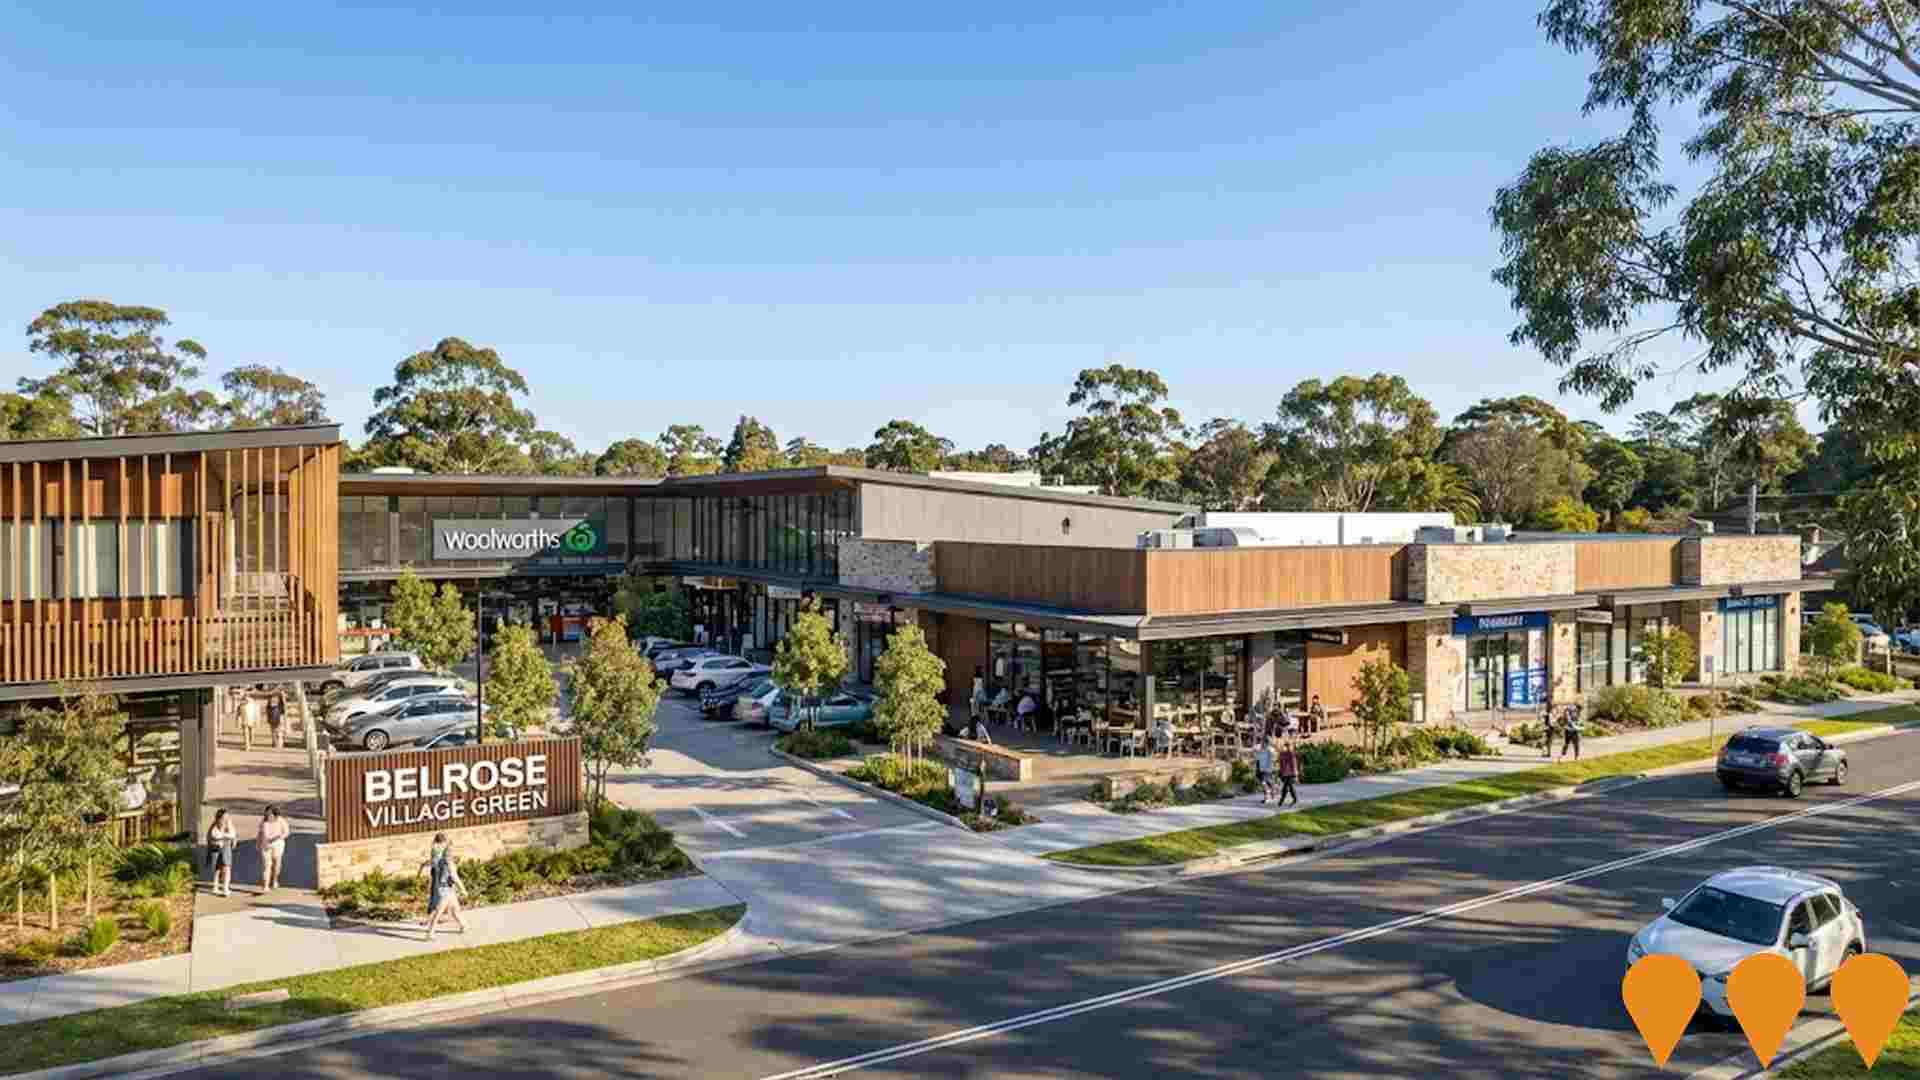
Belrose Village Green
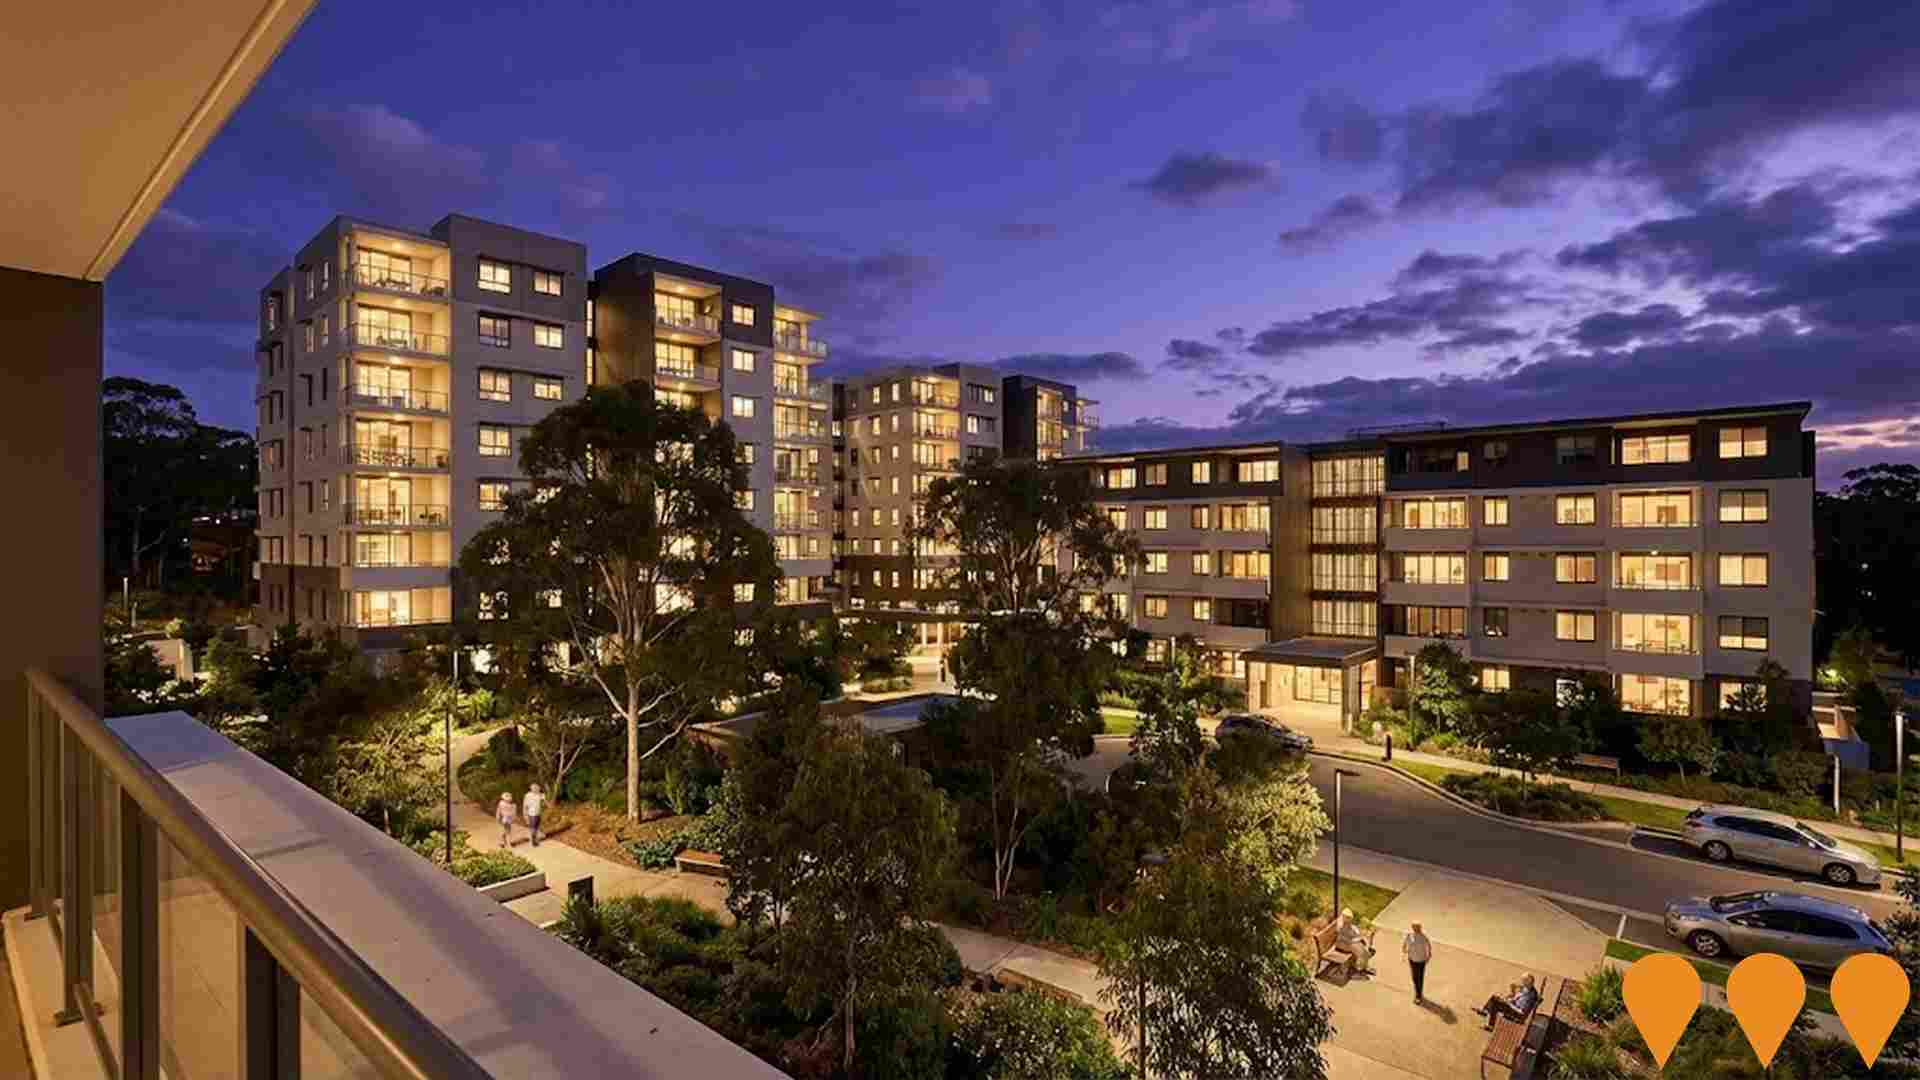
Belrose Village Green is a new neighbourhood retail centre on Forest Way in Belrose. The development will deliver a full line supermarket, specialty shops, medical and allied health services, food and beverage outlets and a childcare facility in a modern village style setting serving the surrounding Northern Beaches community.
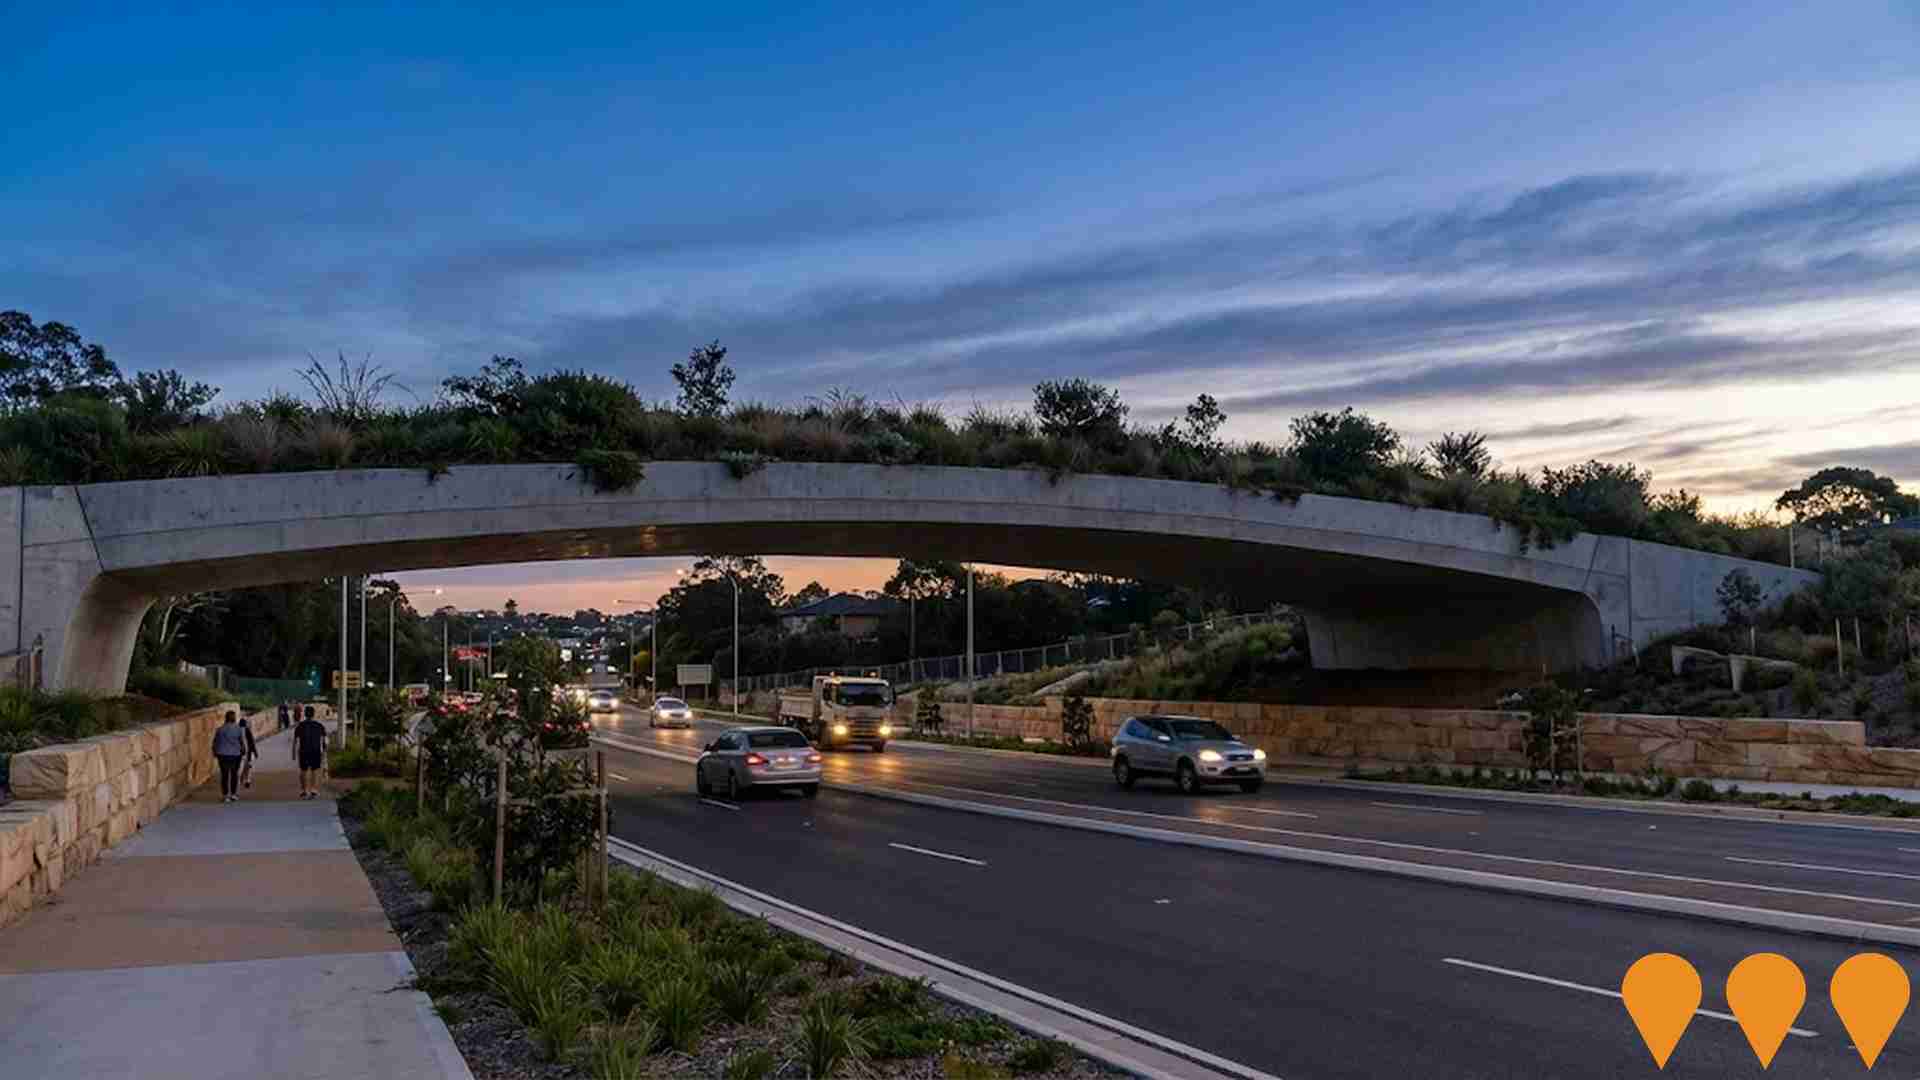
Mona Vale Road West Upgrade (McCarrs Creek Road to Powder Works Road)
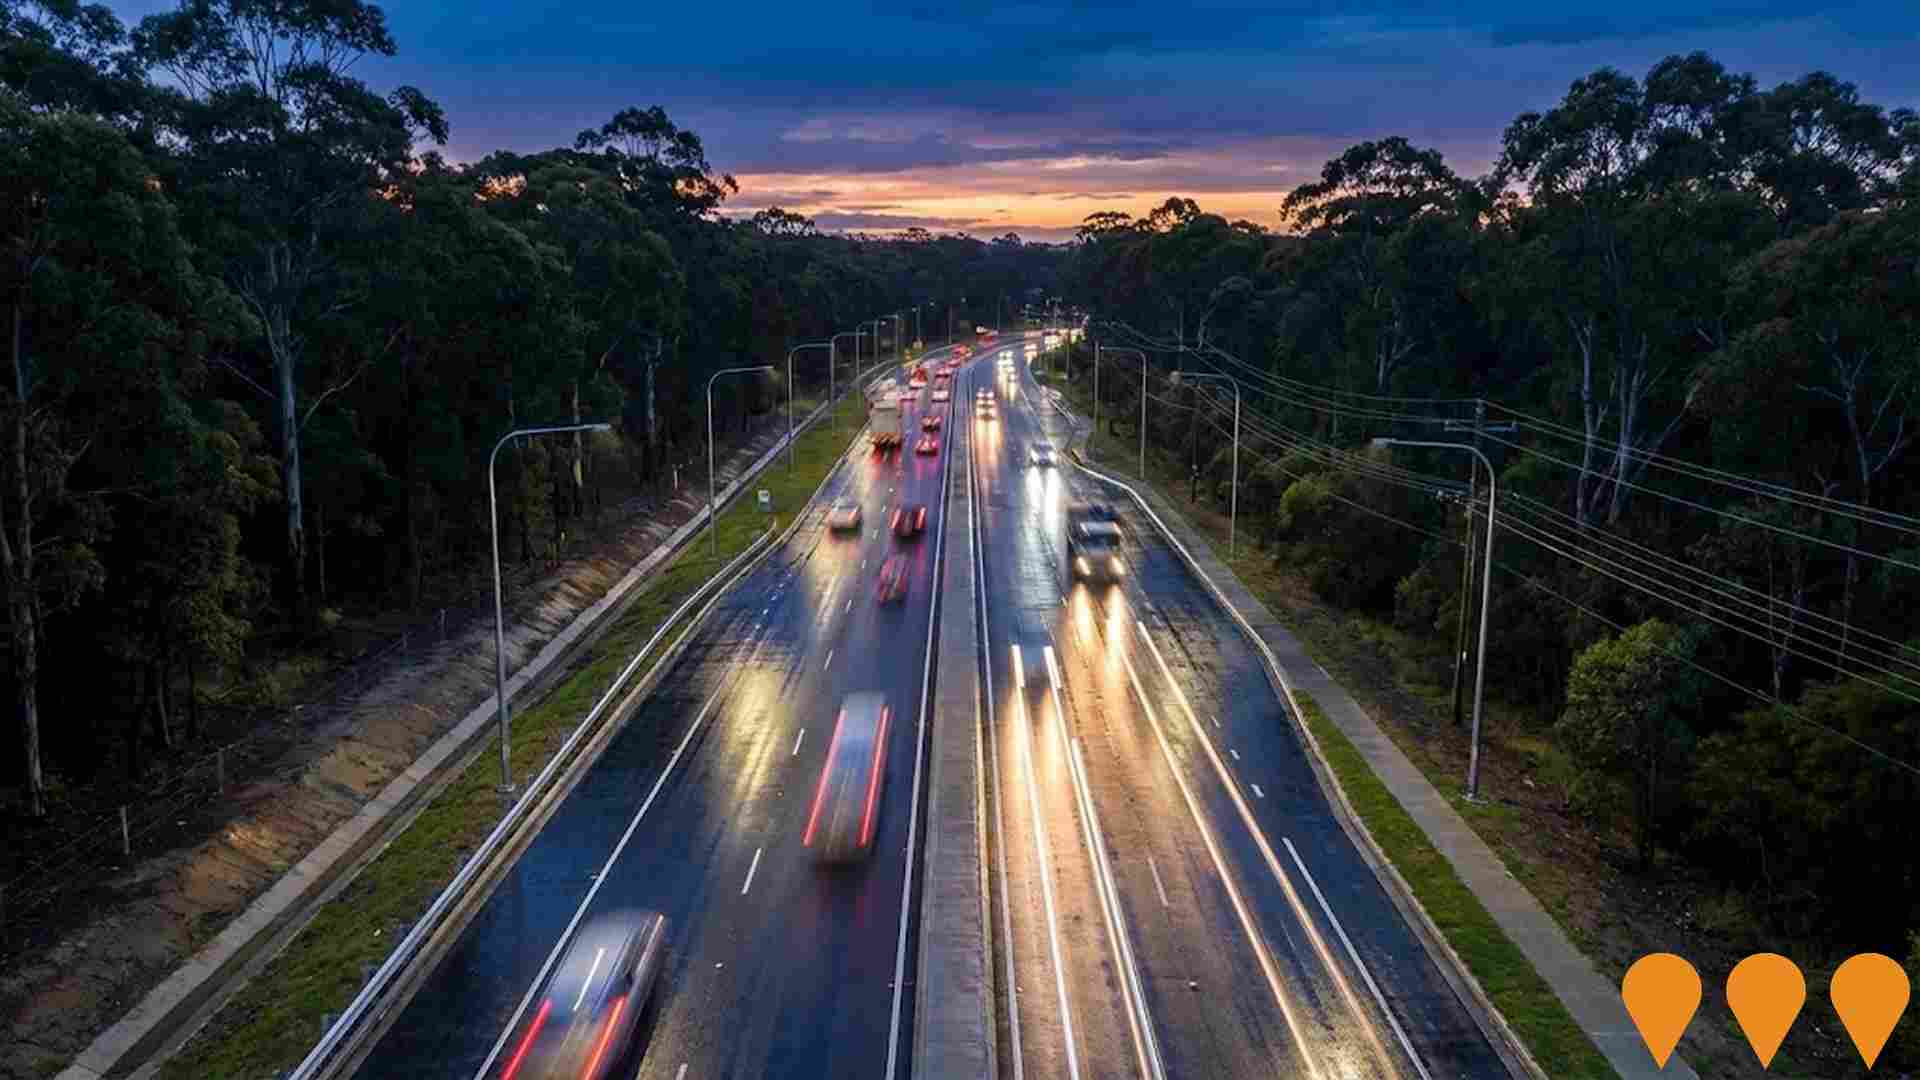
The Mona Vale Road West Upgrade will expand 3.4 kilometres of Mona Vale Road from two lanes to four lanes between McCarrs Creek Road, Terrey Hills and Powder Works Road, Ingleside. This project aims to improve safety and traffic efficiency. Key features include a new signalised intersection at Kimbriki Road, the relocation of the Tumburra Street intersection, and the construction of a 40-metre fauna bridge and two underpasses to protect local wildlife.
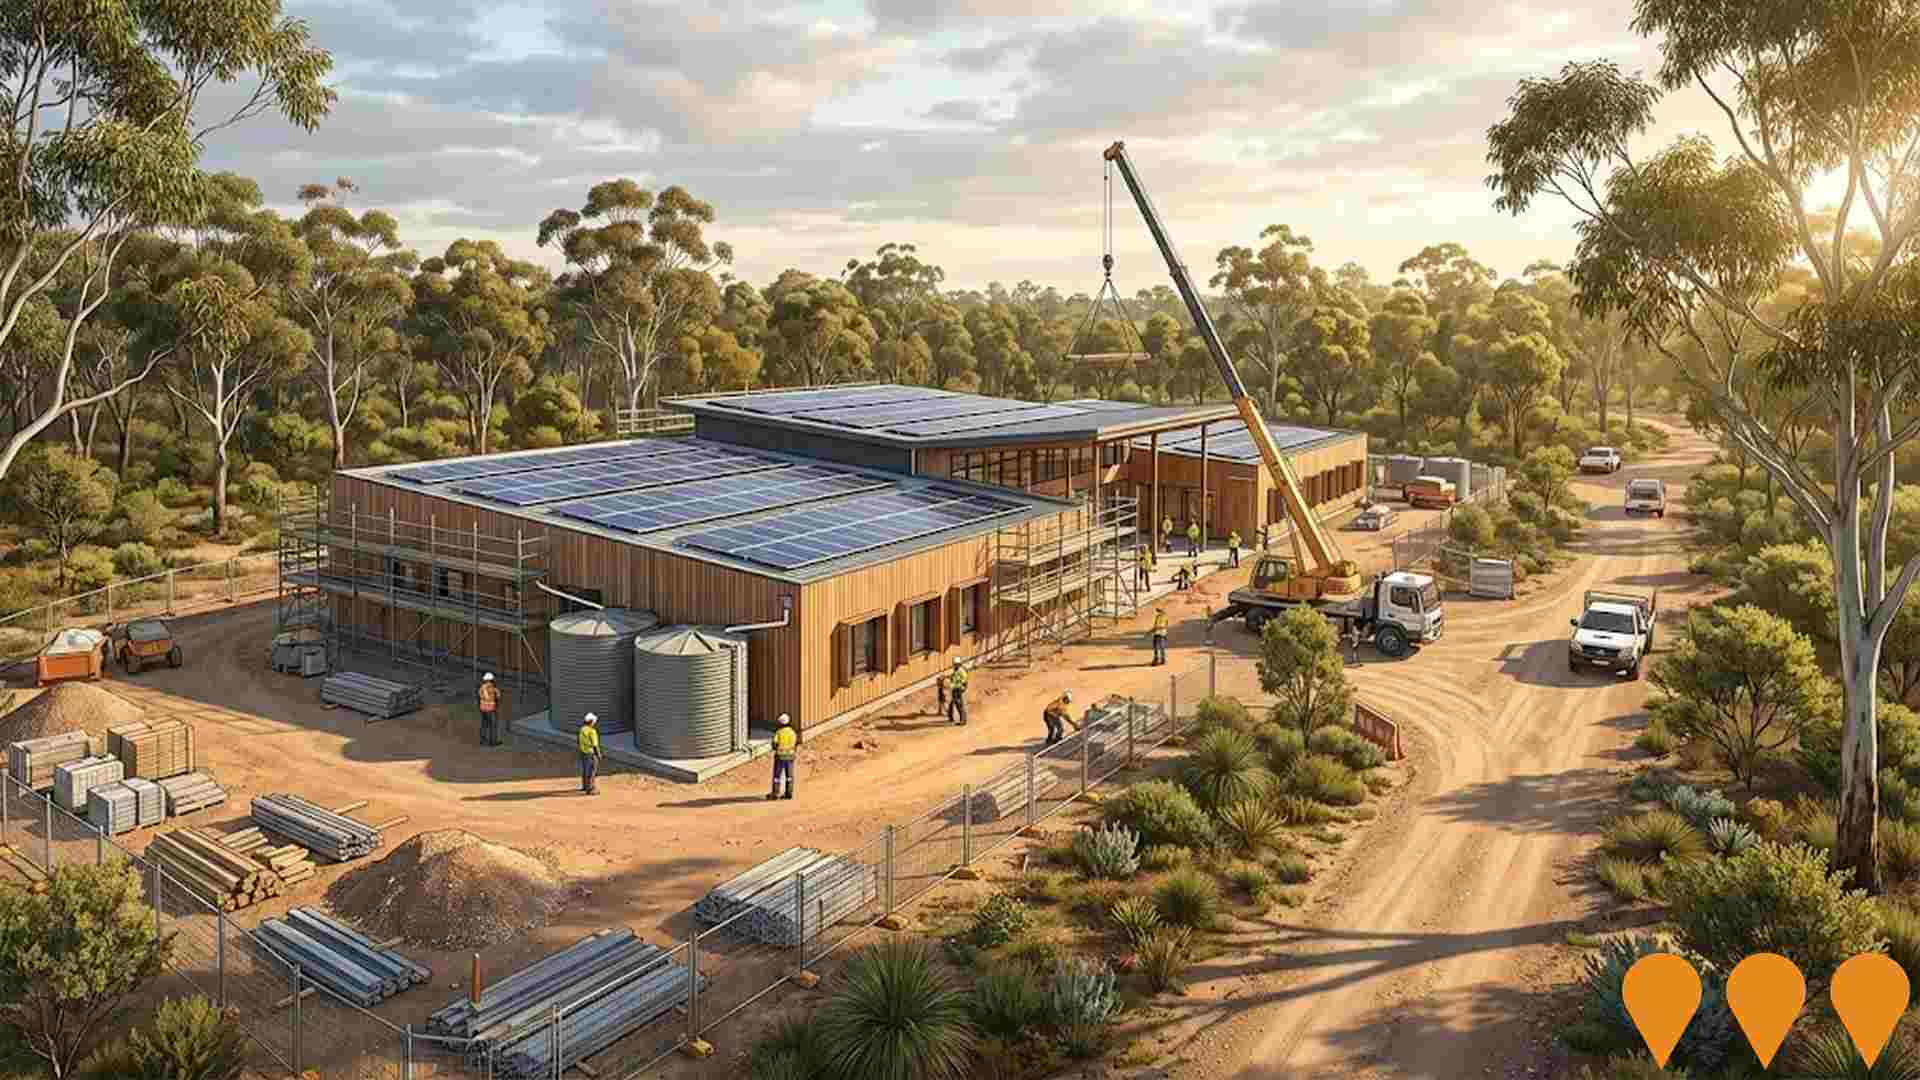
Cultural and Environmental Education Centre, St Ives
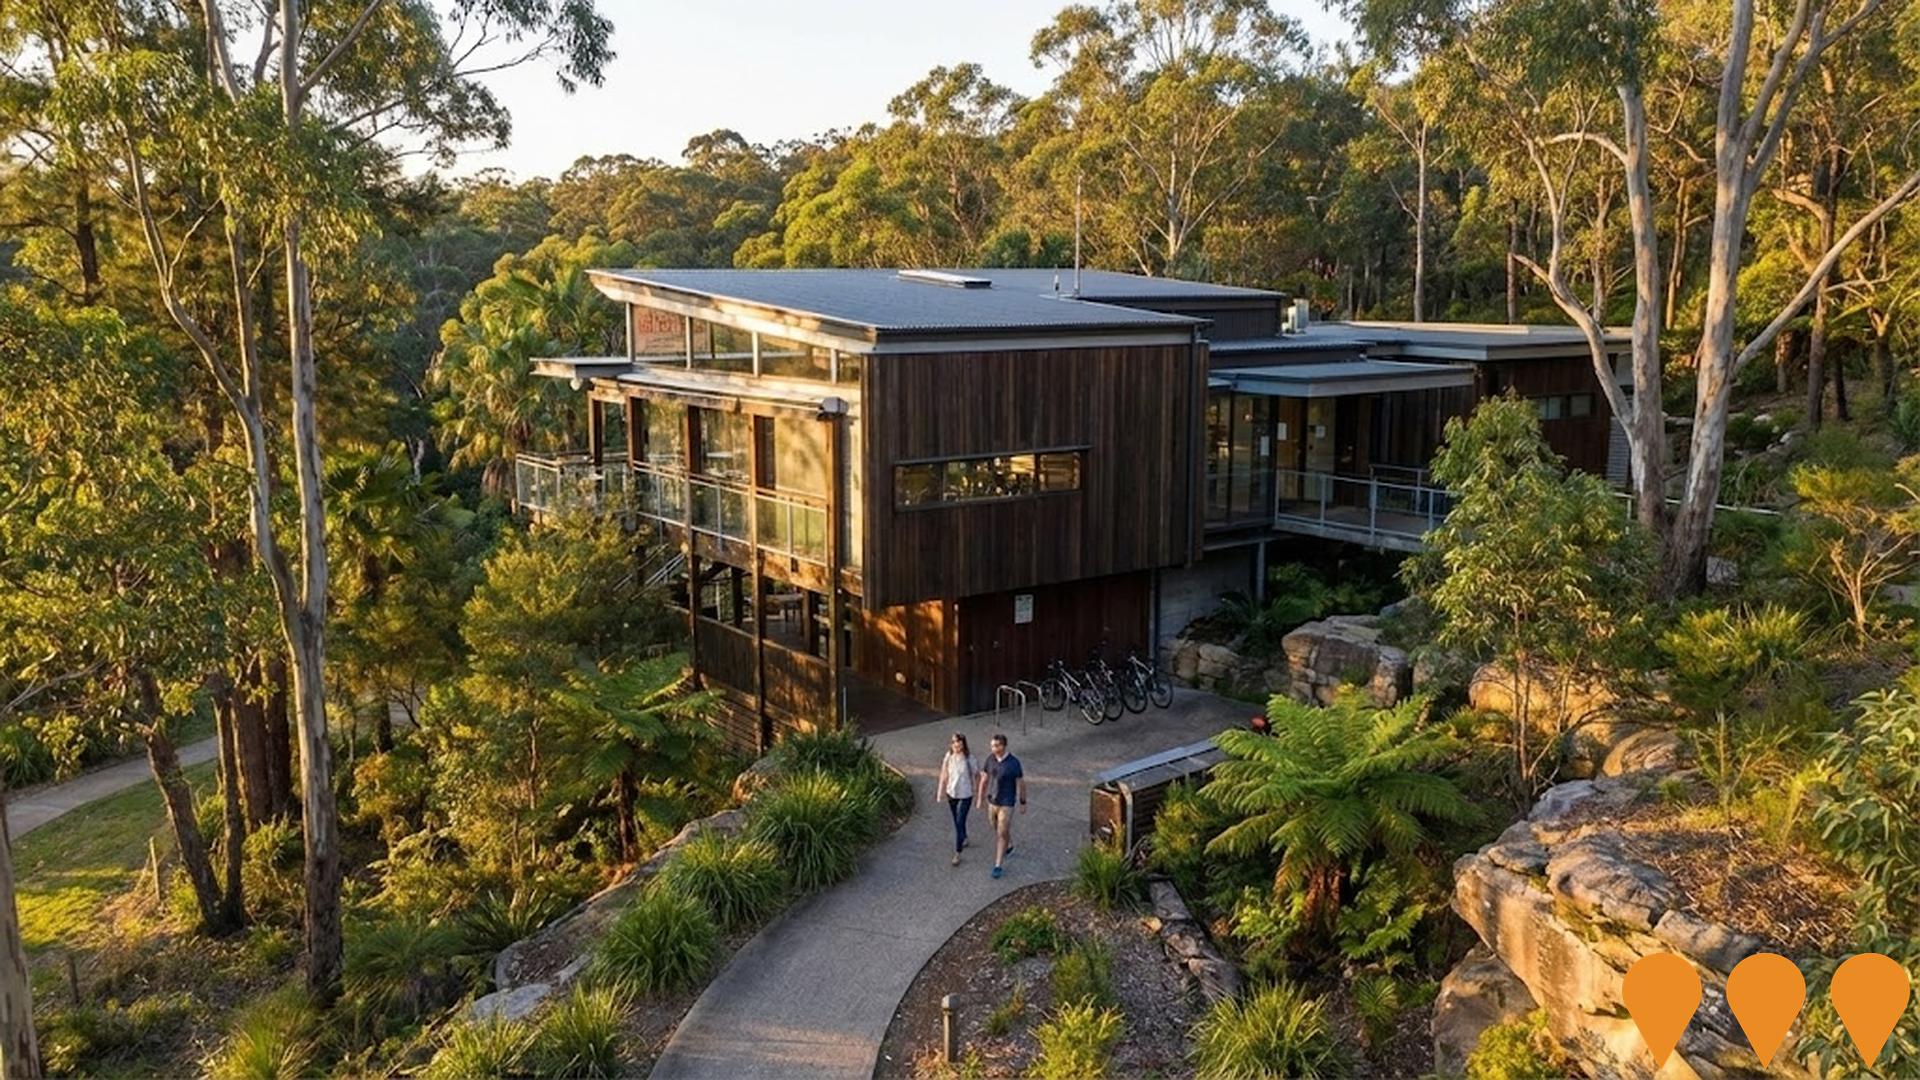
Ku-ring-gai Council is delivering a new Cultural and Environmental Education Centre at St Ives Showground to host workshops, seminars, community events and sustainability programs. The design targets the Living Building Challenge and includes passive design, rooftop solar and water capture features. Construction is planned for the 2025-2026 financial year, following final design and tendering.
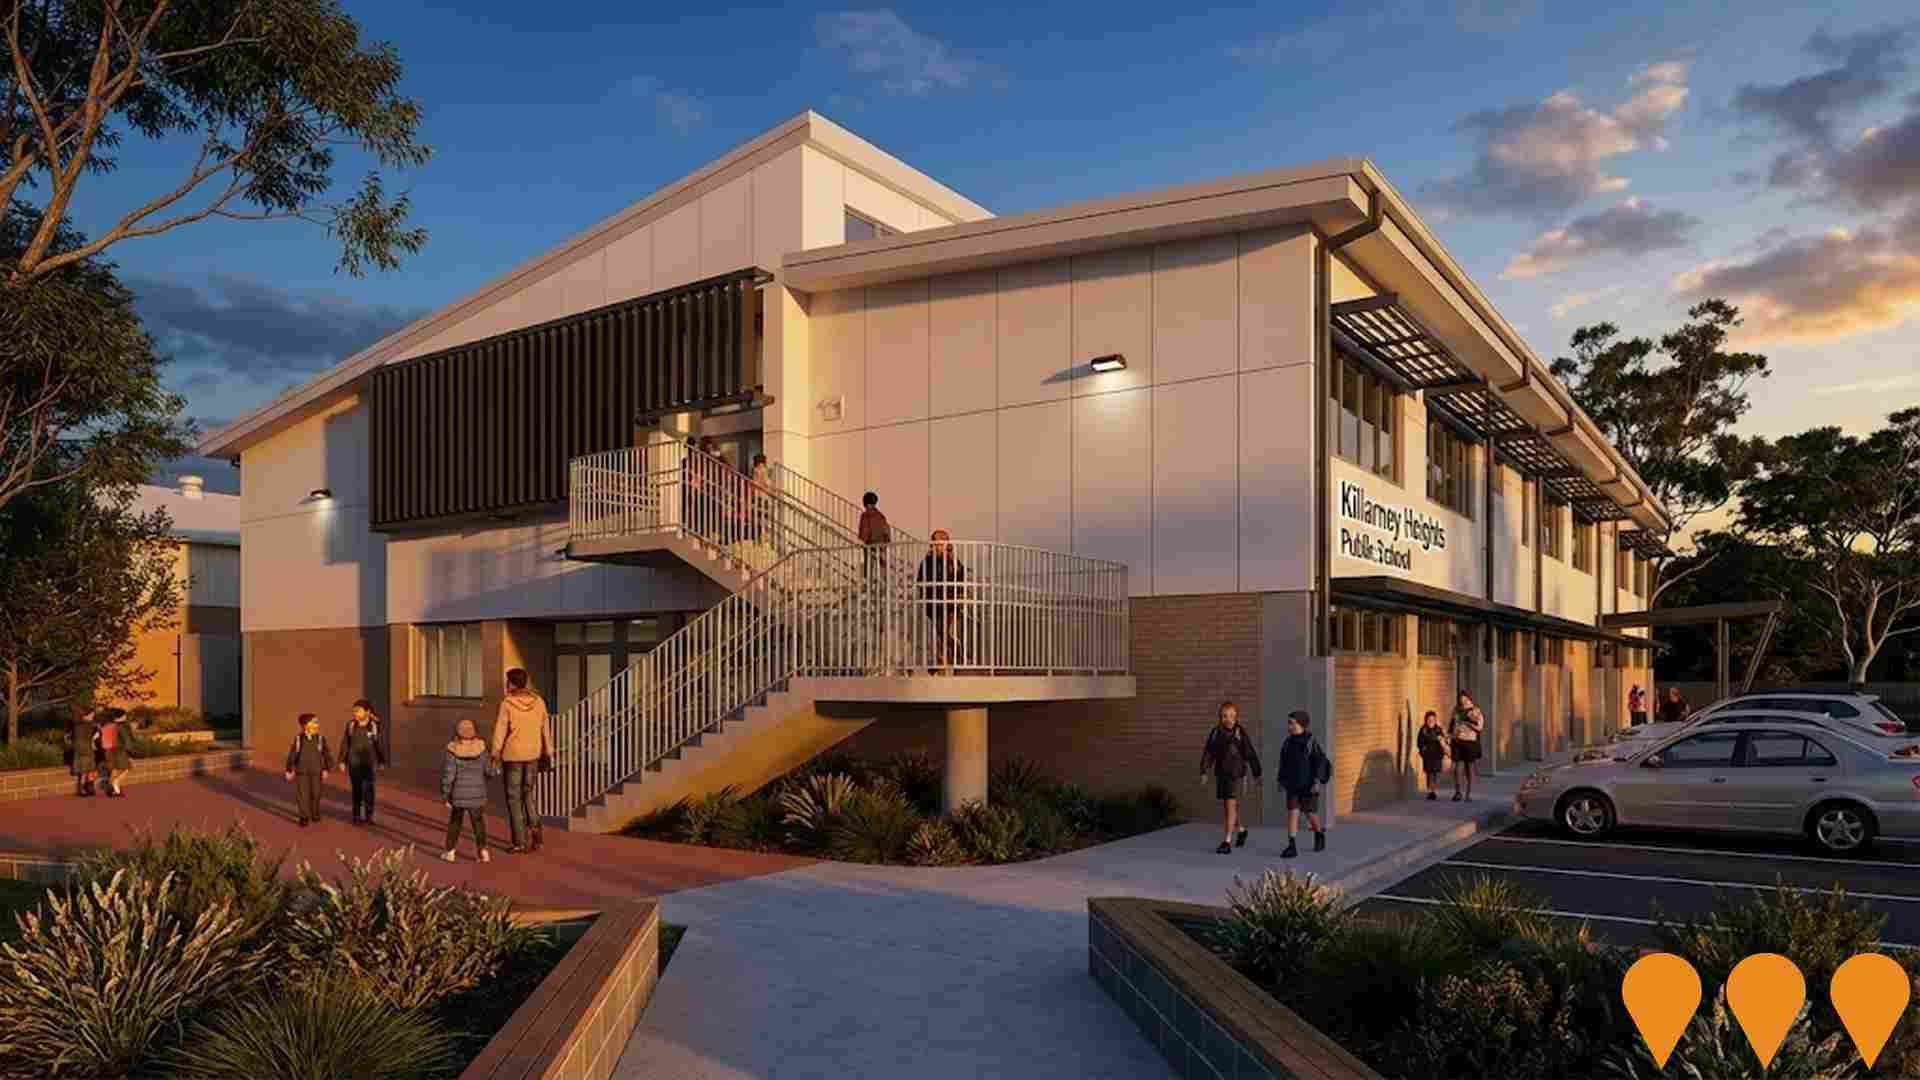
Killarney Heights Public School Upgrade
Comprehensive school infrastructure upgrade including new classrooms, library facilities, playground improvements, and accessibility enhancements.
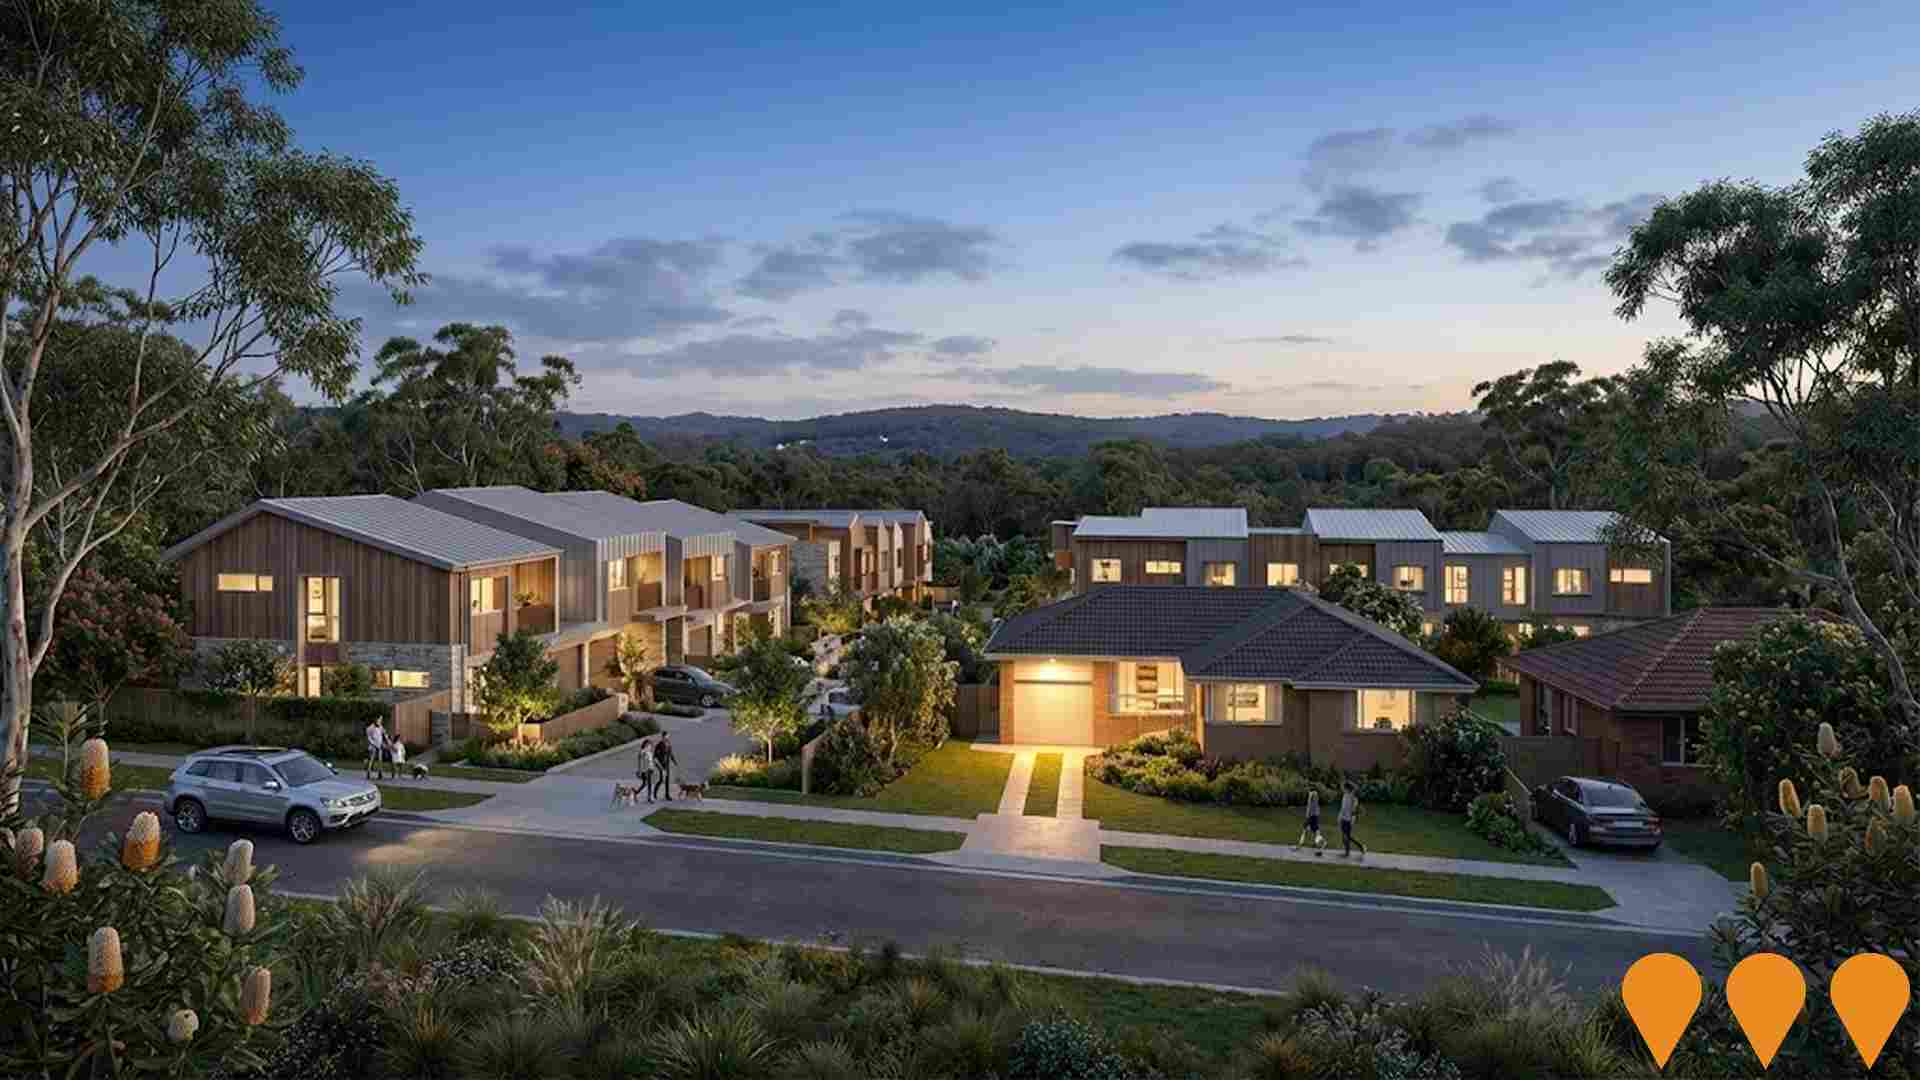
Belrose North Residential Release
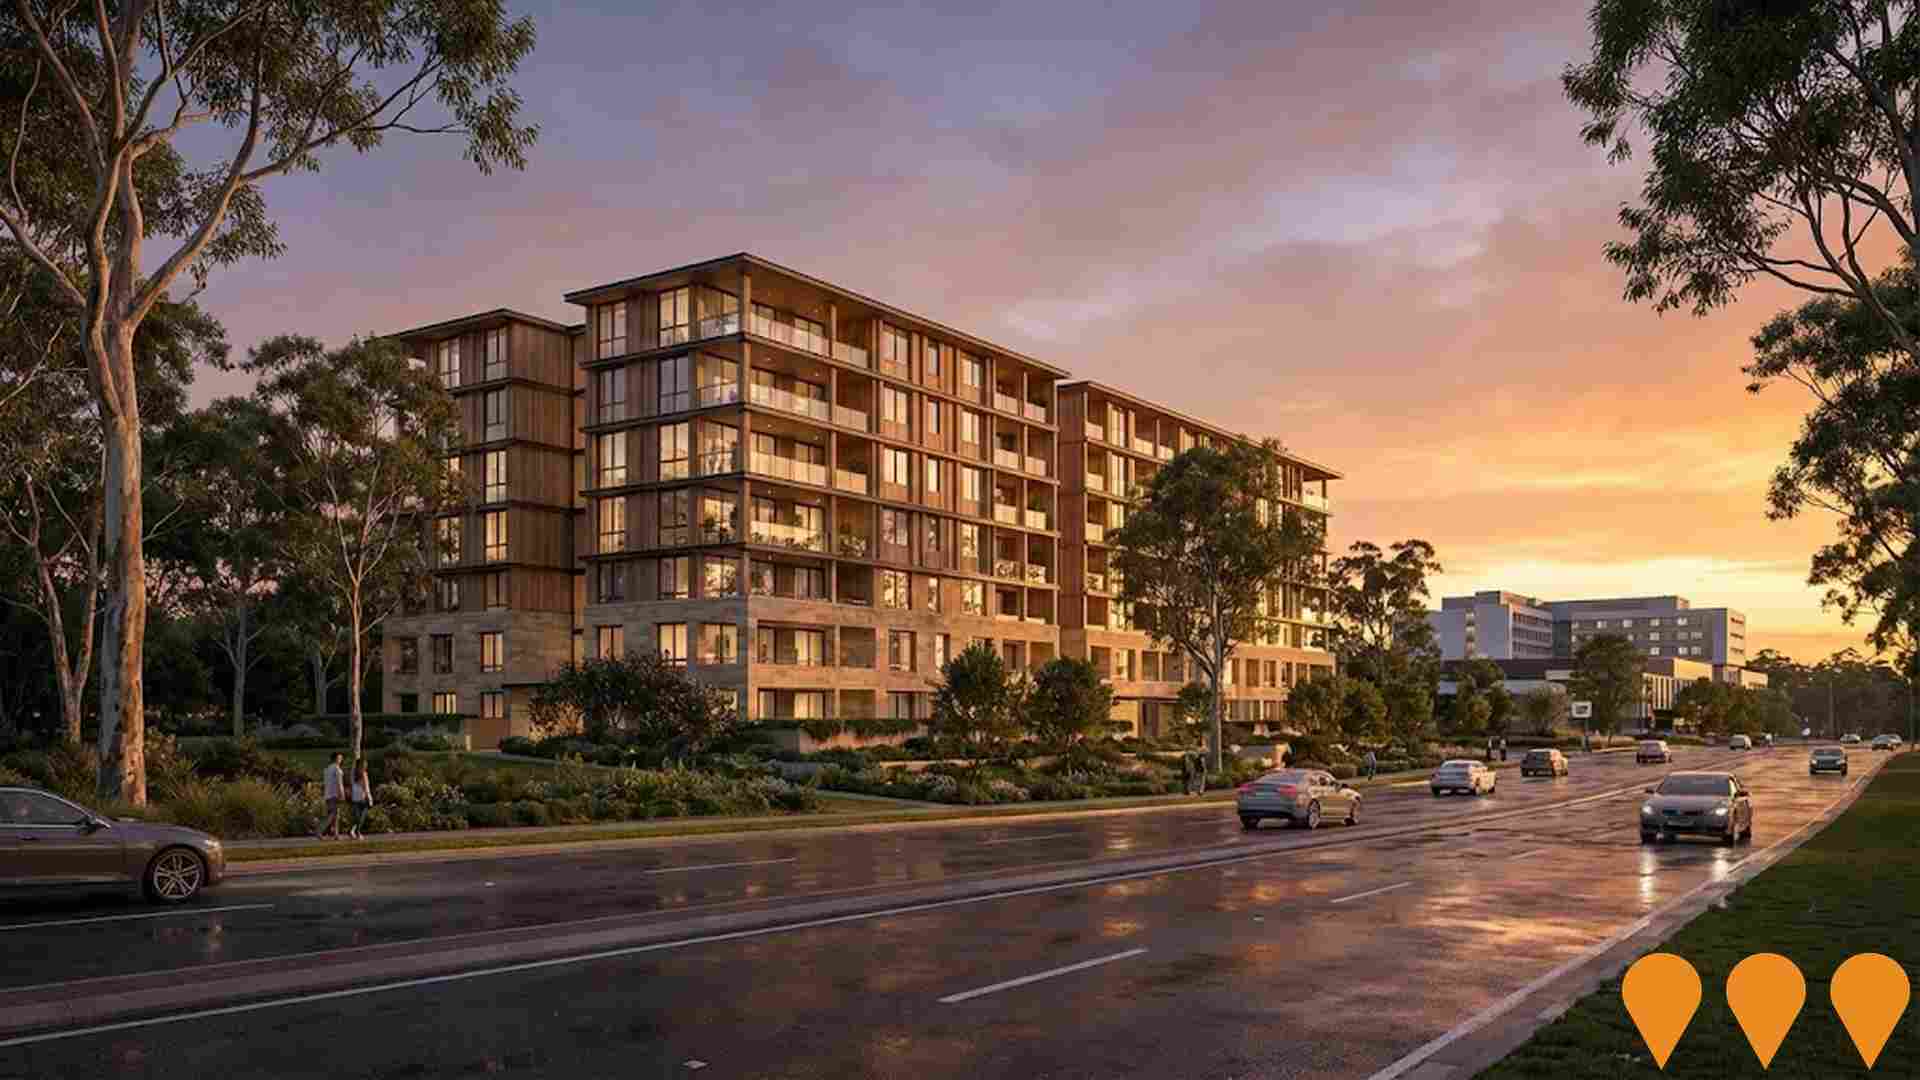
Mirvac's proposed masterplanned community in the Belrose North precinct, envisaged to deliver approximately 250 new homes including townhomes, terraces and apartments on land around Wyatt Avenue and Ralston Avenue. The site forms part of the Oxford Falls Valley and Belrose North 'deferred lands' area, where planning controls and rezoning outcomes continue to be considered by Northern Beaches Council and the NSW Government.
Employment
AreaSearch assessment positions Belrose ahead of most Australian regions for employment performance
Belrose has an educated workforce with notable representation in the technology sector. Its unemployment rate is 2.8%.
As of September 2025, there are 4340 residents employed with an unemployment rate of 1.4%, lower than Greater Sydney's rate of 4.2%. Workforce participation is similar to Greater Sydney at 60.0%. Dominant employment sectors include professional & technical services, healthcare & social assistance, and retail trade. The area has a strong specialization in education & training with an employment share 1.2 times the regional level.
Conversely, transport, postal & warehousing employs only 2.9% of local workers compared to Greater Sydney's 5.3%. The ratio of 0.7 workers per resident indicates higher than average local employment opportunities. Over a 12-month period ending in September 2025, Belrose's labour force decreased by 0.7%, while employment fell by 1.6%, leading to an unemployment rate increase of 0.9 percentage points. In contrast, Greater Sydney saw employment rise by 2.1% and the labour force grow by 2.4%. Statewide in NSW as of 25-Nov-25, employment contracted by 0.03% with an unemployment rate of 3.9%, favourable compared to the national rate of 4.3%. Job and Skills Australia's forecasts indicate national employment growth of 6.6% over five years and 13.7% over ten years. Applying these projections to Belrose's employment mix suggests local employment should increase by 6.9% over five years and 14.0% over ten years, though this is a simplified extrapolation for illustrative purposes only.
Frequently Asked Questions - Employment
Income
Income metrics indicate excellent economic conditions, with the area achieving higher performance than 75% of national locations assessed by AreaSearch
In financial year 2022, Belrose SA2 had a median taxpayer income of $58,600 and an average income of $92,636. These figures are significantly higher than the national averages of $56,994 and $80,856 for Greater Sydney respectively. By September 2025, adjusted for a 12.61% Wage Price Index growth since financial year 2022, median income is estimated at approximately $65,989 and average income at $104,317. According to the 2021 Census, Belrose's household incomes rank at the 92nd percentile with a weekly income of $2,601. Income distribution shows that 32.3% of individuals earn over $4,000 annually, contrasting with the metropolitan region where the majority fall within the $1,500 - $2,999 bracket at 30.9%. Economic strength is evident with 45.0% of households earning over $3,000 weekly, indicating high consumer spending power despite housing costs consuming 17.1% of income. Belrose's SEIFA income ranking places it in the 9th decile nationally.
Frequently Asked Questions - Income
Housing
Belrose is characterized by a predominantly suburban housing profile, with above-average rates of outright home ownership
Belrose's dwelling structure, as per the latest Census evaluation, consisted of 79.3% houses and 20.7% other dwellings (semi-detached, apartments, 'other' dwellings). This contrasted with Sydney metro's figures of 57.6% houses and 42.4% other dwellings. Home ownership in Belrose stood at 45.7%, with mortgaged dwellings at 42.5% and rented dwellings at 11.8%. The median monthly mortgage repayment in the area was $3,464, higher than Sydney metro's average of $3,000. The median weekly rent figure for Belrose was $885, compared to Sydney metro's $592. Nationally, Belrose's mortgage repayments were significantly higher than the Australian average of $1,863, while rents were substantially above the national figure of $375.
Frequently Asked Questions - Housing
Household Composition
Belrose features high concentrations of family households, with a higher-than-average median household size
Family households account for 79.4% of all households, including 45.0% couples with children, 25.0% couples without children, and 8.7% single parent families. Non-family households make up the remaining 20.6%, with lone person households at 19.7% and group households comprising 0.9% of the total. The median household size is 2.9 people, larger than the Greater Sydney average of 2.7.
Frequently Asked Questions - Households
Local Schools & Education
Educational achievement in Belrose places it within the top 10% nationally, reflecting strong academic performance and high qualification levels across the community
Belrose trail residents aged 15+ have 35.4% university degrees, compared to the SA4 region's 41.5%. This indicates potential for educational development and skills enhancement. Bachelor degrees are most prevalent at 24.4%, followed by postgraduate qualifications (8.0%) and graduate diplomas (3.0%). Vocational credentials are held by 30.7% of residents, with advanced diplomas at 13.5% and certificates at 17.2%.
Educational participation is high, with 29.5% currently enrolled in formal education, including secondary (9.9%), primary (9.7%), and tertiary (4.9%) levels.
Frequently Asked Questions - Education
Schools Detail
Nearby Services & Amenities
Transport
Transport servicing is good compared to other areas nationally based on assessment of service frequency, route connectivity and accessibility
Analysis of public transport in Belrose indicates 68 active transport stops operating within the area, all of which are bus stops. These stops are serviced by 68 individual routes, collectively providing 1967 weekly passenger trips. Transport accessibility is rated as good, with residents typically located 230 meters from the nearest transport stop.
Service frequency averages 281 trips per day across all routes, equating to approximately 28 weekly trips per individual stop.
Frequently Asked Questions - Transport
Transport Stops Detail
Health
Health outcomes in Belrose are marginally below the national average with common health conditions somewhat prevalent across both younger and older age cohorts
Belrose shows below-average health outcomes, with common conditions prevalent across all ages. Private health cover stands at 67%, compared to Greater Sydney's 71.5% and the national average of 55.3%. Arthritis affects 8.7% and asthma impacts 7.1% of residents.
67.9% report no medical ailments, lower than Greater Sydney's 74.7%. The area has a higher proportion of seniors at 25.6%, compared to Greater Sydney's 17.8%. Health outcomes among seniors present similar challenges to the general population.
Frequently Asked Questions - Health
Cultural Diversity
The level of cultural diversity witnessed in Belrose was found to be above average when compared nationally for a number of language and cultural background related metrics
Belrose had a higher cultural diversity than most local markets, with 16.6% speaking a language other than English at home and 29.0% born overseas. Christianity was the predominant religion in Belrose, comprising 61.1%, compared to 51.6% across Greater Sydney. The top three ancestry groups were English (28.8%), Australian (24.2%), and Other (10.1%).
Notably, South African ancestry was higher at 1.5% than the regional average of 0.9%. French ancestry stood at 0.8%, slightly lower than the regional 1.1%. New Zealand ancestry was 0.9%, similar to the regional figure.
Frequently Asked Questions - Diversity
Age
Belrose hosts an older demographic, ranking in the top quartile nationwide
The median age in Belrose is 46 years, which is higher than Greater Sydney's average of 37 years and also above Australia's median age of 38 years. The 75-84 age cohort makes up 11.4% of Belrose's population, significantly higher than the national average of 6%. Conversely, those aged 25-34 comprise only 5%, lower than Greater Sydney's average. Between the 2021 Census and now, the 15 to 24 age group has increased from 12.3% to 14.6%, while the 65 to 74 cohort has decreased from 10.2% to 8.5%. The population forecasts for Belrose indicate substantial demographic changes by 2041, with the 85+ age group projected to grow significantly from 503 to 815 people (a 62% increase). Those aged 65 and above are expected to comprise 69% of this growth. Conversely, the 0 to 4 and 35 to 44 age groups are forecasted to experience population declines.
