Chart Color Schemes
This analysis uses ABS Statistical Areas Level 2 (SA2) boundaries, which can materially differ from Suburbs and Localities (SAL) even when sharing similar names.
SA2 boundaries are defined by the Australian Bureau of Statistics and are designed to represent communities for statistical reporting (e.g., census and ERP).
Suburbs and Localities (SAL) represent commonly-used suburb/locality names (postal-style areas) and may use different geographic boundaries. For comprehensive analysis, consider reviewing both boundary types if available.
est. as @ -- *
ABS ERP | -- people | --
2021 Census | -- people
Sales Activity
Curious about local property values? Filter the chart to assess the volume and appreciation (including resales) trends and regional comparisons, or scroll to the map below view this information at an individual property level.
Find a Recent Sale
Sales Detail
Population
Karabar has shown very soft population growth performance across periods assessed by AreaSearch
Karabar's population, as per AreaSearch's analysis, was around 8,456 by November 2025. This showed a decrease of 61 people from the 2021 Census figure of 8,517, indicating a 0.7% decline. The change was inferred from ABS estimated resident population data of 8,446 in June 2024 and an additional 33 validated new addresses since the Census date. This resulted in a population density ratio of 1,211 persons per square kilometer, higher than the average across national locations assessed by AreaSearch. Natural growth contributed approximately 58.4% of overall population gains during recent periods.
AreaSearch adopted ABS/Geoscience Australia projections for each SA2 area released in 2024 with a base year of 2022. For areas not covered, NSW State Government's SA2 level projections released in 2022 with a base year of 2021 were used. Growth rates by age group from these aggregations were applied to all areas for years 2032 to 2041. Population projections indicated an overall decline of 508 persons by 2041, but specific age cohorts were expected to grow, notably the 85 and over age group with a projected increase of 107 people.
Frequently Asked Questions - Population
Development
The level of residential development activity in Karabar is very low in comparison to the average area assessed nationally by AreaSearch
Karabar has seen approximately four new homes approved annually over the past five financial years, with 21 homes approved between FY2021 and FY2025. No new homes have been approved in FY2026 so far. The area's population decline suggests that new supply has likely kept pace with demand, providing good options for buyers.
New homes are being built at an average expected construction cost value of $326,000. This financial year has seen $19.7 million in commercial approvals, indicating steady commercial investment activity. Compared to the rest of NSW, Karabar shows significantly reduced construction activity, with 94.0% fewer approvals per person than the regional average. This limited new supply generally supports stronger demand and values for established dwellings, which is also below the national average, suggesting the area's established nature and potential planning limitations. Recent development has consisted entirely of detached houses, maintaining Karabar's traditional suburban character focused on family homes appealing to those seeking space.
Developers are building more traditional houses than the current mix suggests (80.0% at Census), indicating continued strong demand for family homes. The location has approximately 2117 people per dwelling approval, demonstrating an established market. With population expected to remain stable or decline, Karabar should see reduced pressure on housing, potentially creating opportunities for buyers.
Frequently Asked Questions - Development
Infrastructure
Karabar has moderate levels of nearby infrastructure activity, ranking in the 44thth percentile nationally
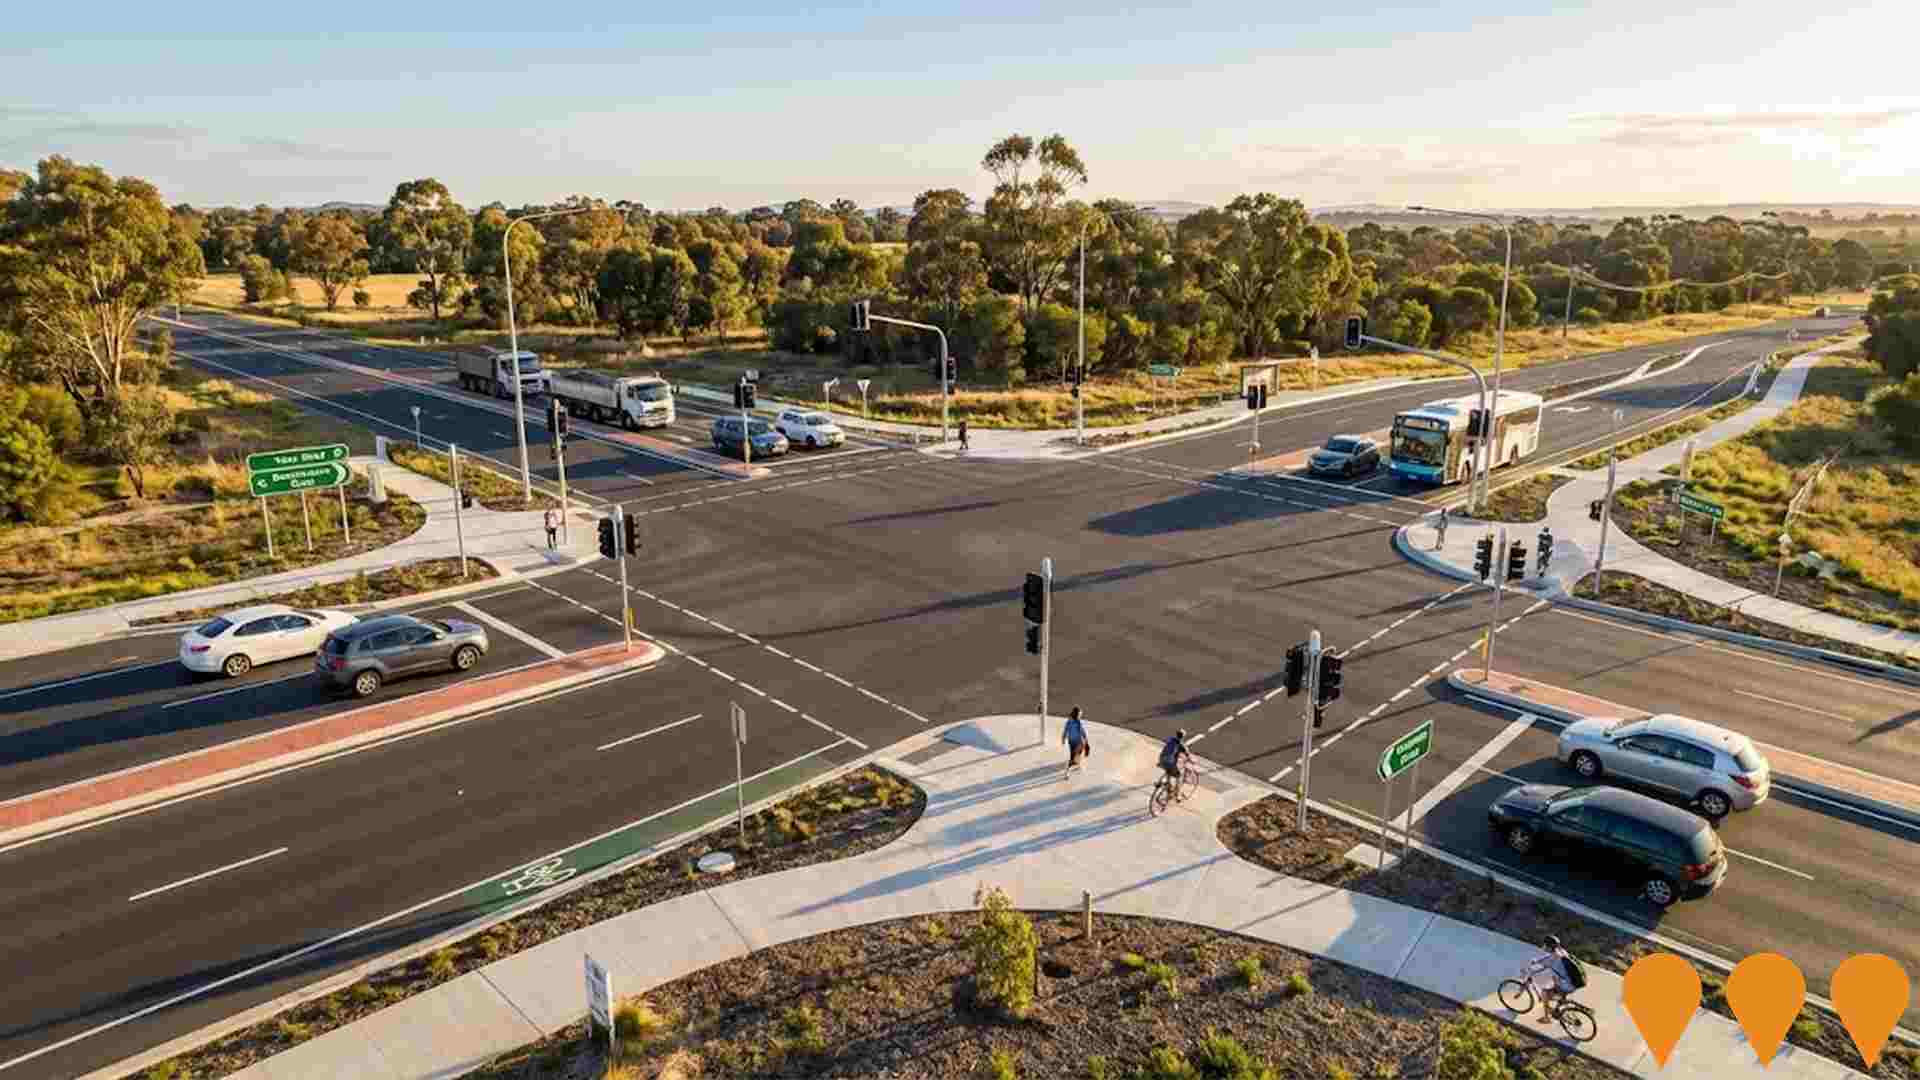
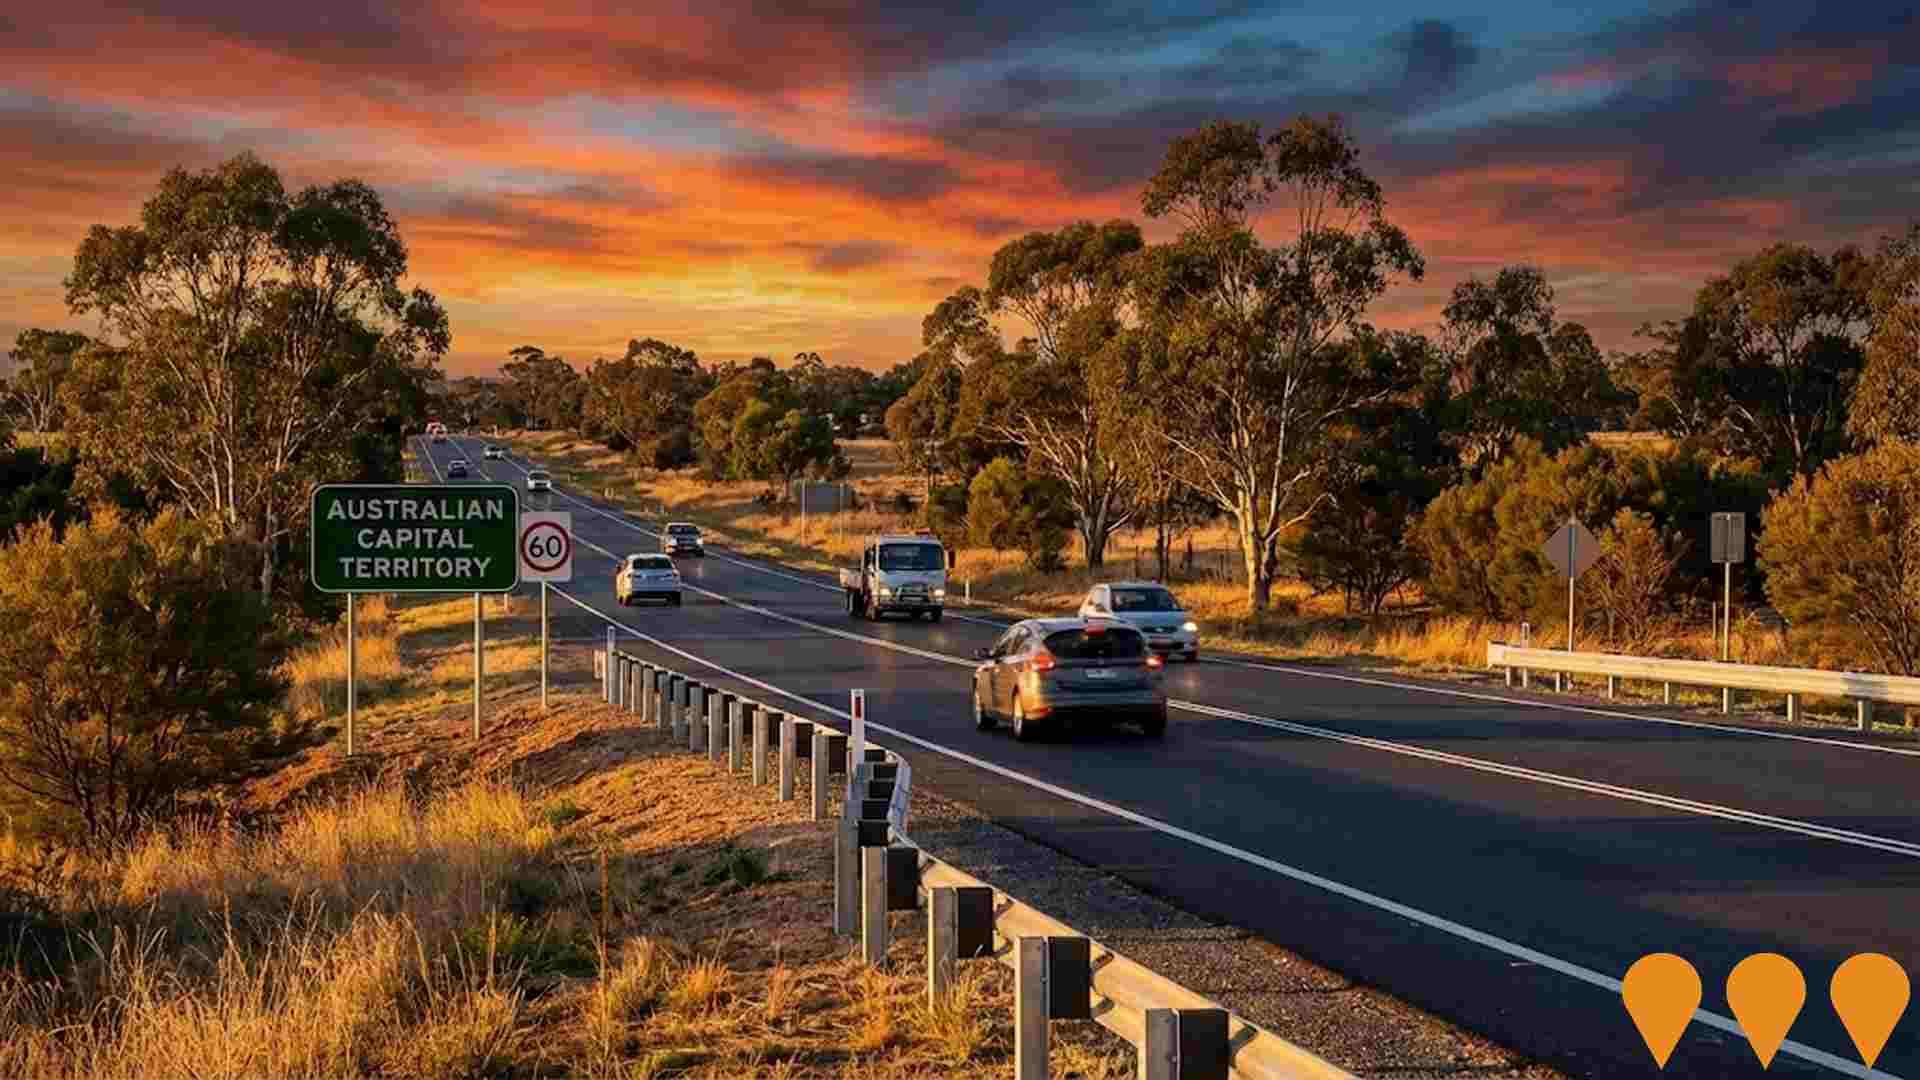
Changes to local infrastructure significantly impact an area's performance. AreaSearch identified five projects expected to affect the region. Notable ones are the Queanbeyan Sewage Treatment Plant Upgrade, Yass Road, Bungendore Road and Ellerton Drive Intersection Upgrade, and the Queanbeyan Regional Integrated Transport Plan. The following details those most pertinent.
Professional plan users can use the search below to filter and access additional projects.
INFRASTRUCTURE SEARCH
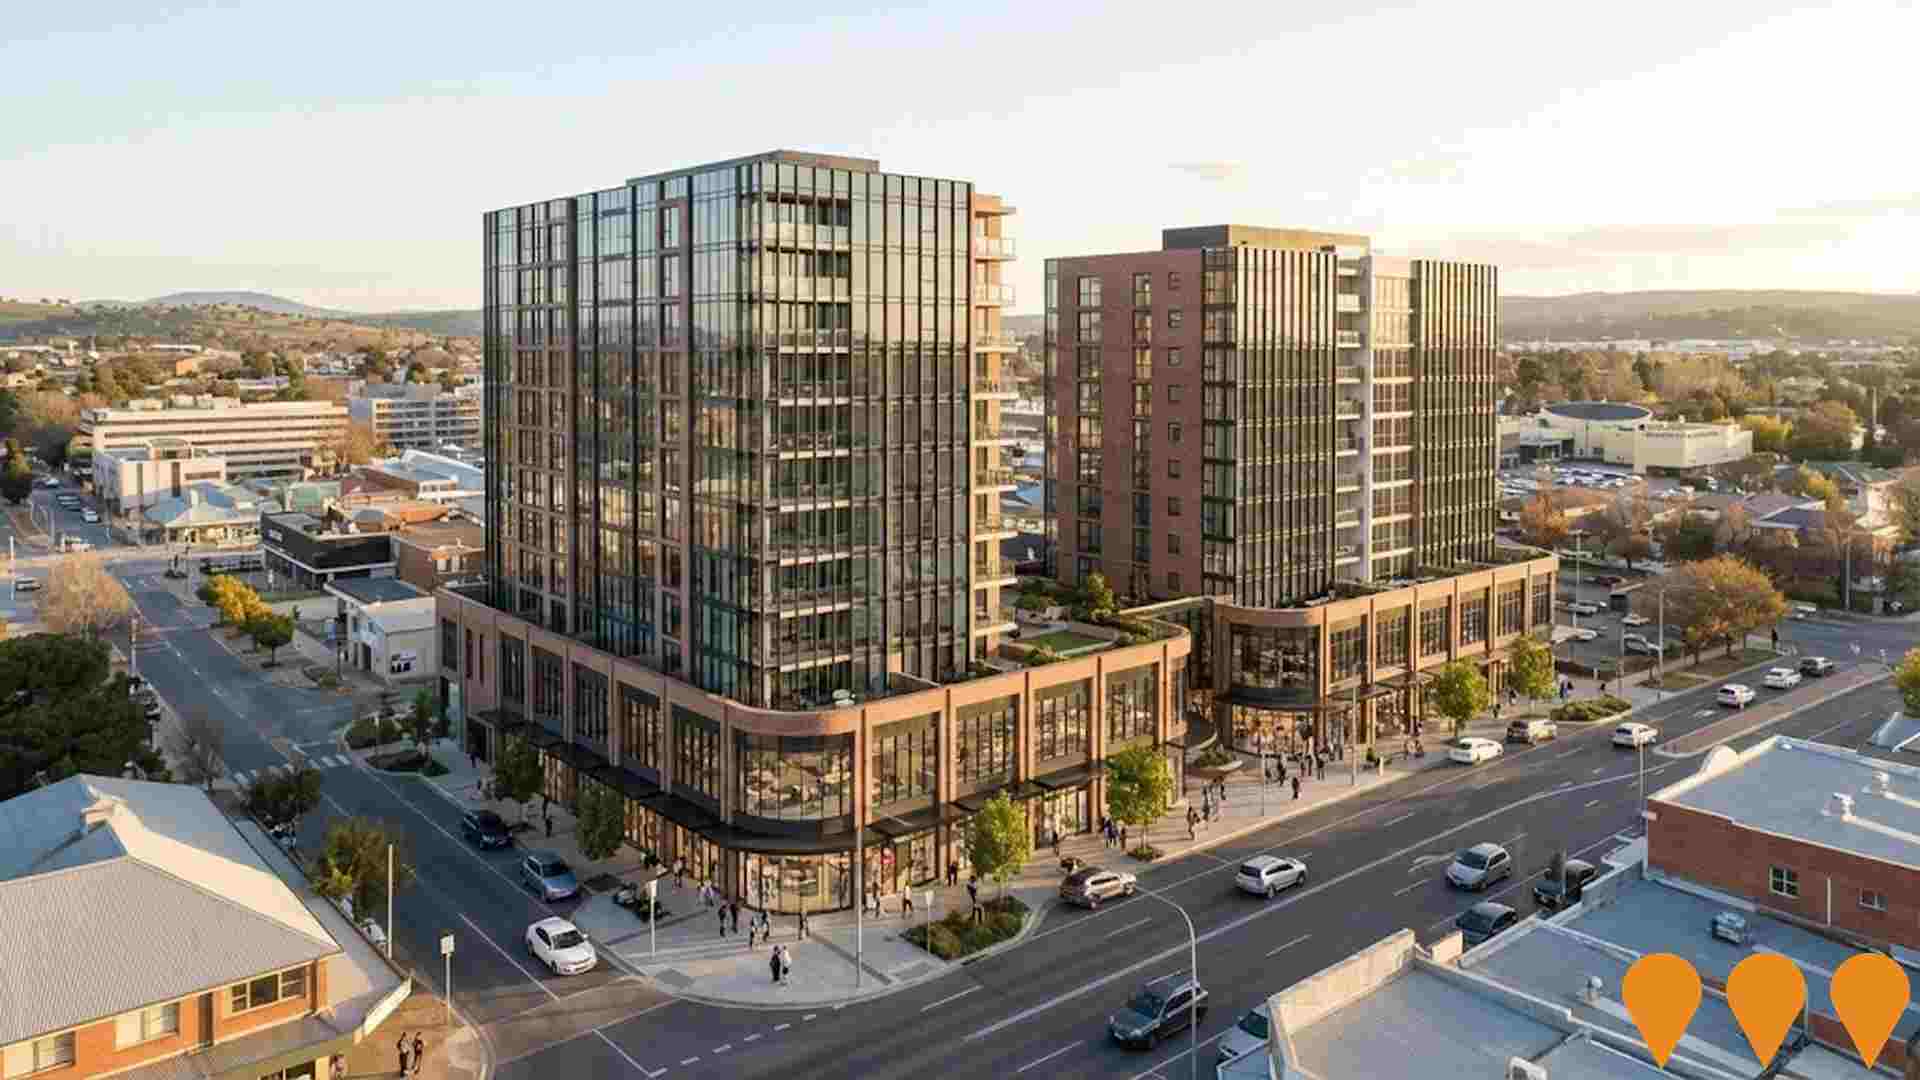
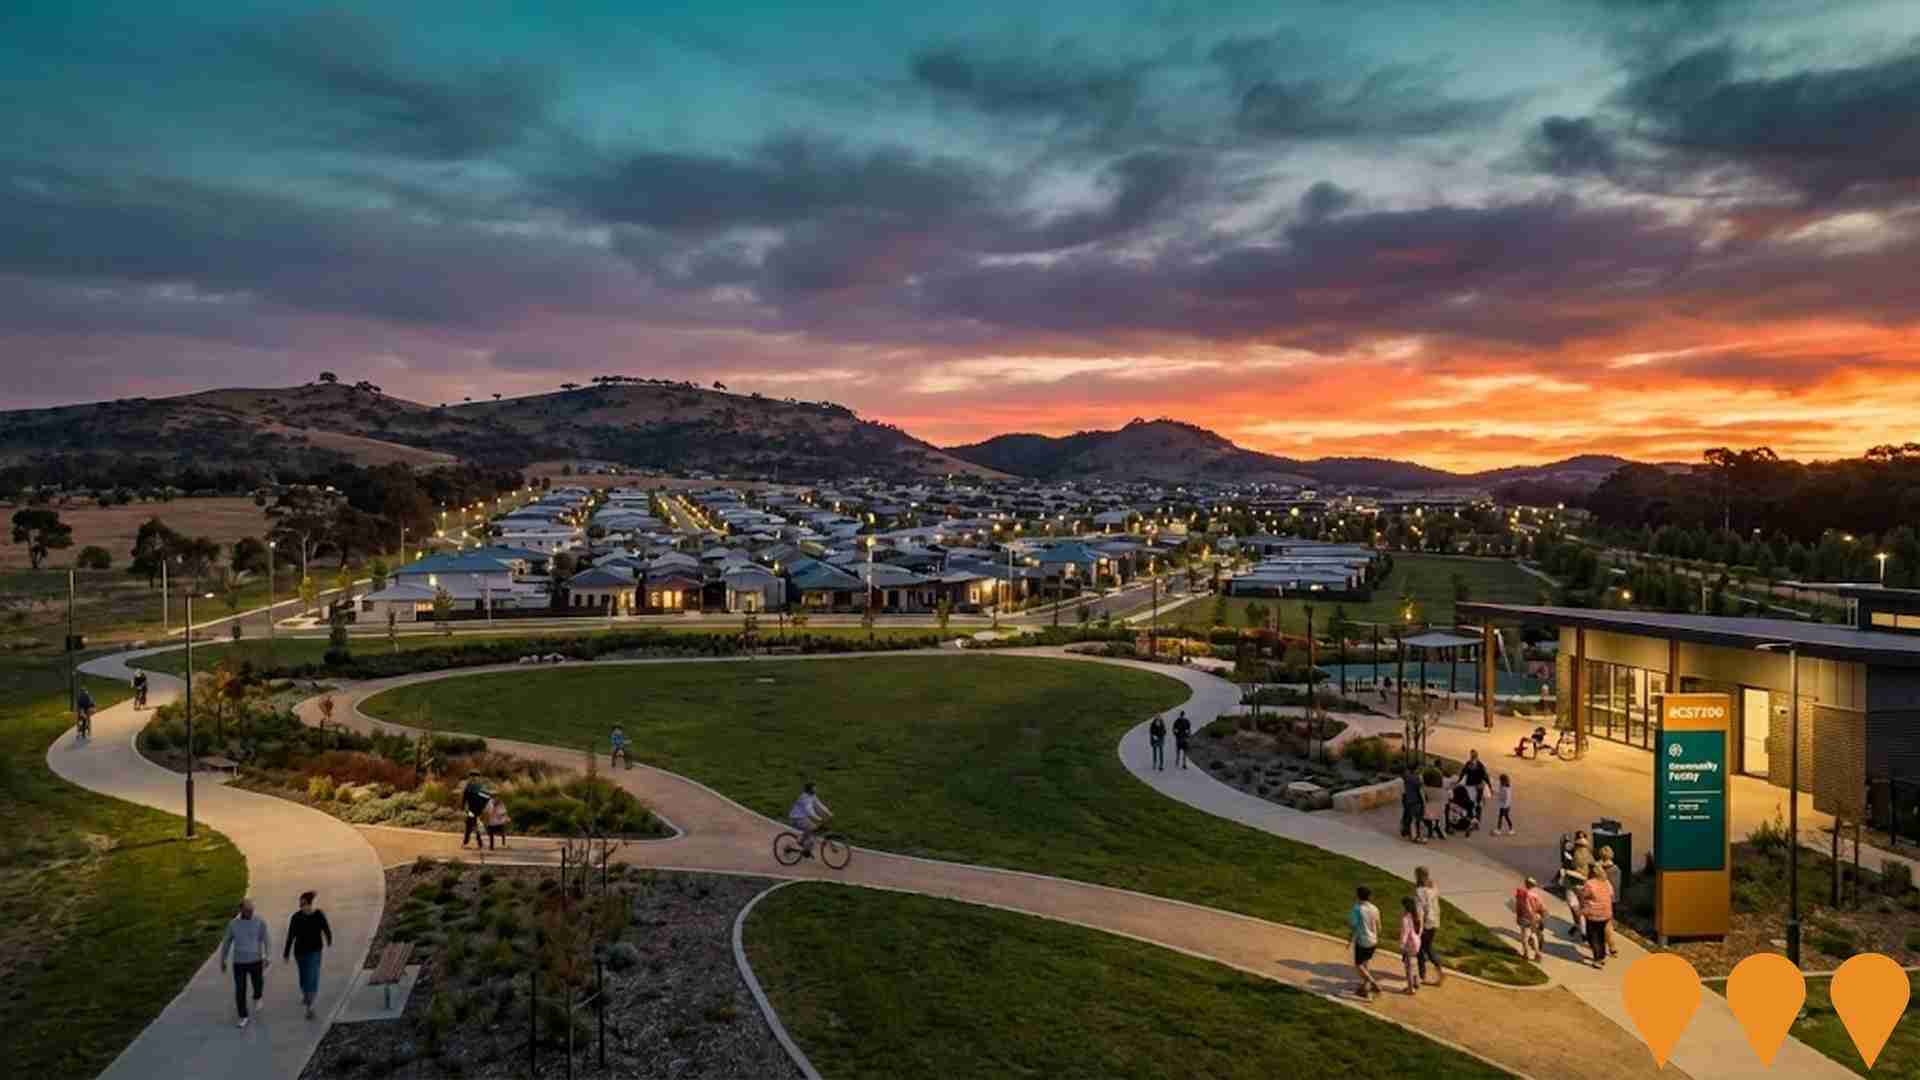
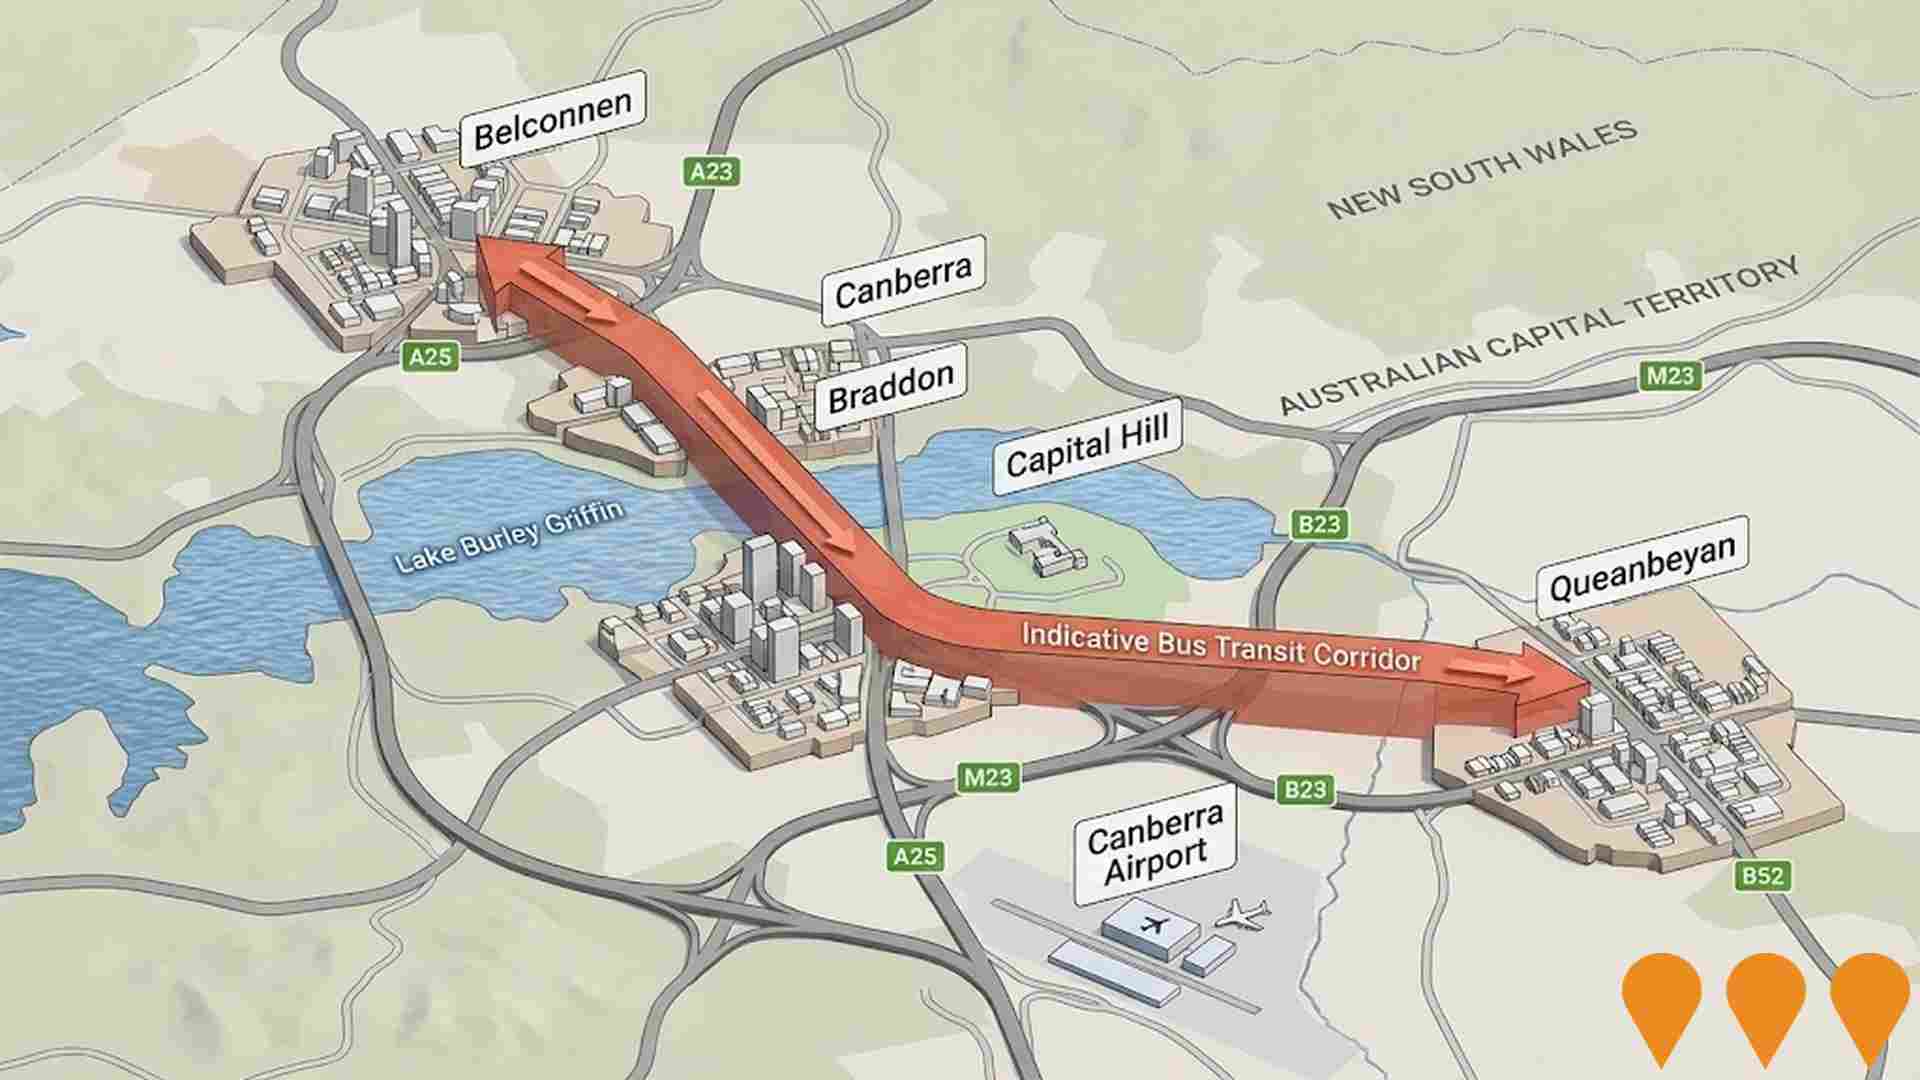
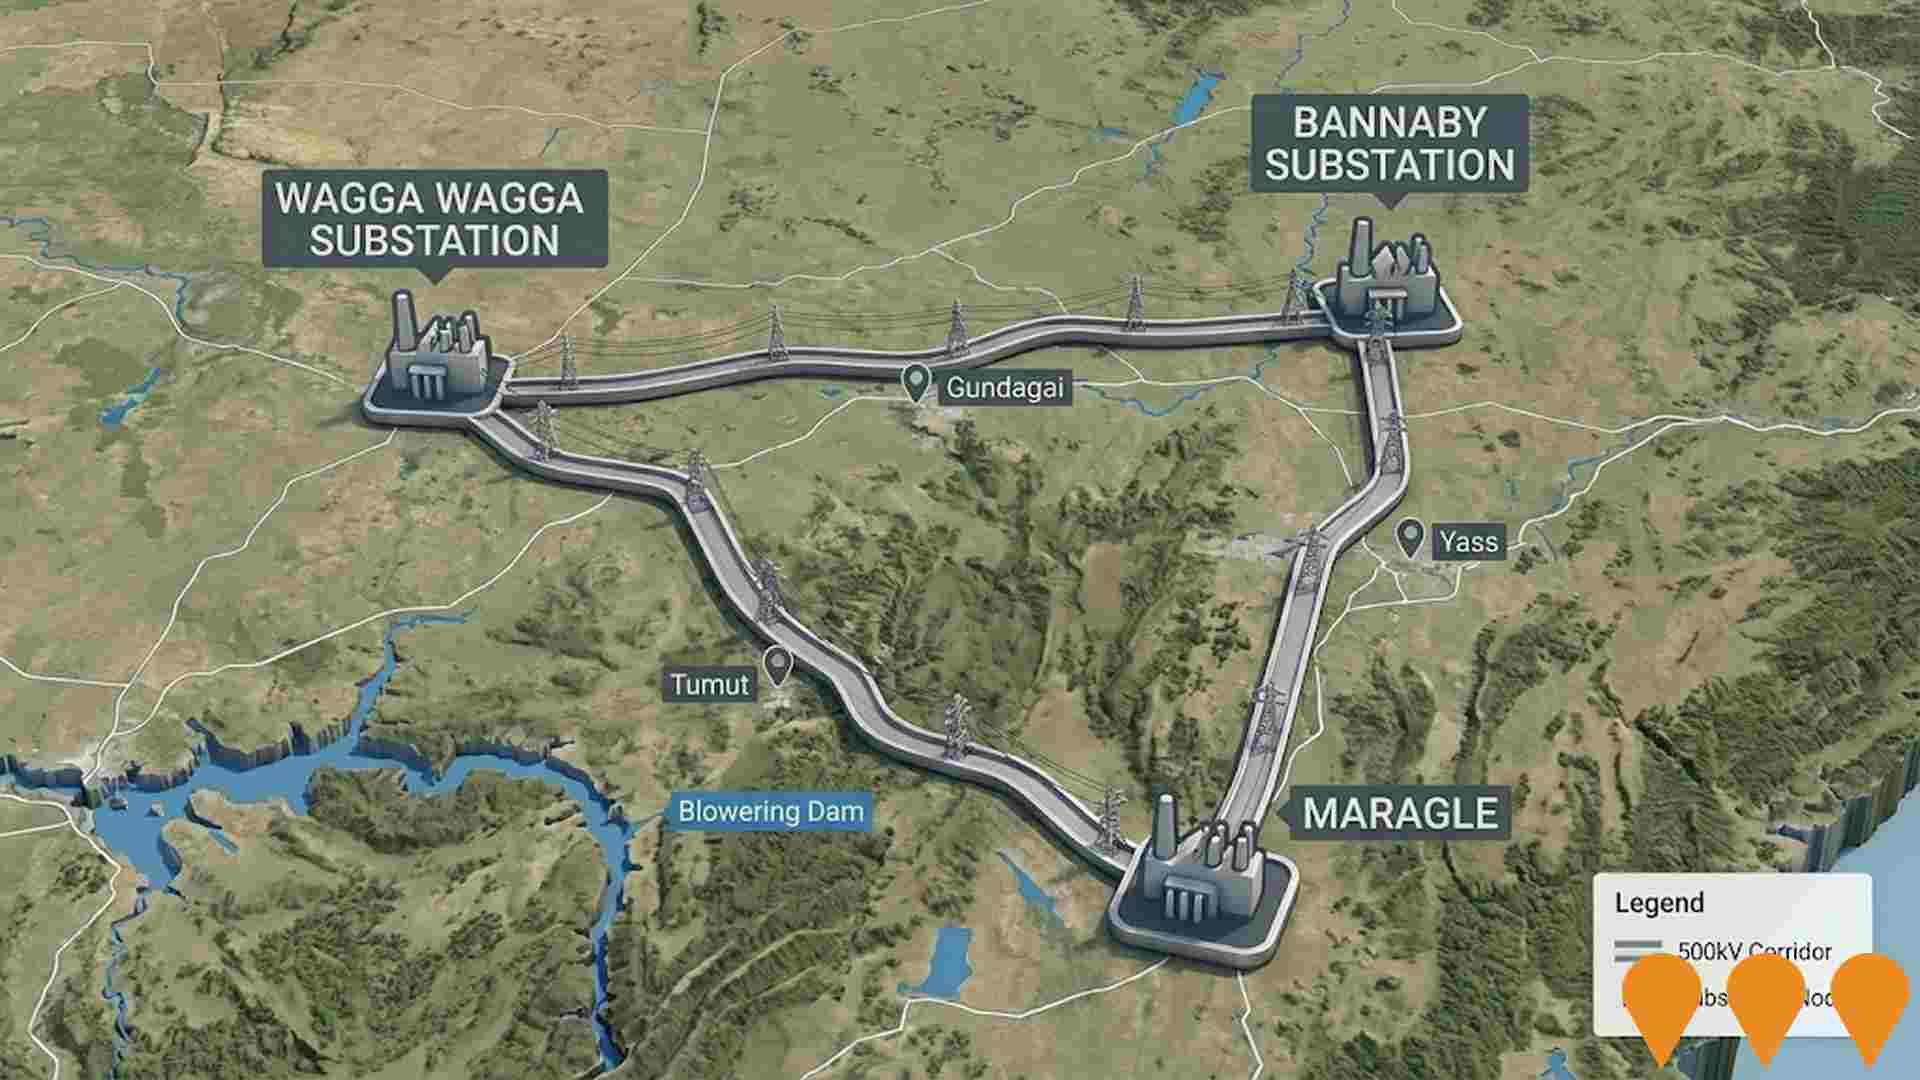
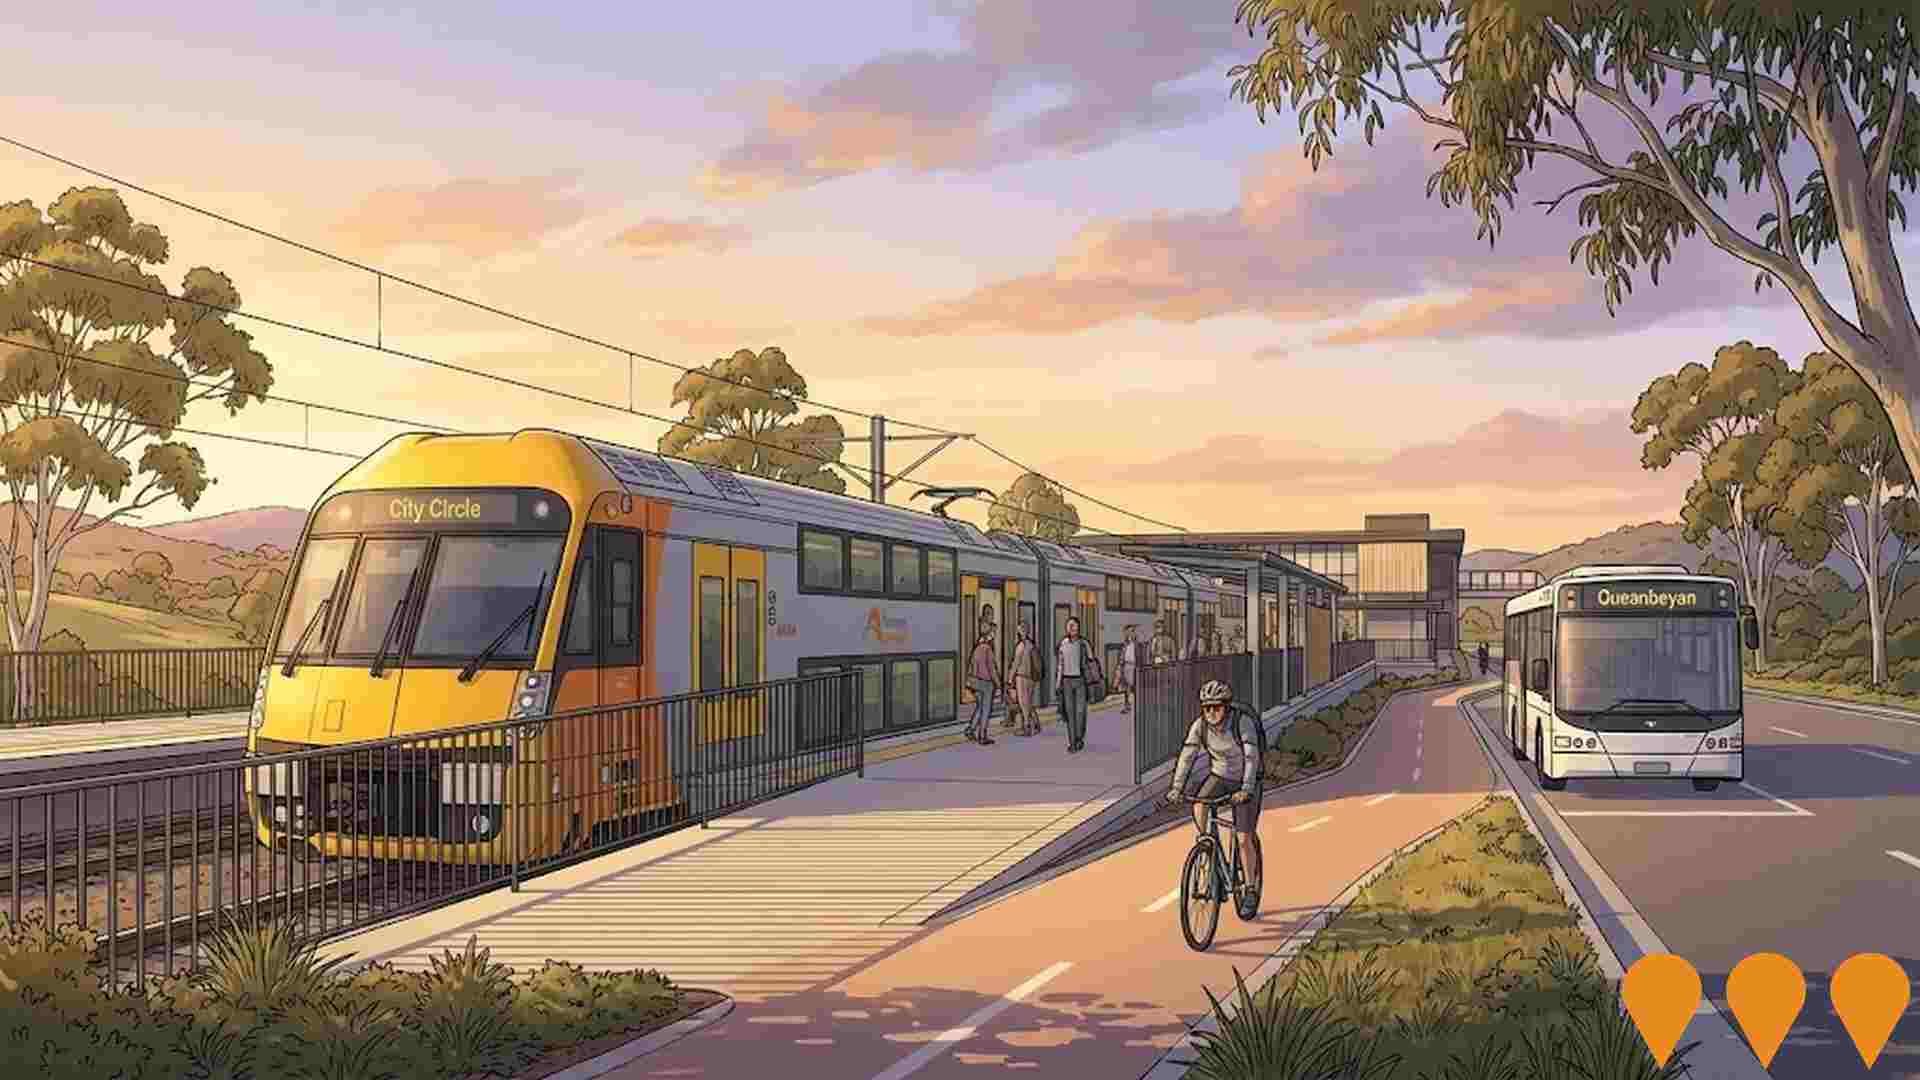
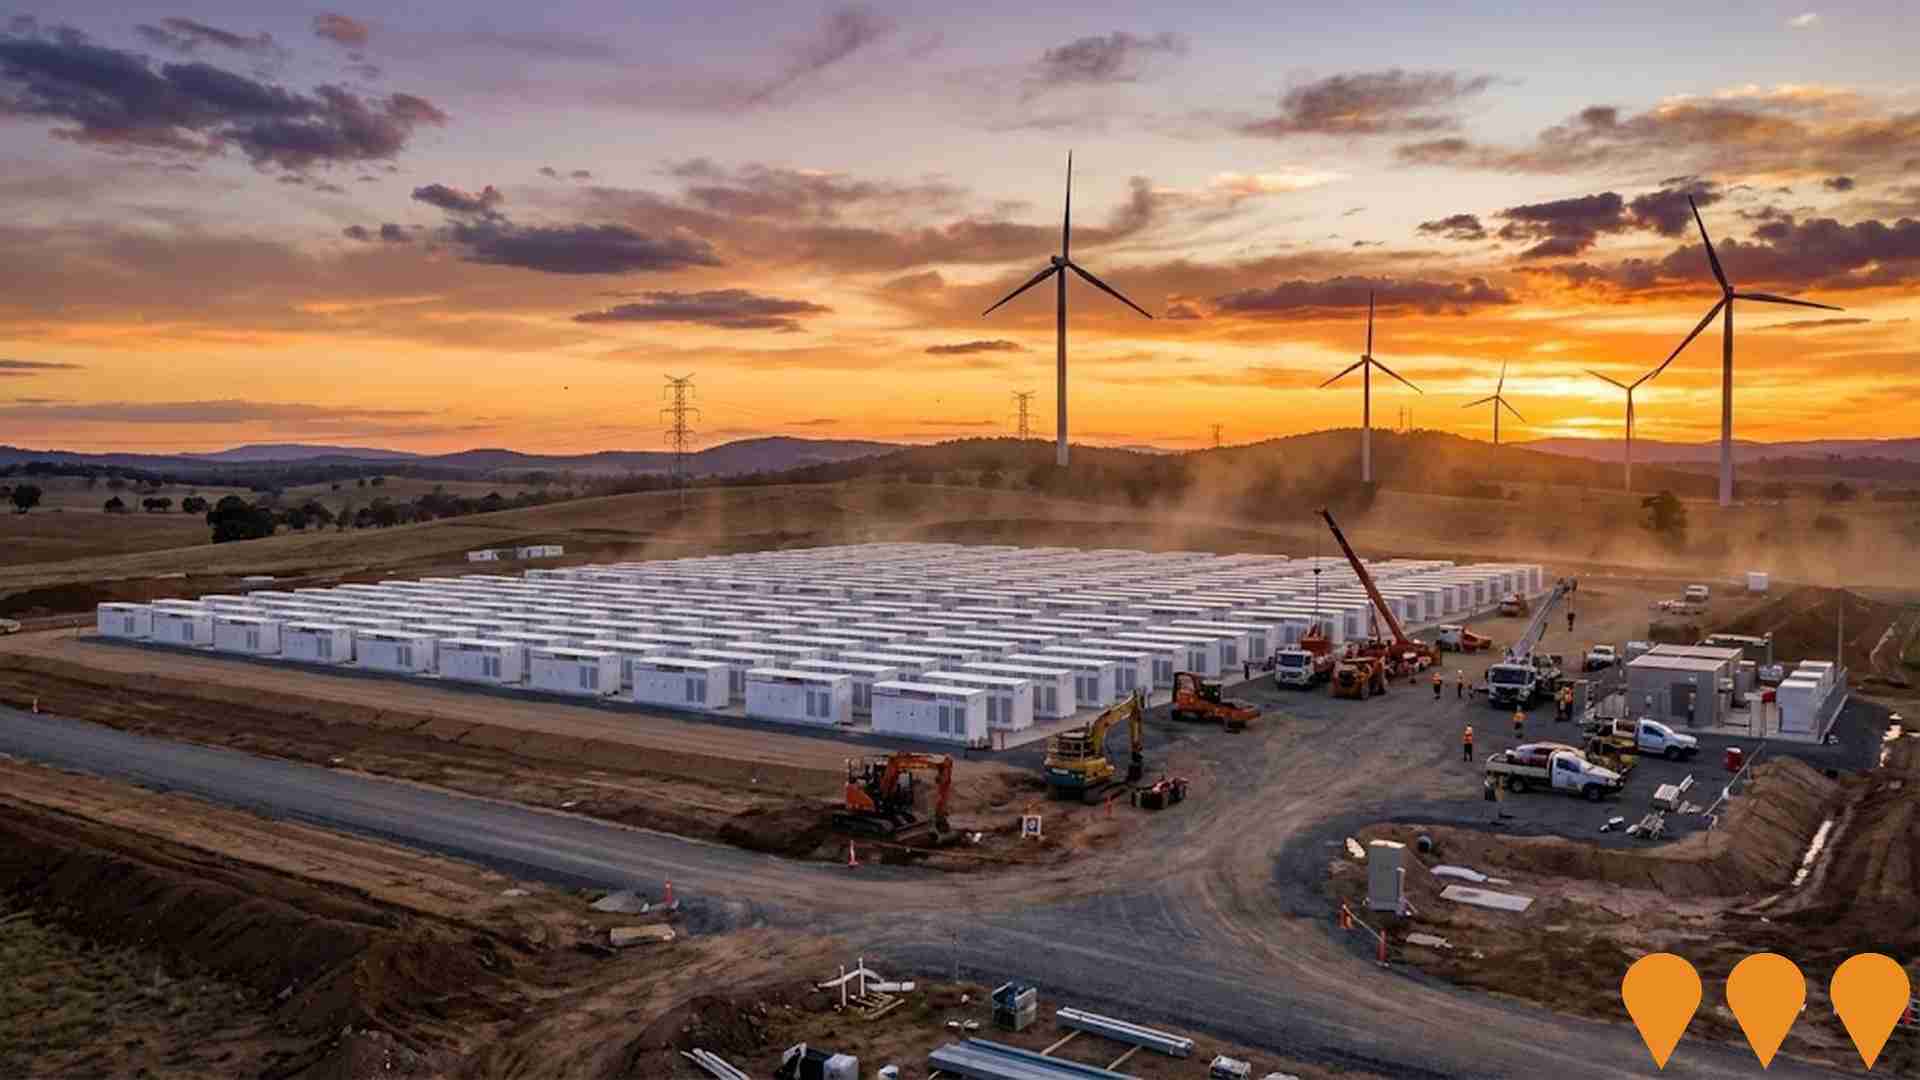
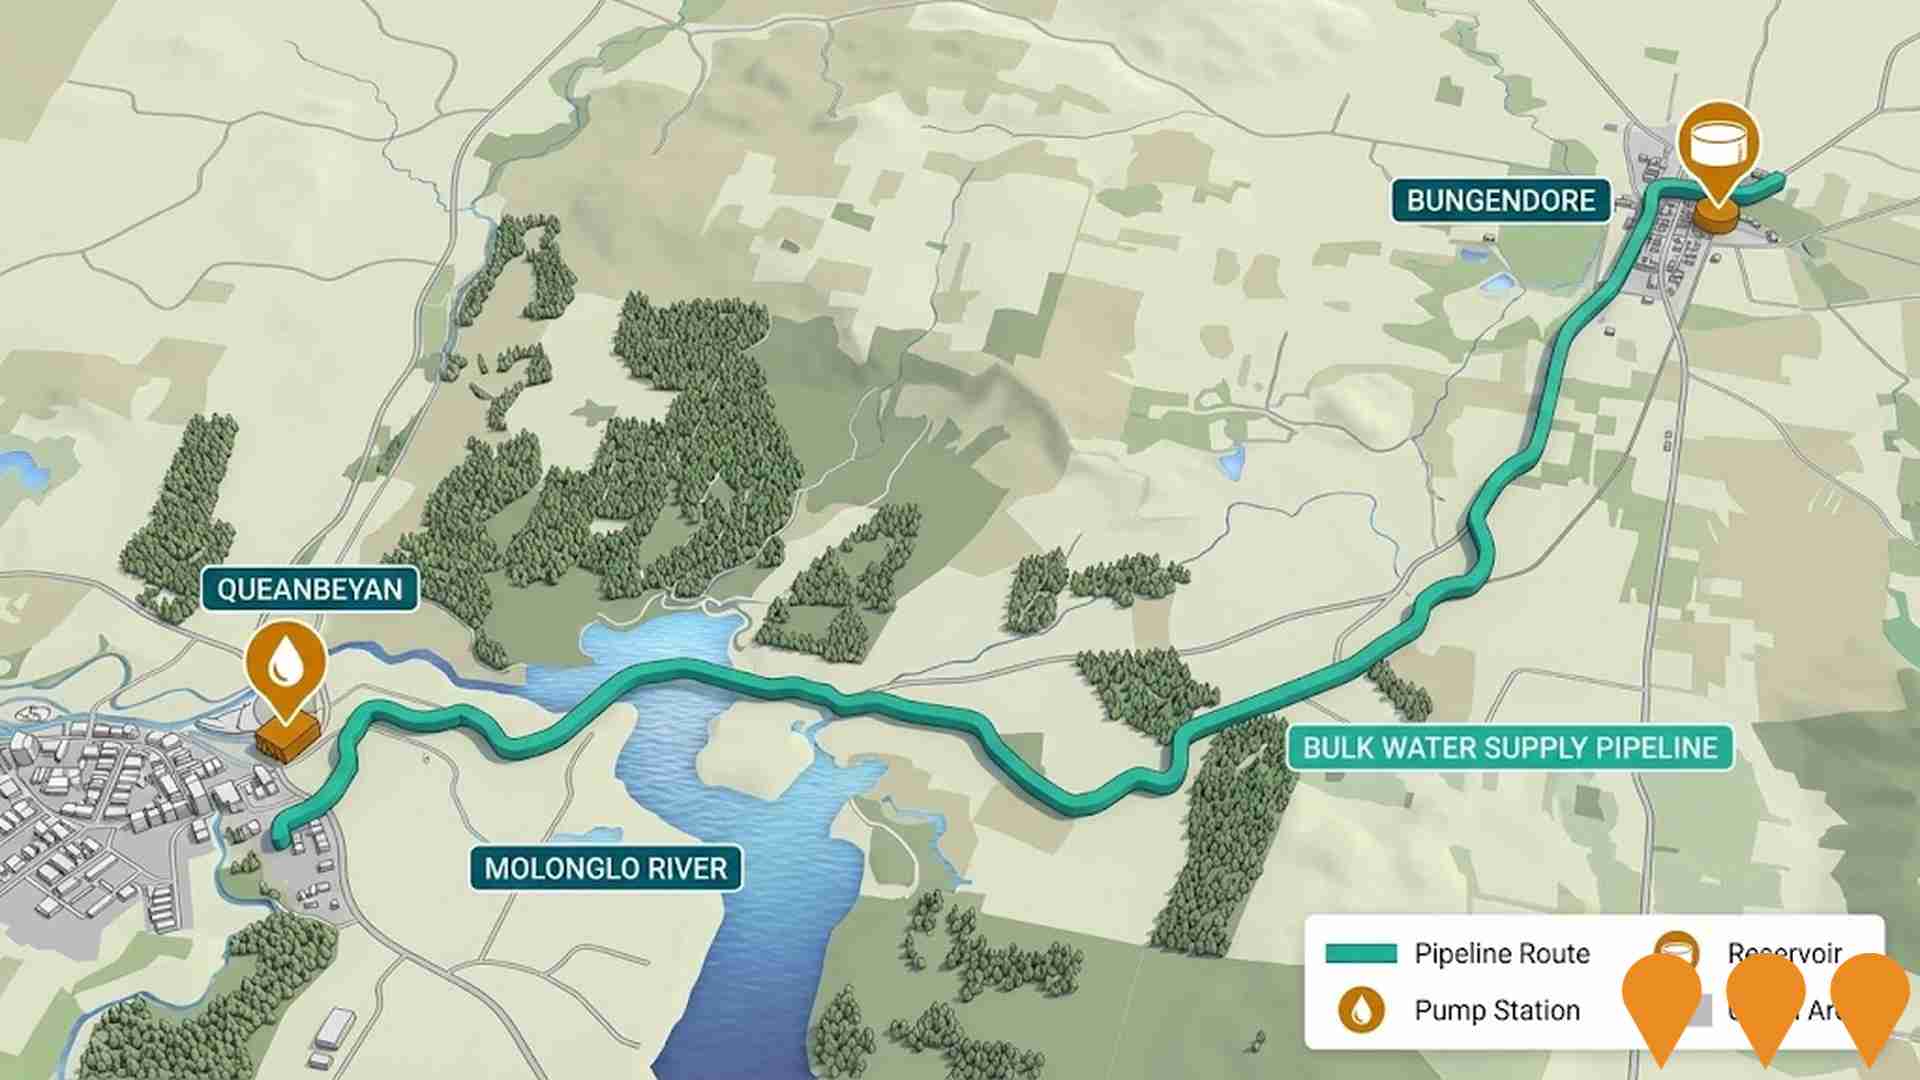
 Denotes AI-based impression for illustrative purposes only, not to be taken as definitive under any circumstances. Please follow links and conduct other investigations from the project's source for actual imagery. Developers and project owners wishing us to use original imagery please Contact Us and we will do so.
Frequently Asked Questions - Infrastructure
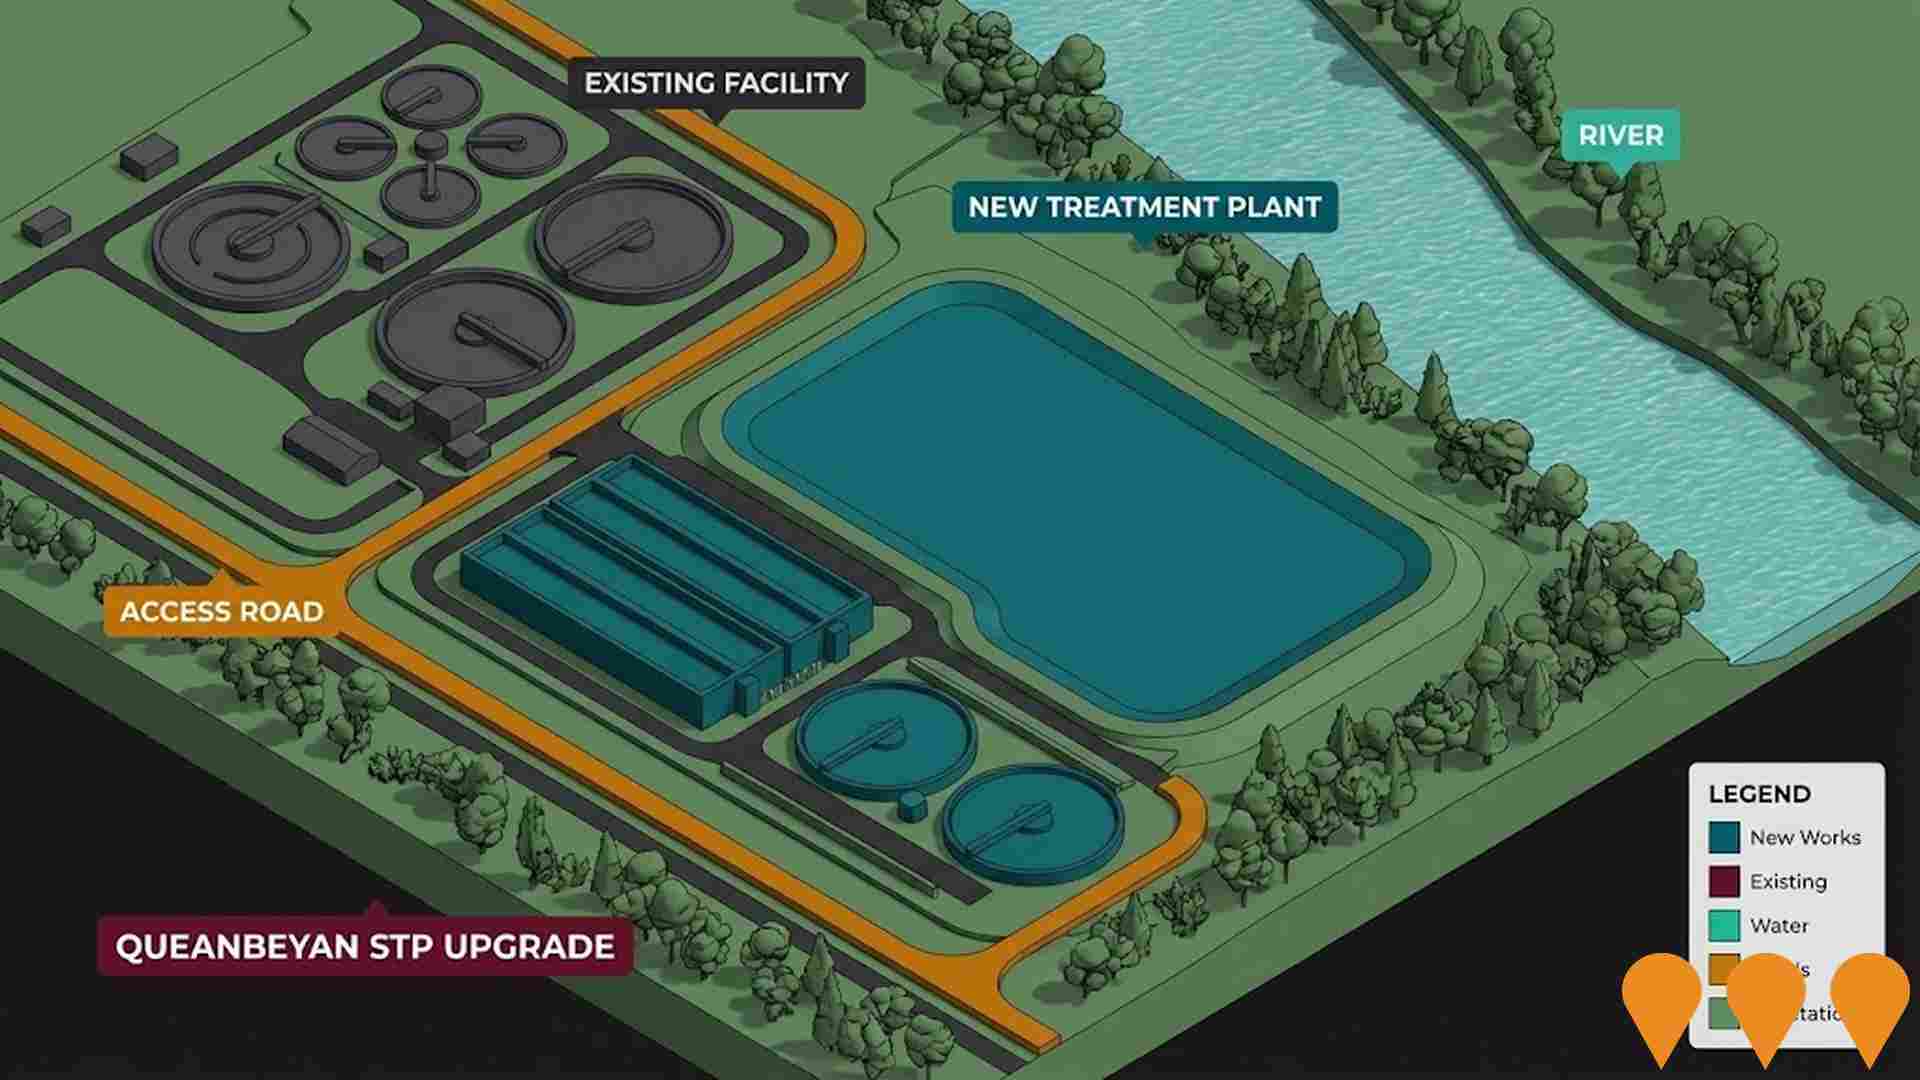
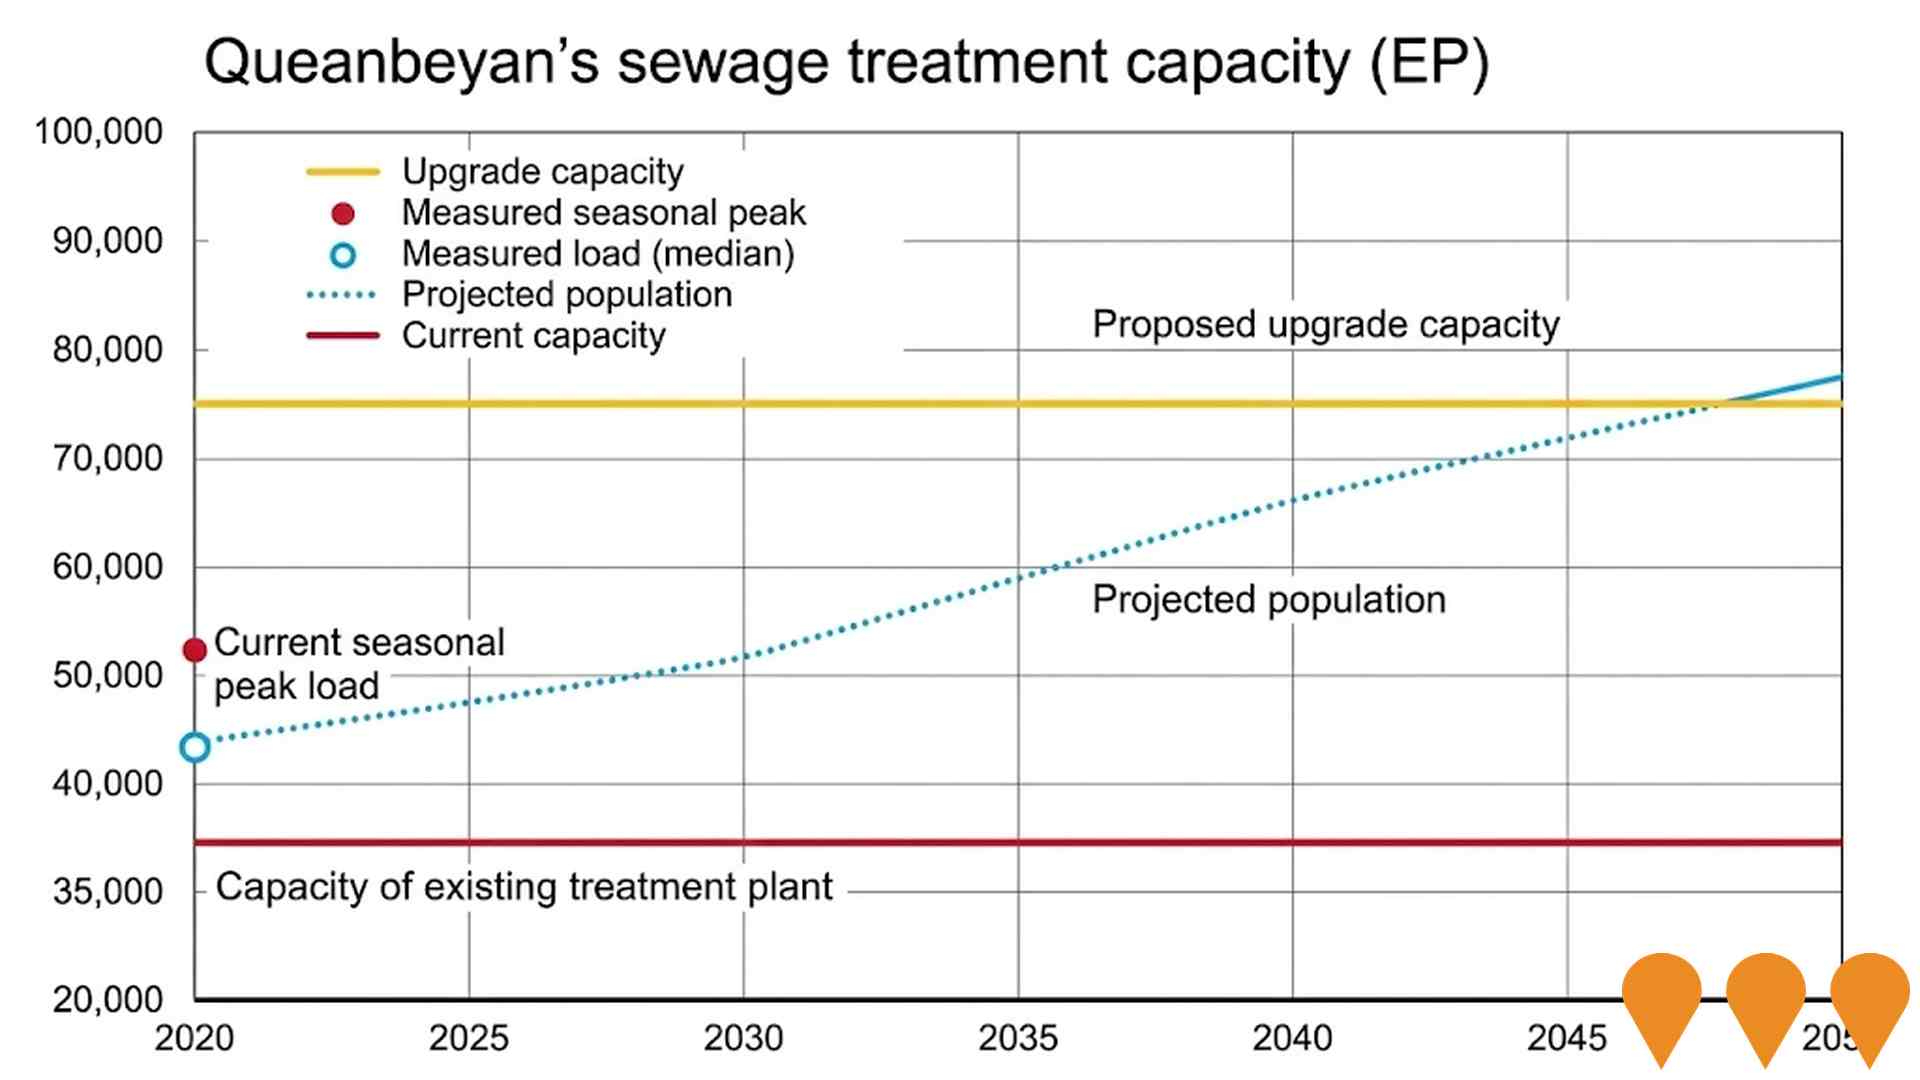
Queanbeyan Sewage Treatment Plant Upgrade
The project involves replacing the existing sewage treatment plant, which is nearing the end of its service life and is currently overloaded, with a new modern facility. The upgrade will increase the treatment capacity to service 75,000 equivalent people (EP), with the potential for future expansion to 112,500 EP. The new plant will feature an advanced treatment process including biological nutrient removal, tertiary filtration, and UV disinfection, which will improve the quality of treated effluent discharged into the Molonglo River. A development application for the project was lodged with the ACT Government on December 7, 2023.
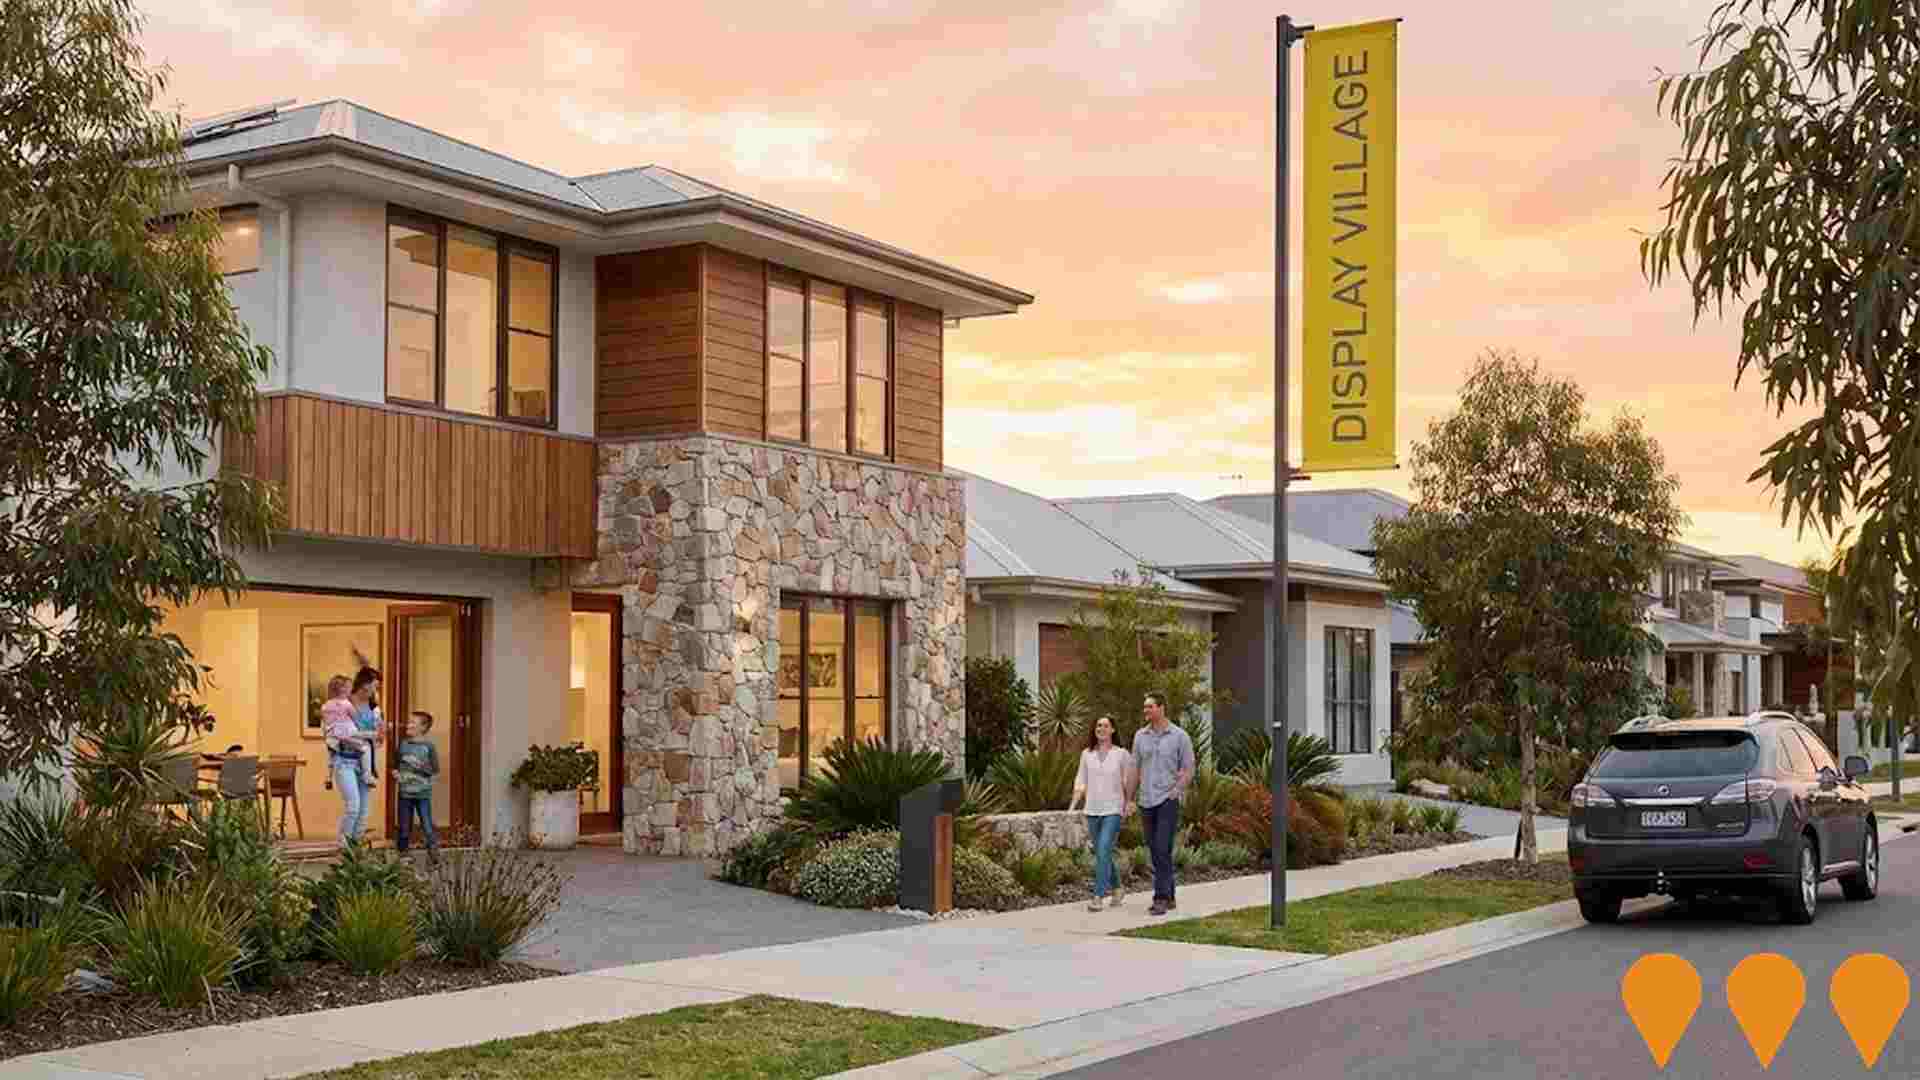
Googong Township
Large-scale masterplanned township development on the NSW/ACT border (Queanbeyan-Palerang LGA), 16 km south-east of Canberra. Joint venture between Mirvac and Peet. When complete (c.2038) will deliver 6,200 dwellings for approx. 18,000 residents across five neighbourhoods. As of mid-2025 the township has over 9,000 residents and more than 3,200 homes occupied. Features a fully integrated water recycling system (IWC), 5-Star Green Star Communities rating, town centre with Coles and specialty retail, two primary schools (Anglican School Googong and The Anglican School Googong Early Learning Centre), community centre, sports facilities, 280 ha of open space and extensive walking/cycling trails.
South Jerrabomberra Urban Release Area
A master-planned urban development featuring approximately 1500 residential dwellings, business parks, industrial estates, innovation precincts, regional sports complex, intermodal transport hub, new high school, and community amenities including parks, sports facilities, and retail spaces to create a sustainable community on the NSW-ACT border.
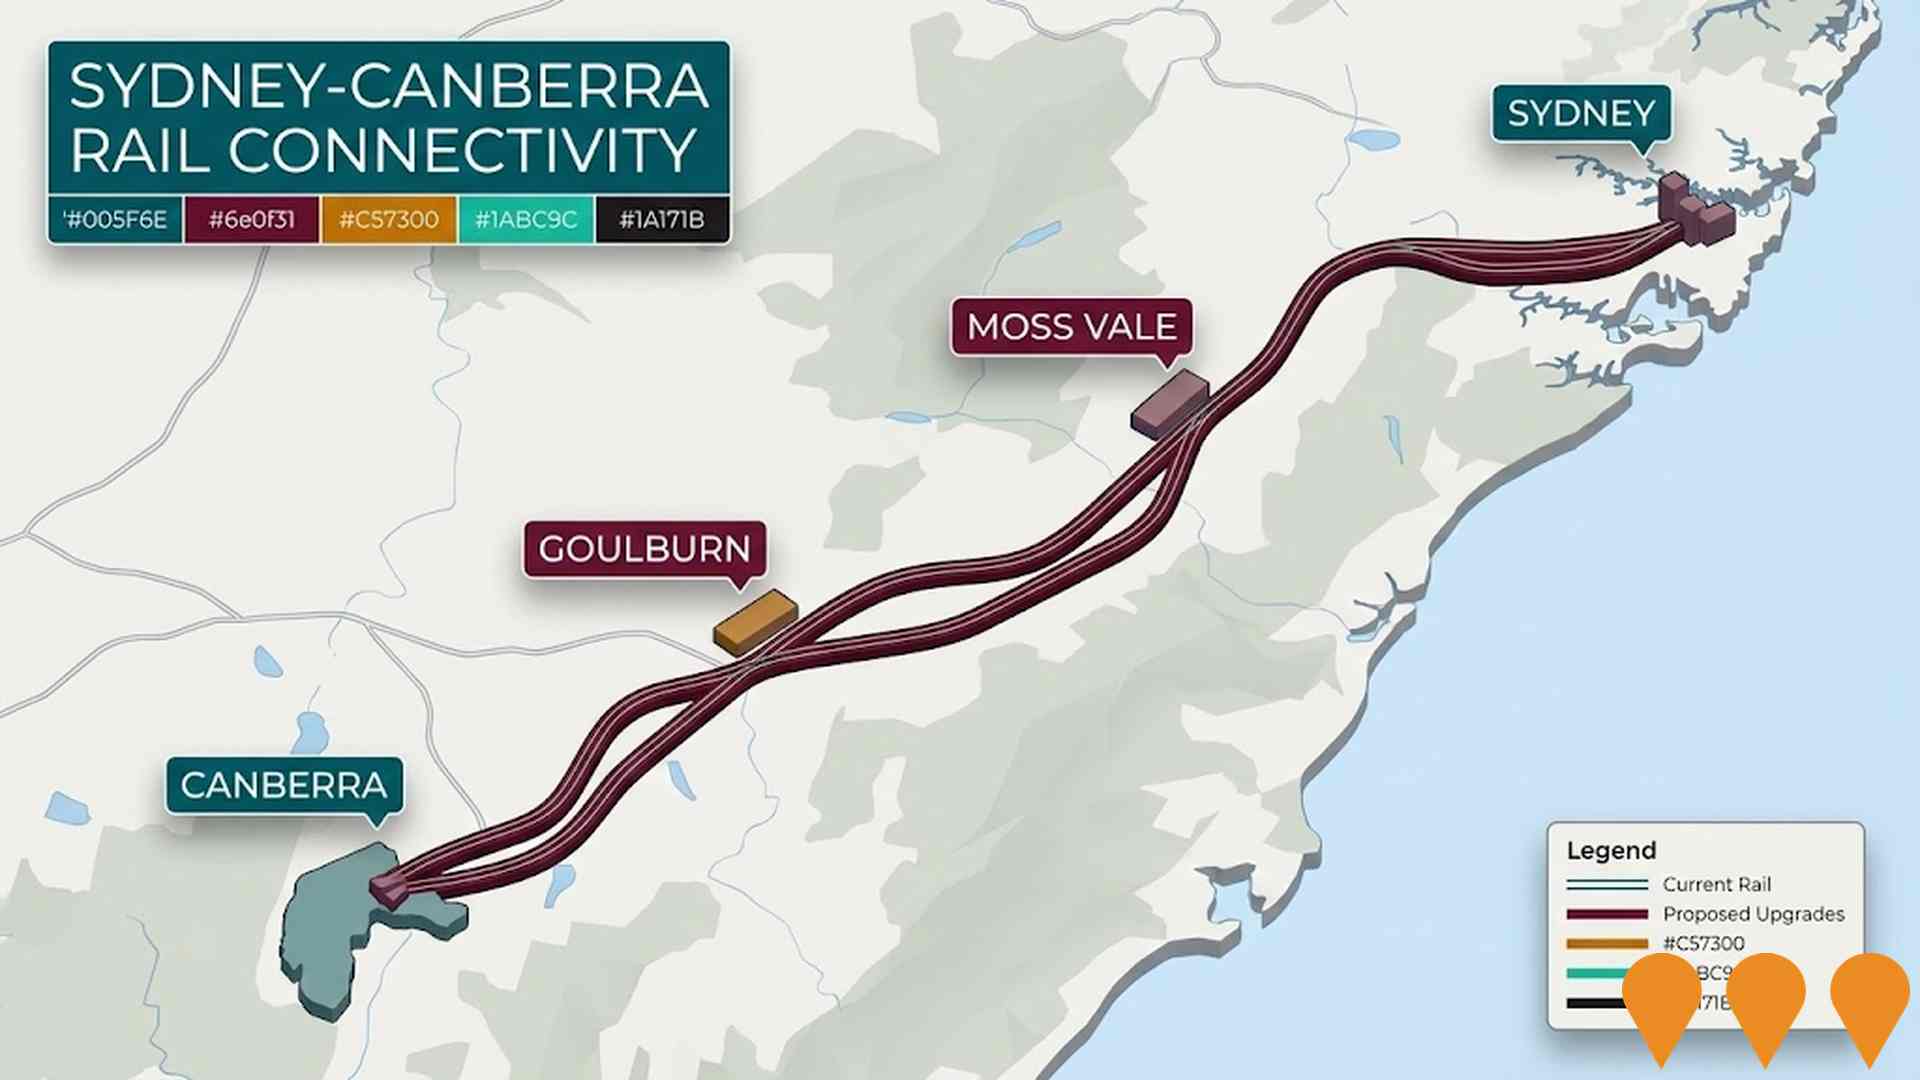
Enhanced bus and light rail corridors (Belconnen & Queanbeyan to Central Canberra)
ACT is progressing an integrated program to enhance high-frequency bus and future light rail corridors that link Belconnen and Queanbeyan with central Canberra. Light Rail Stage 2A (City to Commonwealth Park) commenced construction in early 2025 with services targeted from 2028, while planning and approvals continue for Stage 2B to Woden. The ACT Government has acknowledged and is planning upgrades for the Belconnen-to-City bus corridor as groundwork for a future east-west light rail Stage 3, and is coordinating cross-border public transport initiatives with NSW through the Queanbeyan Region Integrated Transport Plan and the ACT-NSW MoU for Regional Collaboration.
HumeLink
HumeLink is a new 500kV transmission line project connecting Wagga Wagga, Bannaby, and Maragle, spanning approximately 365 km. It includes new or upgraded infrastructure at four locations and aims to enhance the reliability and sustainability of the national electricity grid by increasing the integration of renewable energy sources such as wind and solar.
Queanbeyan Regional Integrated Transport Plan
Comprehensive transport planning initiative with 64 key actions for next 10 years. Addresses road safety, active transport connectivity, public transport availability, and future transport needs. Improved connections between Queanbeyan and ACT.
Big Canberra Battery (Williamsdale BESS)
A 250 MW / 500 MWh battery energy storage system at Williamsdale in southern Canberra, delivered by Eku Energy as Stream 1 of the ACT Government's Big Canberra Battery. Construction commenced in November 2024 with partners CPP and Tesla supplying Megapack systems. The asset will connect to Evoenergy's 132 kV network near the Williamsdale substation to provide two hours of dispatchable power, grid services and reliability for the ACT. Target operations in 2026.
Queanbeyan to Bungendore Bulk Water Supply Pipeline
Major water infrastructure project to improve water security and supply reliability between Queanbeyan and Bungendore. Council progressing to tender-ready status.
Employment
Employment performance in Karabar exceeds national averages across key labour market indicators
Karabar has a skilled workforce with an unemployment rate of 2.9% as of September 2025. It has 4,624 residents in work, which is below the Rest of NSW's rate of 3.8%.
The workforce participation rate is higher at 65.4%, compared to Rest of NSW's 56.4%. Major employment industries include public administration & safety, construction, and health care & social assistance. Karabar specializes in public administration & safety, with an employment share 3.1 times the regional level. However, health care & social assistance is under-represented, at 10.3% compared to Rest of NSW's 16.9%.
Over the year to September 2025, labour force levels decreased by 5.5%, and employment fell by 5.8%, leading to a rise in unemployment rate by 0.3 percentage points. In contrast, Rest of NSW saw employment contract by 0.5% and unemployment rise by 0.4 percentage points. State-wide, as of 25-Nov, NSW employment contracted by 0.03% (losing 2,260 jobs), with an unemployment rate of 3.9%. Nationally, the unemployment rate is 4.3%. Jobs and Skills Australia's forecasts suggest national employment will expand by 6.6% over five years and 13.7% over ten years. Applying these projections to Karabar's employment mix indicates local employment should increase by 6.1% over five years and 12.6% over ten years.
Frequently Asked Questions - Employment
Income
The area exhibits notably strong income performance, ranking higher than 70% of areas assessed nationally through AreaSearch analysis
The Karabar SA2 has a median taxpayer income of $56,730 and an average income of $66,789 according to the latest postcode level ATO data aggregated by AreaSearch for financial year 2022. This is slightly above the national average, contrasting with the Rest of NSW's median income of $49,459 and average income of $62,998. Based on a Wage Price Index growth rate of 12.61% since financial year 2022, current estimates would be approximately $63,884 (median) and $75,211 (average) as of September 2025. Census data indicates that household, family, and personal incomes in Karabar cluster around the 70th percentile nationally. The data shows that the $1,500 - $2,999 earnings band captures 33.6% of the community (2,841 individuals), which is consistent with broader trends across the broader area showing 29.9% in the same category. After housing costs, 85.6% of income remains for other expenses. The area's SEIFA income ranking places it in the 5th decile.
Frequently Asked Questions - Income
Housing
Karabar is characterized by a predominantly suburban housing profile, with above-average rates of outright home ownership
Karabar's dwelling structures, as per the latest Census, consisted of 80.4% houses and 19.6% other dwellings (semi-detached, apartments, 'other' dwellings), compared to Non-Metro NSW's 74.5% houses and 25.5% other dwellings. Home ownership in Karabar was at 29.8%, similar to Non-Metro NSW, with mortgaged dwellings at 41.0% and rented ones at 29.2%. The median monthly mortgage repayment was $1,950, lower than Non-Metro NSW's average of $2,167. The median weekly rent in Karabar was $350, slightly higher than the national figure of $375 but lower than Non-Metro NSW's $355. Nationally, Karabar's mortgage repayments were higher than the Australian average of $1,863.
Frequently Asked Questions - Housing
Household Composition
Karabar has a typical household mix, with a fairly typical median household size
Family households account for 73.2 percent of all households, including 33.0 percent couples with children, 24.6 percent couples without children, and 14.2 percent single parent families. Non-family households constitute the remaining 26.8 percent, with lone person households at 24.6 percent and group households comprising 2.2 percent of the total. The median household size is 2.6 people, which aligns with the average for the Rest of NSW.
Frequently Asked Questions - Households
Local Schools & Education
Educational outcomes in Karabar fall within the lower quartile nationally, indicating opportunities for improvement in qualification attainment
The area's university qualification rate is 20.2%, significantly lower than the NSW average of 32.2%. Bachelor degrees are most common at 12.4%, followed by postgraduate qualifications (5.4%) and graduate diplomas (2.4%). Trade and technical skills are prominent, with 37.0% of residents aged 15+ holding vocational credentials - advanced diplomas (10.7%) and certificates (26.3%). Educational participation is high at 29.0%, including primary education (10.4%), secondary education (8.0%), and tertiary education (4.1%).
Educational participation is notably high, with 29.0% of residents currently enrolled in formal education. This includes 10.4% in primary education, 8.0% in secondary education, and 4.1% pursuing tertiary education.
Frequently Asked Questions - Education
Schools Detail
Nearby Services & Amenities
Transport
Transport servicing is moderate compared to other areas nationally based on assessment of service frequency, route connectivity and accessibility
Kabarar has 43 active public transport stops, all of which are bus stops. These stops are served by 42 different routes that together offer 607 weekly passenger trips. The accessibility of these services is rated as excellent, with residents typically living just 149 meters away from the nearest stop.
On average, there are 86 trips per day across all routes, which works out to approximately 14 weekly trips per individual stop.
Frequently Asked Questions - Transport
Transport Stops Detail
Health
Health performance in Karabar is lower than average with common health conditions somewhat prevalent across both younger and older age cohorts
Karabar faces significant health challenges, with common health conditions prevalent across both younger and older age cohorts. The rate of private health cover is approximately 52% of the total population (~4,430 people), which compares to 61.0% across Rest of NSW.
Mental health issues impact 9.5% of residents, while arthritis impacts 9.2%. A total of 65.3% of residents declare themselves completely clear of medical ailments, compared to 68.7% across Rest of NSW. The area has 15.6% of residents aged 65 and over (1,317 people), which is higher than the 13.4% in Rest of NSW. Health outcomes among seniors present some challenges, broadly in line with the general population's health profile.
Frequently Asked Questions - Health
Cultural Diversity
In terms of cultural diversity, Karabar records figures broadly comparable to the national average, as found in AreaSearch's assessment of a number of language and cultural background related metrics
Karabar's cultural diversity was above average, with 18.5% of its population born overseas and 15.4% speaking a language other than English at home. Christianity was the predominant religion in Karabar, making up 57.0% of people, compared to 52.1% across Rest of NSW. The top three ancestry groups were Australian (27.7%), English (23.6%), and Irish (7.7%).
Notably, Macedonian (3.2%) was overrepresented in Karabar compared to the regional average of 1.5%. Similarly, Serbian (0.9%) and Croatian (1.2%) groups were also more prevalent than their respective regional averages of 0.6% and 0.9%.
Frequently Asked Questions - Diversity
Age
Karabar's population is slightly younger than the national pattern
Karabar has a median age of 38, which is lower than the Rest of NSW figure of 43 but equivalent to the national norm of 38. The age group of 25-34 shows strong representation in Karabar at 16.2%, compared to the Rest of NSW figure. Conversely, the 65-74 cohort is less prevalent in Karabar at 8.7%. According to the 2021 Census, the population aged 35 to 44 has grown from 13.3% to 14.8%, while the 25 to 34 age group increased from 14.9% to 16.2%. However, the 45 to 54 cohort has declined from 13.5% to 12.2%, and the 5 to 14 age group dropped from 12.8% to 11.5%. Demographic modeling suggests that Karabar's age profile will significantly change by 2041. Leading this demographic shift, the 85+ population is projected to grow by 64%, reaching 235 people from the current 142. The aging population trend is evident, with those aged 65 and above comprising 54% of the projected growth. Meanwhile, the 65 to 74 and 45 to 54 age groups are expected to experience population declines.
