Chart Color Schemes
This analysis uses ABS Statistical Areas Level 2 (SA2) boundaries, which can materially differ from Suburbs and Localities (SAL) even when sharing similar names.
SA2 boundaries are defined by the Australian Bureau of Statistics and are designed to represent communities for statistical reporting (e.g., census and ERP).
Suburbs and Localities (SAL) represent commonly-used suburb/locality names (postal-style areas) and may use different geographic boundaries. For comprehensive analysis, consider reviewing both boundary types if available.
est. as @ -- *
ABS ERP | -- people | --
2021 Census | -- people
Sales Activity
Curious about local property values? Filter the chart to assess the volume and appreciation (including resales) trends and regional comparisons, or scroll to the map below view this information at an individual property level.
Find a Recent Sale
Sales Detail
Population
Population growth drivers in Queanbeyan are above average based on AreaSearch's ranking of recent, and medium to long-term trends
Queanbeyan's population is approximately 11,385 as of November 2025. This figure reflects an increase of 43 people since the 2021 Census, which recorded a population of 11,342. The change was inferred from the estimated resident population of 11,373 in June 2024 and an additional 54 validated new addresses since the Census date. This results in a population density ratio of 2,391 persons per square kilometer, placing Queanbeyan in the upper quartile relative to national locations assessed by AreaSearch. Overseas migration contributed approximately 73.4% of overall population gains during recent periods.
For projections, AreaSearch is adopting ABS/Geoscience Australia figures for each SA2 area, released in 2024 with a base year of 2022. For areas not covered by this data, AreaSearch uses NSW State Government's SA2 level projections released in 2022 with a base year of 2021. Growth rates by age group from these aggregations are applied to all areas for the years 2032 to 2041. Based on demographic trends and the latest annual ERP population numbers, Queanbeyan is forecast to increase its population by 3,295 persons to 2041, reflecting a gain of 28.8% in total over the 17 years.
Frequently Asked Questions - Population
Development
The level of residential development activity in Queanbeyan is very low in comparison to the average area assessed nationally by AreaSearch
Queanbeyan has averaged approximately 14 new dwelling approvals annually over the past five financial years, totalling 73 homes. As of FY26, 65 approvals have been recorded. The population decline in recent years has resulted in adequate housing supply relative to demand, creating a balanced market with good buyer choice. New properties are constructed at an average cost of $324,000.
This financial year has seen $30.7 million in commercial approvals, indicating robust local business investment. Compared to the Rest of NSW, Queanbeyan shows significantly reduced construction activity, 84.0% below the regional average per person. This limited new supply generally supports stronger demand and values for established properties. The area's development activity is also below the national average, suggesting its established nature and potential planning limitations. New developments consist of 50.0% detached houses and 50.0% attached dwellings, offering affordable entry pathways and attracting downsizers, investors, and first-time purchasers. With approximately 1400 people per dwelling approval, the market is well-established.
Population forecasts indicate Queanbeyan will gain 3,283 residents by 2041. If current construction levels persist, housing supply may lag population growth, potentially intensifying buyer competition and supporting price growth.
Frequently Asked Questions - Development
Infrastructure
Queanbeyan has moderate levels of nearby infrastructure activity, ranking in the 41stth percentile nationally
Changes to local infrastructure significantly impact an area's performance. AreaSearch has identified ten projects likely influencing this region. Notable ones are Spotlight Queanbeyan Retail Redevelopment, Yass Road upgrade, Bungendore Road and Ellerton Drive intersection upgrade, Queanbeyan East Public Preschool, and 202 Crawford Street Apartments. The following list details those most relevant.
Professional plan users can use the search below to filter and access additional projects.
INFRASTRUCTURE SEARCH
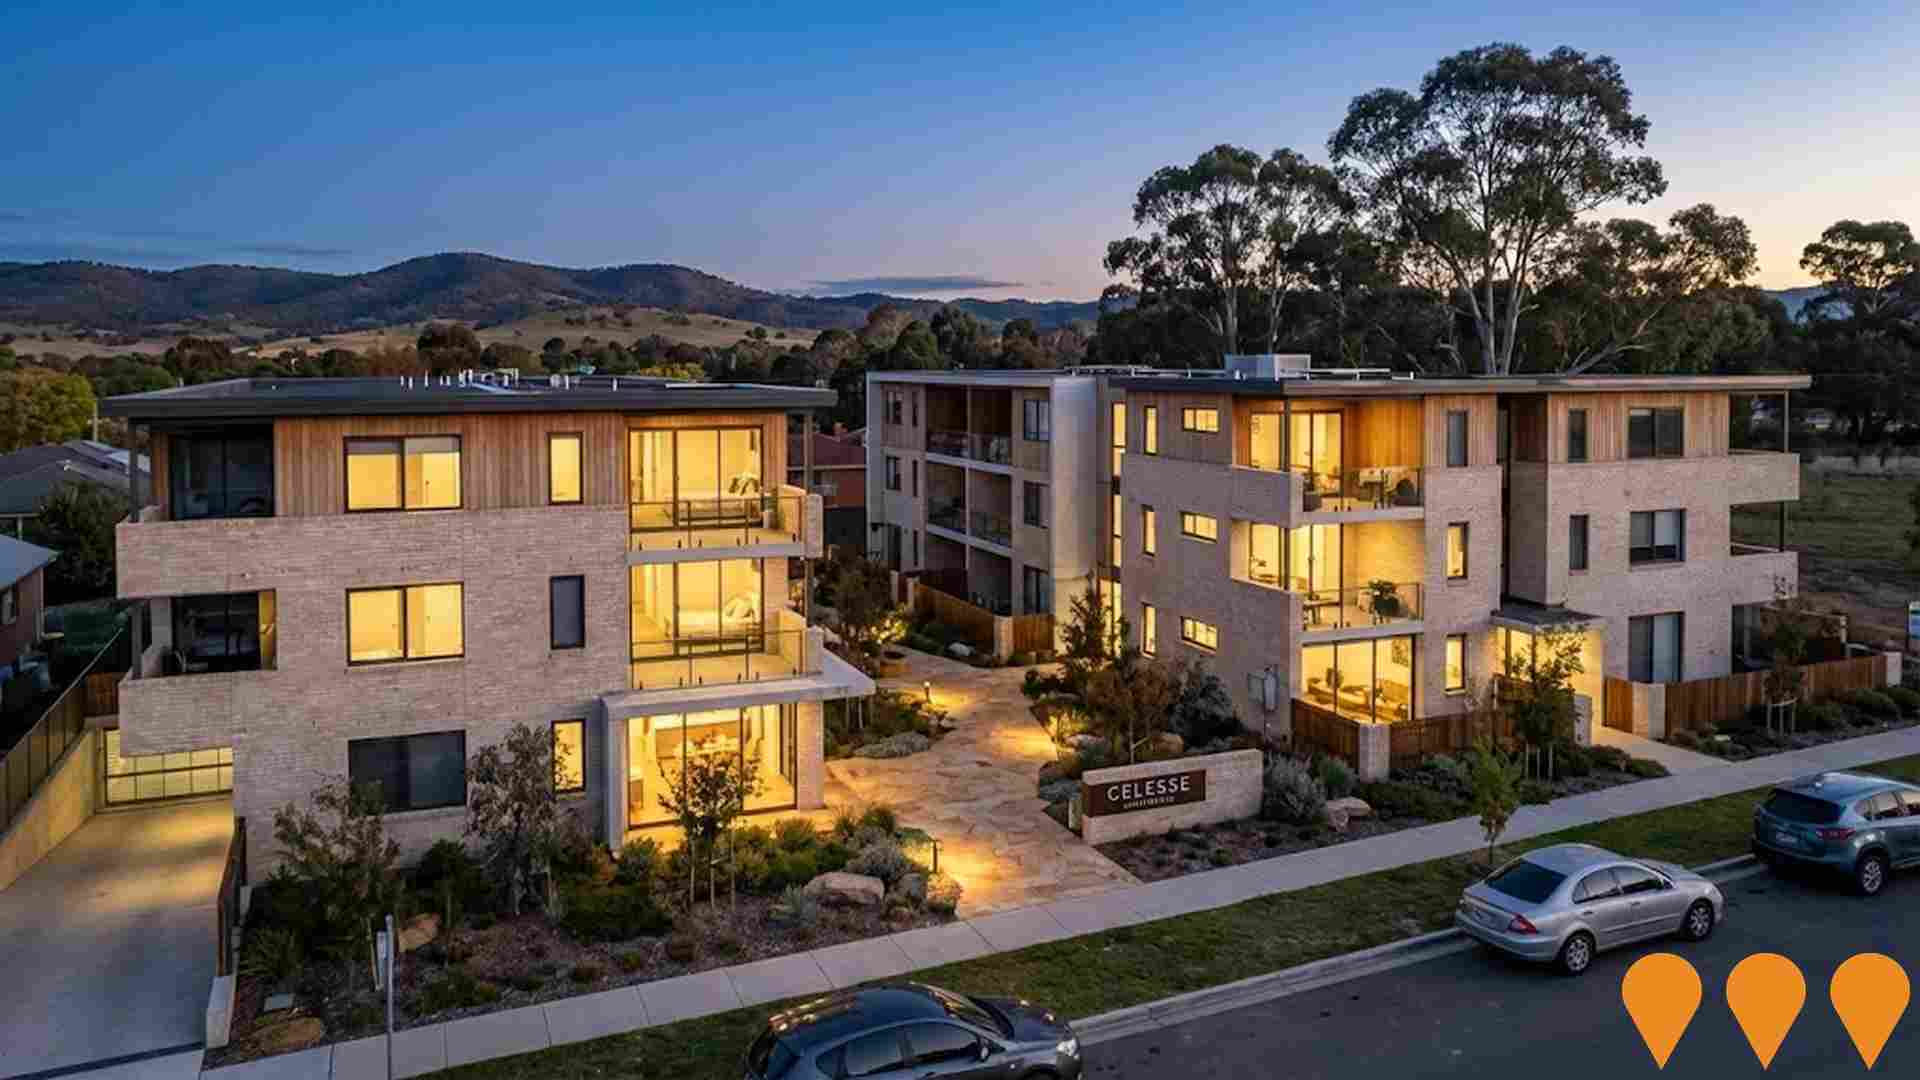
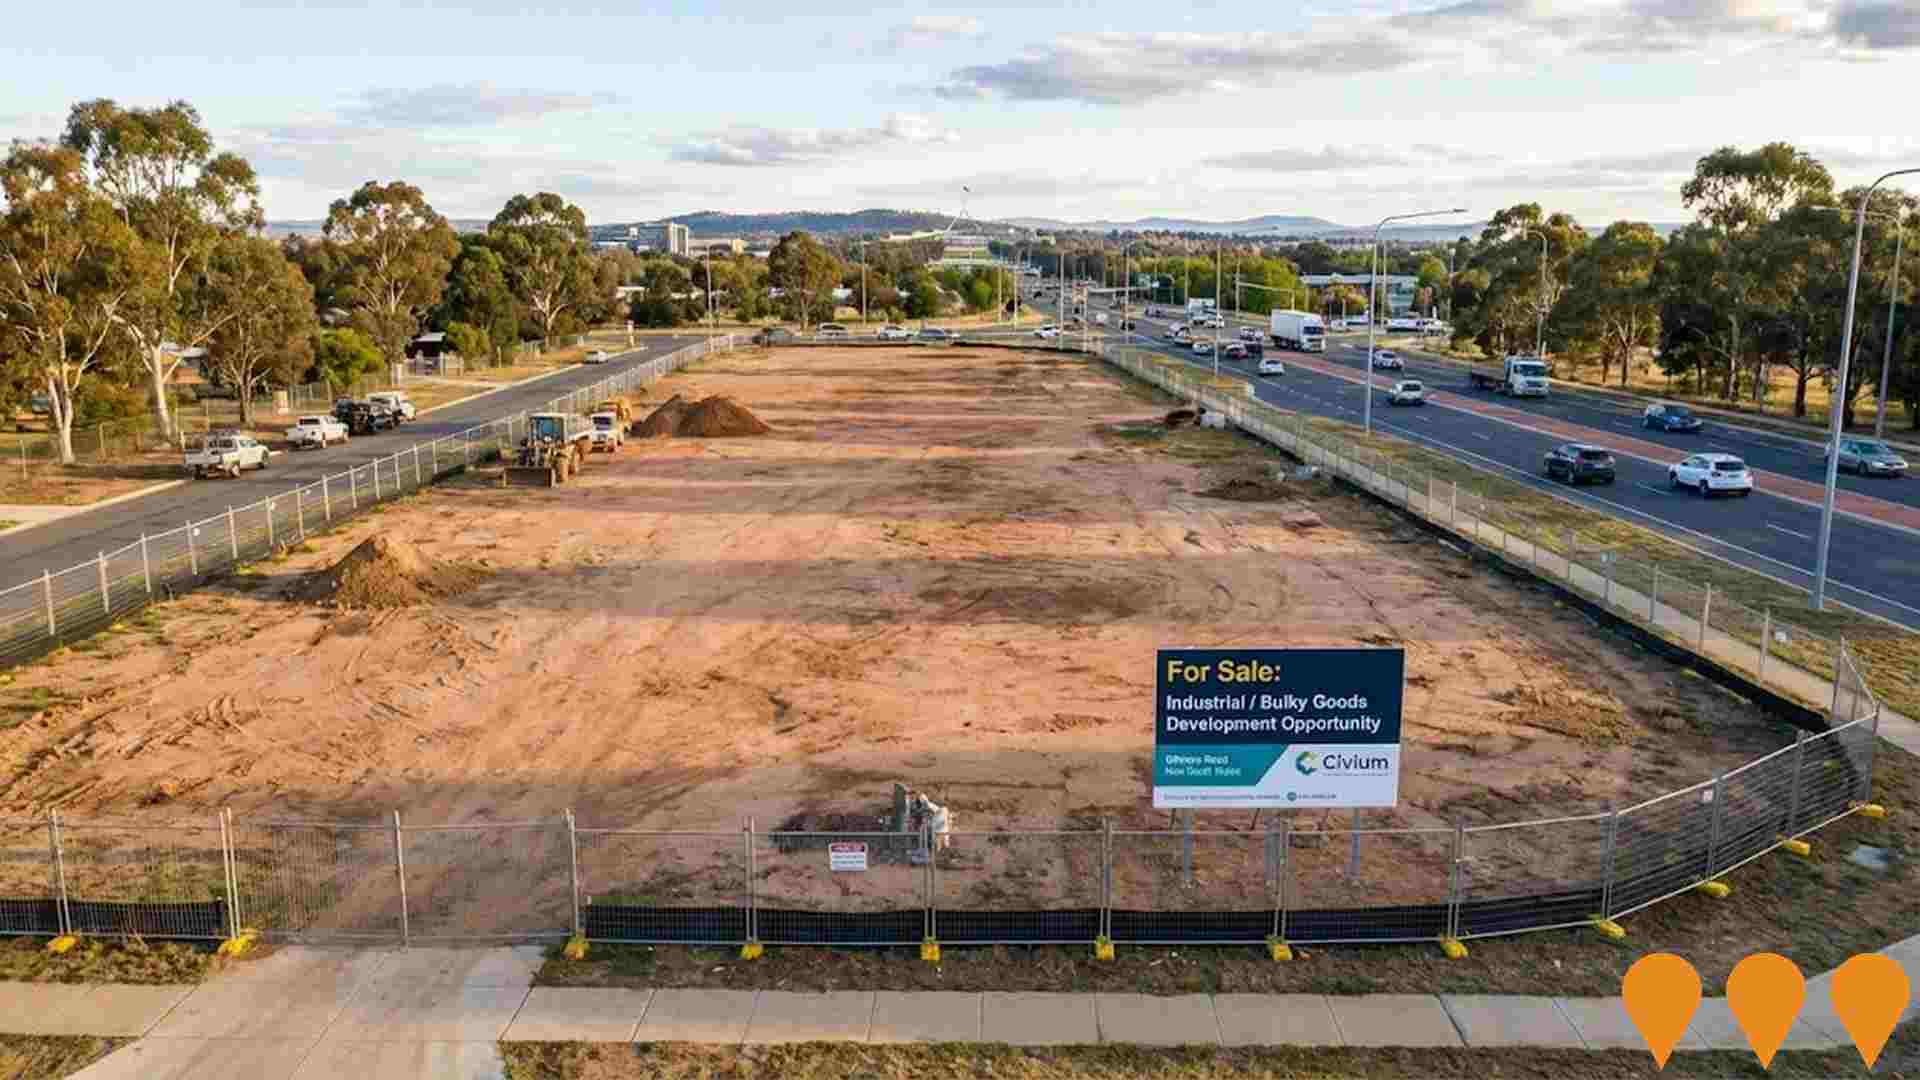
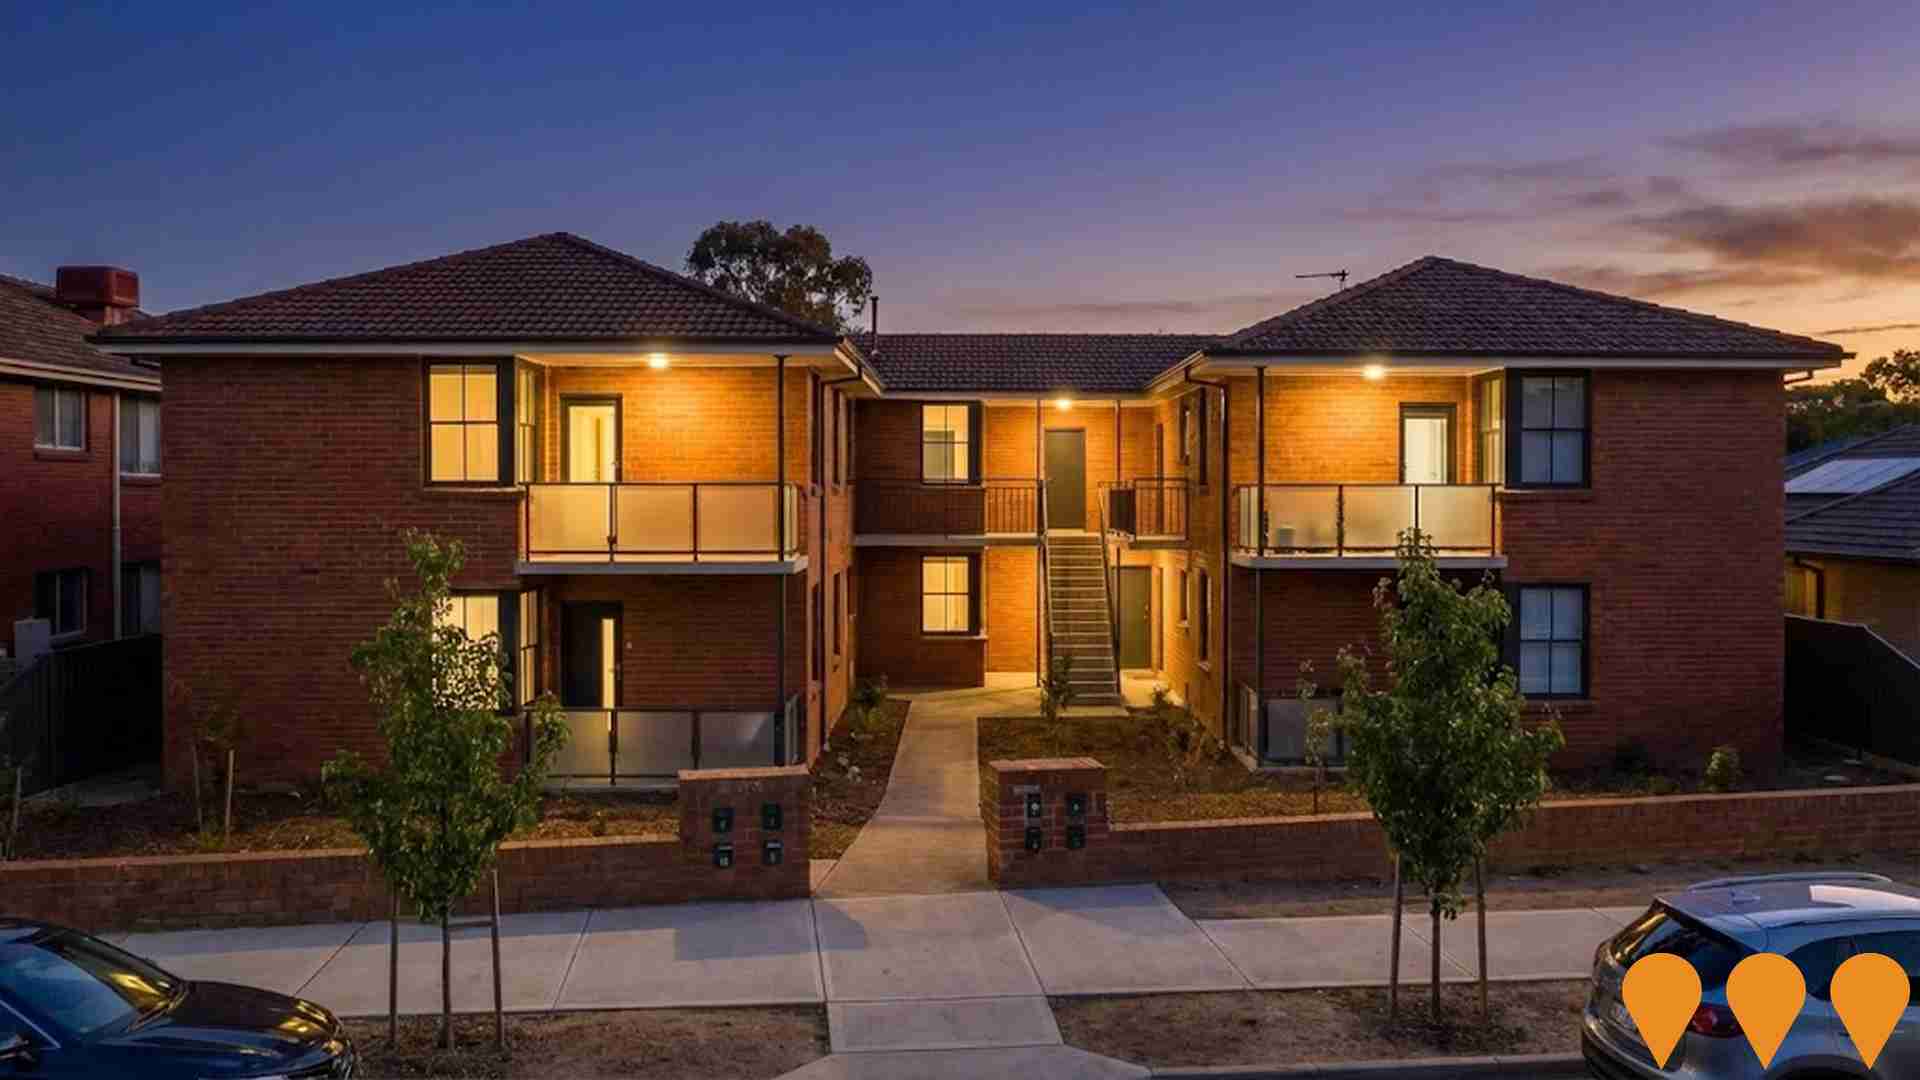
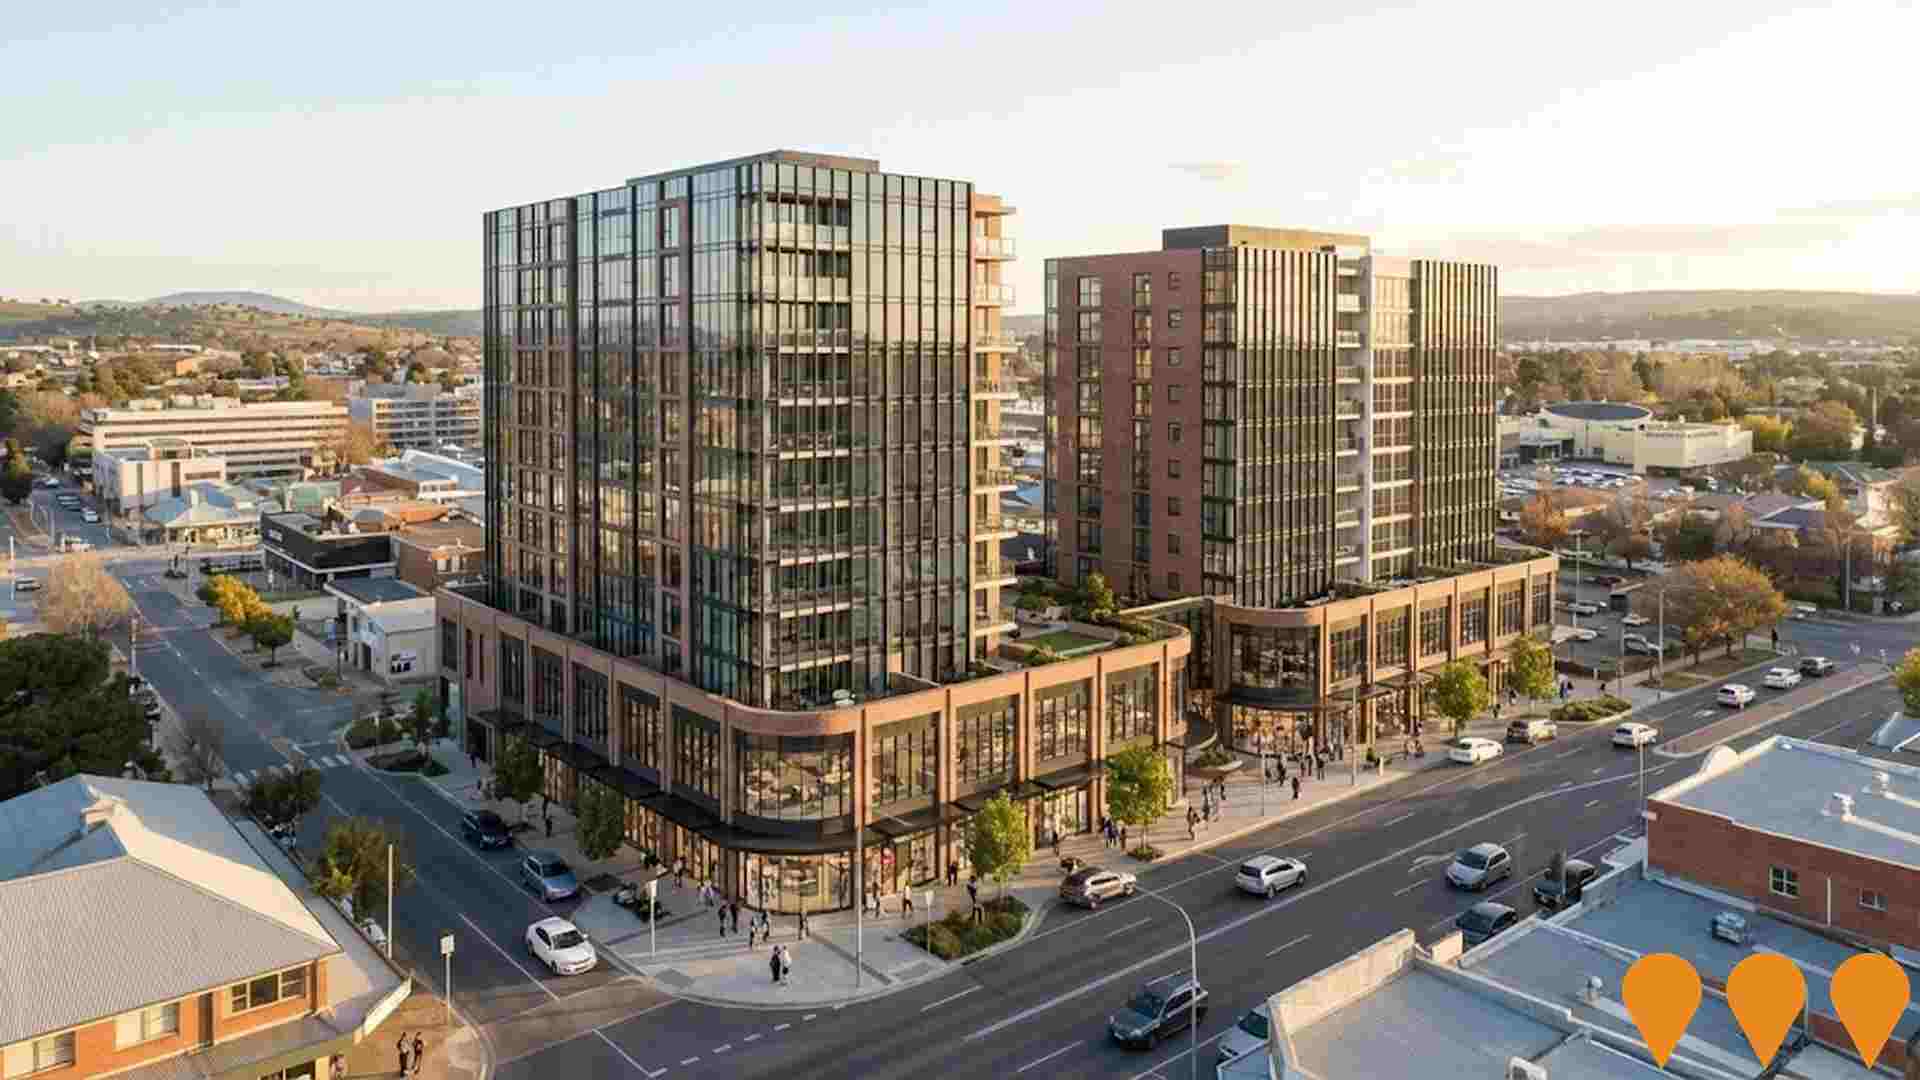
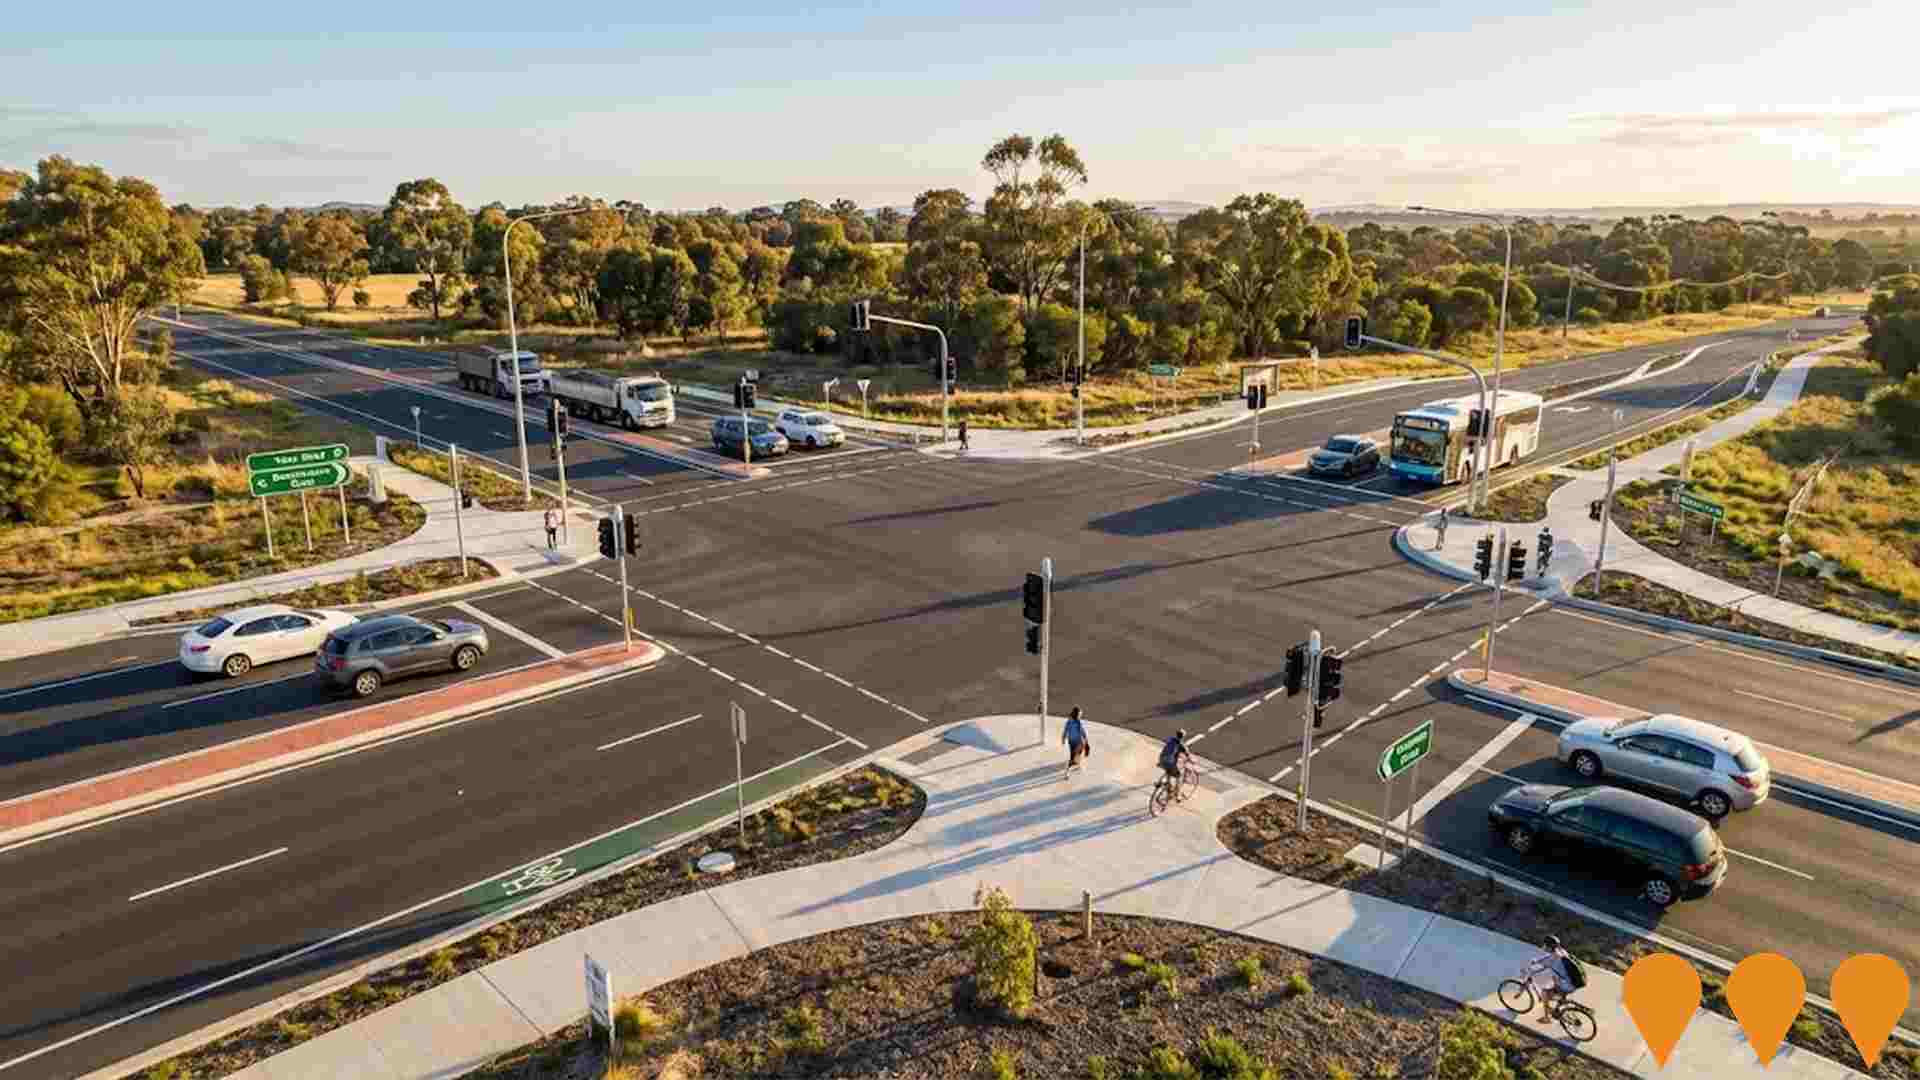
 Denotes AI-based impression for illustrative purposes only, not to be taken as definitive under any circumstances. Please follow links and conduct other investigations from the project's source for actual imagery. Developers and project owners wishing us to use original imagery please Contact Us and we will do so.
Frequently Asked Questions - Infrastructure
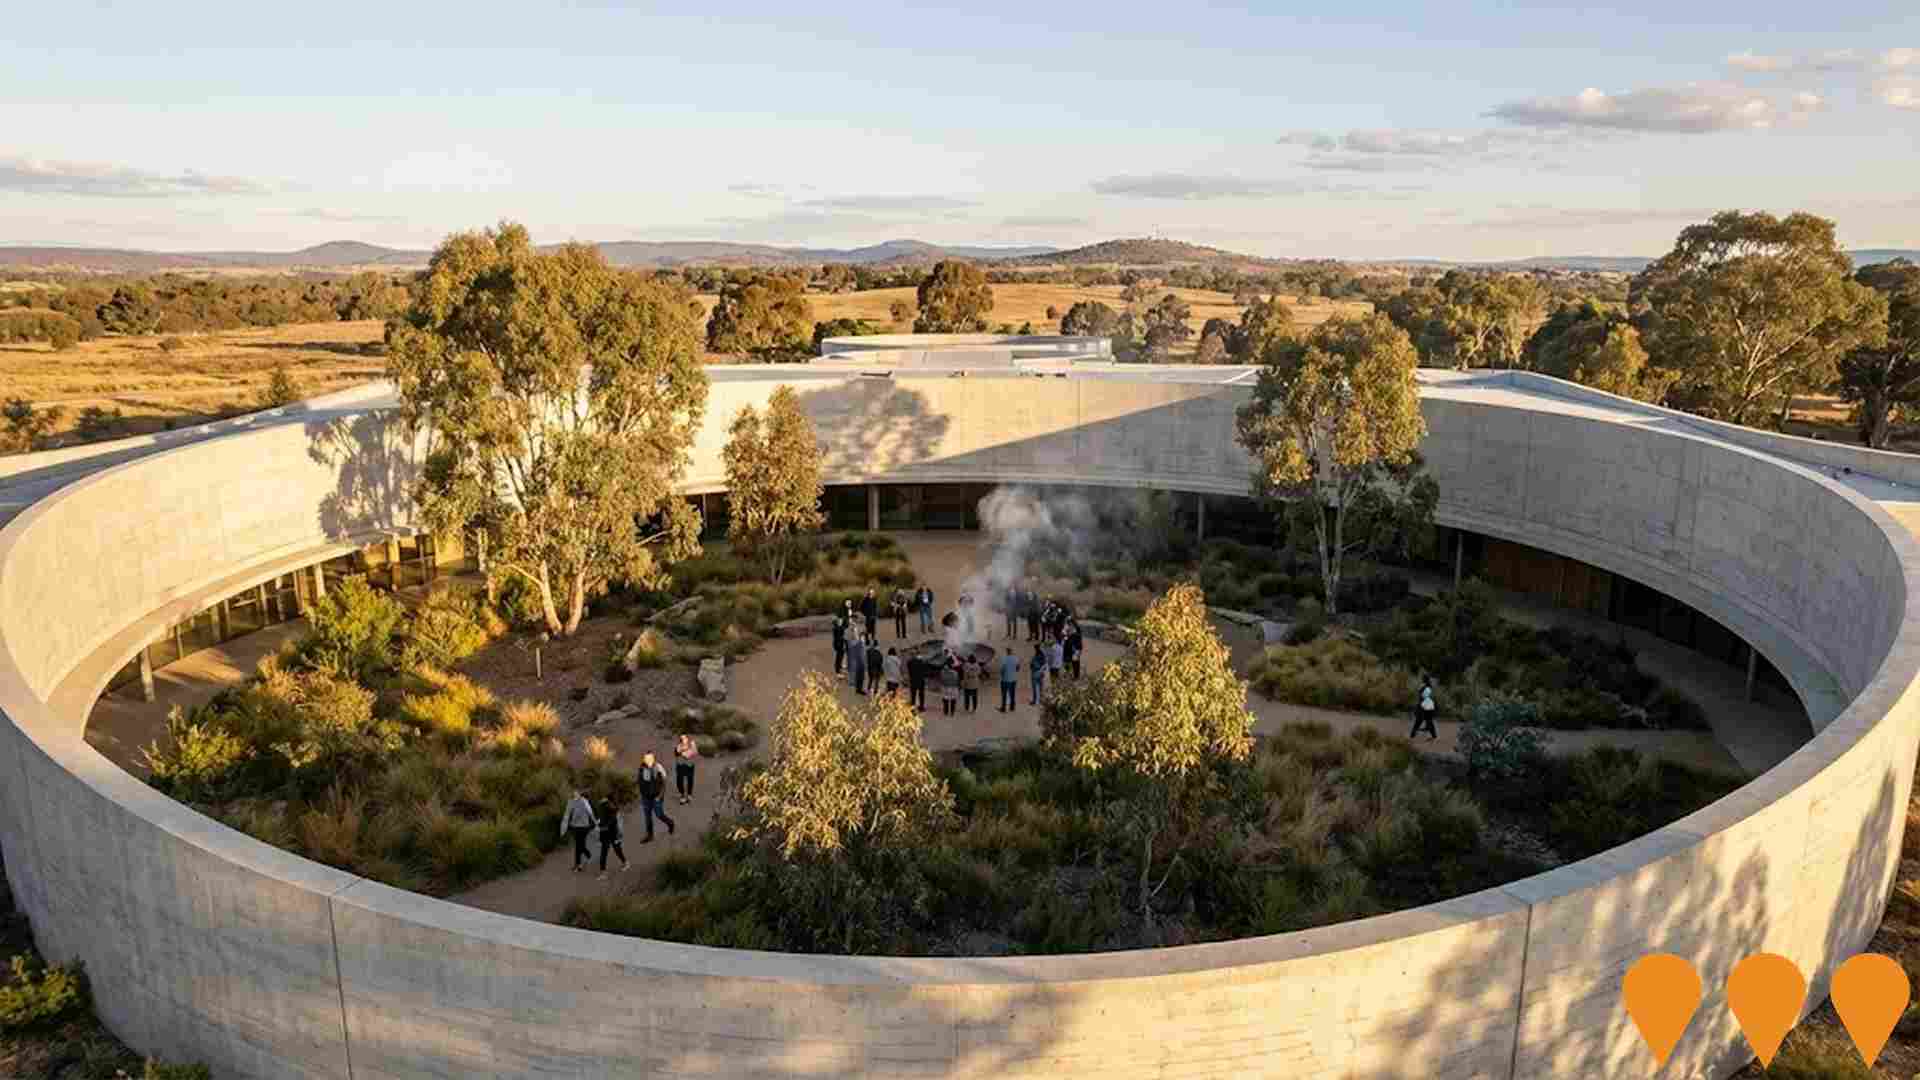
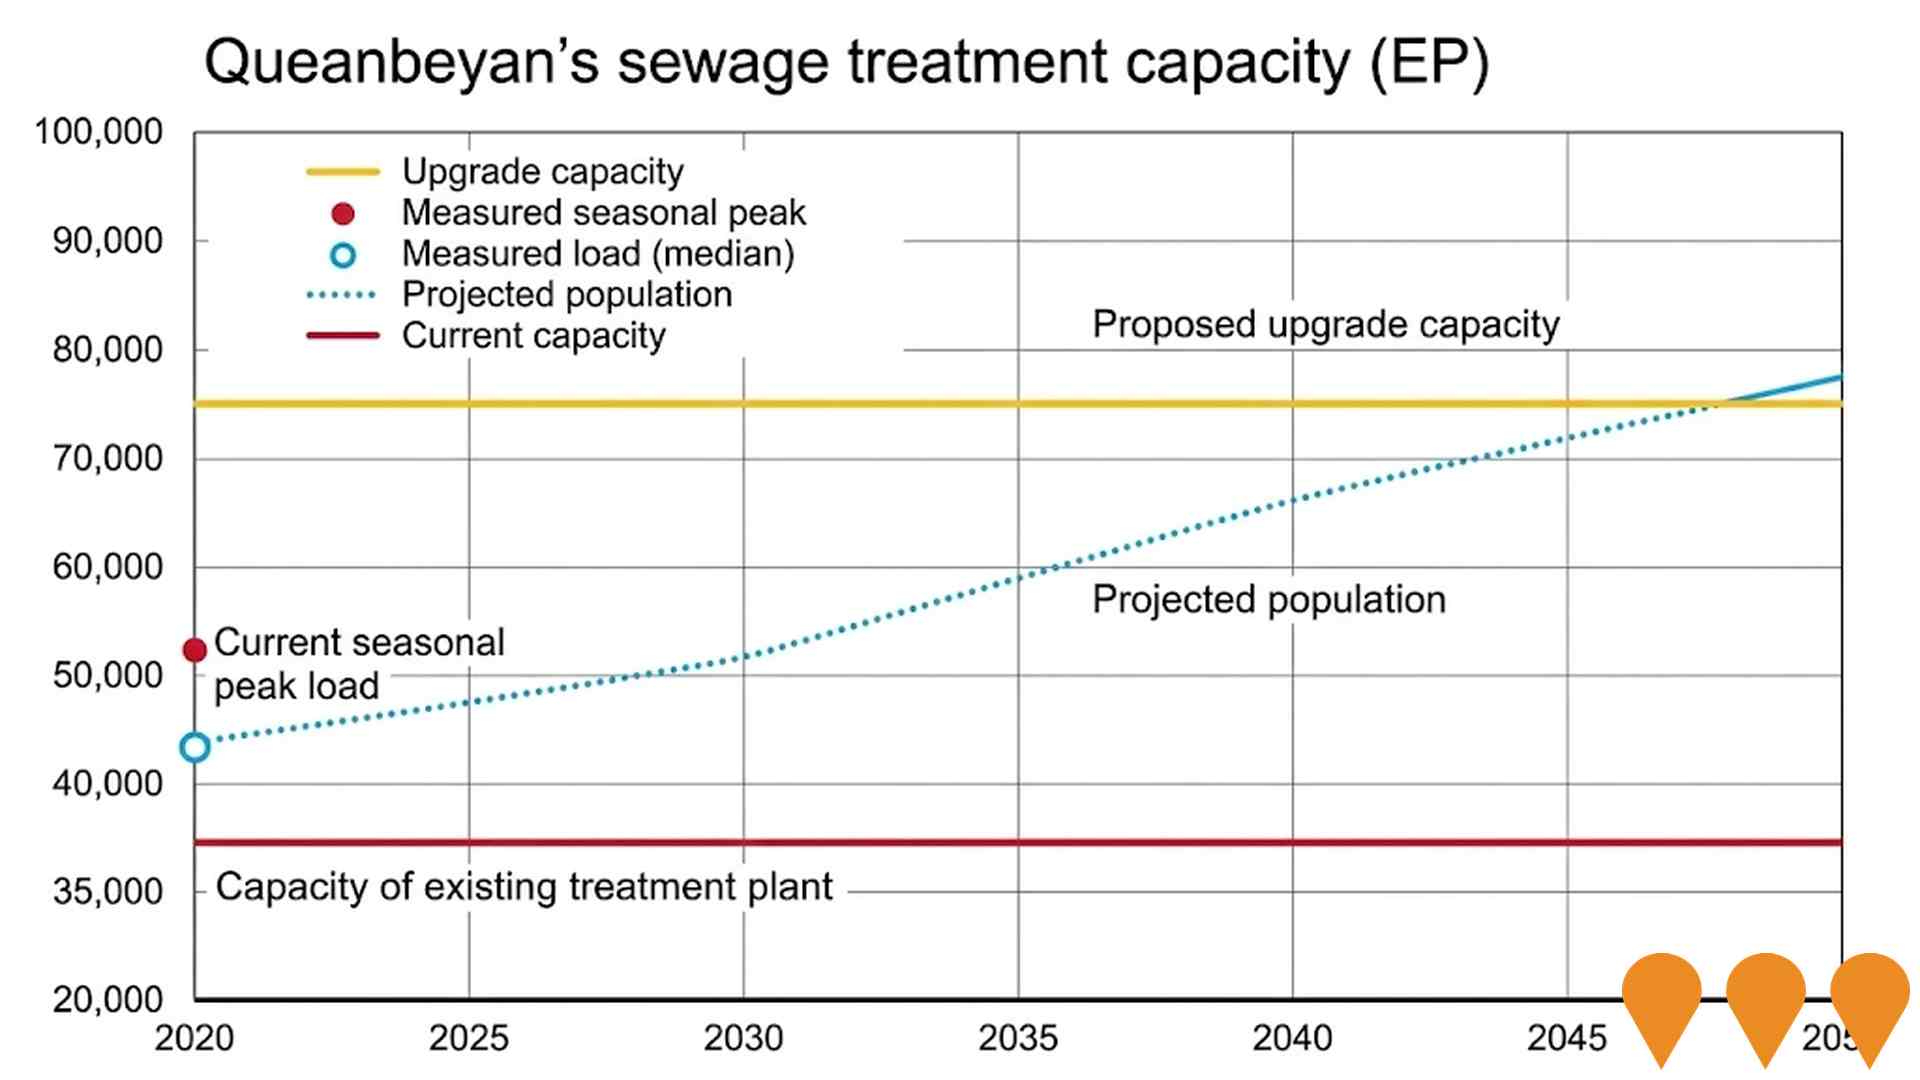
Queanbeyan Sewage Treatment Plant Upgrade
The project involves replacing the existing sewage treatment plant, which is nearing the end of its service life and is currently overloaded, with a new modern facility. The upgrade will increase the treatment capacity to service 75,000 equivalent people (EP), with the potential for future expansion to 112,500 EP. The new plant will feature an advanced treatment process including biological nutrient removal, tertiary filtration, and UV disinfection, which will improve the quality of treated effluent discharged into the Molonglo River. A development application for the project was lodged with the ACT Government on December 7, 2023.
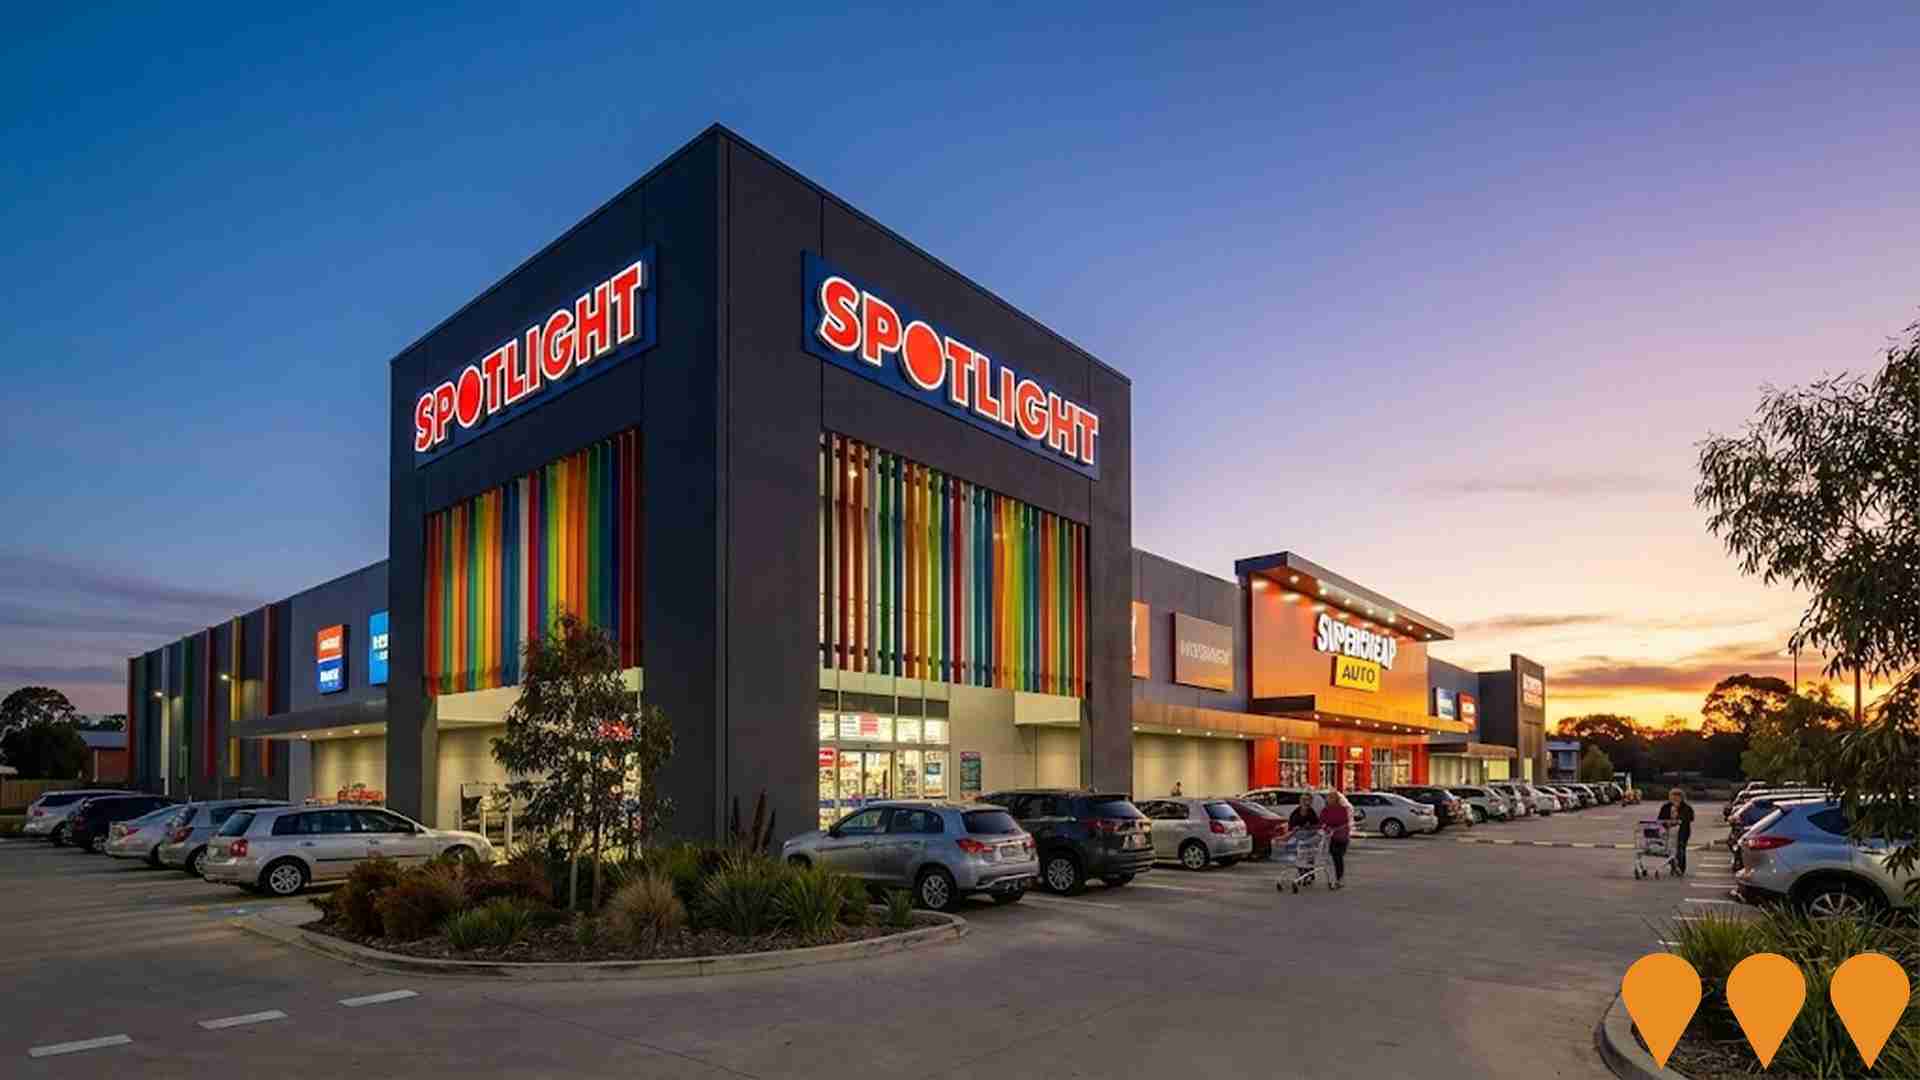
Spotlight Queanbeyan Retail Redevelopment
A mixed-use redevelopment that includes a new 1,000sqm large-format retail store for Supercheap Auto, an extended car park, and various site upgrades. The project is a collaboration between Spotlight Property Group and HGW Projects.
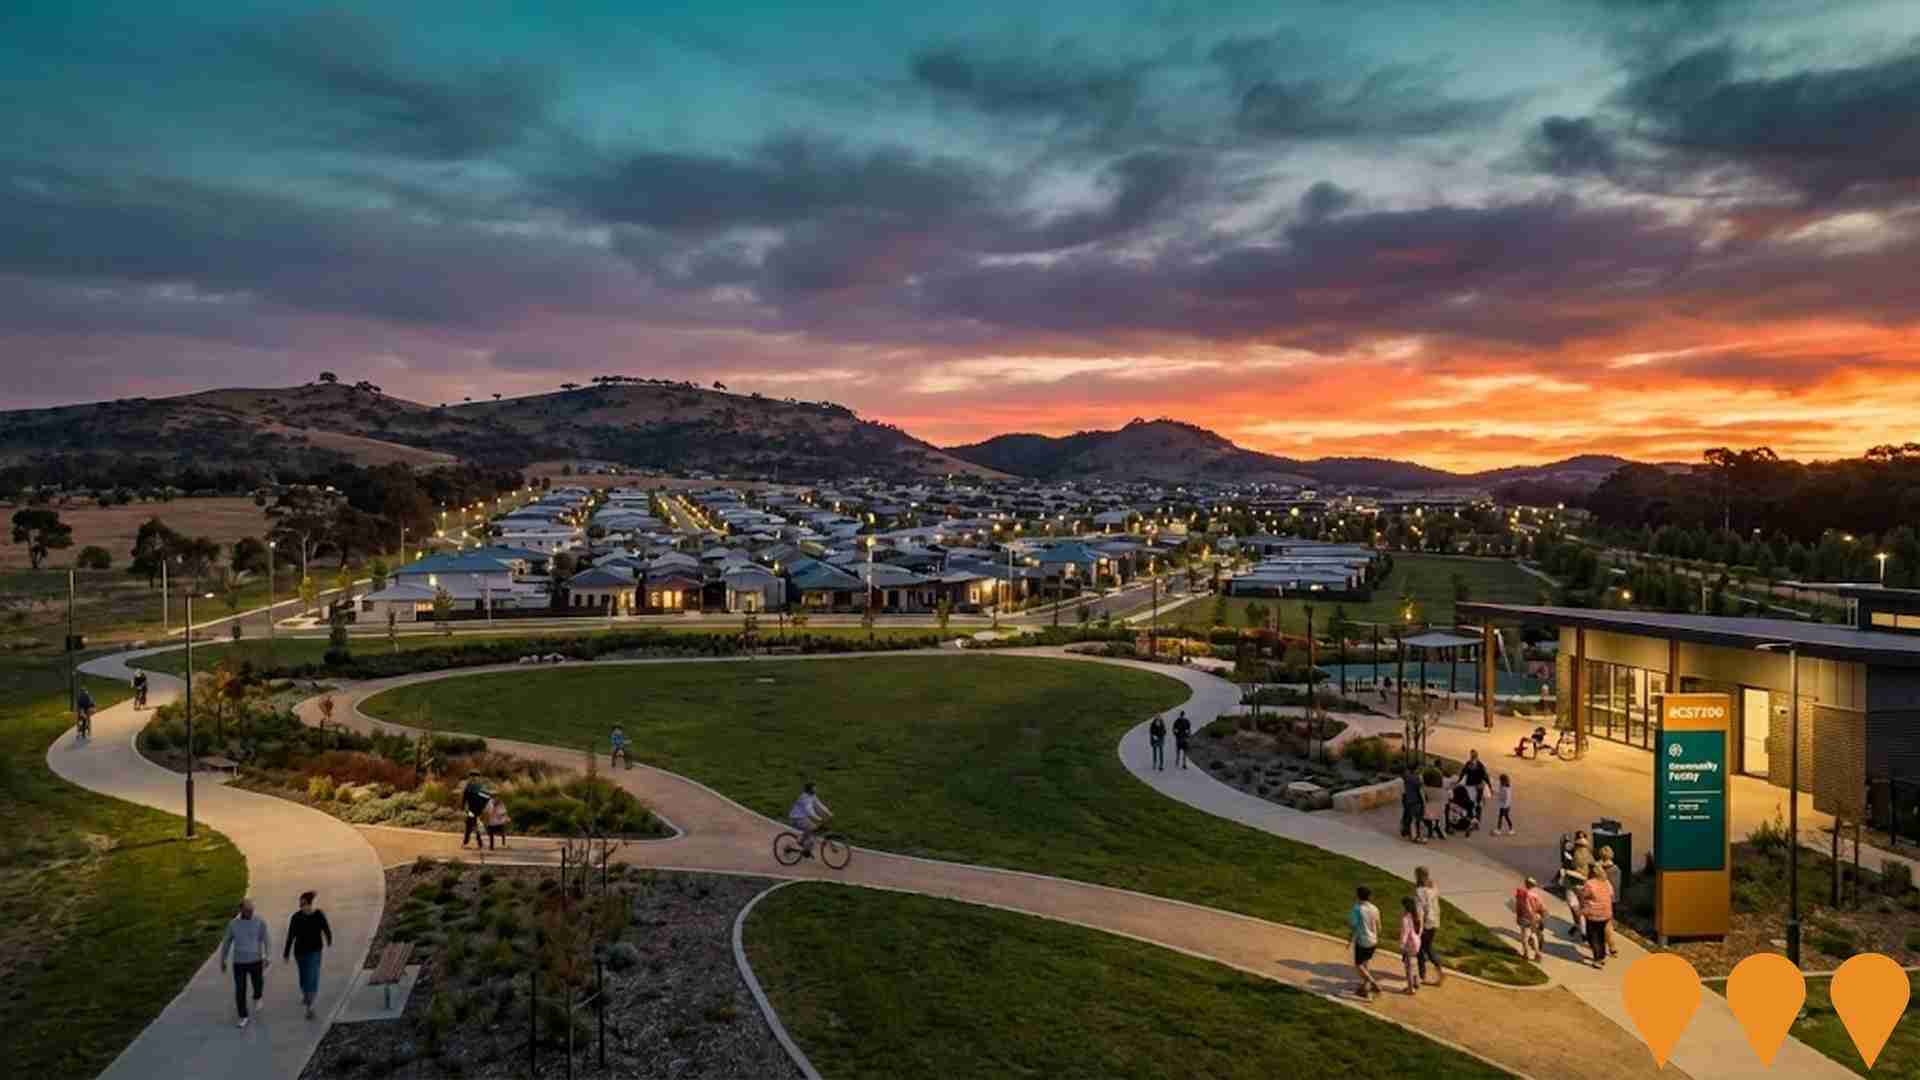
South Jerrabomberra Urban Release Area
A master-planned urban development featuring approximately 1500 residential dwellings, business parks, industrial estates, innovation precincts, regional sports complex, intermodal transport hub, new high school, and community amenities including parks, sports facilities, and retail spaces to create a sustainable community on the NSW-ACT border.
Poplars Innovation Precinct
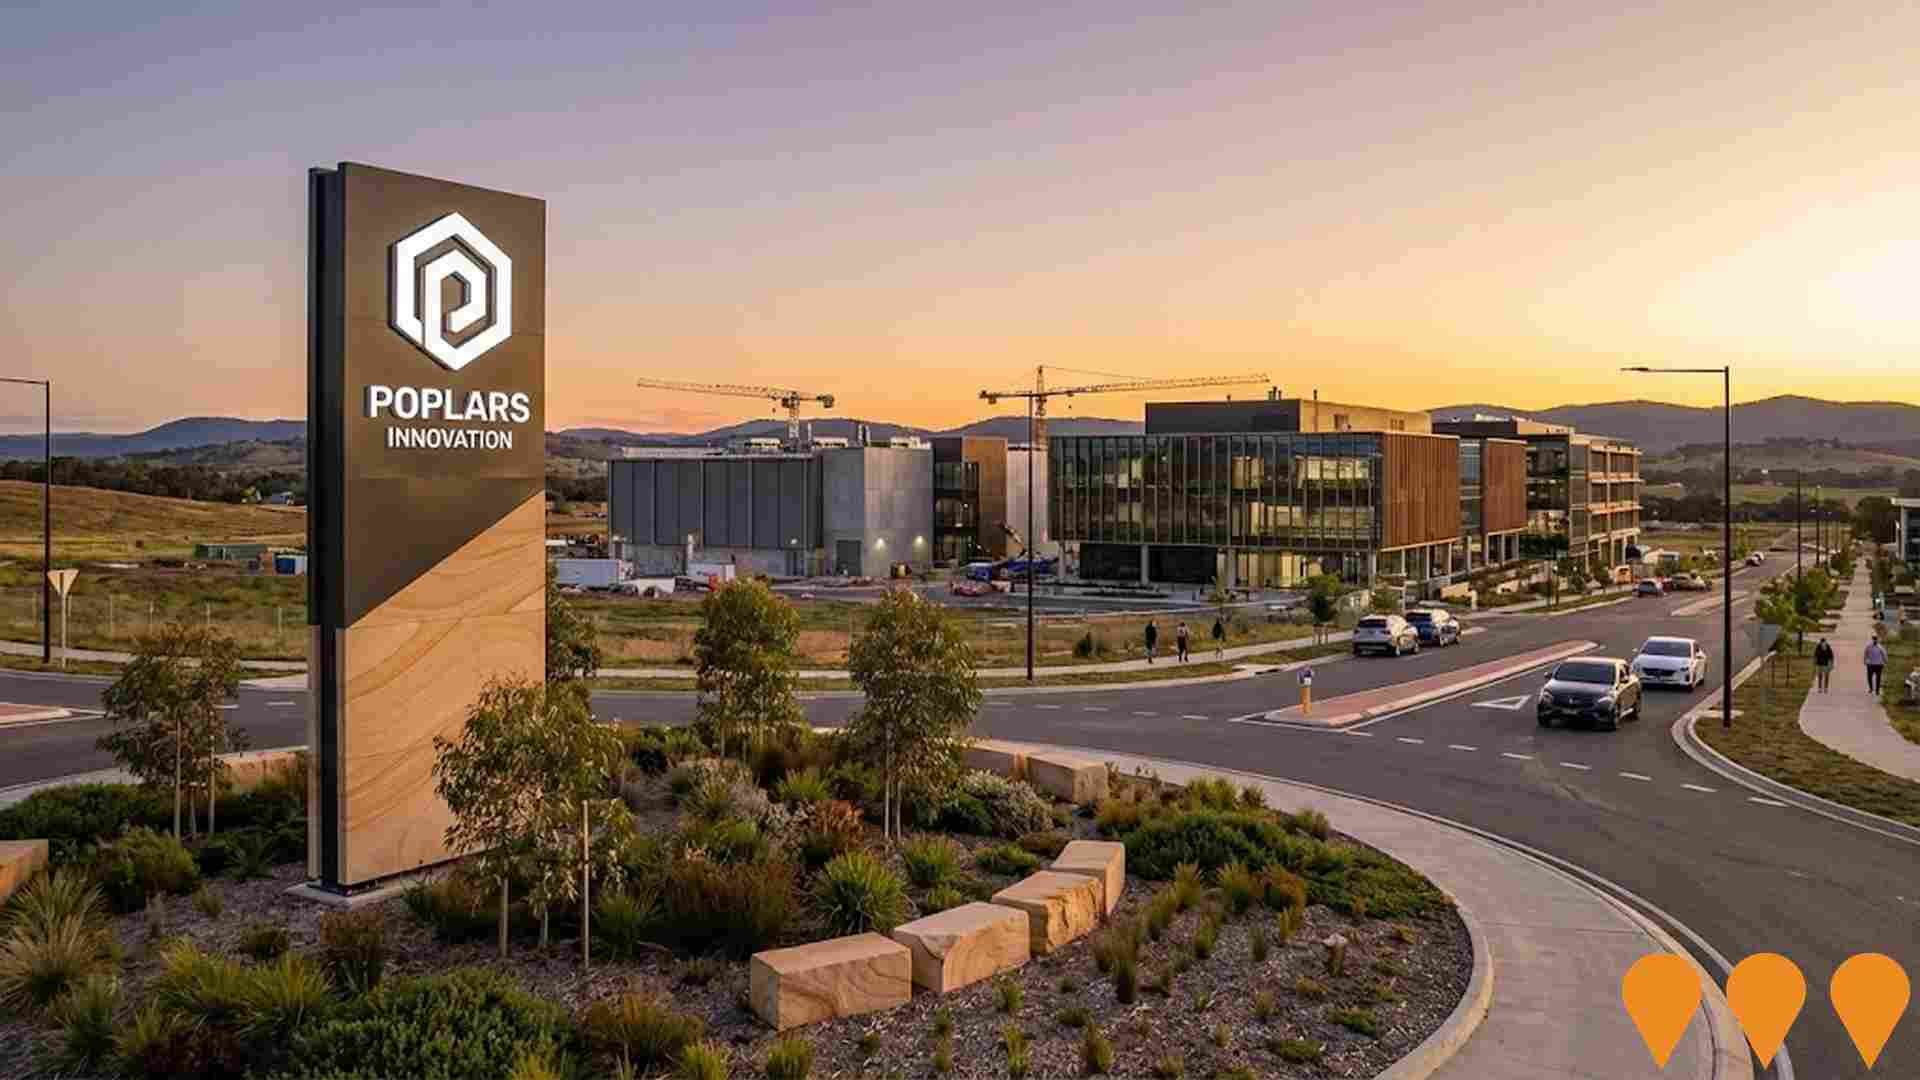
A 30ha innovation campus focused on high-tech businesses in defense, space, cyber-security, and manufacturing. It includes a 10ha retail and services precinct with national brands, a learning precinct featuring Jerrabomberra High School (completed in 2024), and protected grassland areas under NSW Biodiversity Stewardship Agreements. The precinct is part of the South Jerrabomberra Regional Job Precinct, endorsed by the NSW Government and Queanbeyan-Palerang Regional Council. Key developments include a $71 million Satellite Manufacturing Hub and a 25MW DCI Data Centre operational since 2024. Stage 1 lots are sold or under offer, with Stage 2 opportunities coming soon.
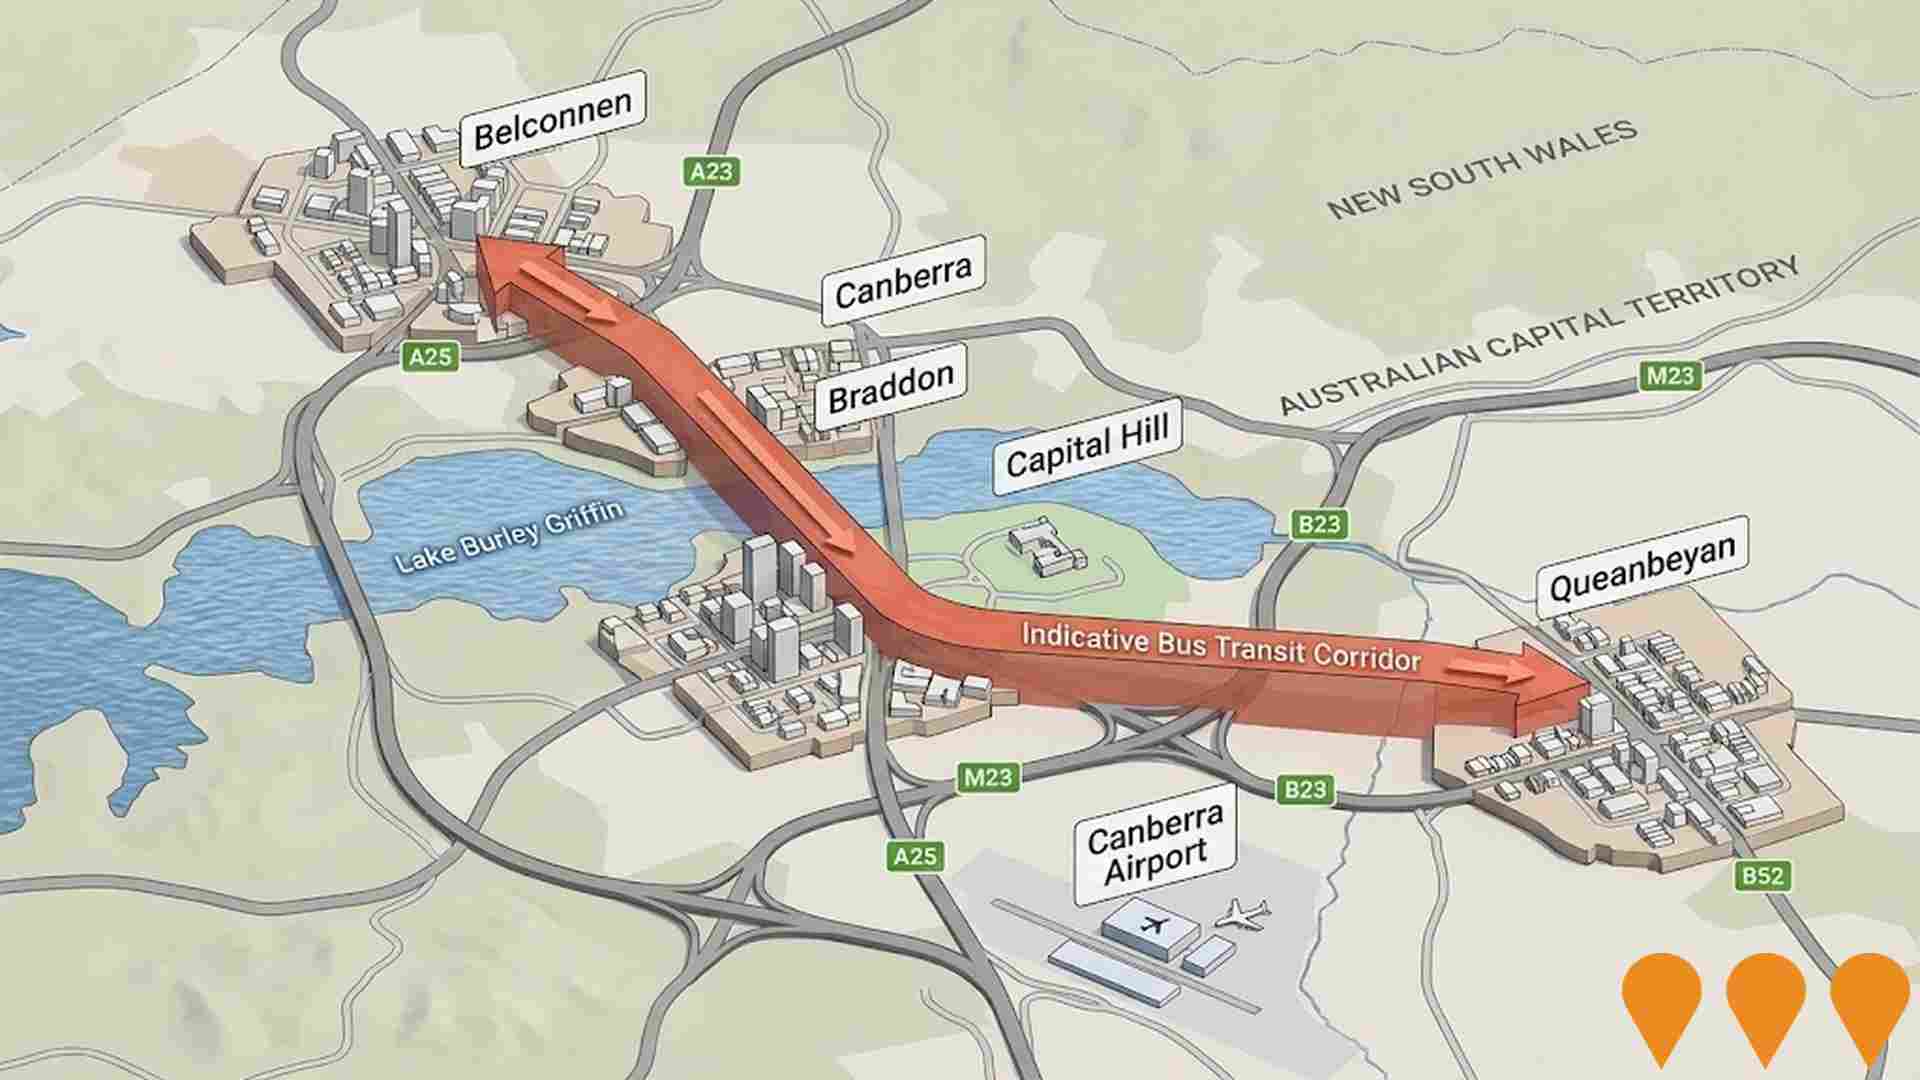
Enhanced bus and light rail corridors (Belconnen & Queanbeyan to Central Canberra)
ACT is progressing an integrated program to enhance high-frequency bus and future light rail corridors that link Belconnen and Queanbeyan with central Canberra. Light Rail Stage 2A (City to Commonwealth Park) commenced construction in early 2025 with services targeted from 2028, while planning and approvals continue for Stage 2B to Woden. The ACT Government has acknowledged and is planning upgrades for the Belconnen-to-City bus corridor as groundwork for a future east-west light rail Stage 3, and is coordinating cross-border public transport initiatives with NSW through the Queanbeyan Region Integrated Transport Plan and the ACT-NSW MoU for Regional Collaboration.
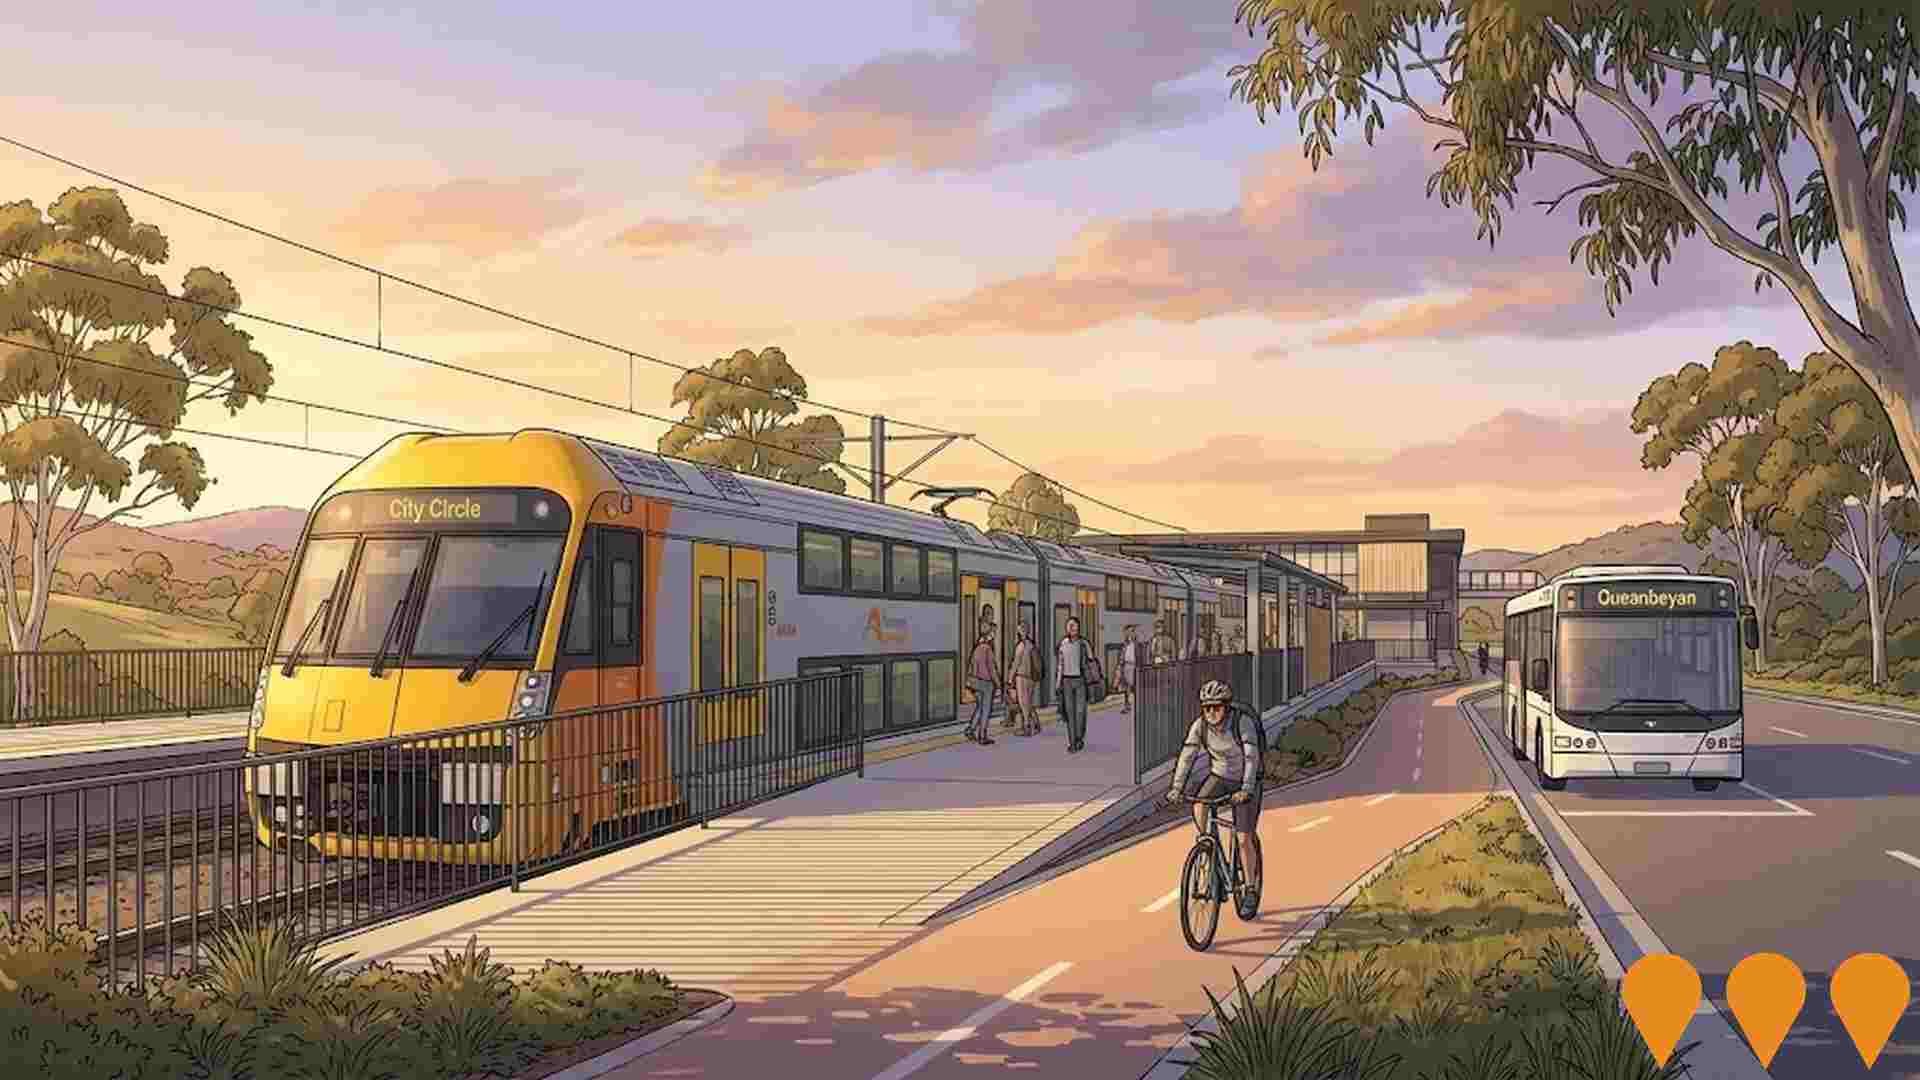
Queanbeyan Regional Integrated Transport Plan
Comprehensive transport planning initiative with 64 key actions for next 10 years. Addresses road safety, active transport connectivity, public transport availability, and future transport needs. Improved connections between Queanbeyan and ACT.
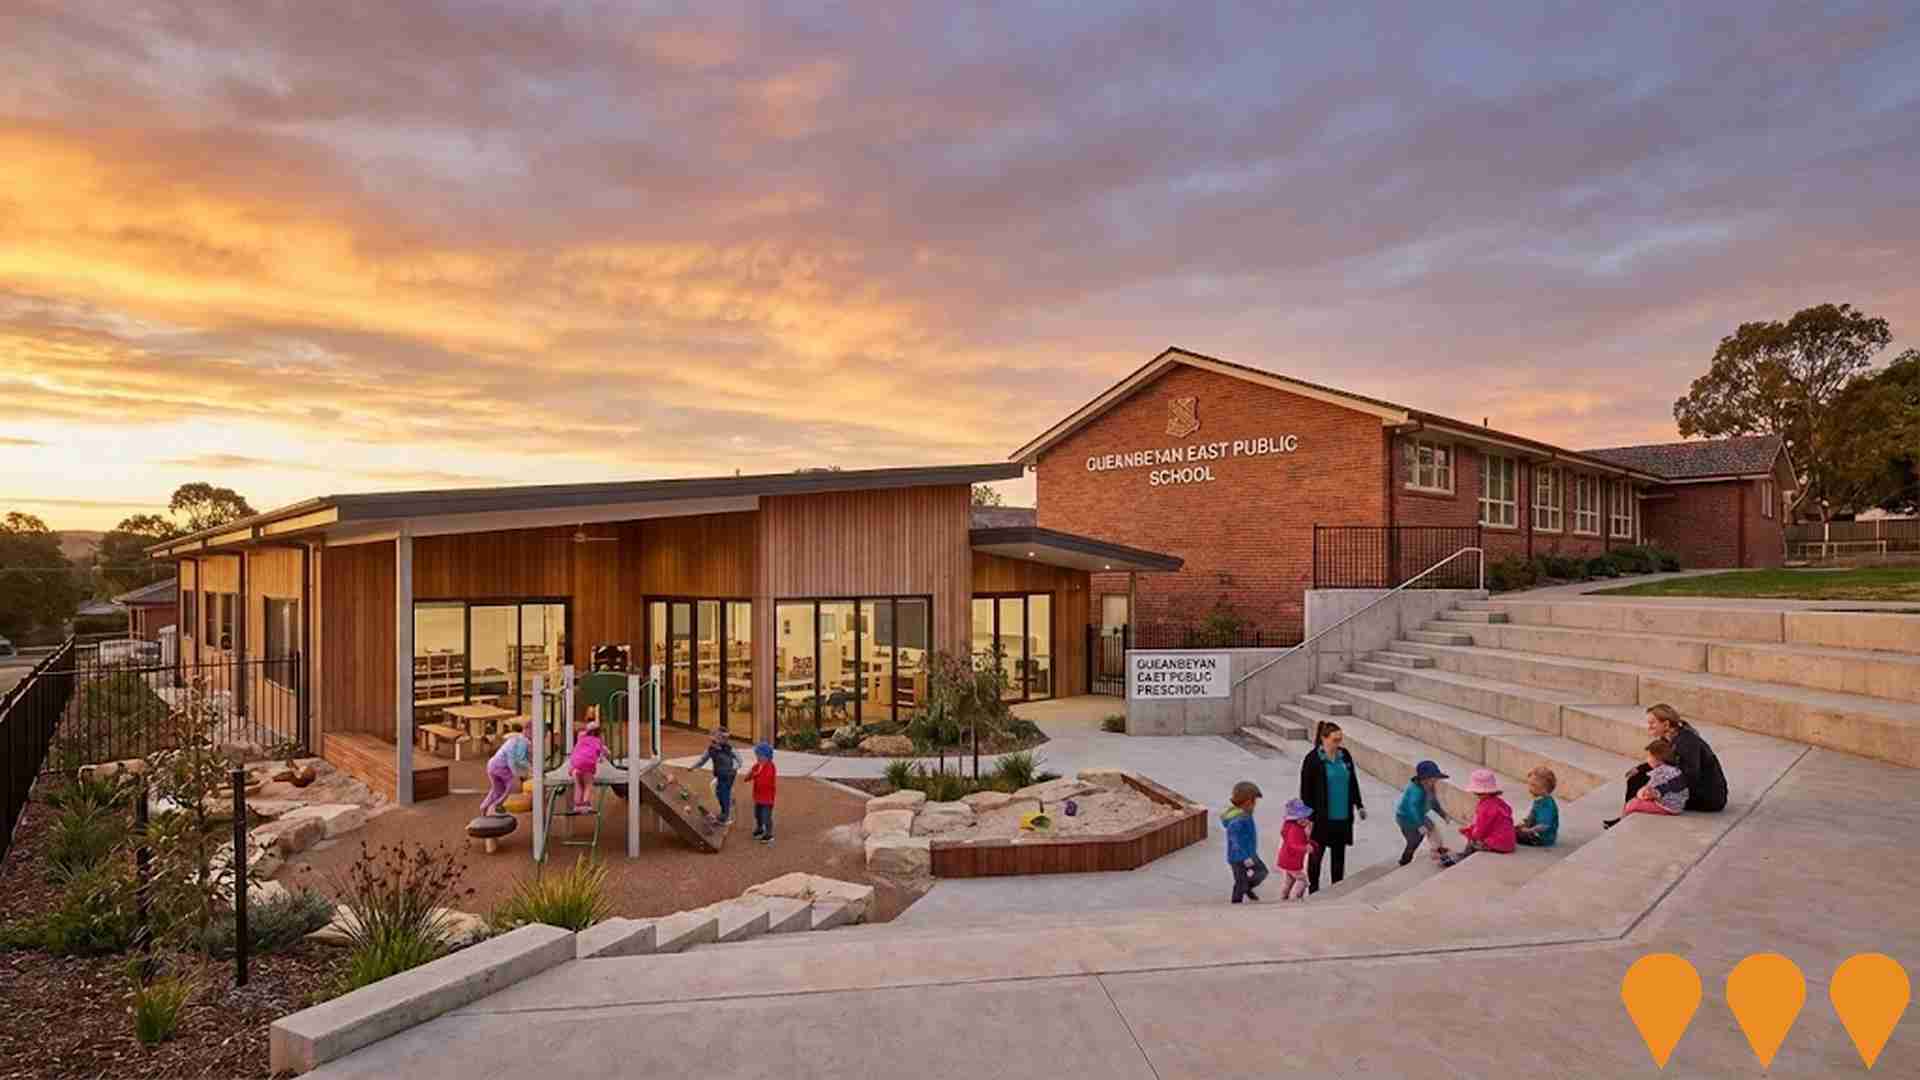
Queanbeyan East Public Preschool
The new public preschool will be located at Queanbeyan East Public School as part of the NSW Government's plan to deliver 100 new public preschools by 2027. It is designed to be a safe and engaging environment for preschool children, featuring two preschool rooms and an outdoor play area. The preschool will accommodate up to 40 children per day and is expected to be completed in time for Day 1, Term 1, 2027. Zauner Construction Pty Ltd has been awarded the contract to deliver the project. Statutory planning documentation is expected to be submitted in the coming months, and a construction start date will be confirmed after planning approval is received.
Yass Road, Bungendore Road and Ellerton Drive Intersection Upgrade
Major intersection upgrade replacing the existing roundabout with traffic signals. Includes two through lanes in all directions, dedicated left and right turn lanes on all approaches, signalised pedestrian crossings on all legs, on-road cycle lanes on Ellerton Drive and Yass Road, removal of the pedestrian underpass, upgraded footpaths, and relocation of bus stops. Designed to improve safety, reduce congestion, and enhance pedestrian and cyclist connectivity. Community consultation completed in 2025 with over 1,000 submissions and approximately 80% support. Geotechnical investigations completed August 2025. NSW Government funding approximately $33.7 million.
Employment
Employment conditions in Queanbeyan demonstrate strong performance, ranking among the top 35% of areas assessed nationally
Queanbeyan has a well-educated workforce with essential services sectors prominently represented. The unemployment rate in September 2025 was 2.3%.
At this time, 6,698 residents were employed, with an unemployment rate of 1.5% lower than the Rest of NSW's rate of 3.8%. Workforce participation was higher at 67.9%, compared to the Rest of NSW's 56.4%. Employment is concentrated in public administration & safety, health care & social assistance, and construction. The area has a particular specialization in public administration & safety, with an employment share 3.2 times the regional level.
Conversely, agriculture, forestry & fishing employs only 0.3% of local workers, significantly lower than Rest of NSW's 5.3%. While there are local employment opportunities, many residents commute elsewhere for work based on Census data. In the year to September 2025, the labour force decreased by 5.6%, and employment declined by an equivalent amount, keeping the unemployment rate stable. This contrasts with Rest of NSW where employment contracted by 0.5%, the labour force fell by 0.1%, and unemployment rose by 0.4 percentage points. State-level data to 25-Nov-25 shows NSW employment contracted by 0.03% (losing 2,260 jobs), with a state unemployment rate of 3.9%. This compares favourably to the national unemployment rate of 4.3%. Jobs and Skills Australia's national employment forecasts from May-25 suggest that employment should increase locally by 6.2% over five years and 12.8% over ten years, based on a simple weighting extrapolation of industry-specific projections against Queanbeyan's employment mix.
Frequently Asked Questions - Employment
Income
Income analysis reveals strong economic positioning, with the area outperforming 60% of locations assessed nationally by AreaSearch
AreaSearch's aggregation of latest postcode level ATO data released for financial year 2022 shows Queanbeyan SA2 had a median income among taxpayers of $57,952 and an average level of $68,228. These figures are higher than the national averages of $49,459 and $62,998 for Rest of NSW respectively. Based on Wage Price Index growth of 12.61% since financial year 2022, current estimates suggest approximately $65,260 (median) and $76,832 (average) as of September 2025. Census data indicates personal income ranks at the 78th percentile ($996 weekly), while household income sits at the 47th percentile. Distribution data shows that 36.1% of individuals fall within the $1,500 - $2,999 earnings band (4,109 individuals). Housing affordability pressures are severe, with only 83.9% of income remaining, ranking at the 48th percentile. The area's SEIFA income ranking places it in the 5th decile.
Frequently Asked Questions - Income
Housing
Queanbeyan displays a diverse mix of dwelling types, with a higher proportion of rental properties than the broader region
Queanbeyan's dwellings, as per the latest Census, consisted of 41.8% houses and 58.2% other dwellings (semi-detached, apartments, 'other' dwellings). In comparison, Non-Metro NSW had 74.5% houses and 25.5% other dwellings. Home ownership in Queanbeyan was at 23.3%, with mortgaged dwellings at 32.4% and rented ones at 44.3%. The median monthly mortgage repayment was $1,700, lower than Non-Metro NSW's average of $2,167. The median weekly rent in Queanbeyan was $330, compared to Non-Metro NSW's $355. Nationally, Queanbeyan's mortgage repayments were below the Australian average of $1,863, and rents were substantially lower than the national figure of $375.
Frequently Asked Questions - Housing
Household Composition
Queanbeyan features high concentrations of lone person households, with a lower-than-average median household size
Family households account for 54.7% of all households, including 21.0% couples with children, 22.2% couples without children, and 10.1% single parent families. Non-family households make up the remaining 45.3%, with lone person households at 41.9% and group households comprising 3.4%. The median household size is 2.1 people, smaller than the Rest of NSW average of 2.6.
Frequently Asked Questions - Households
Local Schools & Education
Educational attainment in Queanbeyan aligns closely with national averages, showing typical qualification patterns and performance metrics
The area's educational profile is notable regionally, with university qualification rates of 31.2% among residents aged 15+, surpassing the Rest of NSW average of 21.3% and the SA4 region average of 24.1%. Bachelor degrees are most prevalent at 17.9%, followed by postgraduate qualifications (10.5%) and graduate diplomas (2.8%). Vocational credentials are also prominent, with 31.9% of residents aged 15+ holding such qualifications – advanced diplomas account for 10.5% while certificates make up 21.4%.
Educational participation is high, with 26.6% of residents currently enrolled in formal education. This includes 8.0% in primary education, 5.4% in tertiary education, and 5.1% pursuing secondary education.
Frequently Asked Questions - Education
Schools Detail
Nearby Services & Amenities
Transport
Transport servicing is good compared to other areas nationally based on assessment of service frequency, route connectivity and accessibility
Queanbeyan has 56 active public transport stops operating within the city. These include a mix of train and bus services. There are 110 individual routes servicing these stops, providing a total of 3894 weekly passenger trips.
The accessibility of transport is rated as excellent, with residents typically located 160 meters from the nearest stop. On average, there are 556 trips per day across all routes, which equates to approximately 69 weekly trips per individual stop.
Frequently Asked Questions - Transport
Transport Stops Detail
Health
Health performance in Queanbeyan is lower than average with common health conditions somewhat prevalent across the board, though to a considerably higher degree among older age cohorts
Queanbeyan faces significant health challenges with common health conditions prevalent among its residents, particularly among older age cohorts. Approximately 54% (~6,113 people) of Queanbeyan's total population has private health cover, compared to 61.0% across the Rest of NSW.
Mental health issues and arthritis are the most common medical conditions in Queanbeyan, affecting 10.2 and 8.5% of residents respectively. Sixty-six point five percent (66.5%) of Queanbeyan's residents declare themselves completely clear of medical ailments, compared to 68.7% across the Rest of NSW. The area has 14.2% (1,614 people) of residents aged 65 and over. Health outcomes among seniors in Queanbeyan require more attention than those of the broader population.
Frequently Asked Questions - Health
Cultural Diversity
The level of cultural diversity witnessed in Queanbeyan was found to be above average when compared nationally for a number of language and cultural background related metrics
Queanbeyan's population was found to be more culturally diverse than most local areas, with 28.3% born overseas and 24.4% speaking a language other than English at home. Christianity is the predominant religion in Queanbeyan, comprising 47.1% of its population. Notably, the 'Other' religious category represents 3.2%, higher than the Rest of NSW average of 1.6%.
In terms of ancestry, Australian (23.8%), English (23.2%), and Other (13.0%) are the top groups in Queanbeyan, with Other being significantly higher than the regional average of 7.9%. Specifically, Macedonian (2.0% vs 1.5%), Serbian (0.7% vs 0.6%), and Croatian (0.9% vs 0.9%) ethnicities show notable representation in Queanbeyan compared to regional averages.
Frequently Asked Questions - Diversity
Age
Queanbeyan's population is slightly younger than the national pattern
The median age in Queanbeyan is 36 years, significantly below Rest of NSW's average of 43 and somewhat younger than Australia's 38 years. The 25-34 age group shows strong representation at 22.9%, compared to Rest of NSW's figure, while the 65-74 cohort is less prevalent at 7.2%. This 25-34 concentration is well above the national average of 14.5%. Post-2021 Census data shows the 25 to 34 age group has grown from 20.9% to 22.9%, and the 35 to 44 cohort increased from 14.5% to 15.9%. Conversely, the 5 to 14 cohort has declined from 9.4% to 8.2%, and the 65 to 74 group dropped from 8.2% to 7.2%. Population forecasts for 2041 indicate substantial demographic changes for Queanbeyan. Leading this shift, the 25 to 34 age group is projected to grow by 42% (1,086 people), reaching 3,694 from 2,607. In contrast, the 55 to 64 cohort shows minimal growth of just 1% (12 people).
