Chart Color Schemes
This analysis uses ABS Statistical Areas Level 2 (SA2) boundaries, which can materially differ from Suburbs and Localities (SAL) even when sharing similar names.
SA2 boundaries are defined by the Australian Bureau of Statistics and are designed to represent communities for statistical reporting (e.g., census and ERP).
Suburbs and Localities (SAL) represent commonly-used suburb/locality names (postal-style areas) and may use different geographic boundaries. For comprehensive analysis, consider reviewing both boundary types if available.
est. as @ -- *
ABS ERP | -- people | --
2021 Census | -- people
Sales Activity
Curious about local property values? Filter the chart to assess the volume and appreciation (including resales) trends and regional comparisons, or scroll to the map below view this information at an individual property level.
Find a Recent Sale
Sales Detail
Population
Haberfield - Summer Hill has shown very soft population growth performance across periods assessed by AreaSearch
Haberfield-Summer Hill's population is around 14,007 as of Nov 2025. This reflects an increase from 13,520 people recorded in the 2021 Census, a growth of 487 people (3.6%). The change was inferred from ABS estimated resident population of 14,007 by June 2024 and additional 47 validated new addresses since the Census date. This results in a density ratio of 4,036 persons per square kilometer, placing Haberfield-Summer Hill among the top 10% of locations assessed nationally by AreaSearch. The area's growth rate of 3.6% since the census is within 2.8 percentage points of its SA4 region (6.4%), indicating competitive growth fundamentals. Overseas migration was the primary driver of population growth in recent periods.
AreaSearch uses ABS/Geoscience Australia projections for each SA2 area, released in 2024 with a base year of 2022. For areas not covered by this data, NSW State Government's SA2 level projections released in 2022 with a base year of 2021 are used. Growth rates by age group from these aggregations are applied to all areas for years 2032 to 2041. Future population trends indicate an overall decline, with the area's population expected to decrease by 319 persons by 2041. However, specific age cohorts are anticipated to grow, notably the 75-84 age group, projected to expand by 368 people.
Frequently Asked Questions - Population
Development
The level of residential development activity in Haberfield - Summer Hill is very low in comparison to the average area assessed nationally by AreaSearch
Haberfield-Summer Hill has seen approximately 13 new homes approved annually. Over the past five financial years, from FY21 to FY25, 66 homes were approved, with a further three approved so far in FY26. On average, over these five years, 0.1 new residents arrived per new home.
The average expected construction cost value of new dwellings was $389,000. This year, $43.6 million in commercial development approvals have been recorded. Compared to Greater Sydney and nationally, Haberfield-Summer Hill shows reduced construction activity, with 81.0% below the regional average per person and reflecting possible planning constraints. New building activity comprises 20.0% detached houses and 80.0% medium and high-density housing. The location has approximately 4472 people per dwelling approval, indicating an established market. Population projections suggest stability or decline, which may reduce housing demand pressures, benefiting potential buyers.
With population projections showing stability or decline, Haberfield - Summer Hill should see reduced housing demand pressures, benefiting potential buyers.
Frequently Asked Questions - Development
Infrastructure
Haberfield - Summer Hill has very high levels of nearby infrastructure activity, ranking in the top 10% nationally
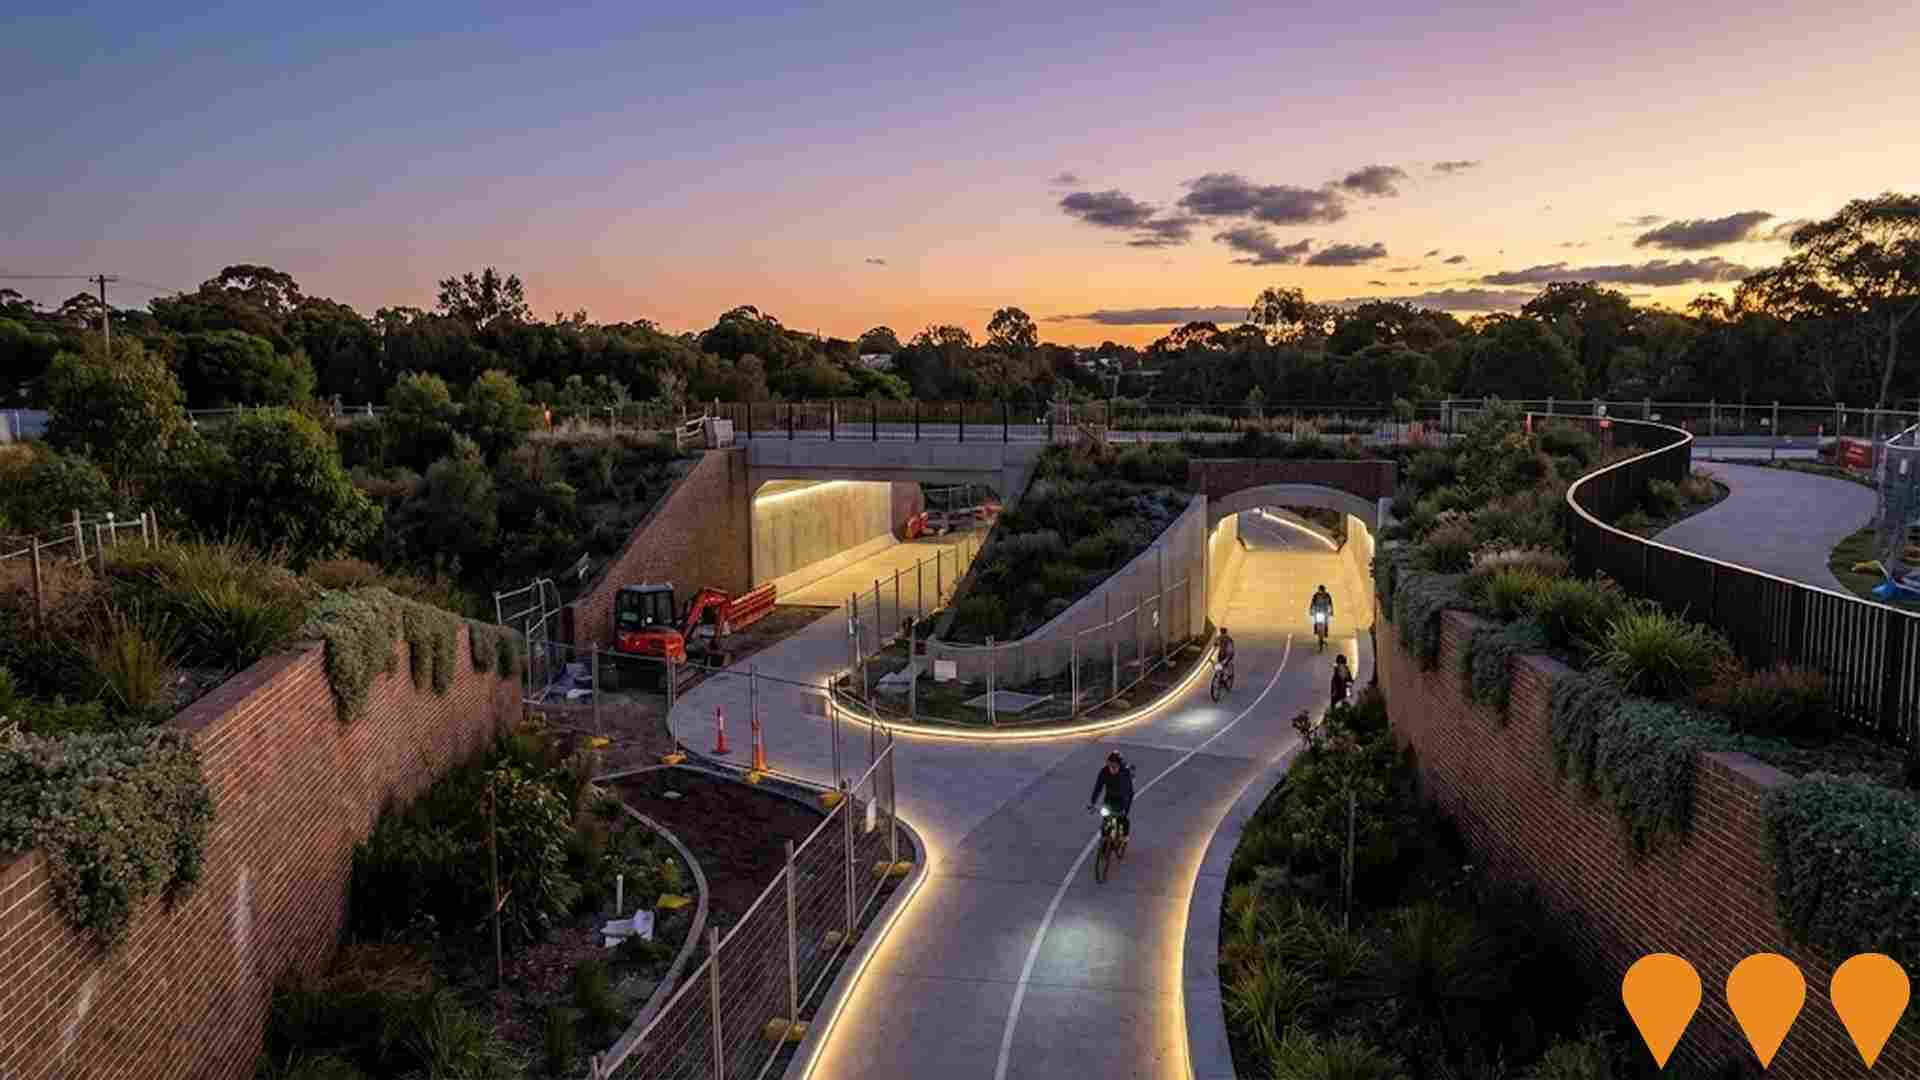
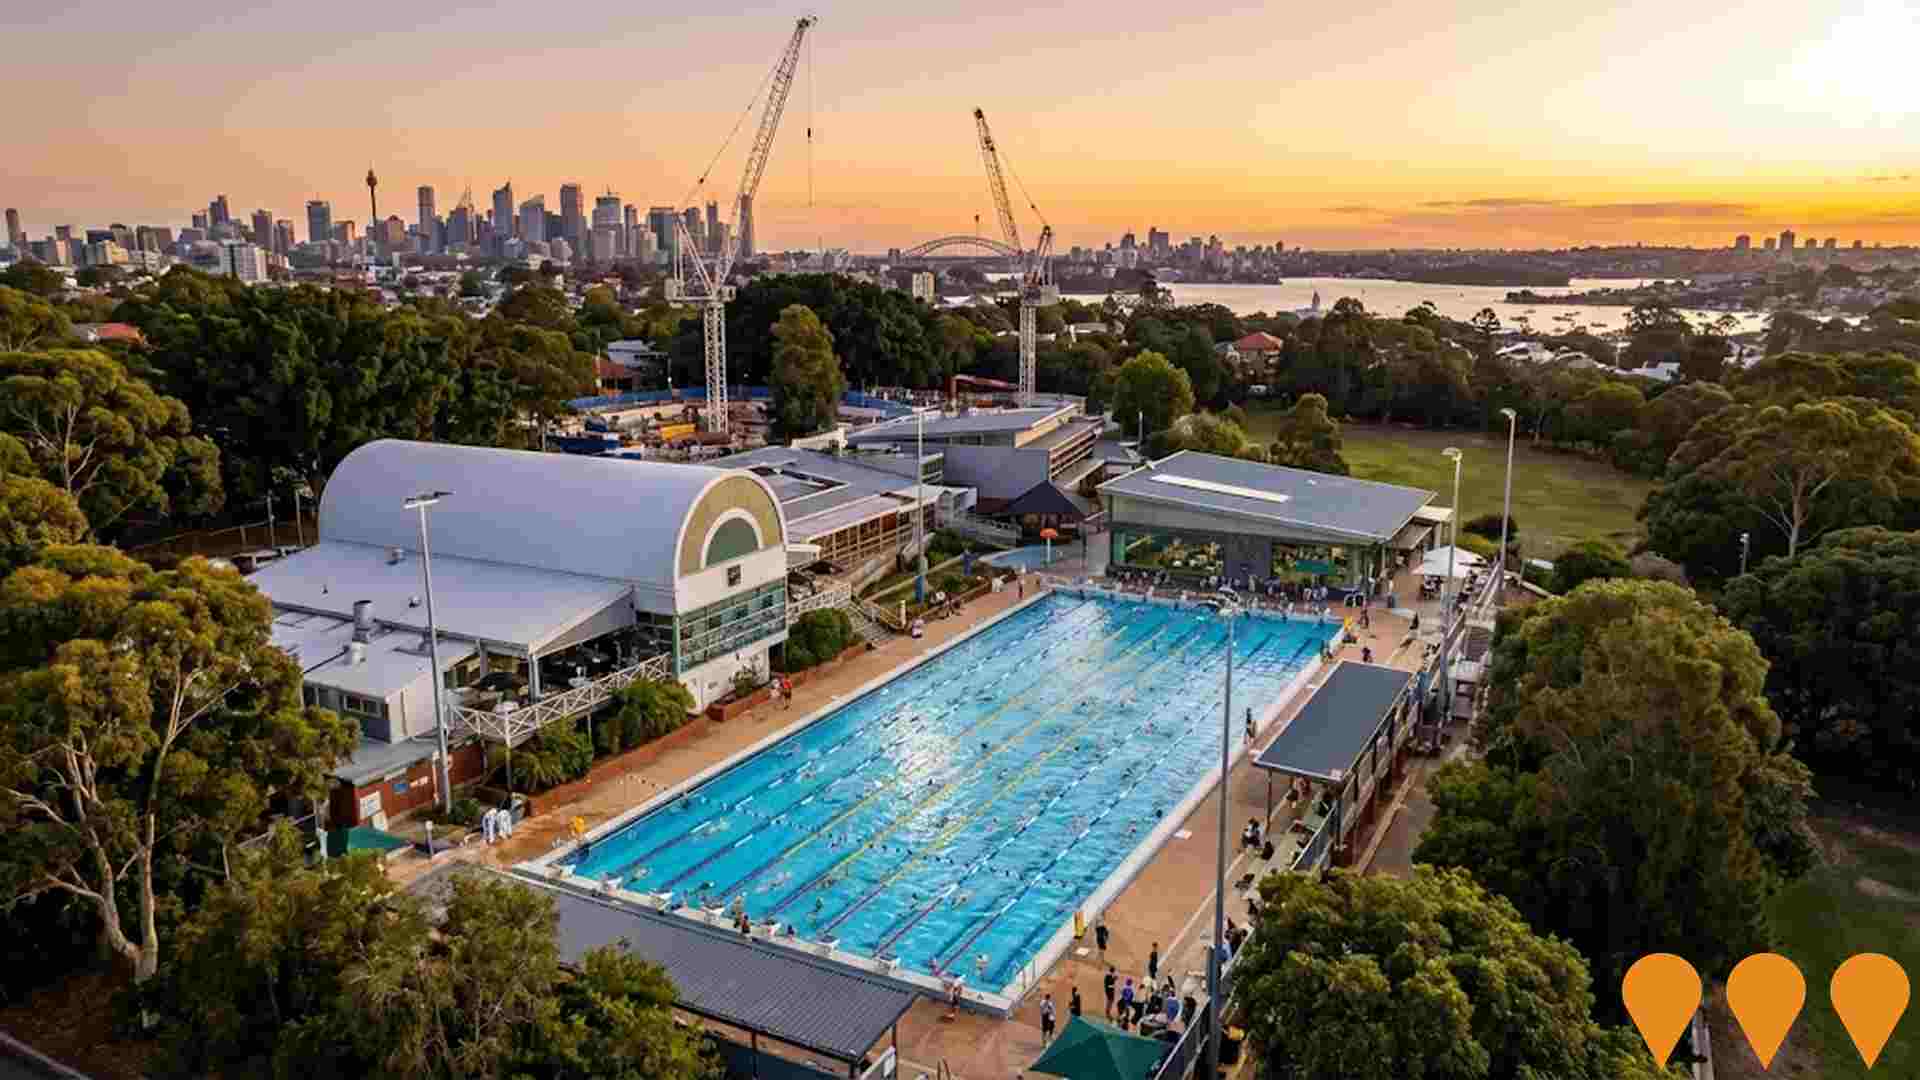
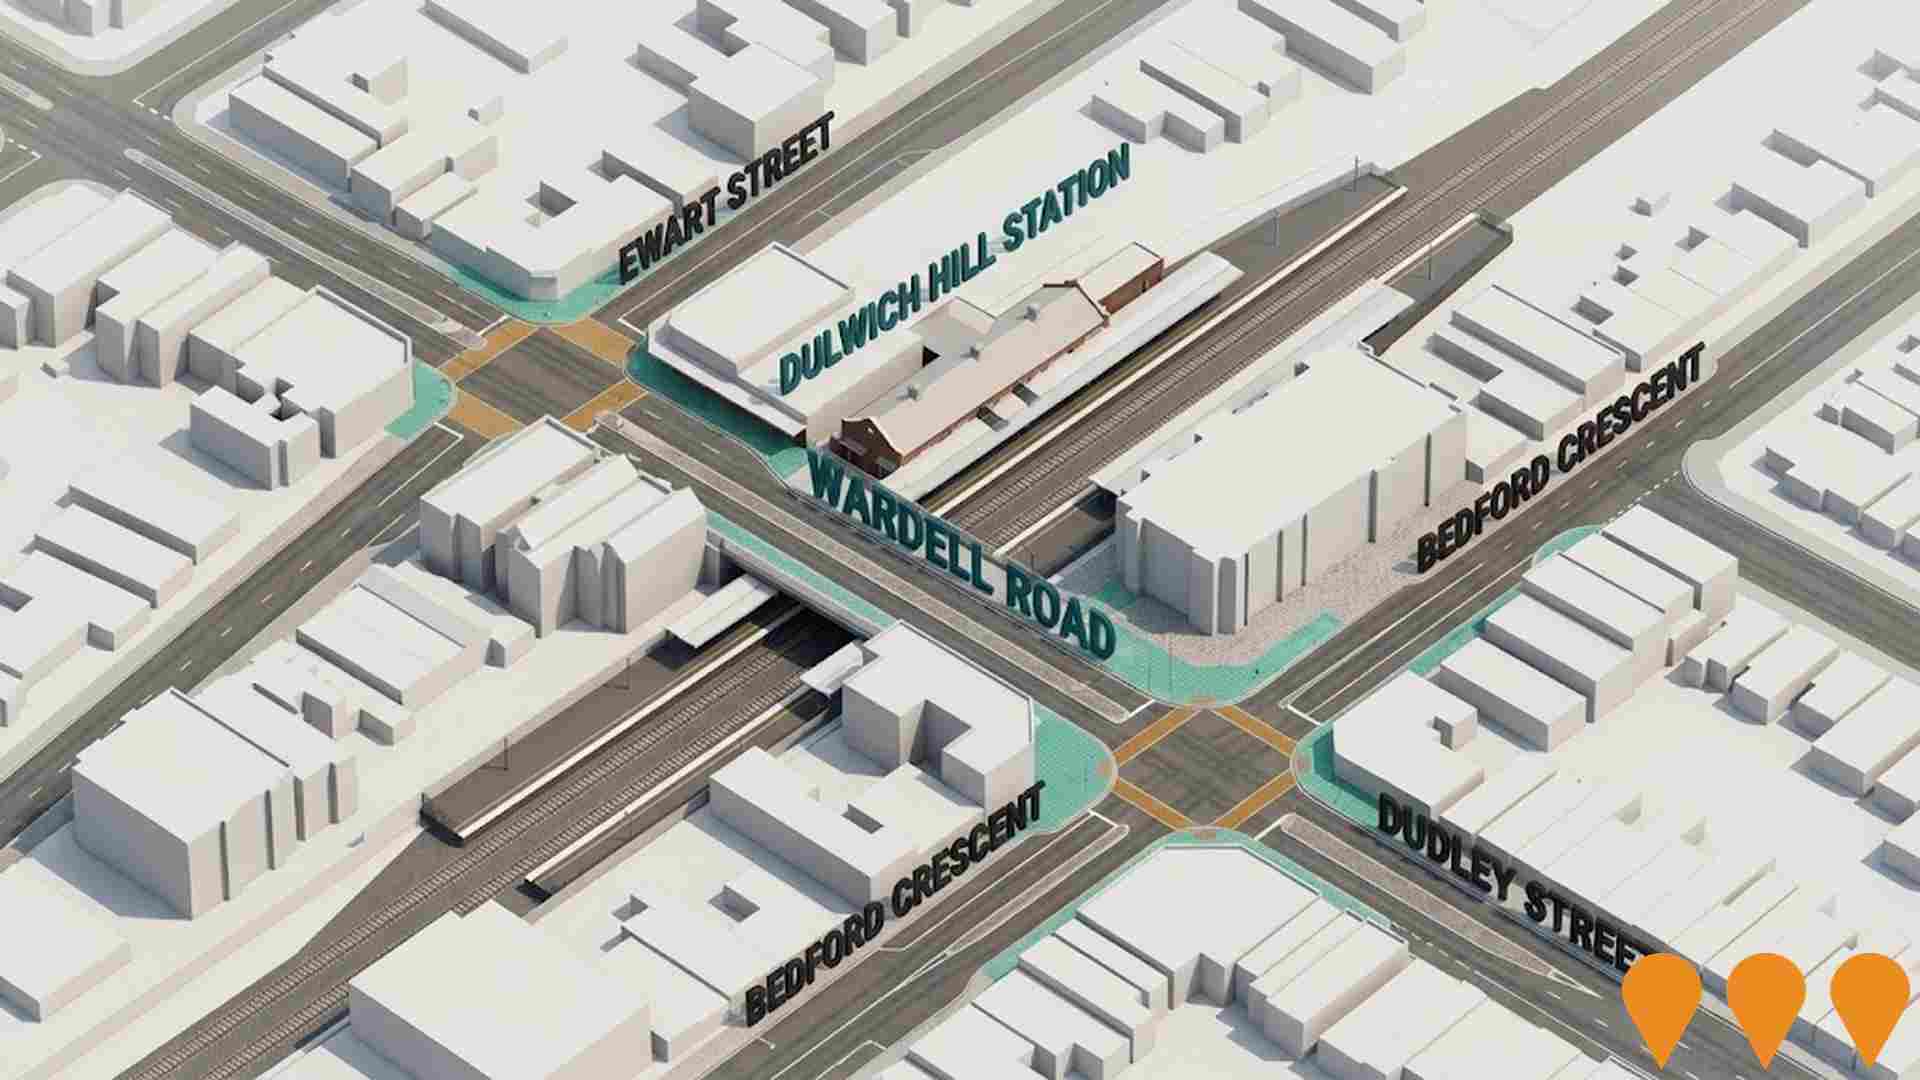
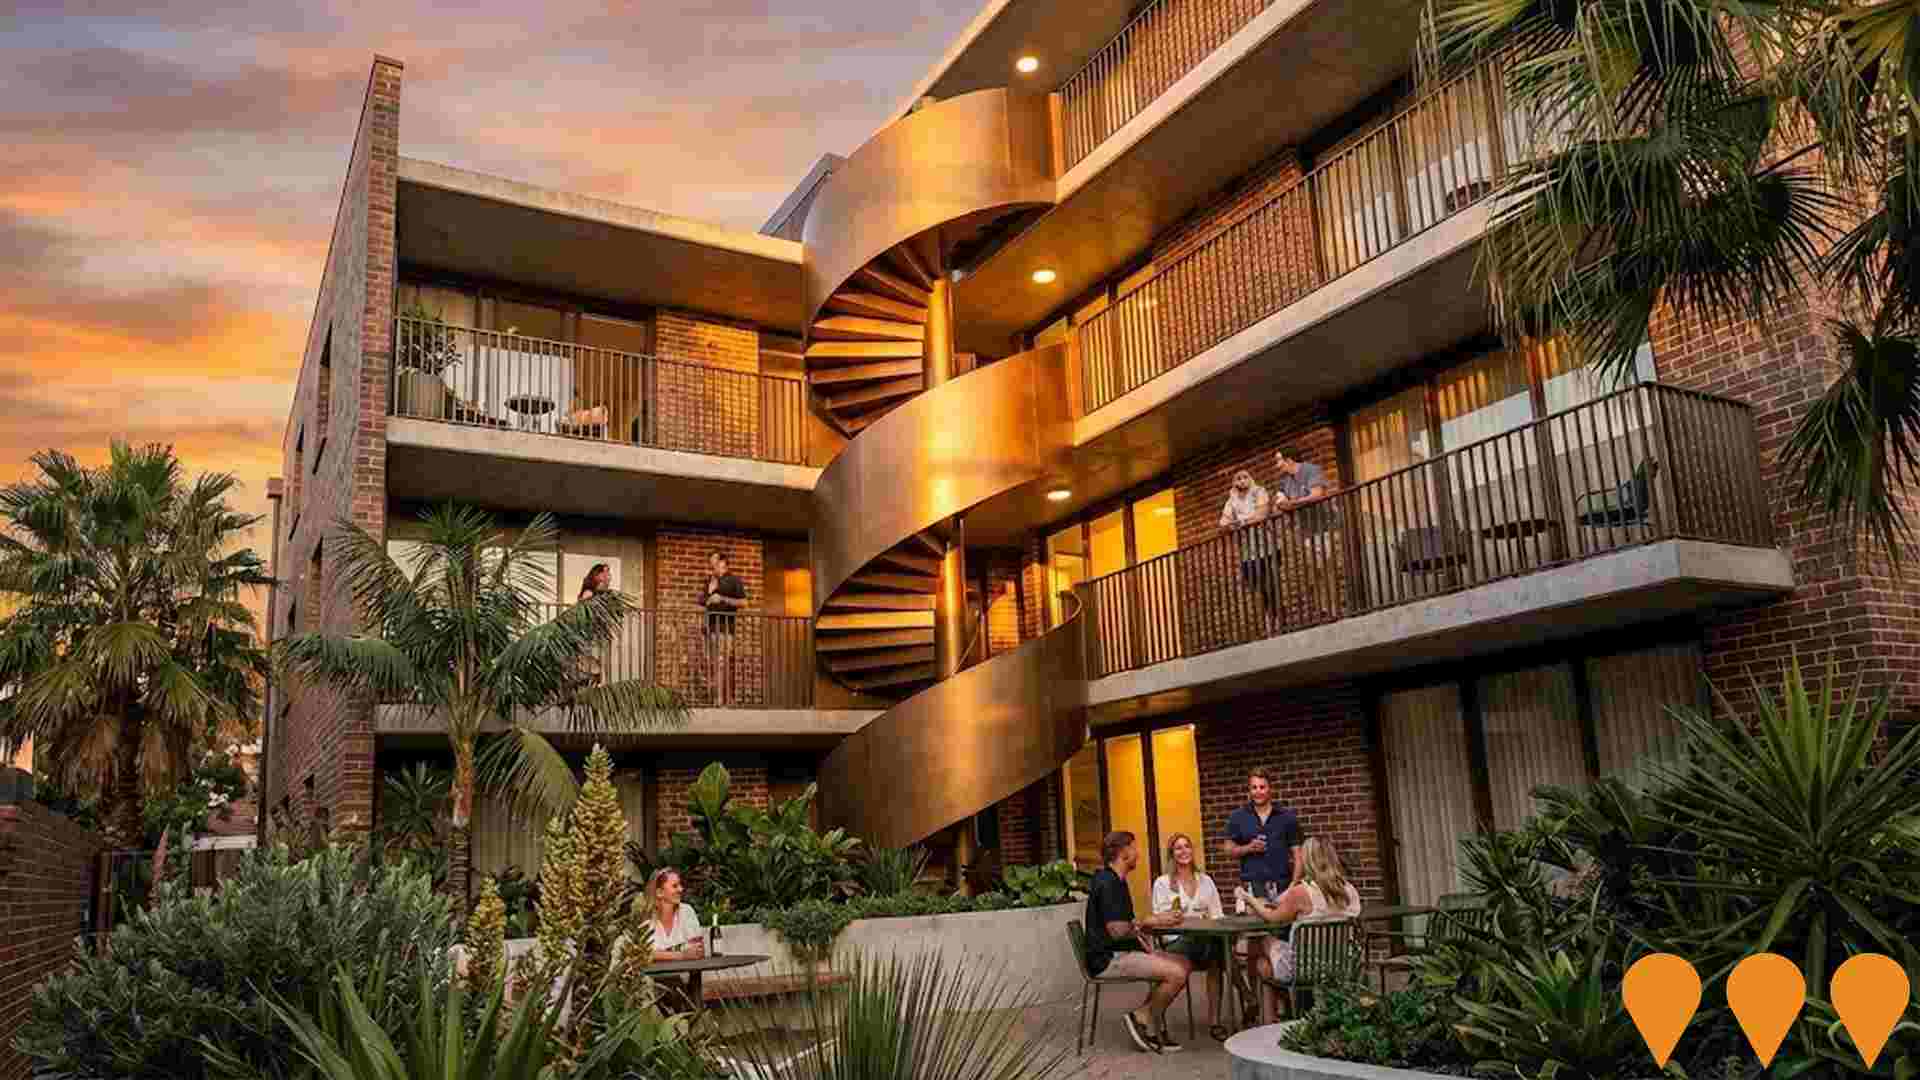
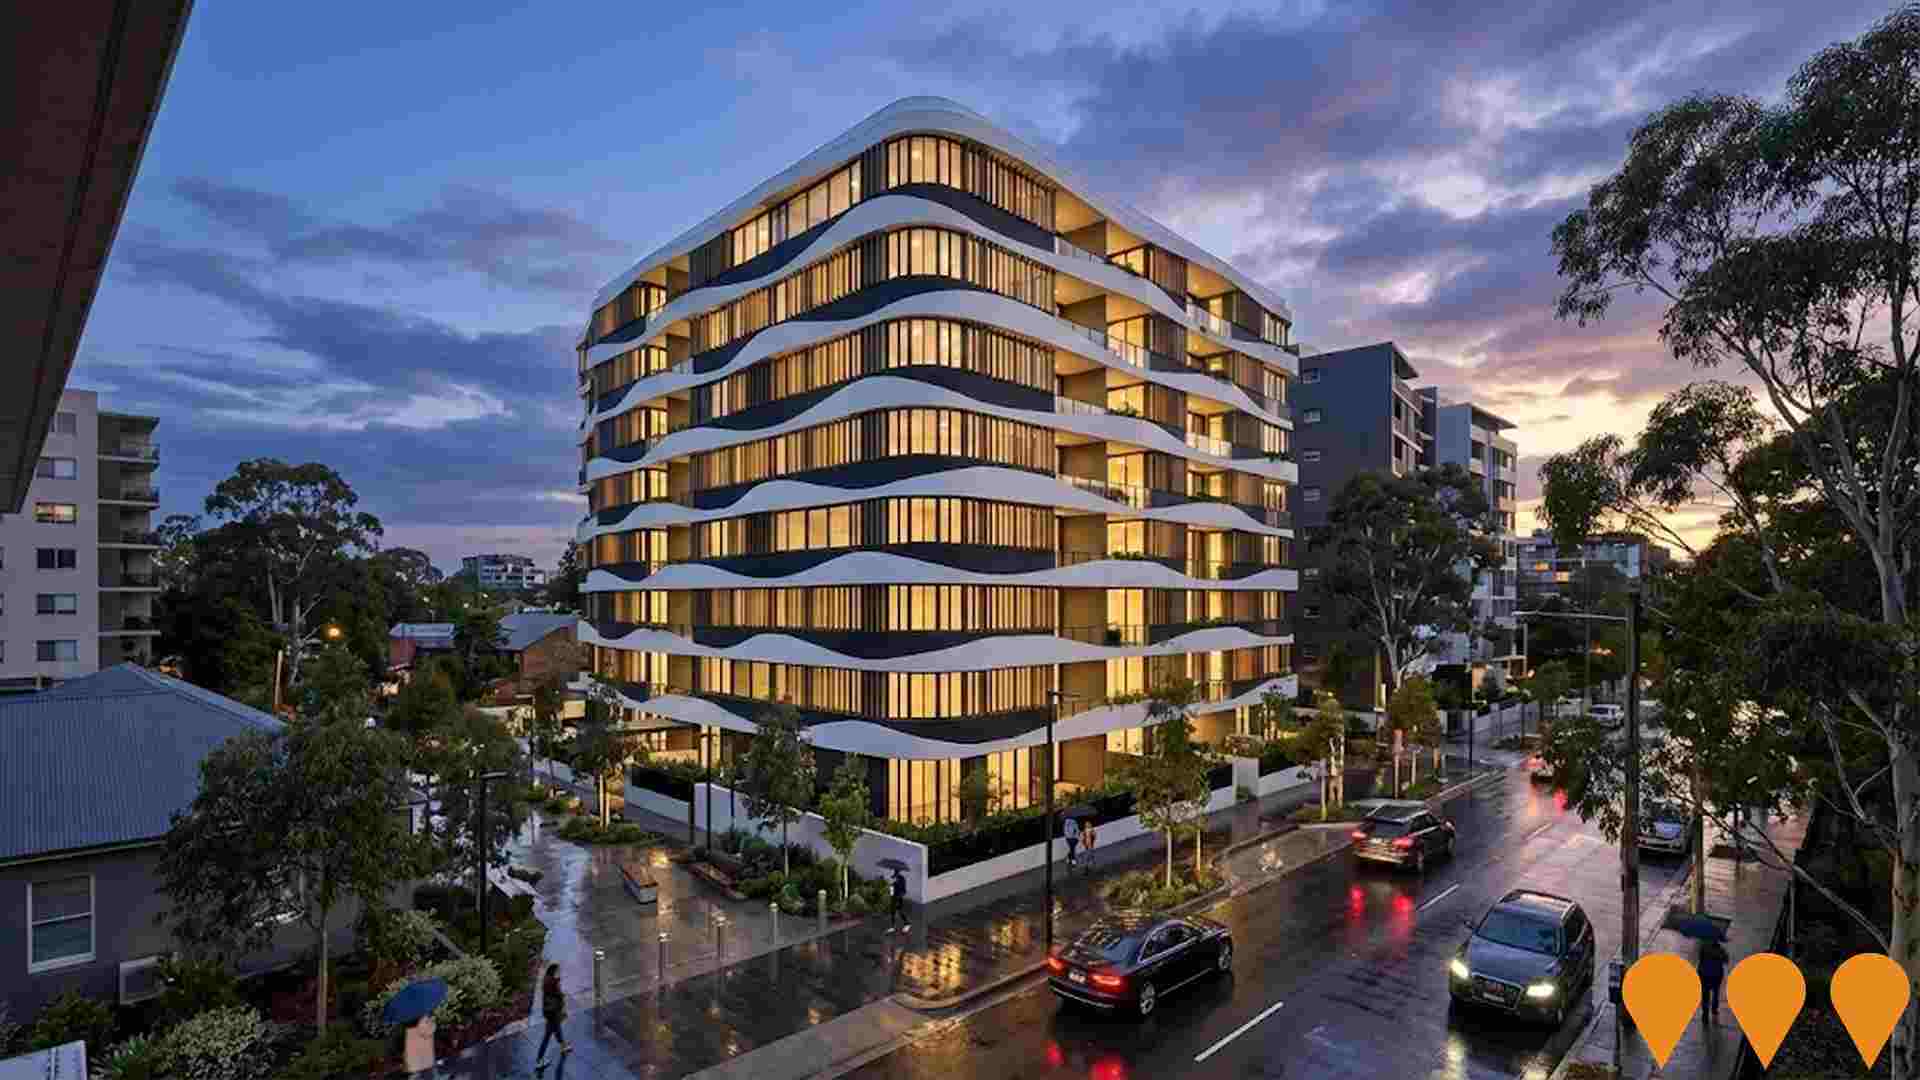
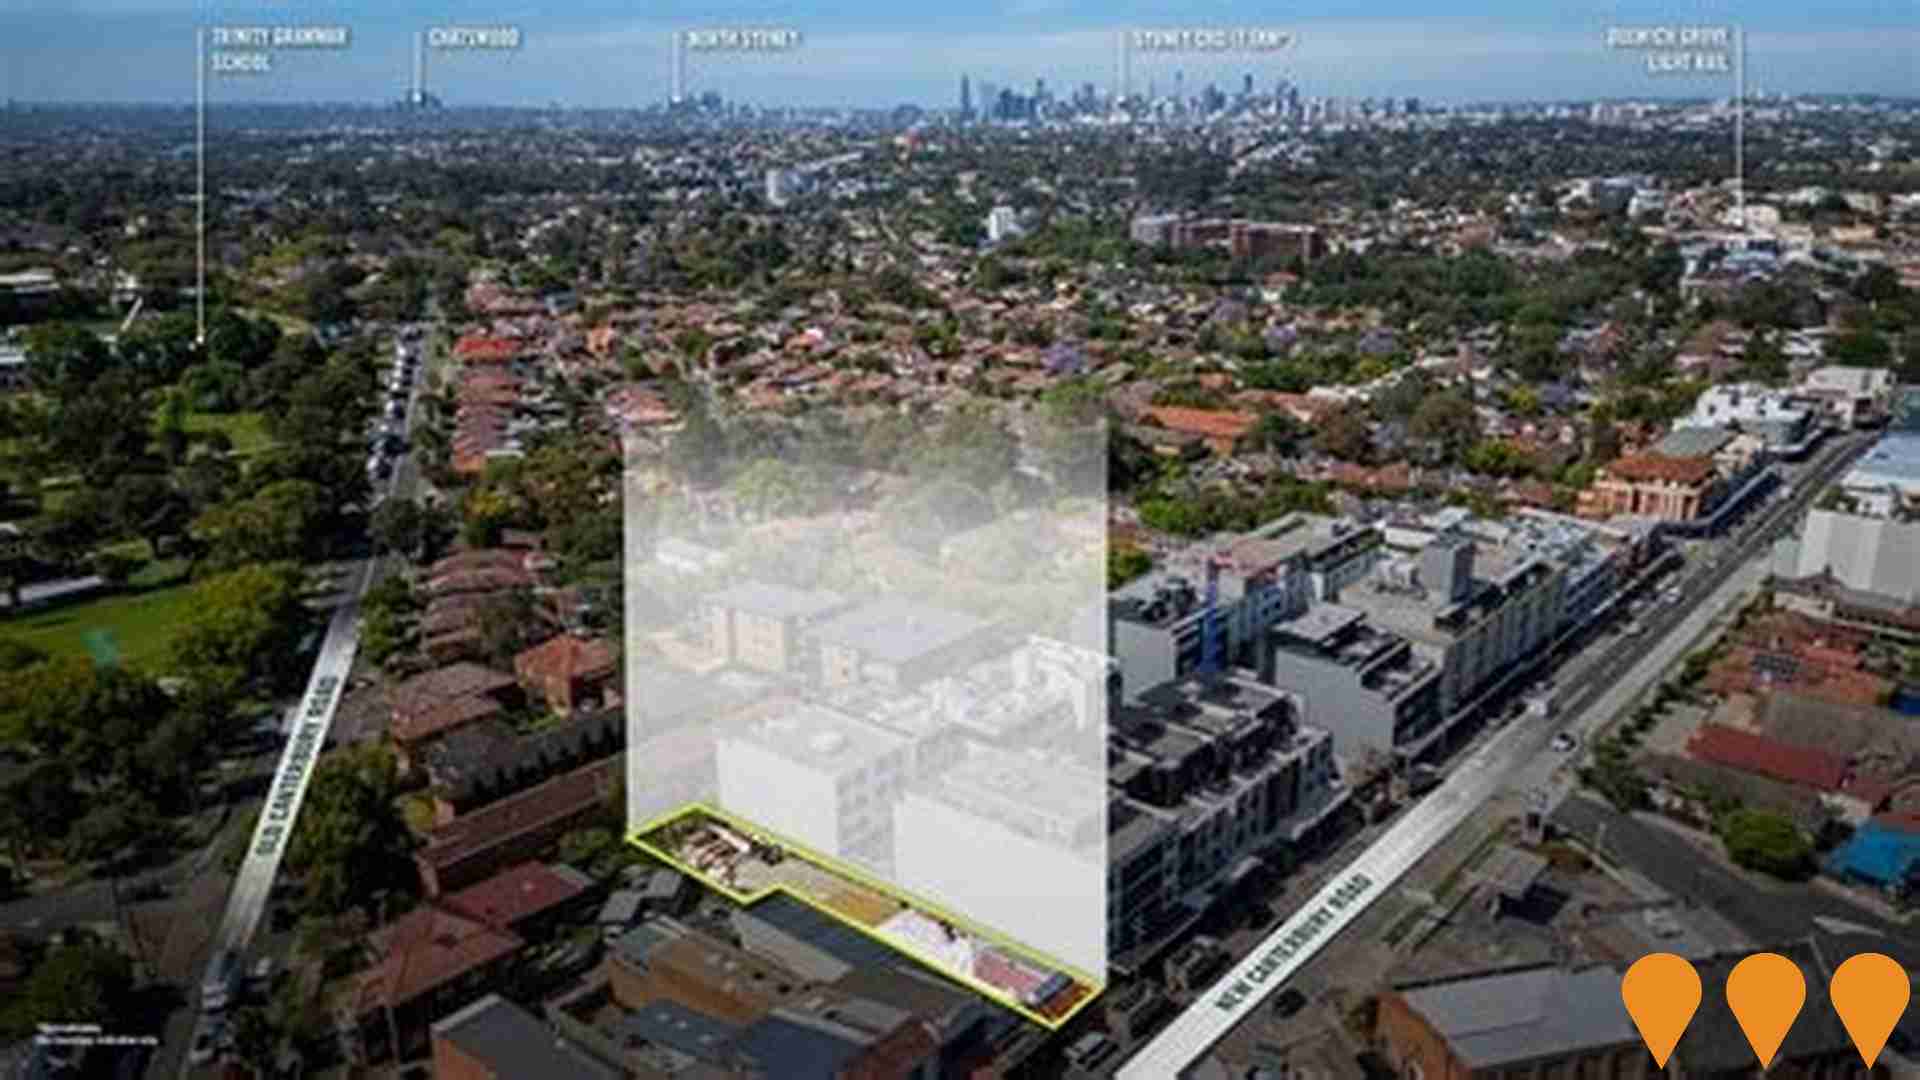
Changes to local infrastructure significantly impact an area's performance. AreaSearch has identified 57 projects that may affect this region. Notable ones include Sydney Metro Sydenham to Bankstown Conversion, Sydenham to Bankstown Transport Oriented Development Program, 845-847 New Canterbury Road Development, and Dulwich Hill Station Precinct Public Domain Improvements. The following list details those most likely to be relevant.
Professional plan users can use the search below to filter and access additional projects.
INFRASTRUCTURE SEARCH
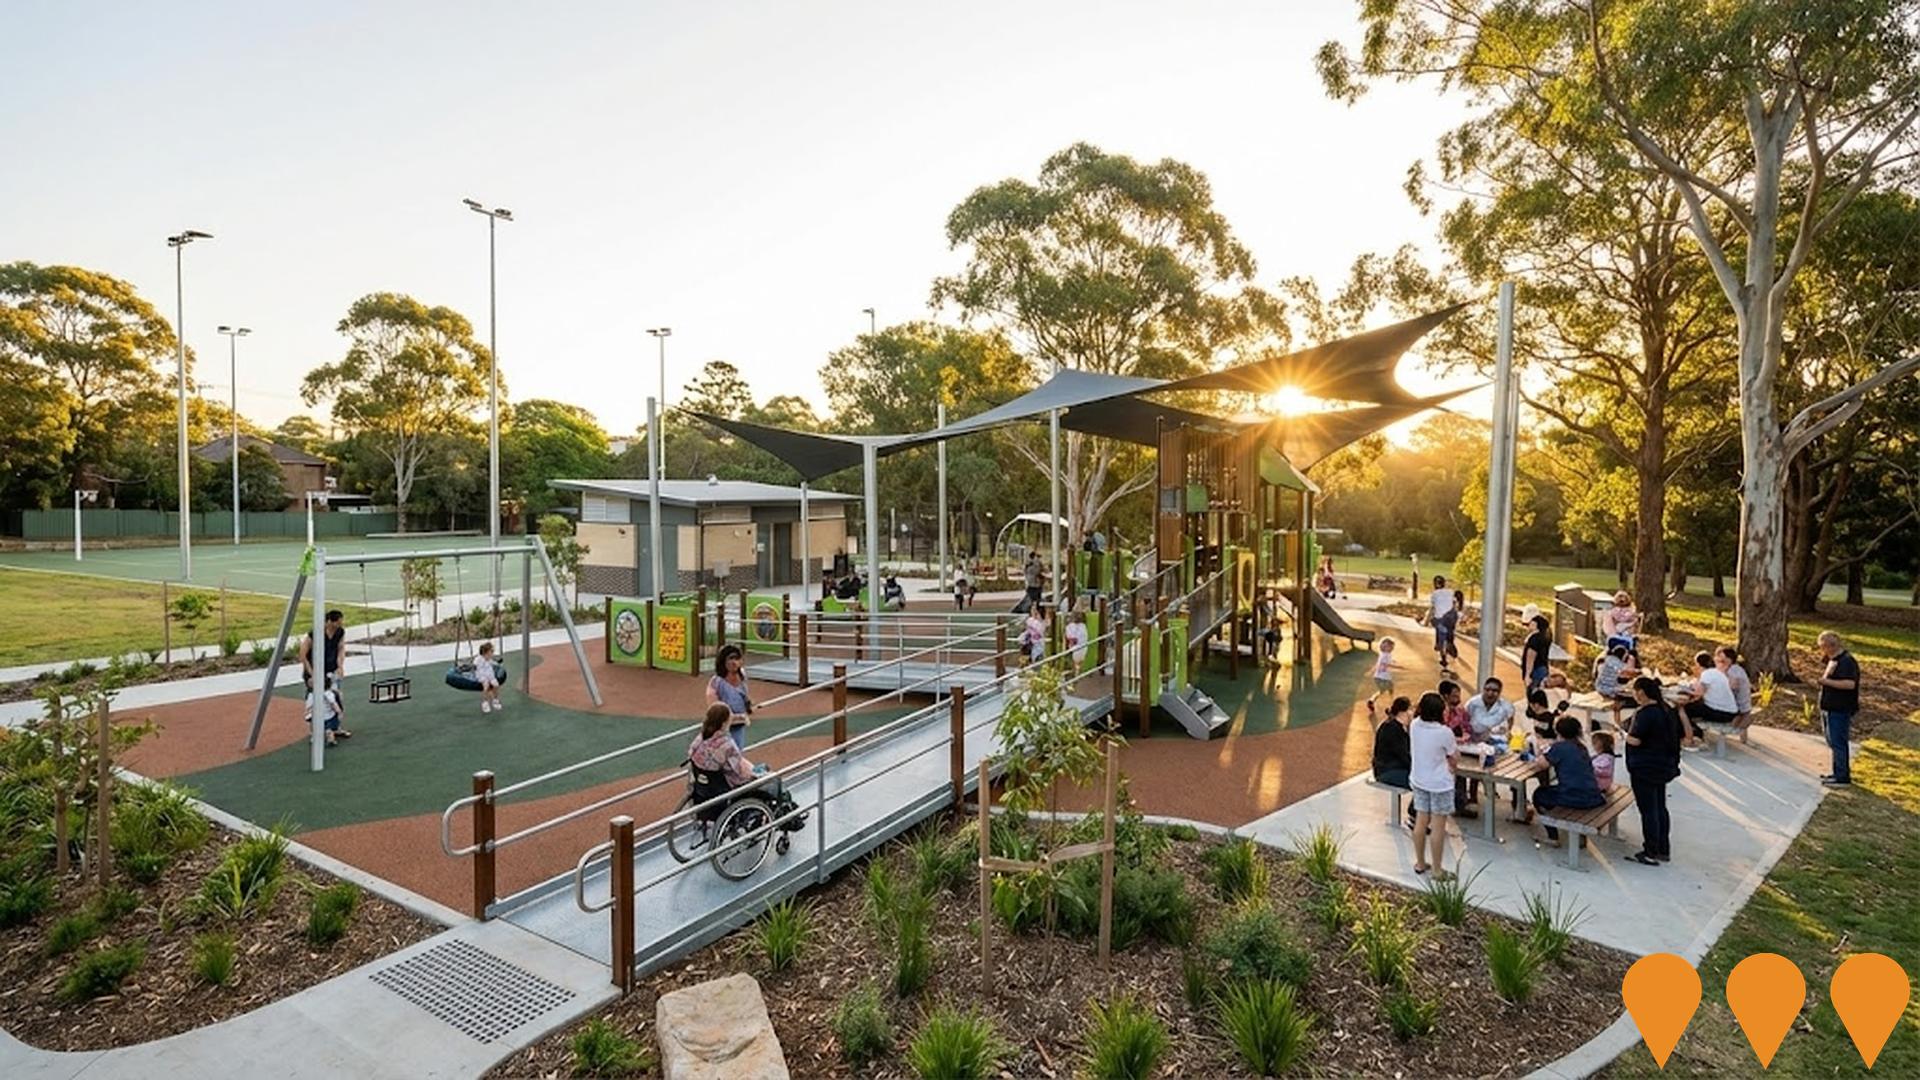
 Denotes AI-based impression for illustrative purposes only, not to be taken as definitive under any circumstances. Please follow links and conduct other investigations from the project's source for actual imagery. Developers and project owners wishing us to use original imagery please Contact Us and we will do so.
Frequently Asked Questions - Infrastructure
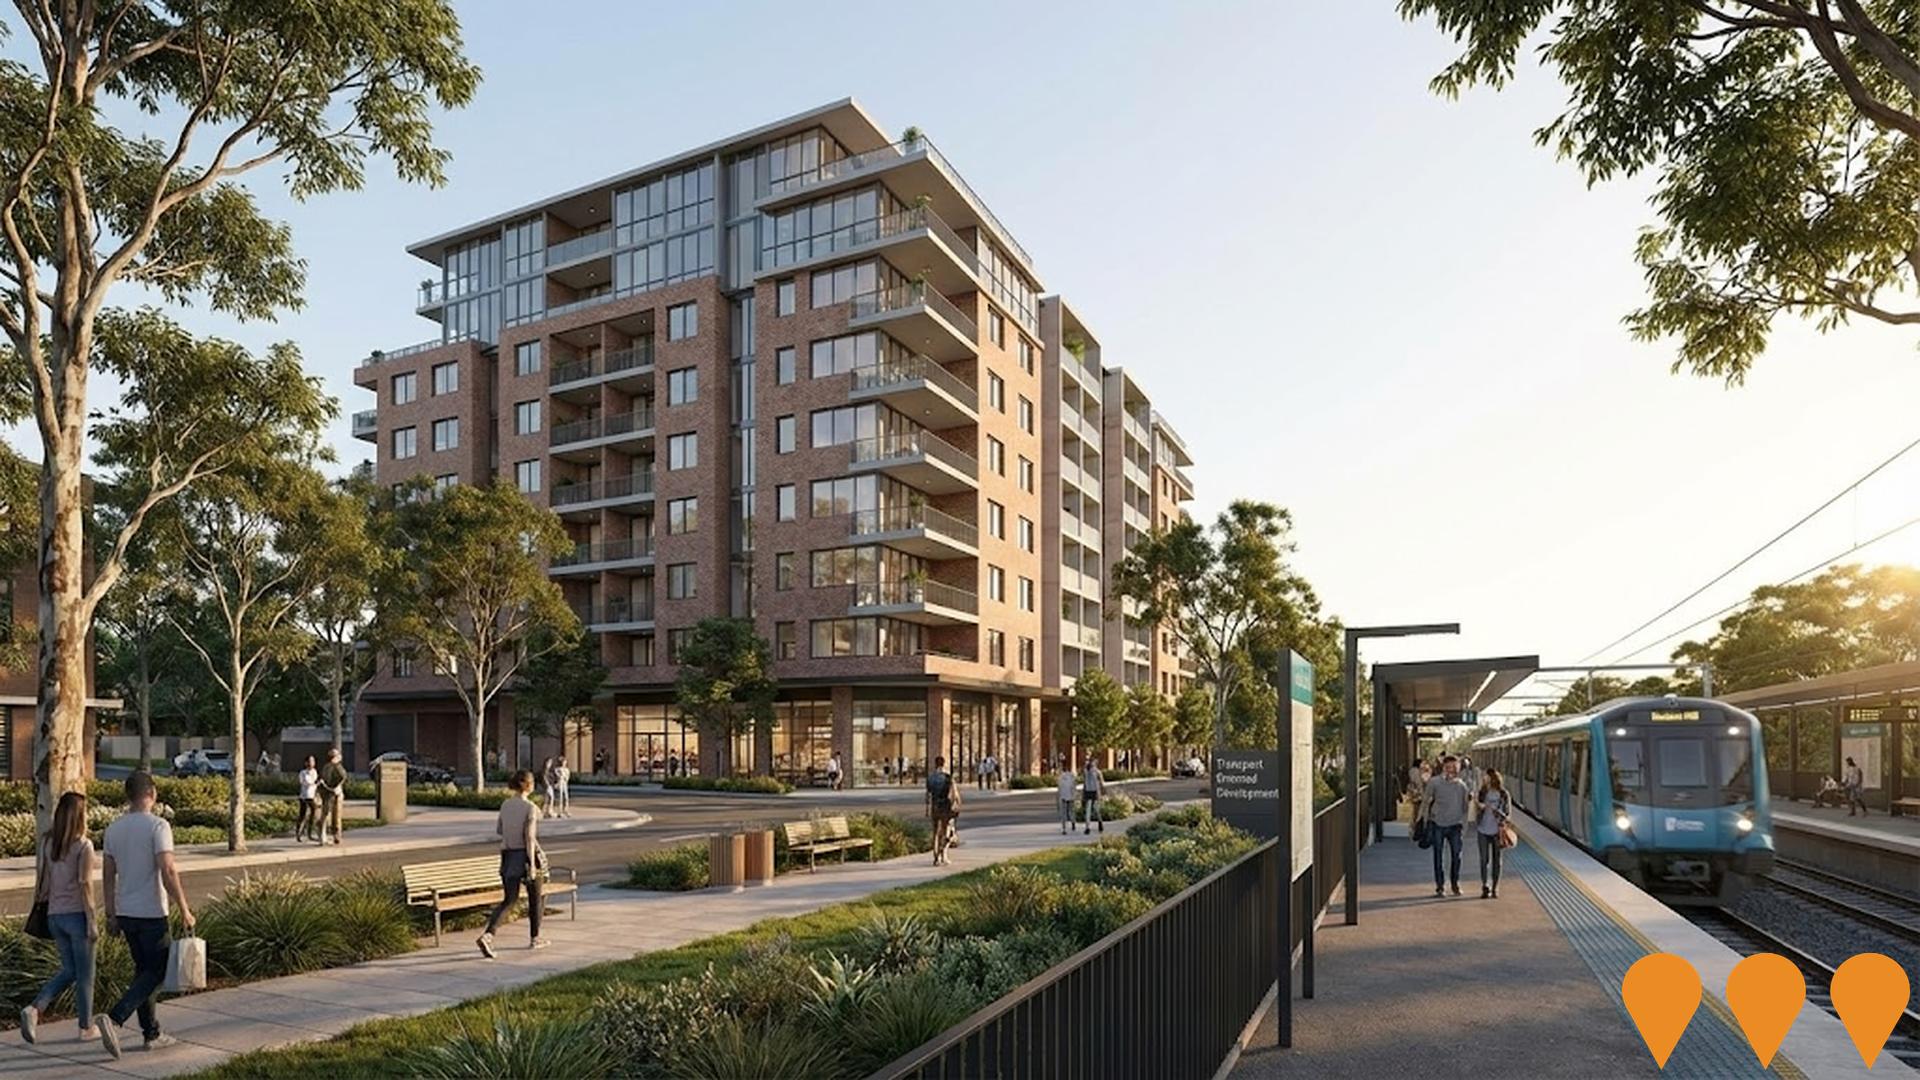
Sydenham to Bankstown Transport Oriented Development Program
The Sydenham to Bankstown Transport Oriented Development (TOD) Program provides a strategic planning framework to guide urban renewal along the Sydney Metro City & Southwest line corridor. The initial corridor strategy targeted approximately 35,000 new dwellings across 11 station precincts. The planning approach has evolved, with the NSW Government applying new, state-led TOD planning controls (rezoning) around 31 stations, including Dulwich Hill, to allow for more medium and high-rise housing (up to 9 storeys in some cases) within 400m of the station. This is intended to accelerate housing supply. The state-led TOD controls for the Dulwich Hill precinct were applied in January 2025. The overall Sydney Metro City & Southwest rail line conversion is a related project, which is currently in the construction phase and is expected to be completed in 2026.
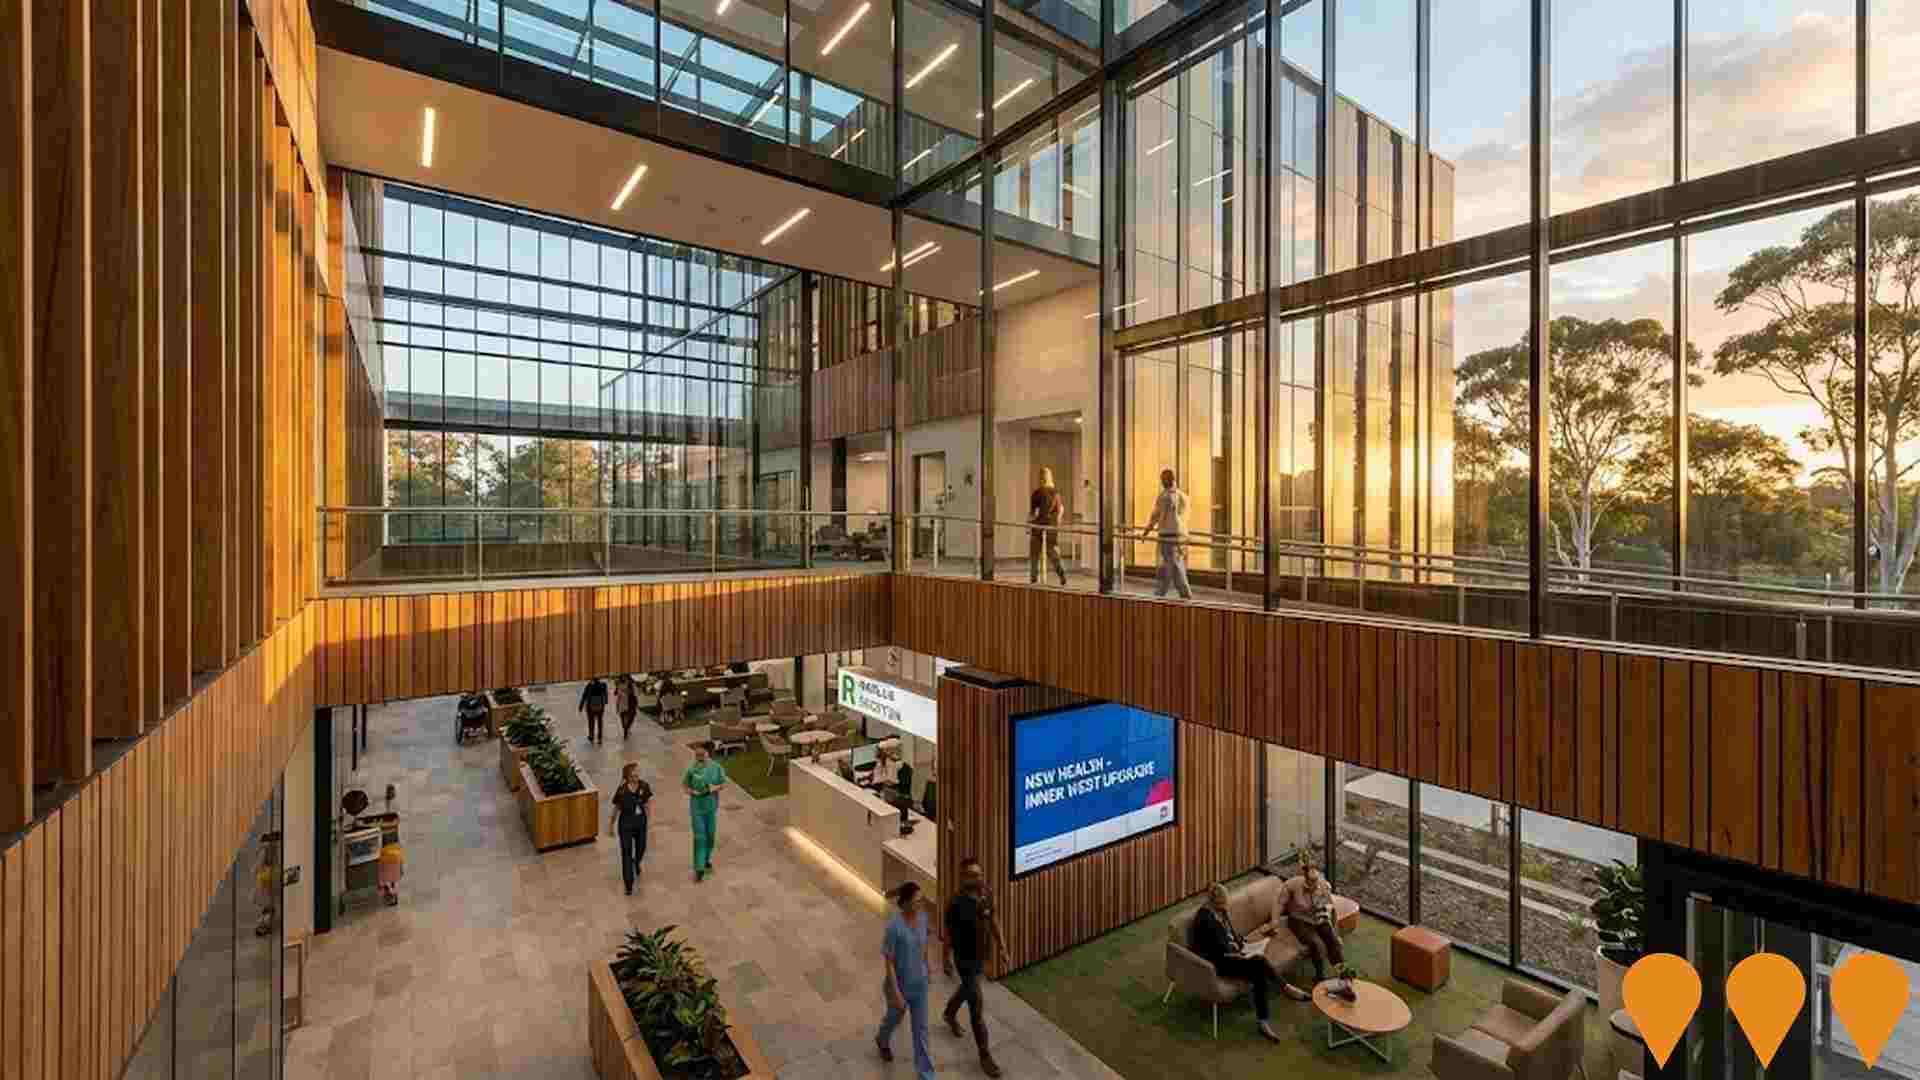
NSW Health Infrastructure Program - Inner West
Part of a $3.4 billion NSW health infrastructure investment, this program includes ongoing hospital upgrades, health facility improvements, and critical maintenance across the Inner West communities. The program is delivered by Health Infrastructure, which manages major health capital projects over $10 million in NSW.
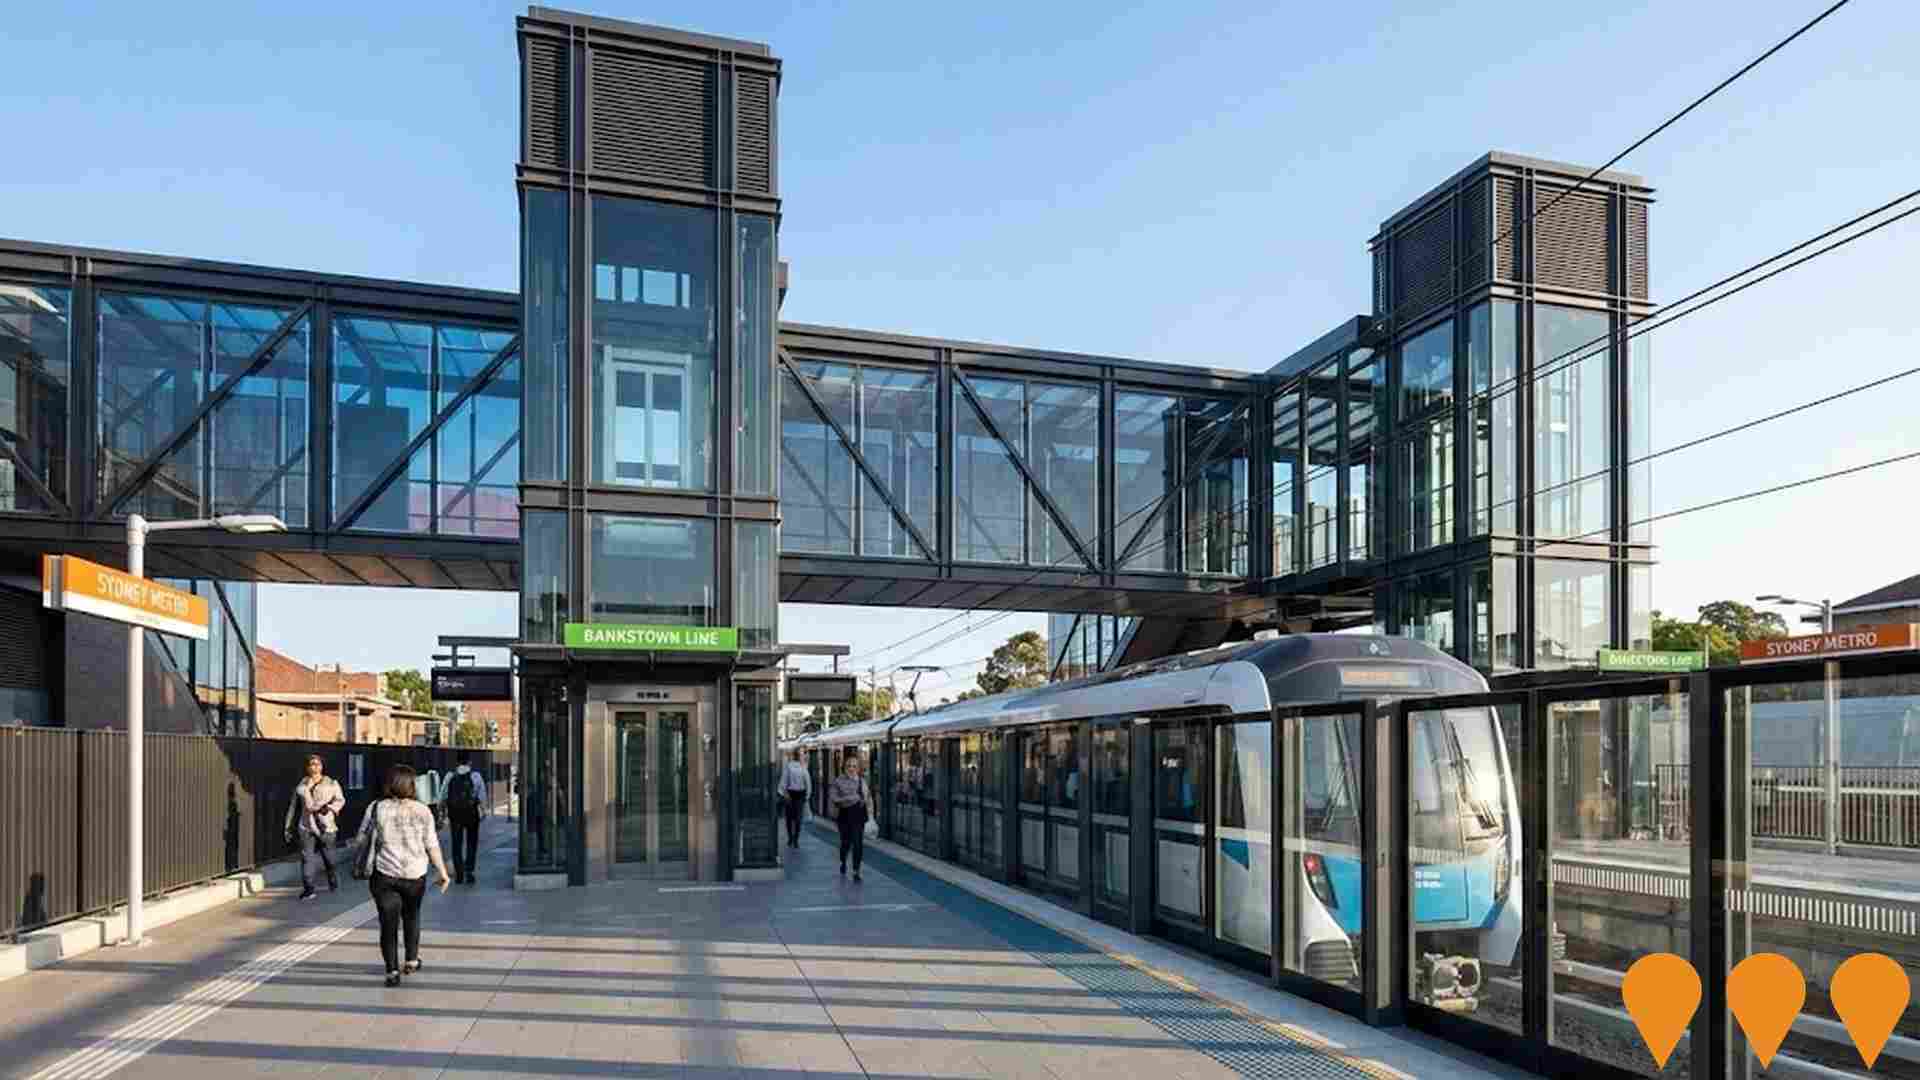
Sydney Metro Sydenham to Bankstown Conversion
Conversion of the existing T3 Bankstown Line (between Sydenham and Bankstown) to modern, high-tech metro standards as part of the Sydney Metro City & Southwest project. The upgrade includes new air-conditioned metro trains running every 4 minutes in peak (15 trains per hour), platform screen doors, new lifts for full accessibility, level access between platforms and trains, and new concourses. Dulwich Hill Station is one of the ten stations being upgraded. The full closure of the line for final conversion works began in September 2024.
Inner West Housing Investigation Areas
Council-led comprehensive housing strategy (Our Fairer Future Plan) focusing on Housing Investigation Areas around transport nodes including Ashfield, Croydon, Dulwich Hill, Lewisham, Marrickville and others. Includes masterplans for increased density, new parks, plazas, multi-purpose libraries, walking/cycling paths, improved public domain and transport connections. Part of Inner West Council's alternative to NSW Government TOD reforms.

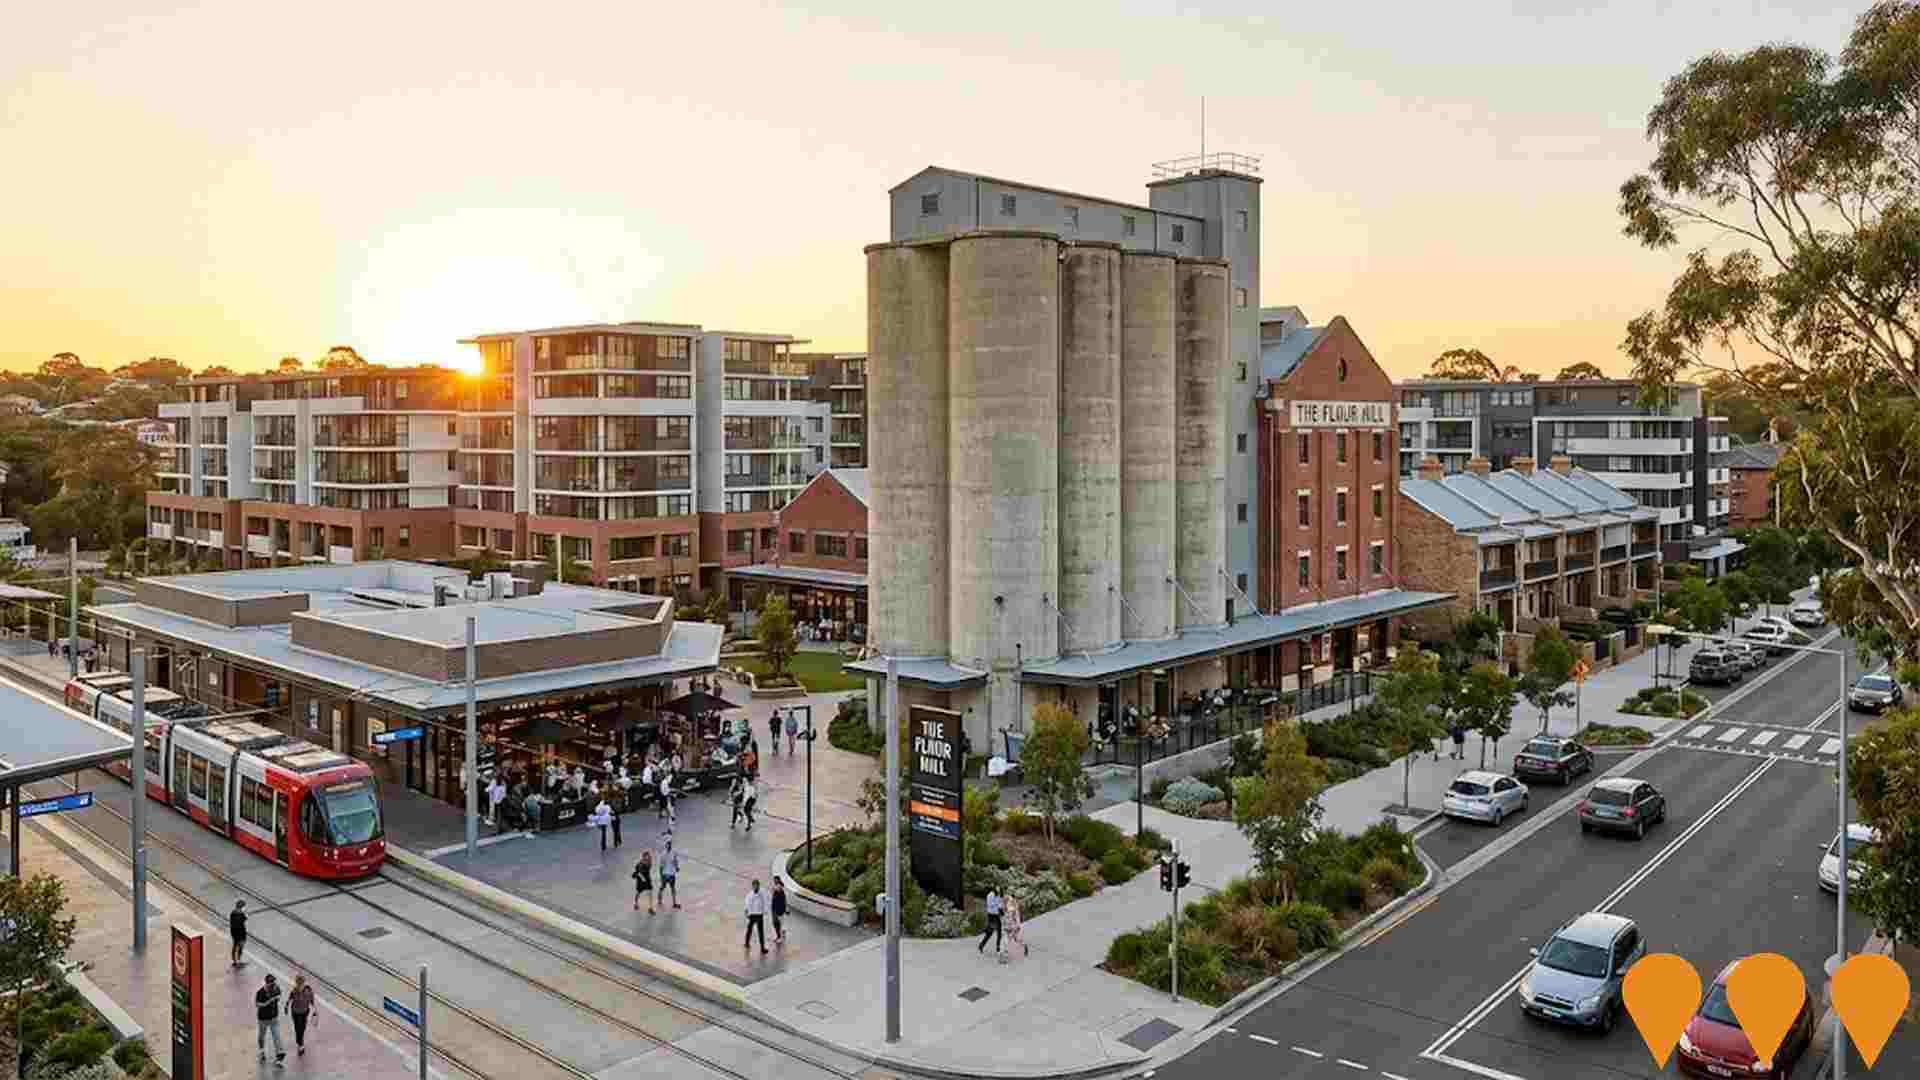
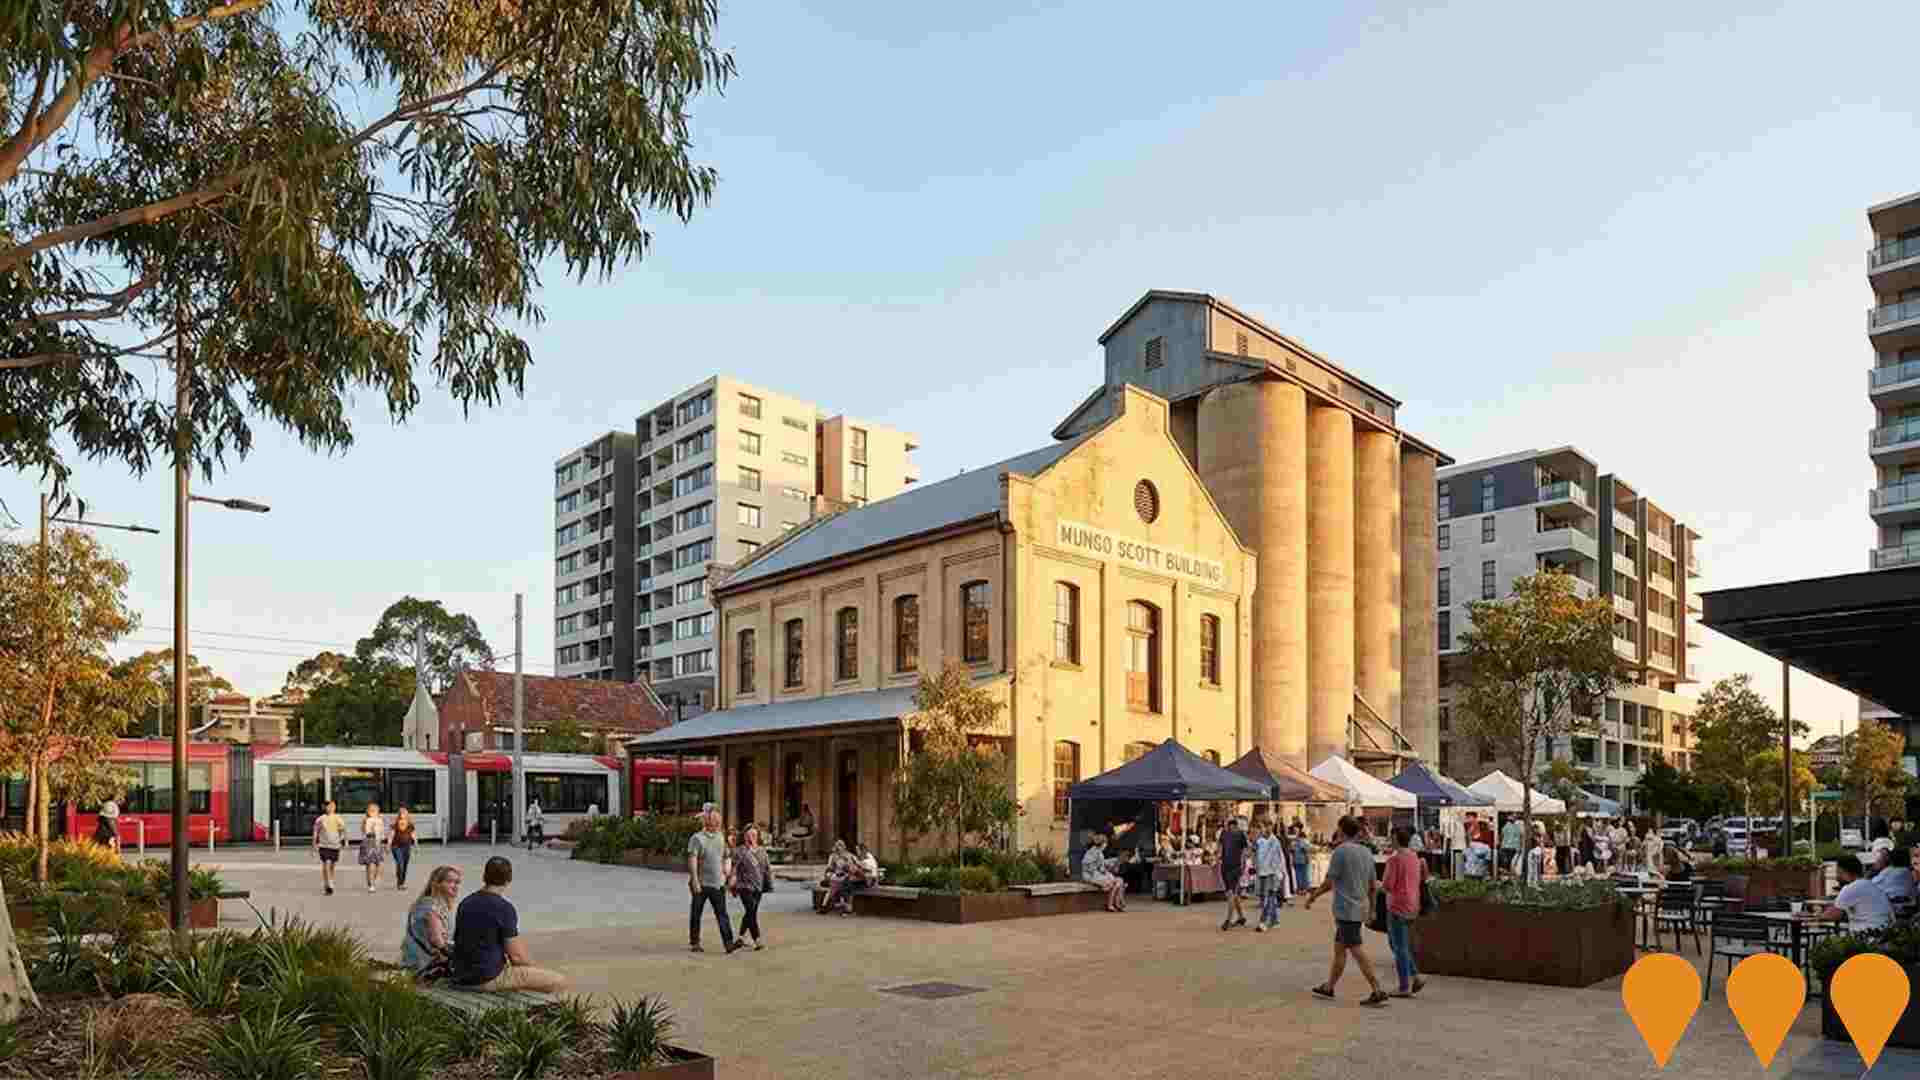
The Flour Mill of Summer Hill
A significant urban renewal, master-planned community development transforming the former Allied Mills Flour Mill site. Features 360 apartments and terrace houses, heritage restoration including the iconic silos and former flour mill bakery building, ground-floor retail and commercial spaces, and new public plazas connected to the Lewisham West Light Rail and Summer Hill Station. The final stage was completed in early 2019.
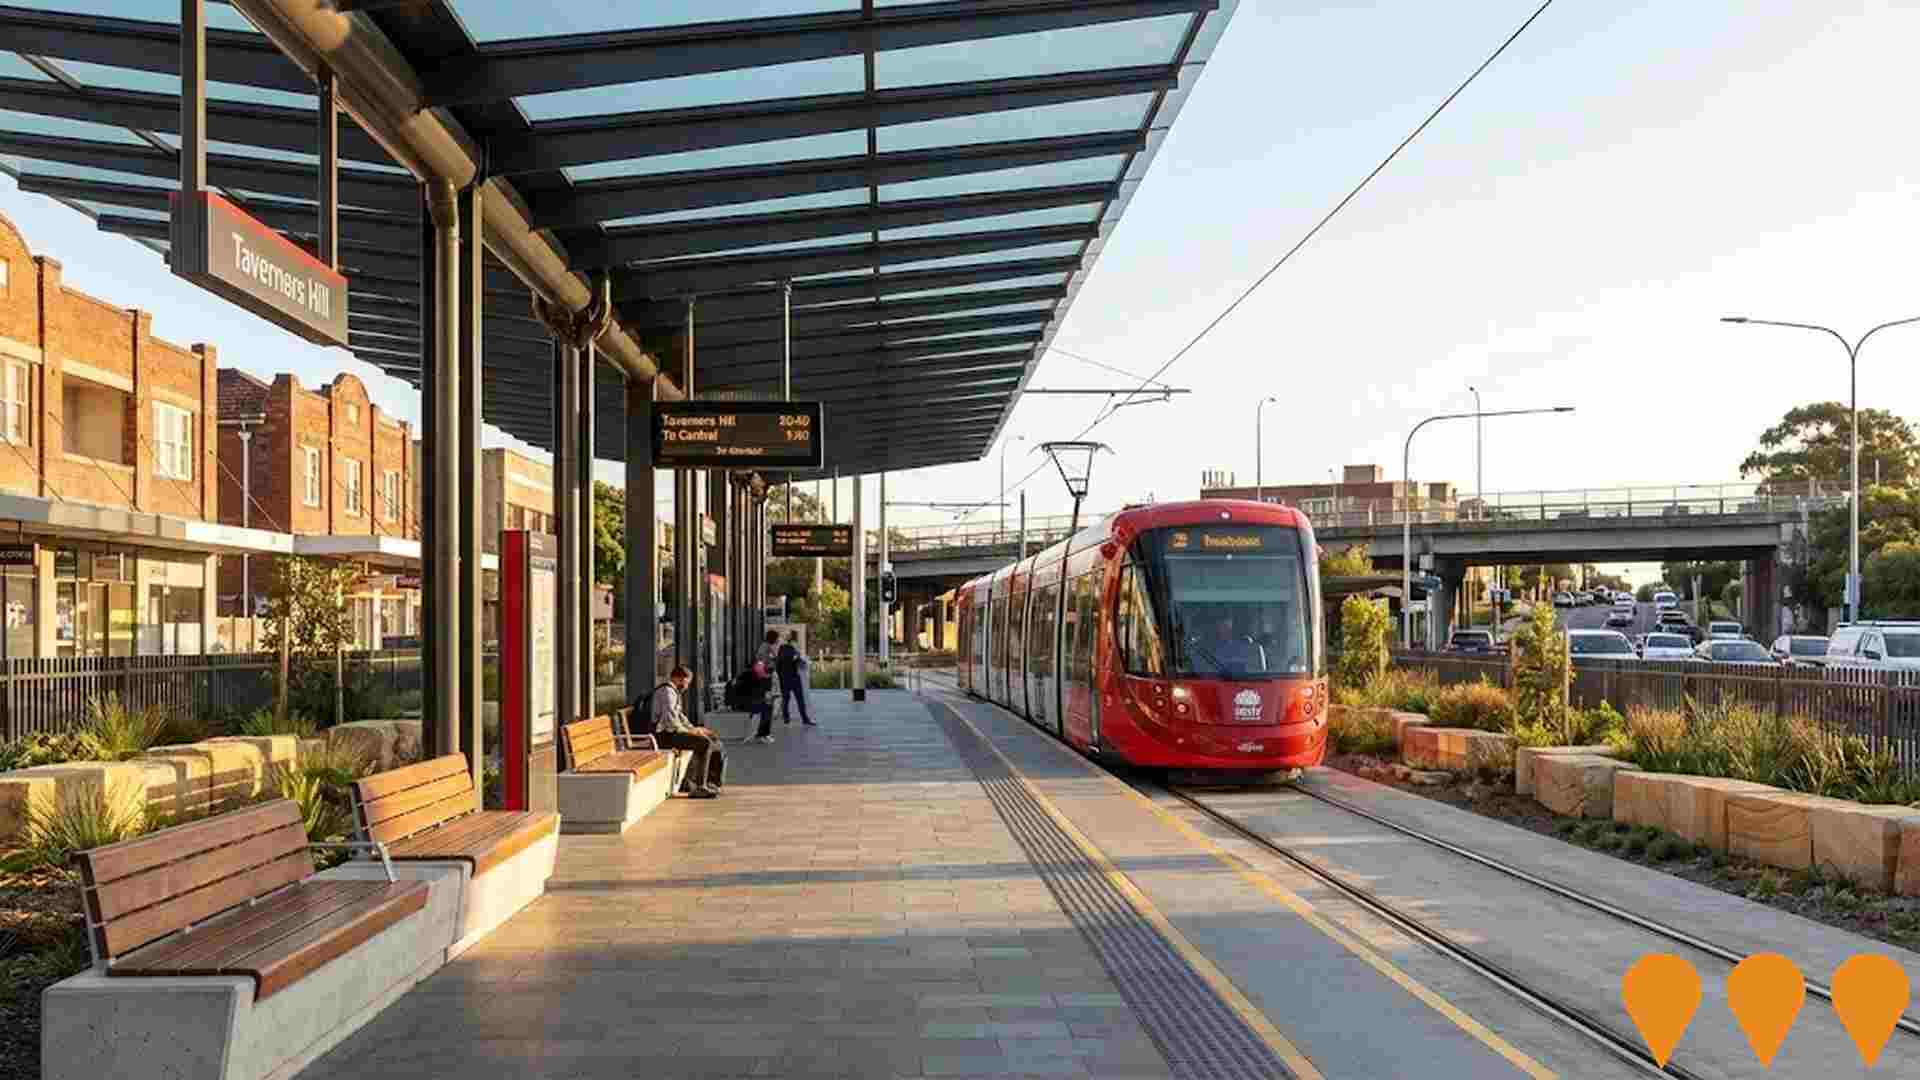
Inner West Light Rail Extension
5.6km light rail extension from Lilyfield to Dulwich Hill with 9 new stops including Taverners Hill (near Summer Hill). Part of Sydney's expanding light rail network providing improved public transport connectivity for the Inner West.
The Flour Mill of Summer Hill
The Flour Mill of Summer Hill is a completed master-planned community redevelopment of the former Allied Mills Flour Mill site, including adaptive reuse of heritage industrial buildings like the Mungo Scott Building and silos. The project delivered 360 apartments and terraces, along with retail and commercial space, and public open space dedicated to Council. It is located near Summer Hill Station and the Lewisham West light rail stop.
Cardinal Freeman Final Release Development - Wattle Building
The final stage of development at Cardinal Freeman retirement village, featuring the new Wattle building with 41 contemporary independent living apartments. This represents the last opportunity to secure brand-new apartments in this highly sought-after Inner West retirement community. Construction began April 2025 following demolition of the original Building One, with sales launching November 2025 and move-in Spring 2026.

Employment
Despite maintaining a low unemployment rate of 3.8%, Haberfield - Summer Hill has experienced recent job losses, resulting in a below average employment performance ranking when compared nationally
Haberfield-Summer Hill has an educated workforce with a notable technology sector presence and a low unemployment rate of 3.8% as of September 2025. The area's employment rate is below Greater Sydney's at 4.2%, with a higher participation rate of 66.6%.
Key industries include professional & technical services, health care & social assistance, and education & training. Professional & technical jobs are particularly prevalent, at 1.4 times the regional average, while construction jobs are lower at 5.6% compared to the region's 8.6%. Over a year ending in September 2025, labour force remained stable while employment decreased by 0.5%, leading to an unemployment rate increase of 0.5 percentage points. In contrast, Greater Sydney saw employment growth of 2.1% and labour force growth of 2.4%, with a smaller unemployment rate rise of 0.2 percentage points.
Statewide in NSW as of 25-Nov-25, employment contracted by 0.03%, with an unemployment rate of 3.9%. Nationally, the unemployment rate was 4.3%. Jobs and Skills Australia projects national employment growth of 6.6% over five years and 13.7% over ten years. Applying these projections to Haberfield-Summer Hill's industry mix suggests local employment could increase by 7.2% in five years and 14.5% in ten years, though these estimates are illustrative and do not account for local population changes.
Frequently Asked Questions - Employment
Income
The economic profile demonstrates exceptional strength, placing the area among the top 10% nationally based on comprehensive AreaSearch income analysis
According to AreaSearch's aggregation of ATO data released for financial year 2022, Haberfield - Summer Hill SA2 had a median income among taxpayers of $68,214 and an average level of $107,074. These figures are exceptionally high nationally compared to Greater Sydney's levels of $56,994 and $80,856 respectively. Based on Wage Price Index growth of 12.61% from financial year 2022 to September 2025, current estimates would be approximately $76,816 for median income and $120,576 for average income. According to the 2021 Census figures, household, family, and personal incomes in Haberfield - Summer Hill rank highly nationally, between the 87th and 90th percentiles. Income analysis shows that the $4000+ bracket dominates with 28.9% of residents (4,048 people), differing from regional patterns where the $1,500 - 2,999 bracket dominates at 30.9%. Economic strength is evident through 40.8% of households achieving high weekly earnings exceeding $3,000, supporting elevated consumer spending. High housing costs consume 15.9% of income, but strong earnings place disposable income at the 85th percentile nationally. The area's SEIFA income ranking places it in the 9th decile.
Frequently Asked Questions - Income
Housing
Haberfield - Summer Hill displays a diverse mix of dwelling types, with above-average rates of outright home ownership
In Haberfield-Summer Hill, the dwelling structure as per the latest Census showed 45.2% houses and 54.8% other dwellings (semi-detached, apartments, 'other'). This compares to Sydney metro's 33.5% houses and 66.5% other dwellings. Home ownership in Haberfield-Summer Hill stood at 33.6%, with mortgaged dwellings at 30.0% and rented ones at 36.4%. The median monthly mortgage repayment was $3,000, higher than Sydney metro's average of $2,436. The median weekly rent was $470, compared to Sydney metro's $465. Nationally, Haberfield-Summer Hill's mortgage repayments were significantly higher at $1,863 and rents substantially above the national figure of $375.
Frequently Asked Questions - Housing
Household Composition
Haberfield - Summer Hill features high concentrations of group households, with a lower-than-average median household size
Family households constitute 67.2% of all households, including 31.5% couples with children, 25.5% couples without children, and 9.1% single parent families. Non-family households comprise the remaining 32.8%, with lone person households at 28.2% and group households making up 4.6%. The median household size is 2.4 people, which is smaller than the Greater Sydney average of 2.5.
Frequently Asked Questions - Households
Local Schools & Education
Haberfield - Summer Hill shows strong educational performance, ranking in the upper quartile nationally when assessed across multiple qualification and achievement indicators
Educational attainment in Haberfield-Summer Hill is notably higher than national and state averages. Specifically, 50.3% of residents aged 15 years and over hold university qualifications compared to Australia's 30.4% and NSW's 32.2%. Bachelor degrees are the most prevalent (31.7%), followed by postgraduate qualifications (14.8%) and graduate diplomas (3.8%). Vocational pathways account for 21.7%, with advanced diplomas at 9.9% and certificates at 11.8%.
Educational participation is high, with 28.7% of residents currently enrolled in formal education. This includes 8.0% in primary education, 7.9% in tertiary education, and 7.2% pursuing secondary education.
Frequently Asked Questions - Education
Schools Detail
Nearby Services & Amenities
Transport
Transport servicing is high compared to other areas nationally based on assessment of service frequency, route connectivity and accessibility
Haberfield-Summer Hill has 58 active public transport stops, offering a mix of train and bus services. These stops are served by 36 unique routes, facilitating a total of 5,614 weekly passenger trips. The area's transport accessibility is rated excellent, with residents on average located 158 meters from the nearest stop.
On average, there are 802 trips per day across all routes, amounting to approximately 96 weekly trips per individual stop.
Frequently Asked Questions - Transport
Transport Stops Detail
Health
Haberfield - Summer Hill's residents are healthier than average in comparison to broader Australia with prevalence of common health conditions quite low across both younger and older age cohorts
Health data shows relatively positive outcomes for Haberfield-Summer Hill residents. The prevalence of common health conditions is low across both younger and older age cohorts. Approximately 75% (10,463 people) have private health cover, which is higher than Greater Sydney's 57.3% and the national average of 55.3%.
Mental health issues affect 9.4% of residents, while arthritis impacts 6.9%. About 69.9% declare themselves completely clear of medical ailments, compared to 77.0% across Greater Sydney. The area has 17.0% (2,378 people) aged 65 and over, higher than Greater Sydney's 14.5%. Health outcomes among seniors are above average, broadly in line with the general population's health profile.
Frequently Asked Questions - Health
Cultural Diversity
Haberfield - Summer Hill was found to be more culturally diverse than the vast majority of local markets in Australia, upon assessment of a range of language and cultural background related metrics
Haberfield-Summer Hill, compared to most local areas, had higher cultural diversity with 31.2% of residents born overseas and 27.3% speaking a language other than English at home. Christianity was the predominant religion, making up 48.3%. Judaism, at 0.4%, was overrepresented compared to Greater Sydney's 0.2%.
For ancestry, top groups were English (19.7%), Australian (17.3%), and Italian (12.9%), all higher than regional averages of 12.9%, 11.5%, and 5.9% respectively. Hungarian, Korean, and Spanish groups also showed notable differences in representation compared to regional figures.
Frequently Asked Questions - Diversity
Age
Haberfield - Summer Hill's population is slightly older than the national pattern
Haberfield-Summer Hill has a median age of 40, which is slightly higher than Greater Sydney's figure of 37 and Australia's figure of 38. Compared to Greater Sydney, the 55-64 age group is notably over-represented in Haberfield-Summer Hill at 12.4%, while the 5-14 age group is under-represented at 9.5%. From 2021 to present, the 15-24 age group has grown from 11.3% to 12.7% of the population. Conversely, the 5-14 age group has declined from 10.6% to 9.5%, and the 45-54 age group has dropped from 14.8% to 13.8%. By 2041, demographic modeling suggests Haberfield-Summer Hill's age profile will change significantly. The 75-84 age cohort is projected to increase by 345 people (45%), from 773 to 1,119. Notably, the combined 65+ age groups are expected to account for 97% of total population growth, reflecting the area's aging demographic profile. Meanwhile, the 45-54 and 0-4 age cohorts are expected to experience population declines.
