Chart Color Schemes
This analysis uses ABS Statistical Areas Level 2 (SA2) boundaries, which can materially differ from Suburbs and Localities (SAL) even when sharing similar names.
SA2 boundaries are defined by the Australian Bureau of Statistics and are designed to represent communities for statistical reporting (e.g., census and ERP).
Suburbs and Localities (SAL) represent commonly-used suburb/locality names (postal-style areas) and may use different geographic boundaries. For comprehensive analysis, consider reviewing both boundary types if available.
est. as @ -- *
ABS ERP | -- people | --
2021 Census | -- people
Sales Activity
Curious about local property values? Filter the chart to assess the volume and appreciation (including resales) trends and regional comparisons, or scroll to the map below view this information at an individual property level.
Find a Recent Sale
Sales Detail
Population
Dulwich Hill - Lewisham has seen population growth performance typically on par with national averages when looking at short and medium term trends
Dulwich Hill - Lewisham's population is approximately 19,036 as of November 2025. This figure represents an increase of 1,088 people since the 2021 Census, which reported a population of 17,948. The growth is inferred from the estimated resident population of 18,684 in June 2024 and the addition of 195 validated new addresses post-Census. This results in a population density of 7,050 persons per square kilometer, placing Dulwich Hill - Lewisham in the top 10% nationally. Over the past decade, the area has shown resilient growth with a compound annual growth rate of 0.8%, outperforming its SA4 region. Overseas migration drove population growth, contributing approximately 73.2% of overall gains recently.
AreaSearch uses ABS/Geoscience Australia projections for each SA2 area, released in 2024 with a base year of 2022. For areas not covered by this data, NSW State Government's SA2 level projections from 2022 using a base year of 2021 are applied. Growth rates by age group from these aggregations are used for all areas from 2032 to 2041. Future demographic trends suggest lower quartile growth nationally, with Dulwich Hill - Lewisham expected to grow by 315 persons by 2041 based on the latest annual ERP population numbers, reflecting a total reduction of 0.2% over 17 years.
Frequently Asked Questions - Population
Development
AreaSearch assessment of residential development drivers sees a low level of activity in Dulwich Hill - Lewisham, placing the area among the bottom 25% of areas assessed nationally
Dulwich Hill - Lewisham has seen approximately 36 new homes approved annually. Over the past five financial years, from FY21 to FY25, around 184 homes were approved, with a further 145 approved in FY26 up until now. On average, about 1.4 people have moved to the area each year for every dwelling built during these five financial years. However, recent data shows this ratio has increased to 31.2 people per dwelling over the past two financial years, suggesting growing popularity and potential undersupply.
The average expected construction cost value of new homes is approximately $291,000, which aligns with regional patterns. This year alone, around $5.7 million in commercial approvals have been registered, indicating the area's residential character. Compared to Greater Sydney, Dulwich Hill - Lewisham has significantly less development activity, at 60.0% below the regional average per person. This constrained new construction typically reinforces demand and pricing for existing dwellings. When compared nationally, the area also reflects market maturity and potential development constraints. The current new building activity comprises approximately 12.0% detached houses and 88.0% medium to high-density housing. This shift towards compact living offers affordable entry pathways and attracts downsizers, investors, and first-time purchasers, marking a notable change from the area's existing housing composition of 29.0% houses.
With around 1962 people per dwelling approval, Dulwich Hill - Lewisham indicates a highly mature market. Given stable or declining population projections, the area is expected to experience reduced housing demand pressures in the future, benefiting potential buyers.
Frequently Asked Questions - Development
Infrastructure
Dulwich Hill - Lewisham has very high levels of nearby infrastructure activity, ranking in the top 10% nationally
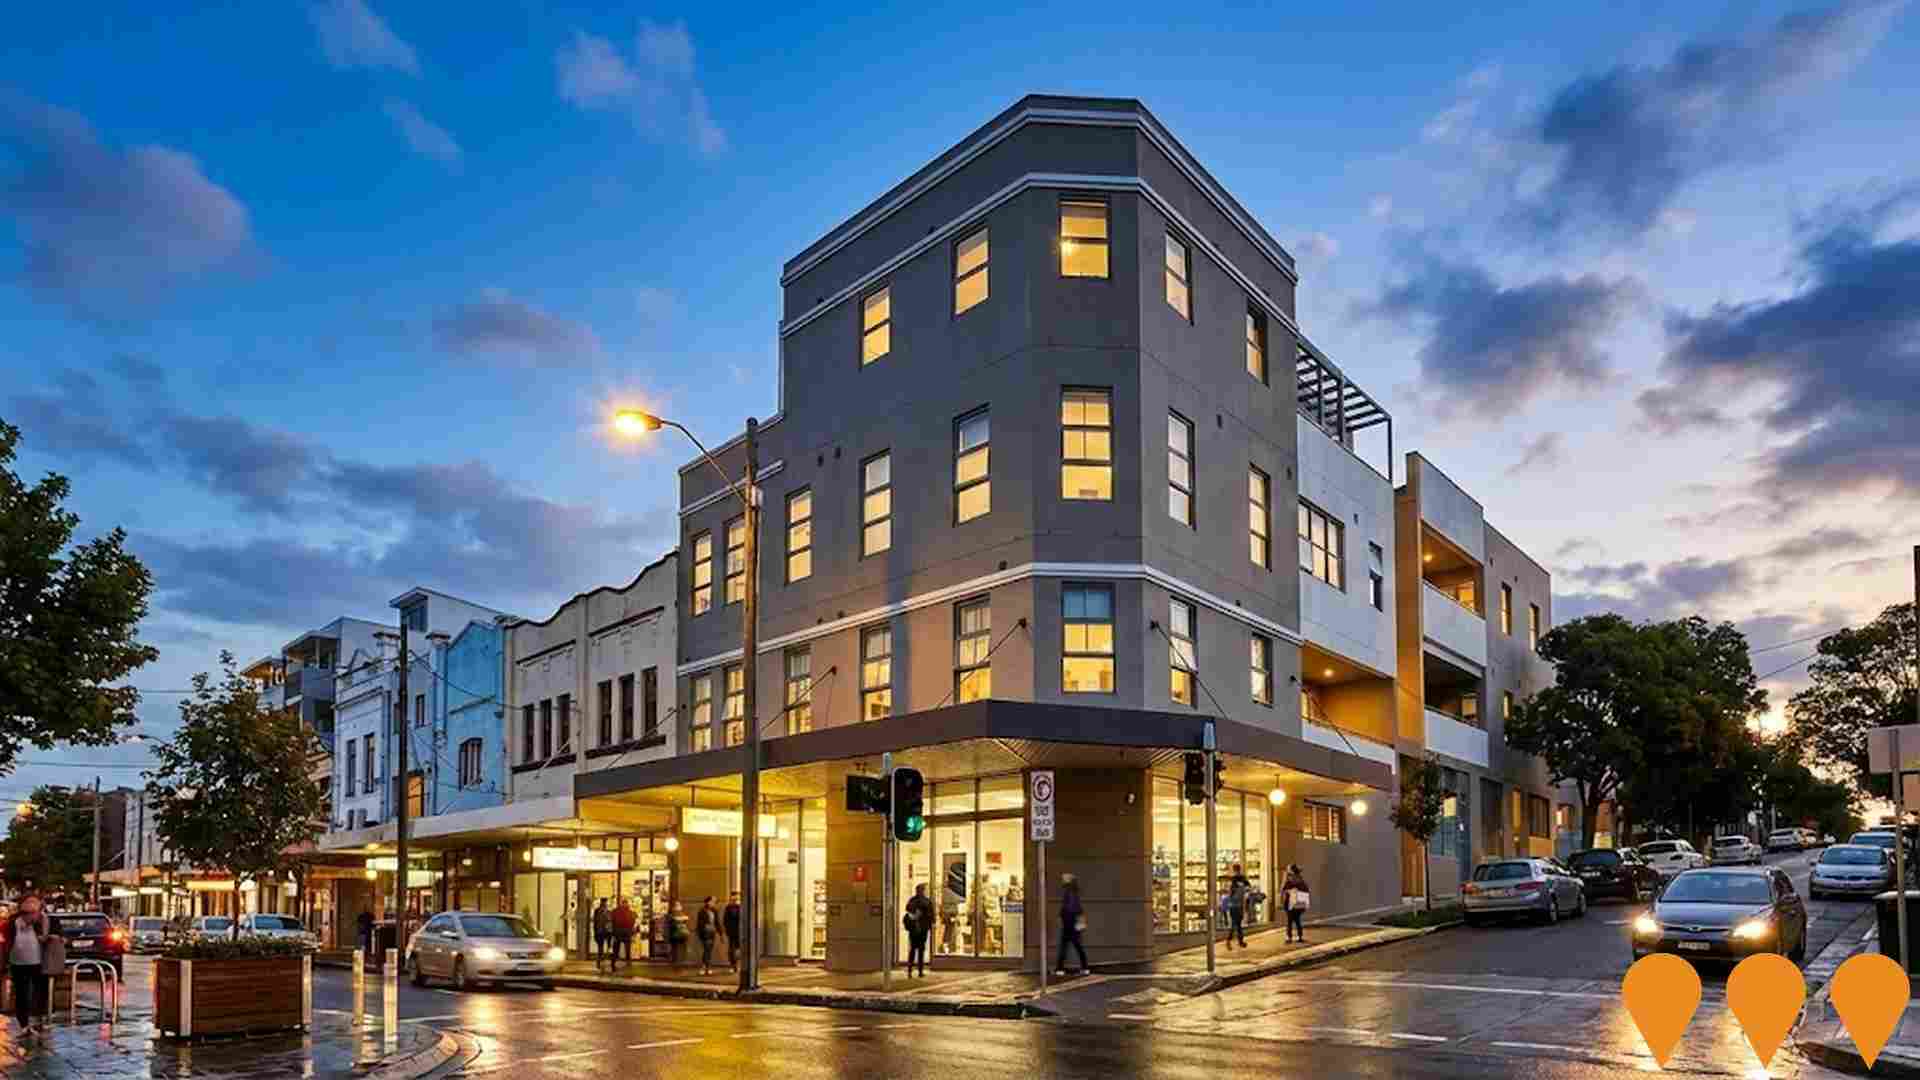
Changes to local infrastructure significantly affect an area's performance. AreaSearch identified 37 projects potentially impacting this area. Notable ones include Cooks to Cove GreenWay, JF Laxton Reserve Upgrade, Sydney Metro Sydenham to Bankstown Conversion, and Dulwich Hill Village Master Plan. The following list details those most relevant.
Professional plan users can use the search below to filter and access additional projects.
INFRASTRUCTURE SEARCH
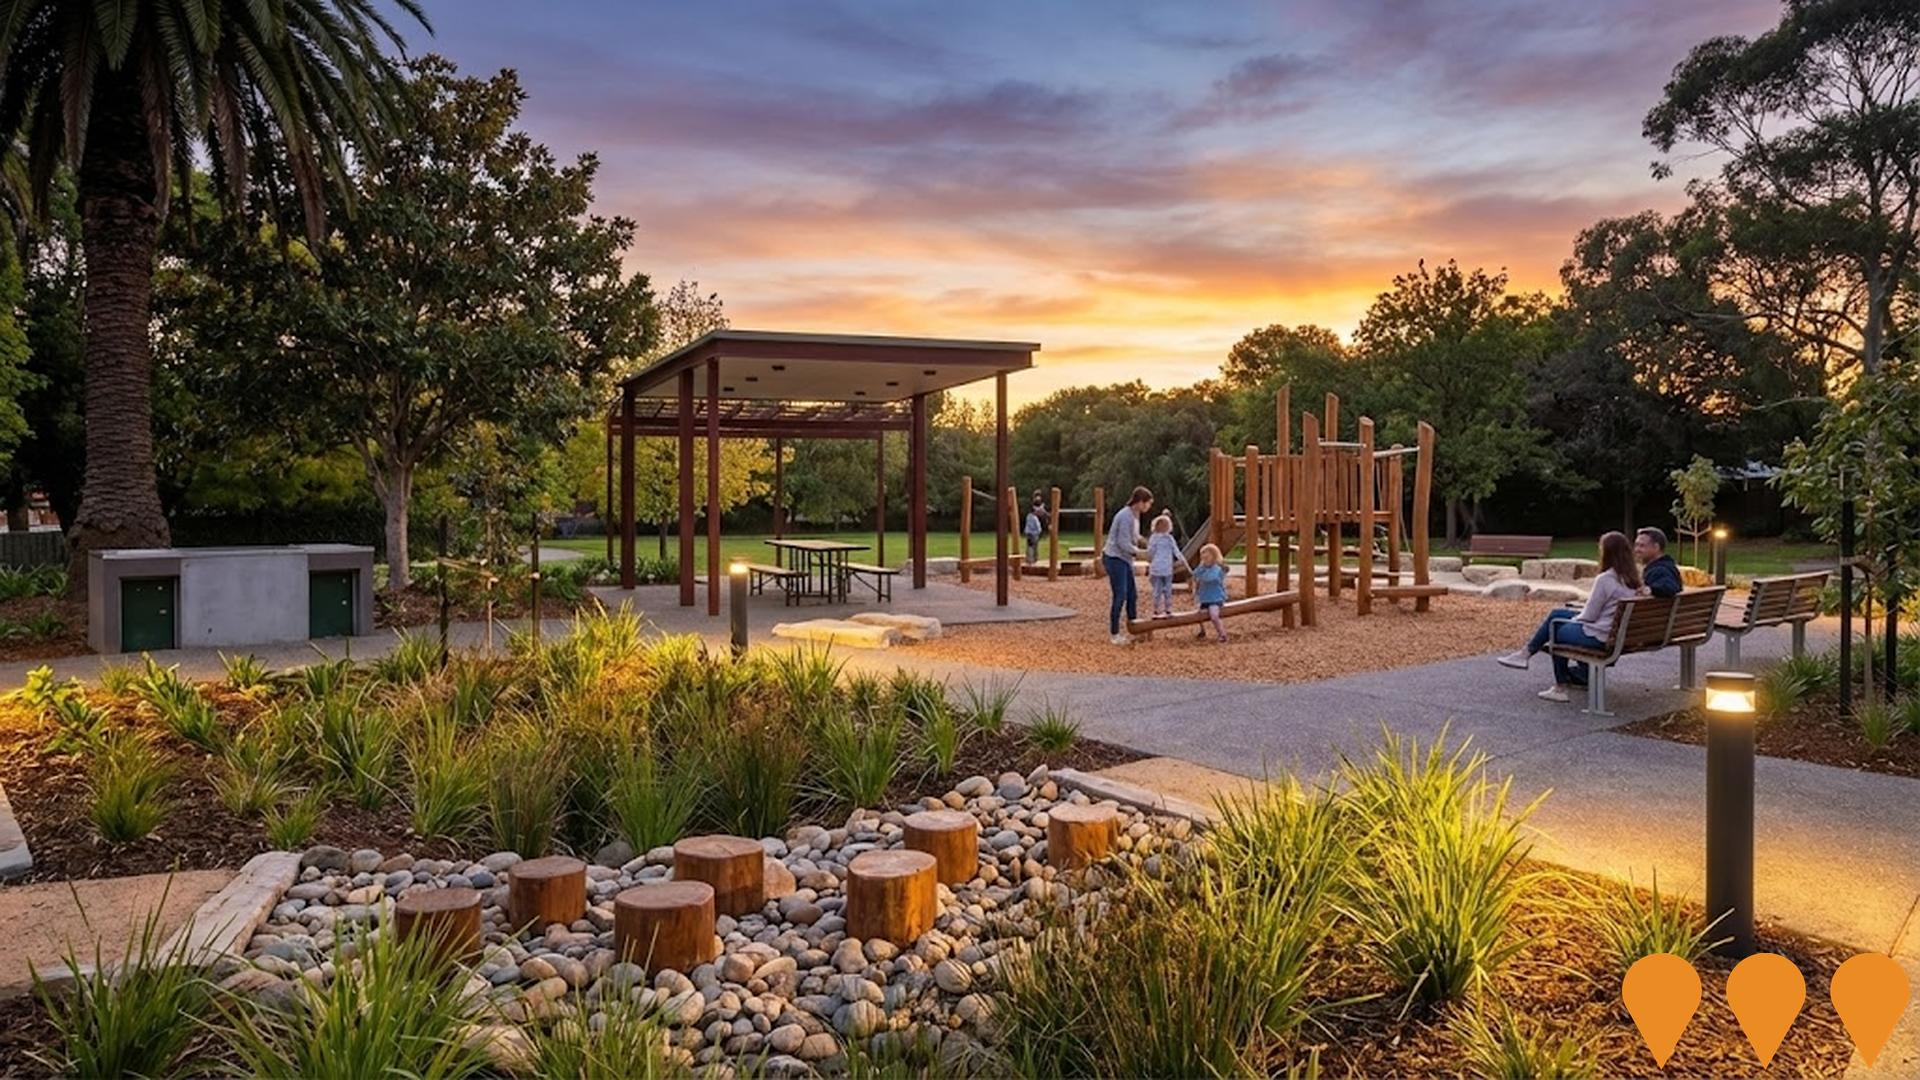
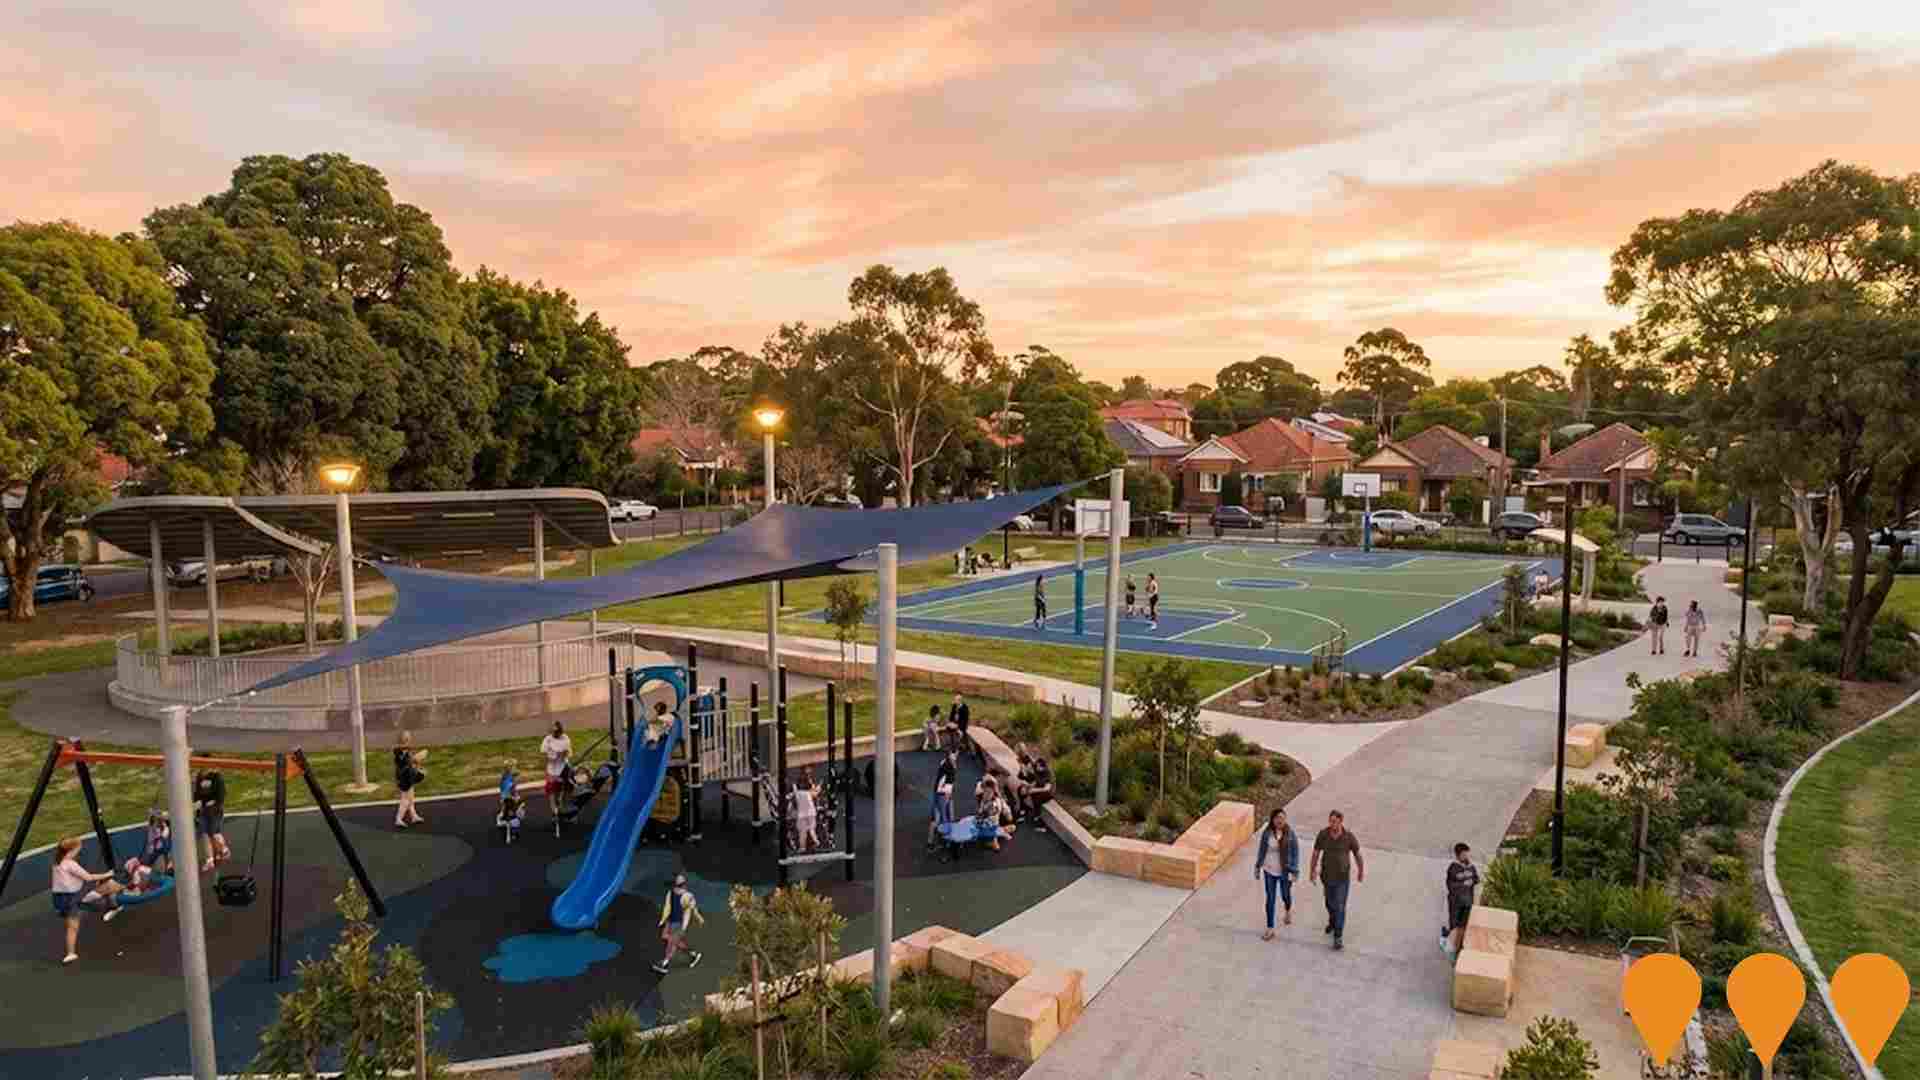
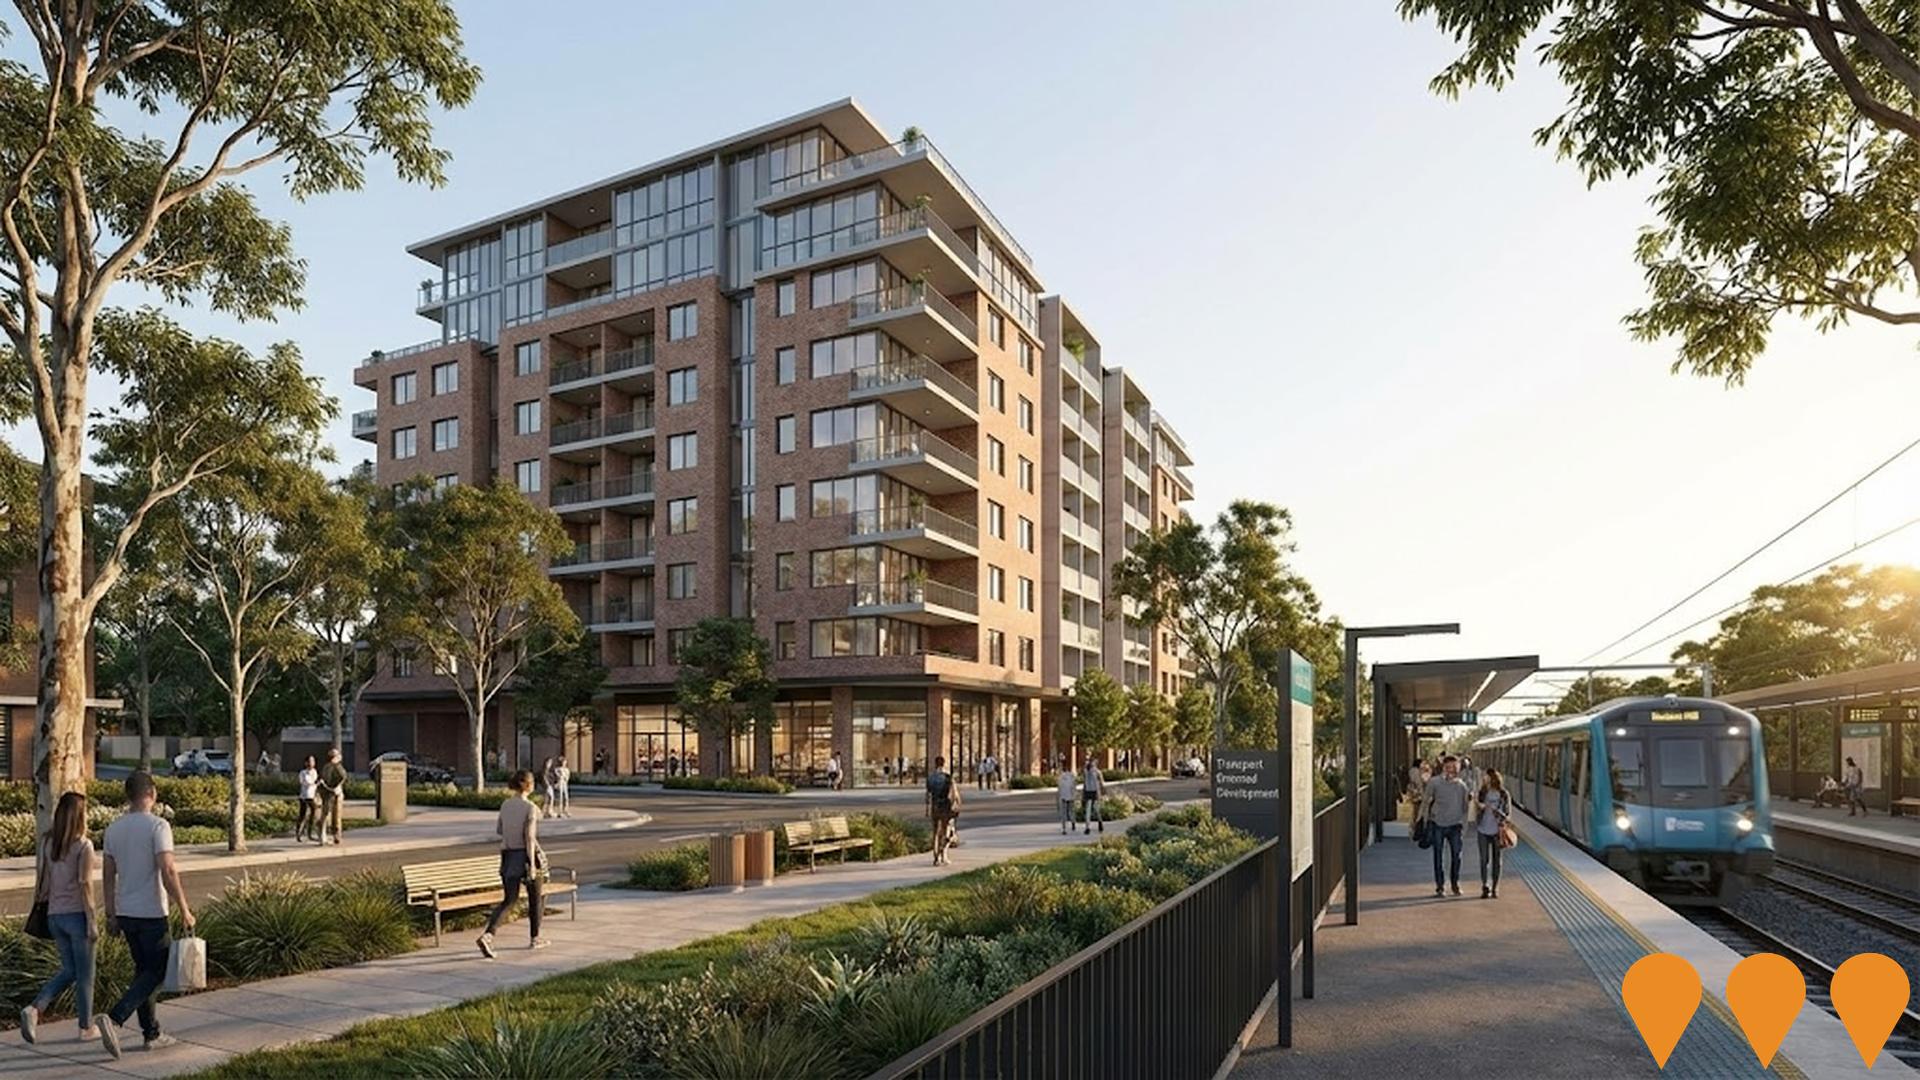
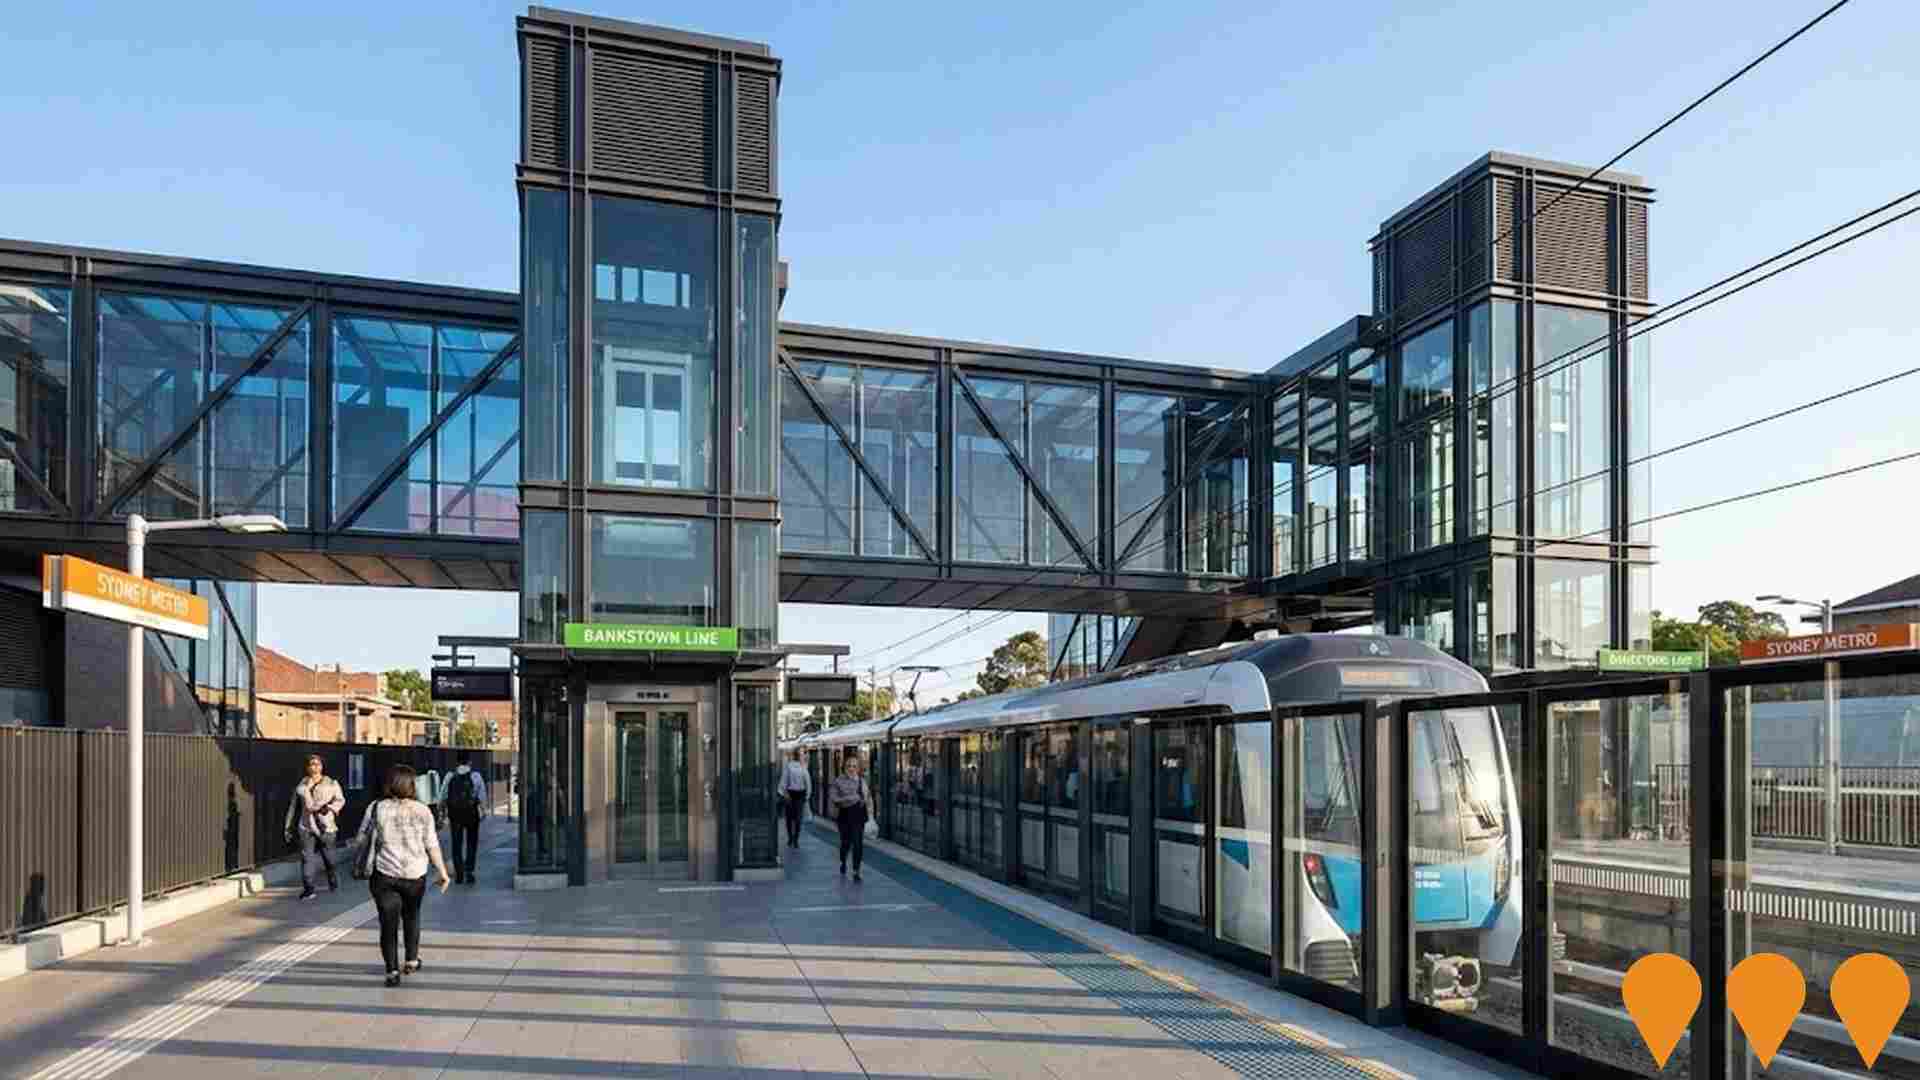
 Denotes AI-based impression for illustrative purposes only, not to be taken as definitive under any circumstances. Please follow links and conduct other investigations from the project's source for actual imagery. Developers and project owners wishing us to use original imagery please Contact Us and we will do so.
Frequently Asked Questions - Infrastructure
Sydenham to Bankstown Transport Oriented Development Program
The Sydenham to Bankstown Transport Oriented Development (TOD) Program provides a strategic planning framework to guide urban renewal along the Sydney Metro City & Southwest line corridor. The initial corridor strategy targeted approximately 35,000 new dwellings across 11 station precincts. The planning approach has evolved, with the NSW Government applying new, state-led TOD planning controls (rezoning) around 31 stations, including Dulwich Hill, to allow for more medium and high-rise housing (up to 9 storeys in some cases) within 400m of the station. This is intended to accelerate housing supply. The state-led TOD controls for the Dulwich Hill precinct were applied in January 2025. The overall Sydney Metro City & Southwest rail line conversion is a related project, which is currently in the construction phase and is expected to be completed in 2026.
Sydney Metro Sydenham to Bankstown Conversion
Conversion of the existing T3 Bankstown Line (between Sydenham and Bankstown) to modern, high-tech metro standards as part of the Sydney Metro City & Southwest project. The upgrade includes new air-conditioned metro trains running every 4 minutes in peak (15 trains per hour), platform screen doors, new lifts for full accessibility, level access between platforms and trains, and new concourses. Dulwich Hill Station is one of the ten stations being upgraded. The full closure of the line for final conversion works began in September 2024.
Inner West Housing Investigation Areas
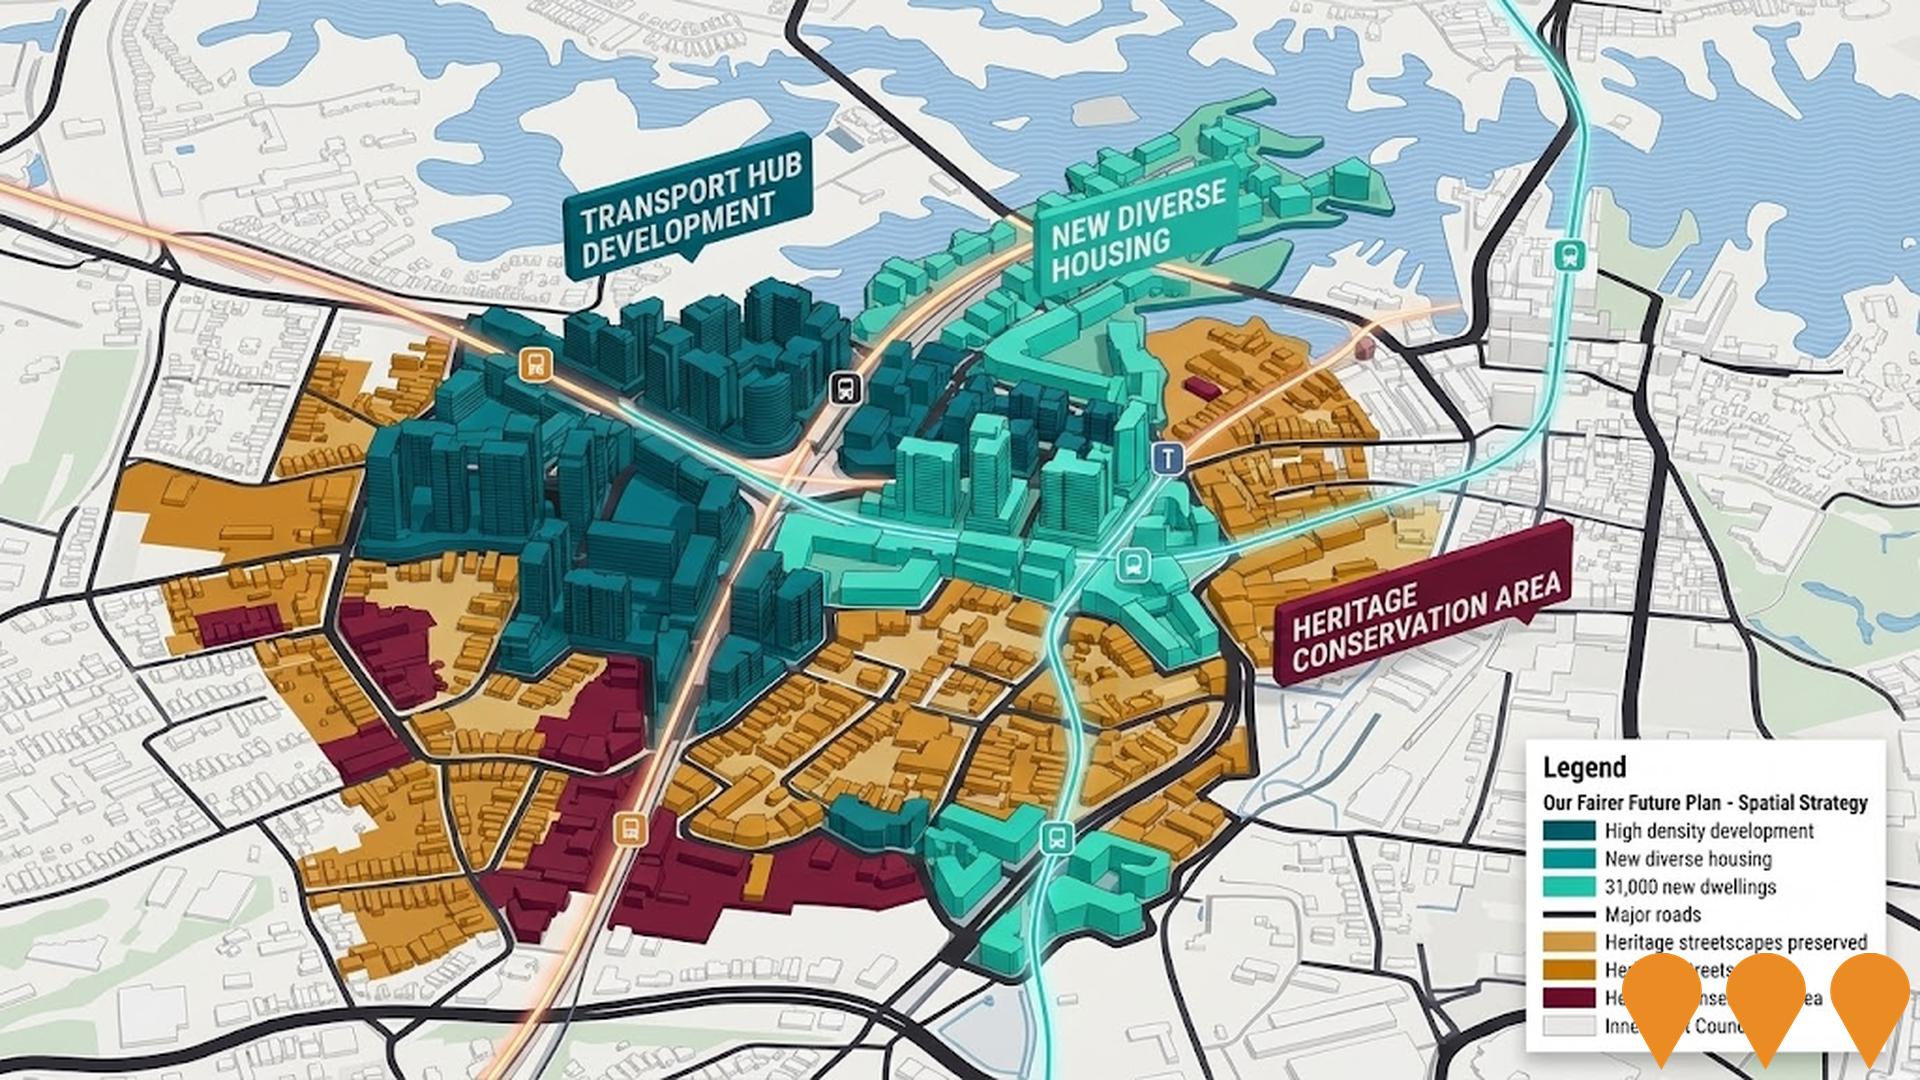
Council-led comprehensive housing strategy (Our Fairer Future Plan) focusing on Housing Investigation Areas around transport nodes including Ashfield, Croydon, Dulwich Hill, Lewisham, Marrickville and others. Includes masterplans for increased density, new parks, plazas, multi-purpose libraries, walking/cycling paths, improved public domain and transport connections. Part of Inner West Council's alternative to NSW Government TOD reforms.

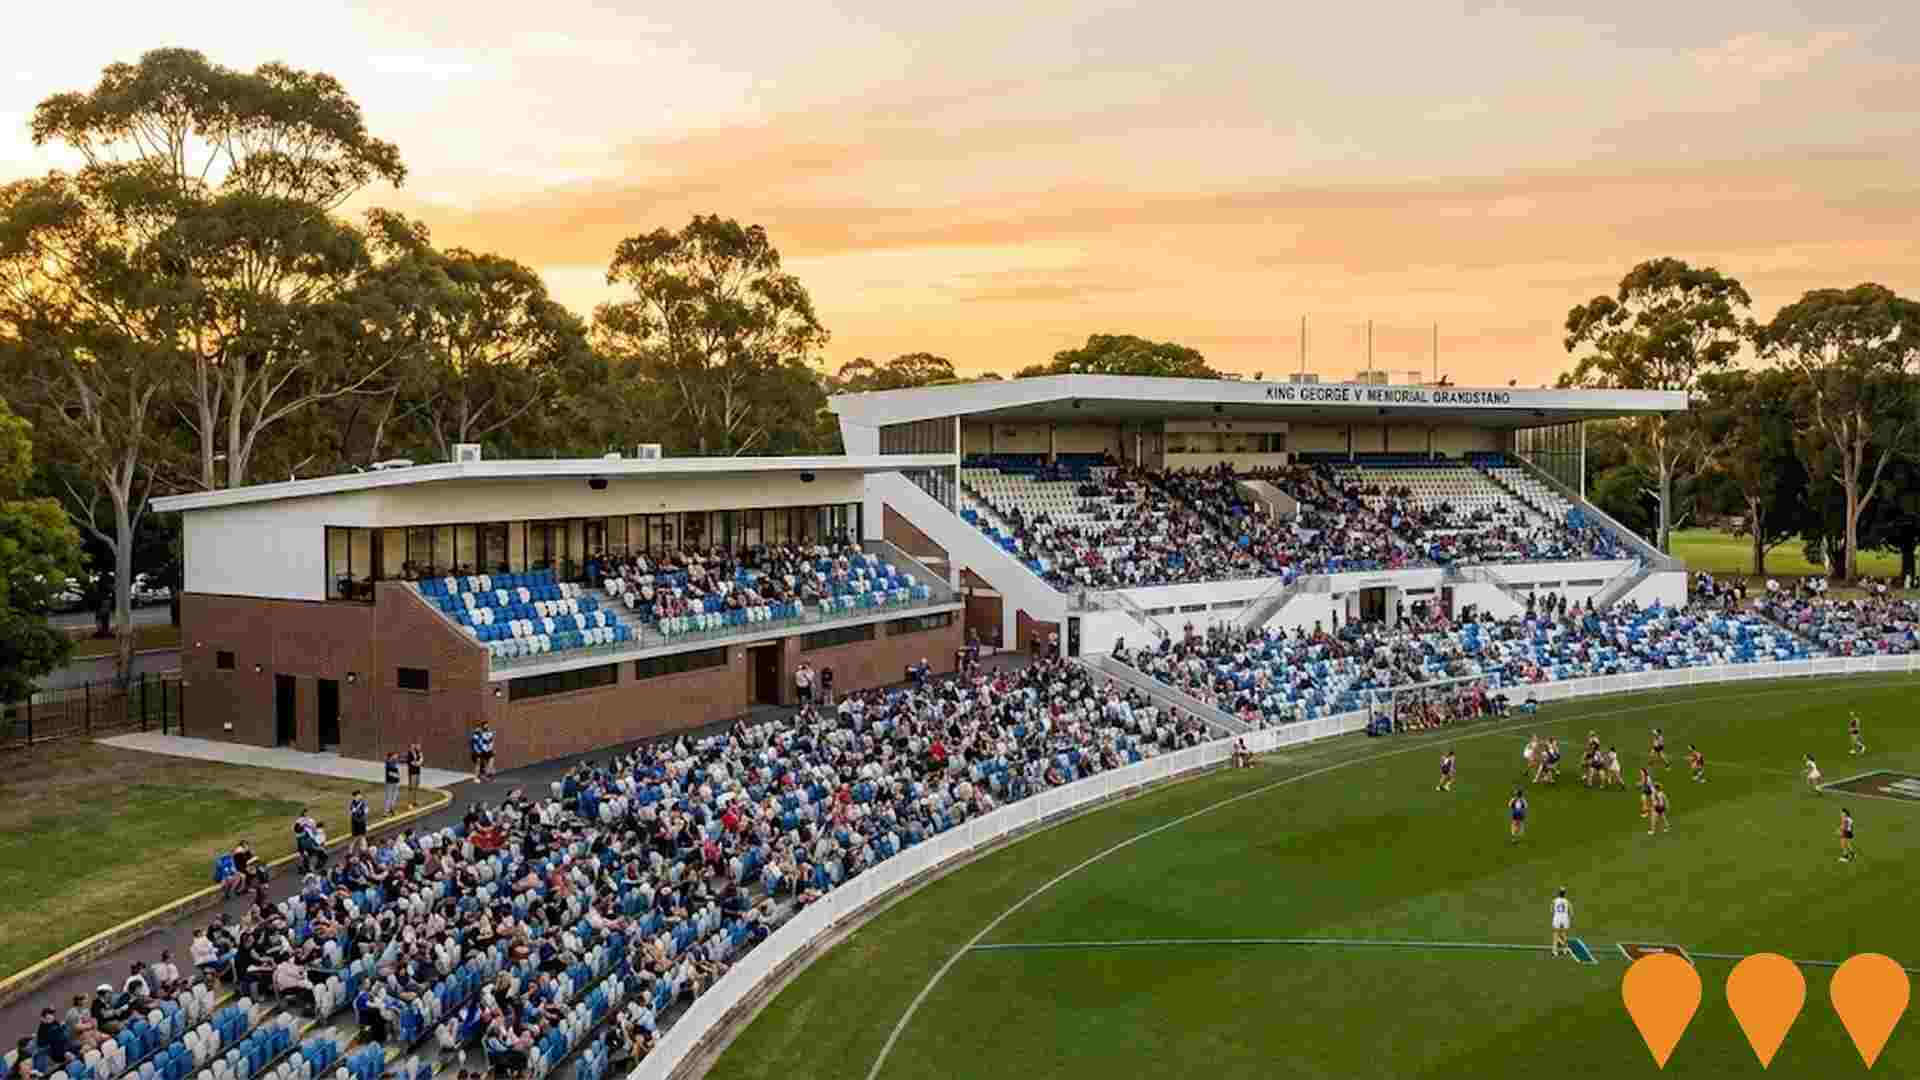
Henson Park Grandstand Redevelopment
Two-stage $20 million redevelopment of the historic King George V Memorial Grandstand at Henson Park, Marrickville. Stage 1 completed September 2025 delivering new female-friendly change rooms, gymnasium, multi-use function room, elevator, accessible amenities and grandstand extension. Stage 2 (under construction, due for completion mid-2026) includes new public toilets, canteen, coaches boxes, media facilities and further upgrades. The venue will become a premier AFLW home ground for Sydney Swans and GWS Giants women's teams while remaining the home of the Newtown Jets rugby league club.
Cooks to Cove GreenWay
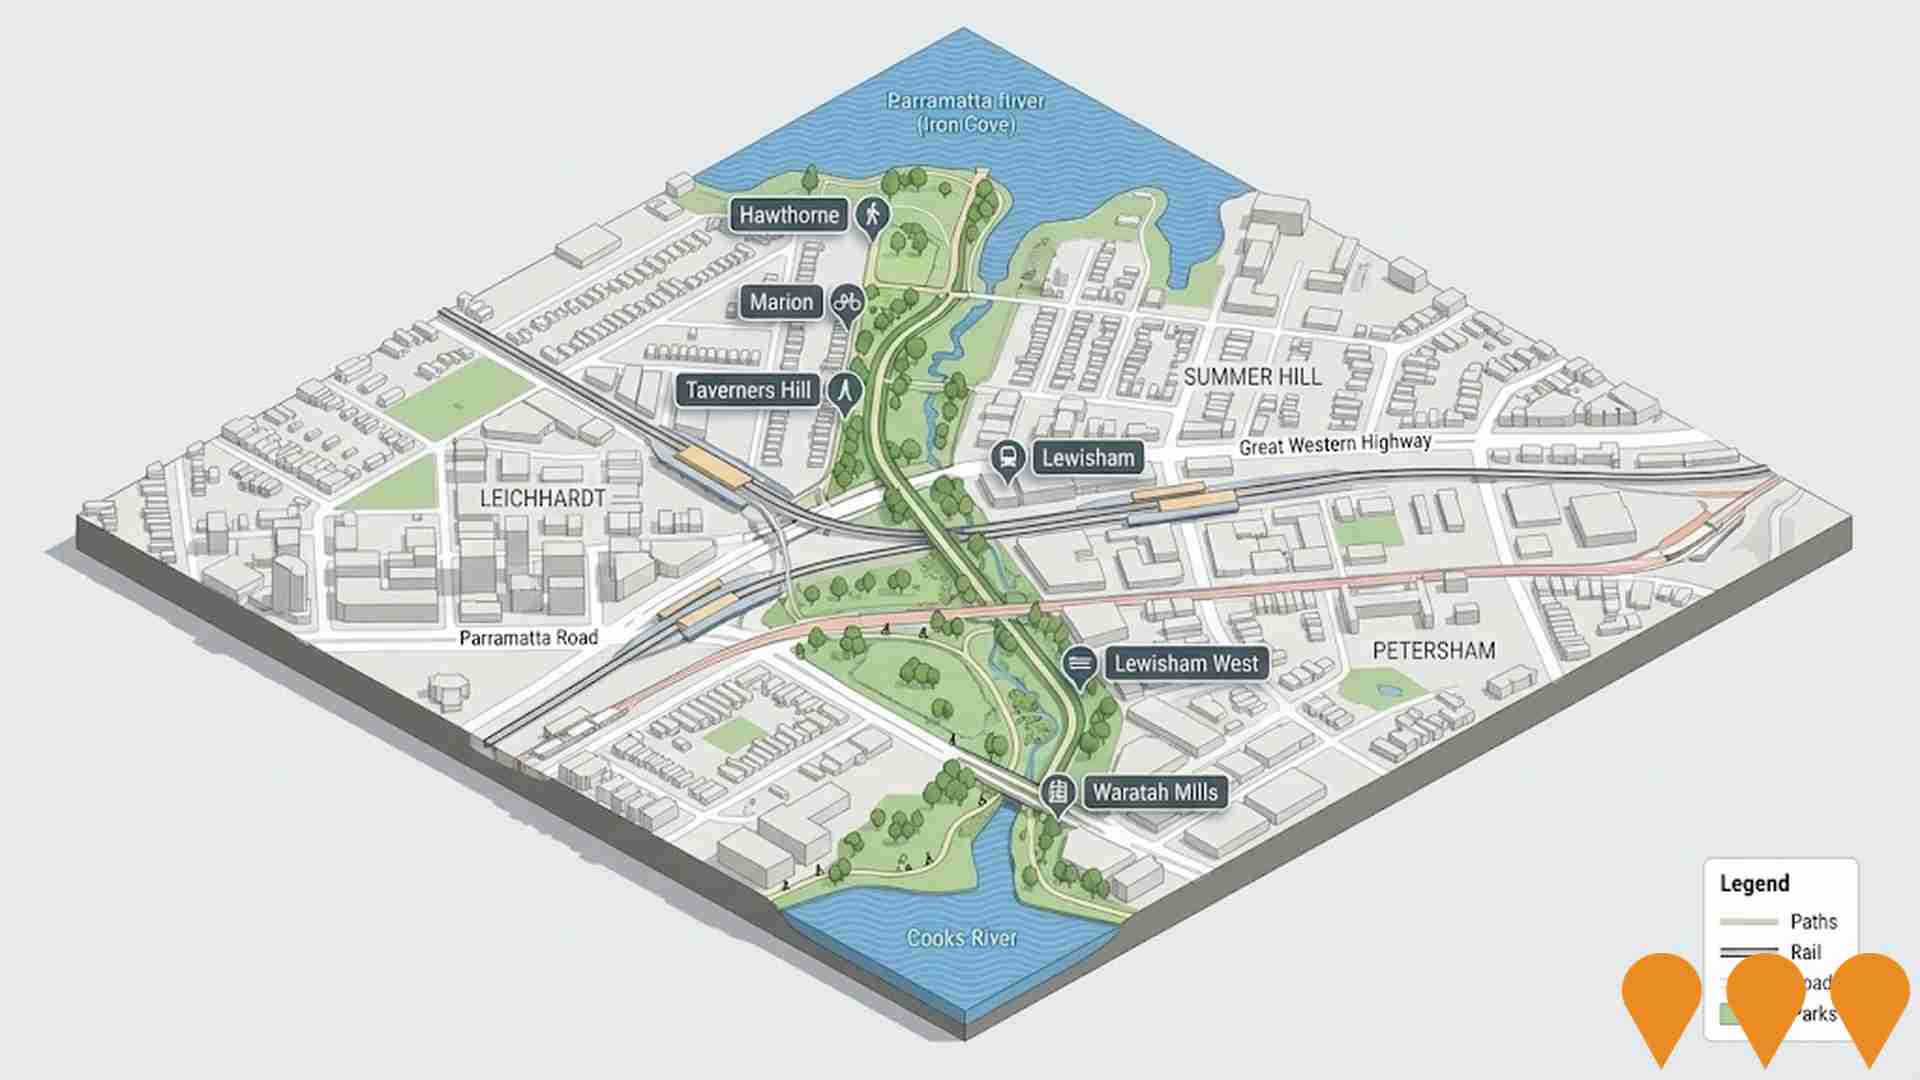
The Cooks to Cove GreenWay is an environmental, cultural, and sustainable transport corridor in Sydney's Inner West, linking the Cooks River at Earlwood with the Parramatta River at Iron Cove. It features a 5.8km shared path for walking and cycling, foreshore walks, cultural and historical sites, cafes, bushcare sites, parks, playgrounds, sporting facilities, and ecological restoration along waterways.
Dulwich Hill Village Master Plan
A ten-year plan to guide improvements to Dulwich Hill's main streets, laneways, and public spaces, aiming to create an inclusive, pedestrian-oriented retail precinct that supports healthy communities, enhances walkability, sustainability, and the local economy.

Flour Mill of Summer Hill
Master planned urban renewal on a 2.4 to 2.5 ha former Allied Mills site. Adaptive reuse of heritage mill and silo buildings delivering around 360 dwellings across 11 buildings with retail and community spaces, new plaza, parkland and light rail connections. Final stage completed in early 2019.

Marrickville Station Metro Upgrade
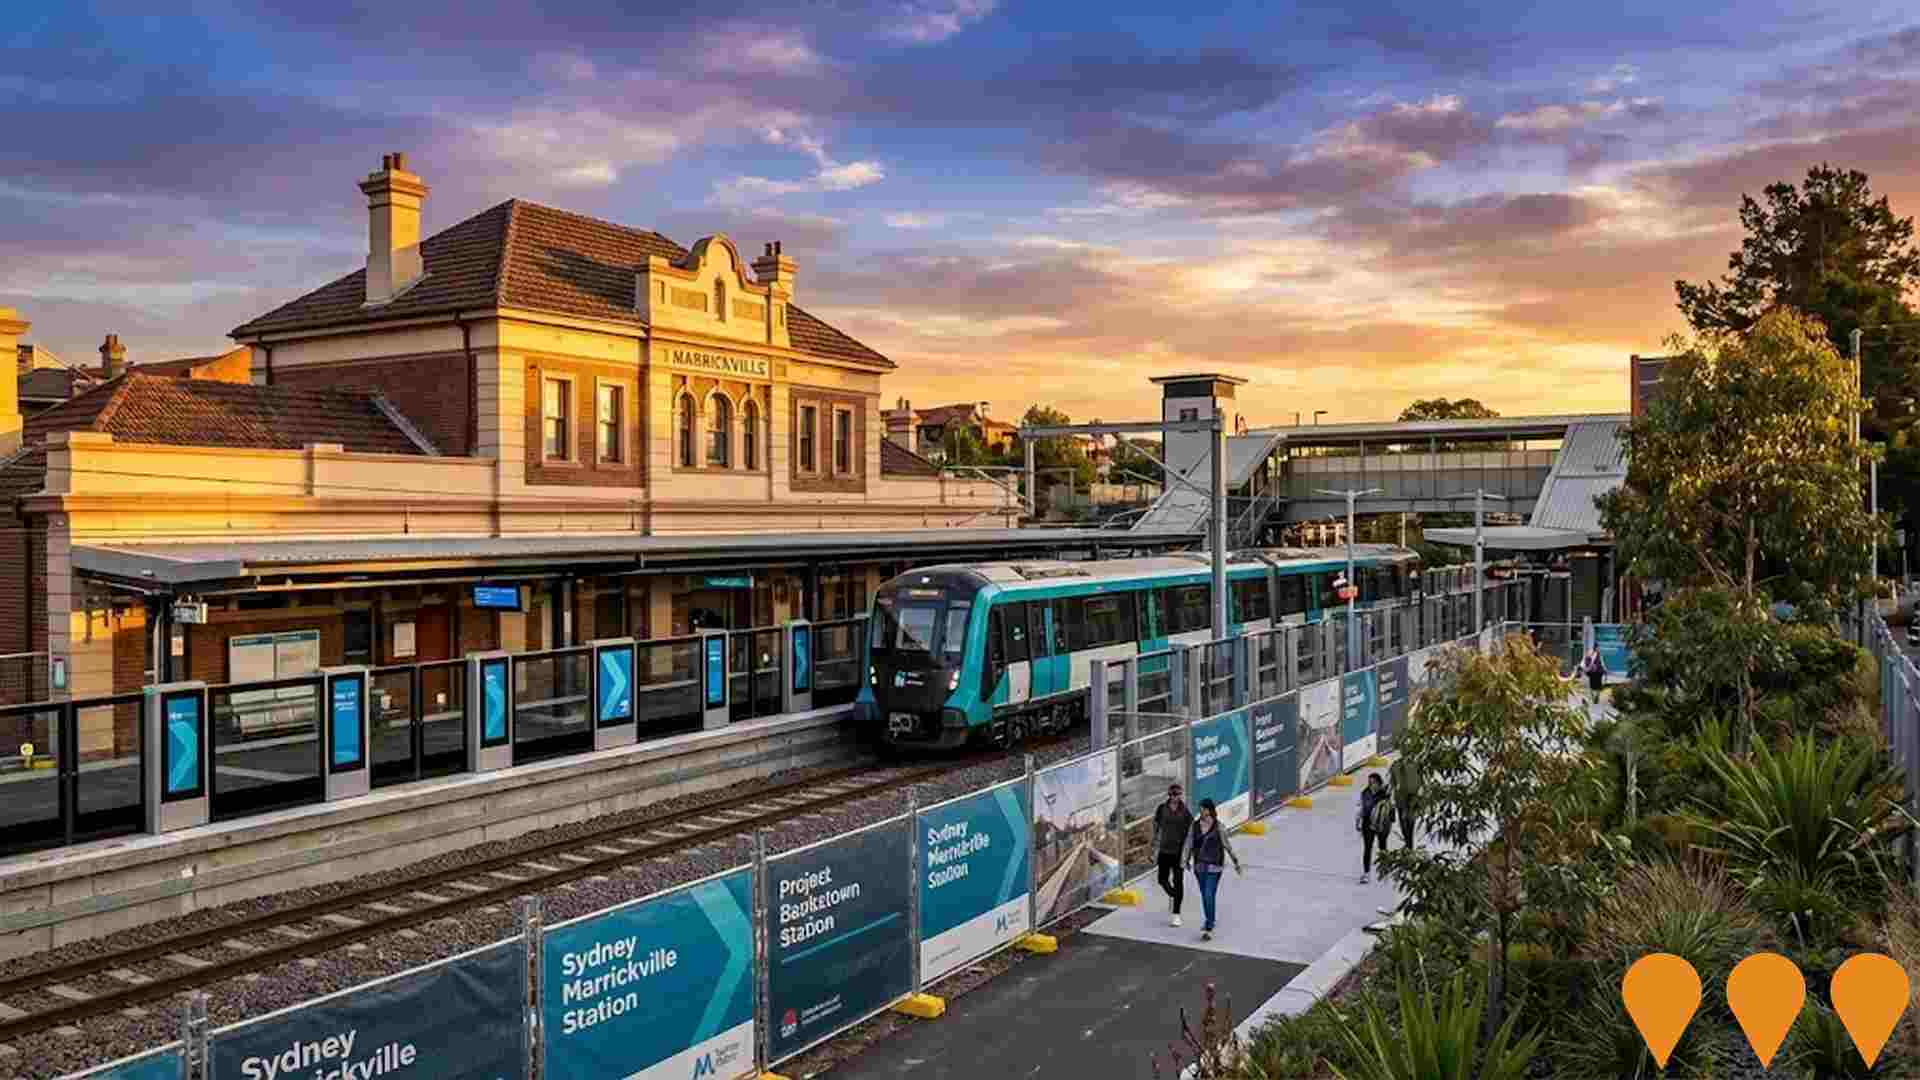
Upgrade of Marrickville Station to metro standards as part of the Sydney Metro City & Southwest project, including platform screen doors, level access, and frequent air-conditioned trains. The line is currently closed for conversion, with services expected to commence in 2026.
Employment
The employment landscape in Dulwich Hill - Lewisham shows performance that lags behind national averages across key labour market indicators
Dulwich Hill - Lewisham had an unemployment rate of 5.1% as of September 2025. The area's residents showed a high level of education, with the technology sector being particularly prominent among employed individuals.
In total, 11,844 residents were in work during this period. Compared to Greater Sydney's unemployment rate of 4.2%, Dulwich Hill - Lewisham had an unemployment rate that was 0.9% higher. Workforce participation in the area was 68.8%, which is significantly higher than Greater Sydney's 60.0%. The employment distribution among residents showed concentration in professional & technical, health care & social assistance, and education & training sectors.
Notably, professional & technical jobs had an employment share that was 1.3 times the regional level. Conversely, construction jobs were less represented at 5.5%, compared to the regional average of 8.6%. Over the year ending September 2025, labour force levels in Dulwich Hill - Lewisham increased by 0.2%. However, this was accompanied by a 0.9% decline in employment, leading to a rise in unemployment rate by 1.0 percentage points. In contrast, Greater Sydney experienced employment growth of 2.1% and labour force growth of 2.4%, with only a 0.2 percentage point rise in unemployment. Providing broader context, state-level data up to 25-Nov showed that NSW employment had contracted by 0.03%, losing 2,260 jobs, with the state's unemployment rate at 3.9%. This compared favourably to the national unemployment rate of 4.3%. For future insights into potential job demand within Dulwich Hill - Lewisham, Jobs and Skills Australia's national employment forecasts from May-25 can be considered. These projections suggest that national employment is forecast to expand by 6.6% over five years and 13.7% over ten years. However, growth rates differ significantly between industry sectors. Applying these industry-specific projections to Dulwich Hill - Lewisham's employment mix suggests that local employment should increase by 7.1% over five years and 14.3% over ten years. It is important to note that these projections are based on a simple weighting extrapolation for illustrative purposes and do not take into account localised population projections.
Frequently Asked Questions - Employment
Income
Income metrics indicate excellent economic conditions, with the area achieving higher performance than 75% of national locations assessed by AreaSearch
AreaSearch's latest postcode level ATO data for financial year 2022 shows Dulwich Hill - Lewisham SA2 had a median income among taxpayers of $68,733 and an average of $89,883. Nationally, these figures are extremely high, with Greater Sydney's median being $56,994 and average at $80,856. Based on Wage Price Index growth of 12.61% since financial year 2022, current estimates for September 2025 would be approximately $77,400 (median) and $101,217 (average). Census 2021 income data ranks household, family, and personal incomes in Dulwich Hill - Lewisham between the 75th and 90th percentiles nationally. Income analysis reveals that 32.3% of residents earn between $1,500 and $2,999 weekly (6,148 residents), mirroring the metropolitan region where 30.9% fall into this bracket. A substantial proportion, 34.2%, earn above $3,000 per week, indicating strong economic capacity throughout the suburb. High housing costs consume 18.5% of income, but strong earnings still place disposable income at the 72nd percentile nationally. The area's SEIFA income ranking places it in the 9th decile.
Frequently Asked Questions - Income
Housing
Dulwich Hill - Lewisham features a more urban dwelling mix with significant apartment living, with a higher proportion of rental properties than the broader region
Dwelling structure in Dulwich Hill-Lewisham, as per the latest Census, comprised 28.7% houses and 71.4% other dwellings (semi-detached, apartments, 'other' dwellings). This compares to Sydney metro's 33.5% houses and 66.5% other dwellings. Home ownership in Dulwich Hill-Lewisham was at 24.0%, with the remainder mortgaged (28.9%) or rented (47.2%). The median monthly mortgage repayment in the area was $2,600, above Sydney metro's average of $2,436. Median weekly rent was recorded at $480, compared to Sydney metro's $465. Nationally, Dulwich Hill-Lewisham's mortgage repayments were significantly higher than the Australian average of $1,863, with rents substantially above the national figure of $375.
Frequently Asked Questions - Housing
Household Composition
Dulwich Hill - Lewisham features high concentrations of group households and lone person households, with a lower-than-average median household size
Family households constitute 59.2 percent of all households, including 23.2 percent couples with children, 25.5 percent couples without children, and 9.3 percent single parent families. Non-family households account for the remaining 40.8 percent, with lone person households at 33.6 percent and group households comprising 7.2 percent of the total. The median household size is 2.2 people, which is smaller than the Greater Sydney average of 2.5.
Frequently Asked Questions - Households
Local Schools & Education
Dulwich Hill - Lewisham shows strong educational performance, ranking in the upper quartile nationally when assessed across multiple qualification and achievement indicators
Educational attainment in Dulwich Hill - Lewisham is notably higher than national and state averages. As of 2016, 52.0% of residents aged 15 years and over held university qualifications, compared to 30.4% nationally and 32.2% in NSW. Bachelor degrees were the most common at 33.0%, followed by postgraduate qualifications (14.4%) and graduate diplomas (4.6%). Vocational pathways accounted for 22.0% of qualifications, with advanced diplomas at 10.5% and certificates at 11.5%.
Educational participation was high, with 28.5% of residents enrolled in formal education as of 2016. This included 8.3% in tertiary education, 7.5% in primary education, and 6.3% pursuing secondary education.
Frequently Asked Questions - Education
Schools Detail
Nearby Services & Amenities
Transport
Transport servicing is high compared to other areas nationally based on assessment of service frequency, route connectivity and accessibility
The analysis of public transport in Dulwich Hill - Lewisham shows that there are currently 52 active transport stops operating. These include train stations, light rail stops, and bus terminals. A total of 40 individual routes service these stops, collectively facilitating around 11,455 weekly passenger trips.
The accessibility of transport is rated as excellent, with residents typically located just 131 meters away from the nearest transport stop. On average, there are approximately 1,636 trips per day across all routes, which equates to about 220 weekly trips per individual stop.
Frequently Asked Questions - Transport
Transport Stops Detail
Health
The level of general health in Dulwich Hill - Lewisham is notably higher than the national average with both young and old age cohorts seeing low prevalence of common health conditions
Dulwich Hill-Lewisham shows superior health outcomes for both young and elderly residents, with low prevalence of common conditions. Private health coverage stands at approximately 67%, higher than Greater Sydney's 57.3% and Australia's national average of 55.3%. Mental health issues affect 10.9% and asthma impacts 8.5% of residents, while 69.8% report no medical ailments, compared to 77.0% in Greater Sydney.
The area has 13.1% seniors (2,489 people), lower than Greater Sydney's 14.5%. Senior health outcomes align with the general population's profile.
Frequently Asked Questions - Health
Cultural Diversity
Dulwich Hill - Lewisham was found to be more culturally diverse than the vast majority of local markets in Australia, upon assessment of a range of language and cultural background related metrics
Dulwich Hill-Lewisham has a higher cultural diversity than most local areas, with 33.5% of its population born overseas and 27.9% speaking a language other than English at home. Christianity is the predominant religion in Dulwich Hill-Lewisham, comprising 38.9% of the population. However, Judaism is overrepresented, making up 0.4% compared to 0.2% across Greater Sydney.
Regarding ancestry, the top three groups are English (20.6%, regional average 12.9%), Australian (17.8%, regional average 11.5%), and Other (12.9%). Notable divergences exist in Hungarian (0.5% vs regional 0.3%), Greek (4.4% vs 2.9%), and Lebanese (2.0% vs 3.1%) representation.
Frequently Asked Questions - Diversity
Age
Dulwich Hill - Lewisham's population is slightly younger than the national pattern
Dulwich Hill - Lewisham has a median age of 37, matching Greater Sydney's figure and closely resembling Australia's median age of 38 years. The 25-34 age group is strongly represented at 20.9%, higher than Greater Sydney's percentage but lower than the national average of 14.5%. The 5-14 cohort stands at 8.1%, less prevalent compared to Greater Sydney. Between 2021 and present, the 15-24 age group has grown from 10.0% to 11.2%, while the 35-44 cohort increased from 17.4% to 18.5%. Conversely, the 5-14 cohort has decreased from 9.2% to 8.1%. By 2041, demographic projections indicate significant shifts in Dulwich Hill - Lewisham's age structure. The 75-84 group is projected to grow by 41%, reaching 1,160 people from the current 824. This growth will contribute significantly to the overall increase of those aged 65 and above, who are expected to comprise 86% of the population growth. Meanwhile, the 55-64 and 15-24 age groups are projected to experience population declines.
