Chart Color Schemes
This analysis uses ABS Statistical Areas Level 2 (SA2) boundaries, which can materially differ from Suburbs and Localities (SAL) even when sharing similar names.
SA2 boundaries are defined by the Australian Bureau of Statistics and are designed to represent communities for statistical reporting (e.g., census and ERP).
Suburbs and Localities (SAL) represent commonly-used suburb/locality names (postal-style areas) and may use different geographic boundaries. For comprehensive analysis, consider reviewing both boundary types if available.
est. as @ -- *
ABS ERP | -- people | --
2021 Census | -- people
Sales Activity
Curious about local property values? Filter the chart to assess the volume and appreciation (including resales) trends and regional comparisons, or scroll to the map below view this information at an individual property level.
Find a Recent Sale
Sales Detail
Population
Earlwood is positioned among the lower quartile of areas assessed nationally for population growth based on AreaSearch's assessment of recent, and medium term trends
Earlwood's population, as of November 2025, is approximately 18,129 people. This figure represents an increase from the 2021 Census count of 17,969 people, a change inferred from ABS estimated resident population data and validated new addresses since June 2024. The population density stands at 3,243 persons per square kilometer, placing Earlwood in the upper quartile nationally according to AreaSearch assessments. Overseas migration accounted for approximately 82.6% of recent population gains in the area. AreaSearch uses ABS/Geoscience Australia projections for each SA2 area, released in 2024 with a base year of 2022, and NSW State Government's SA2 level projections for areas not covered by this data, released in 2022 with a base year of 2021.
These projections indicate an overall population decline in Earlwood by 167 persons by 2041, but growth is expected within specific age cohorts, notably the 65 to 74 age group, which is projected to increase by 747 people over this period.
Frequently Asked Questions - Population
Development
Residential development activity is lower than average in Earlwood according to AreaSearch's national comparison of local real estate markets
Earlwood has seen approximately 53 new homes approved annually. Over the past five financial years, from FY21 to FY25, around 266 homes were approved, with 11 more approved so far in FY26. Despite population decline in the area, development activity has been relatively adequate.
The average expected construction cost value of new dwellings is $484,000, indicating that developers are targeting the premium market segment with higher-end properties. In FY26, $6.1 million in commercial development approvals have been recorded, suggesting limited focus on commercial development compared to residential. Compared to Greater Sydney, Earlwood has similar levels of development per person, contributing to market stability and aligning with regional patterns. However, this level is lower than the national average, potentially indicating market maturity or possible development constraints. In terms of building activity, 52.0% are standalone homes while 48.0% are medium and high-density housing, marking a shift from the current pattern of 80.0% houses.
This change could be due to diminishing developable land availability and evolving lifestyle preferences for more affordable compact living options. Earlwood has around 320 people per dwelling approval, suggesting a low density market. With population expected to remain stable or decline, there may be reduced pressure on housing in the area, potentially creating opportunities for buyers.
Frequently Asked Questions - Development
Infrastructure
Earlwood has very high levels of nearby infrastructure activity, ranking in the top 10% nationally
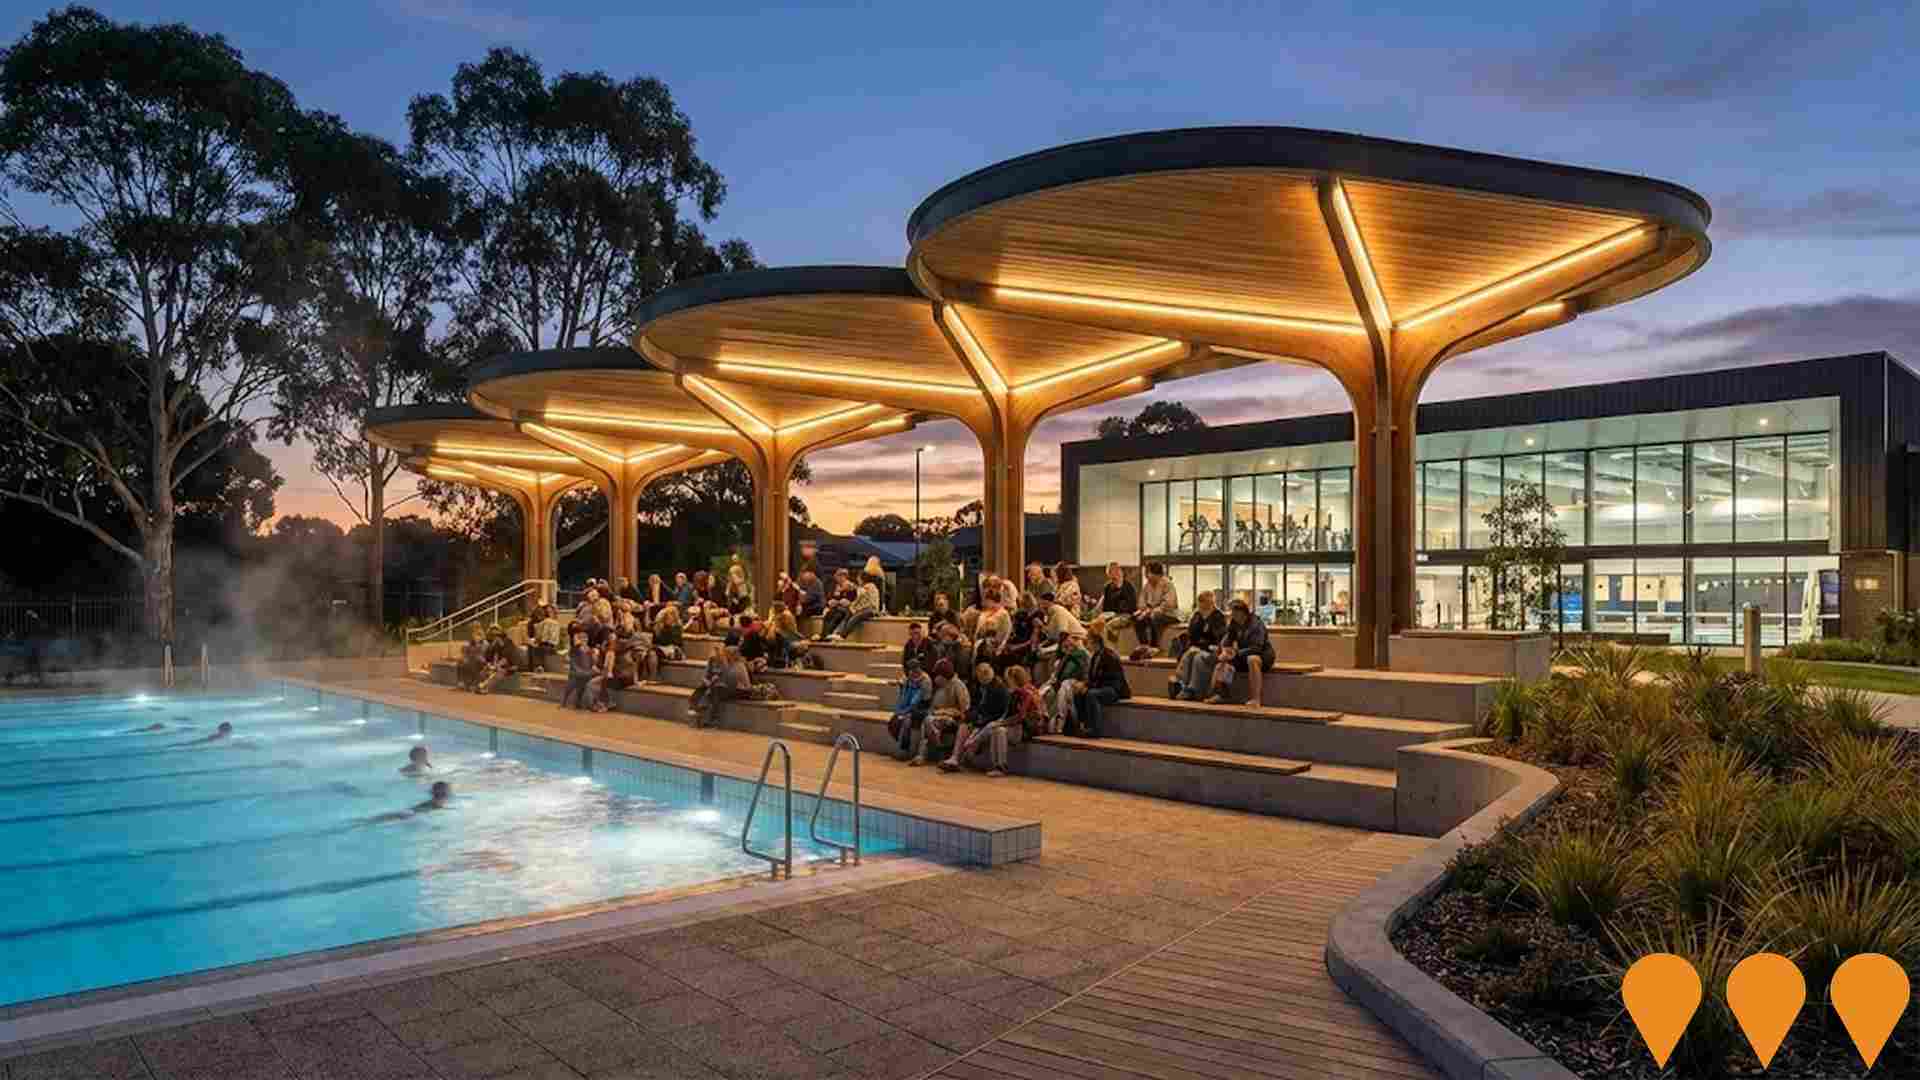
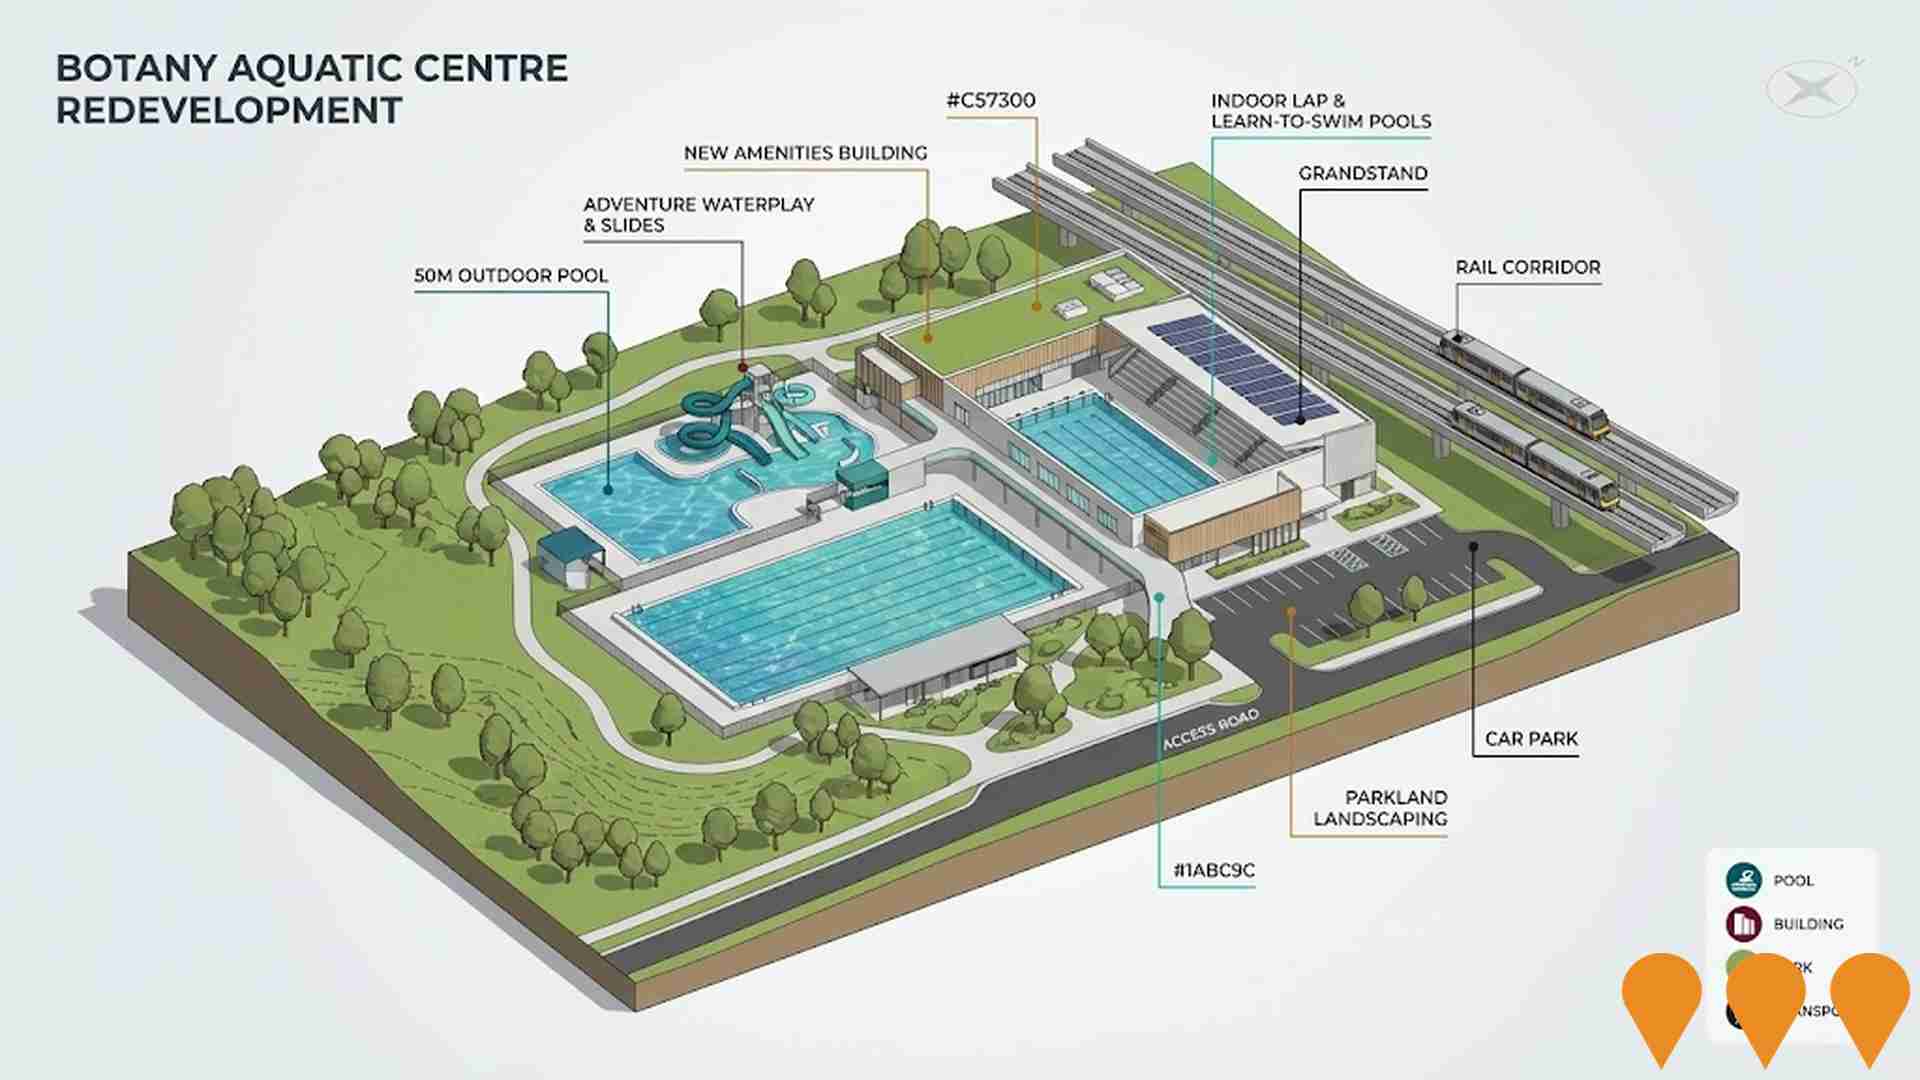
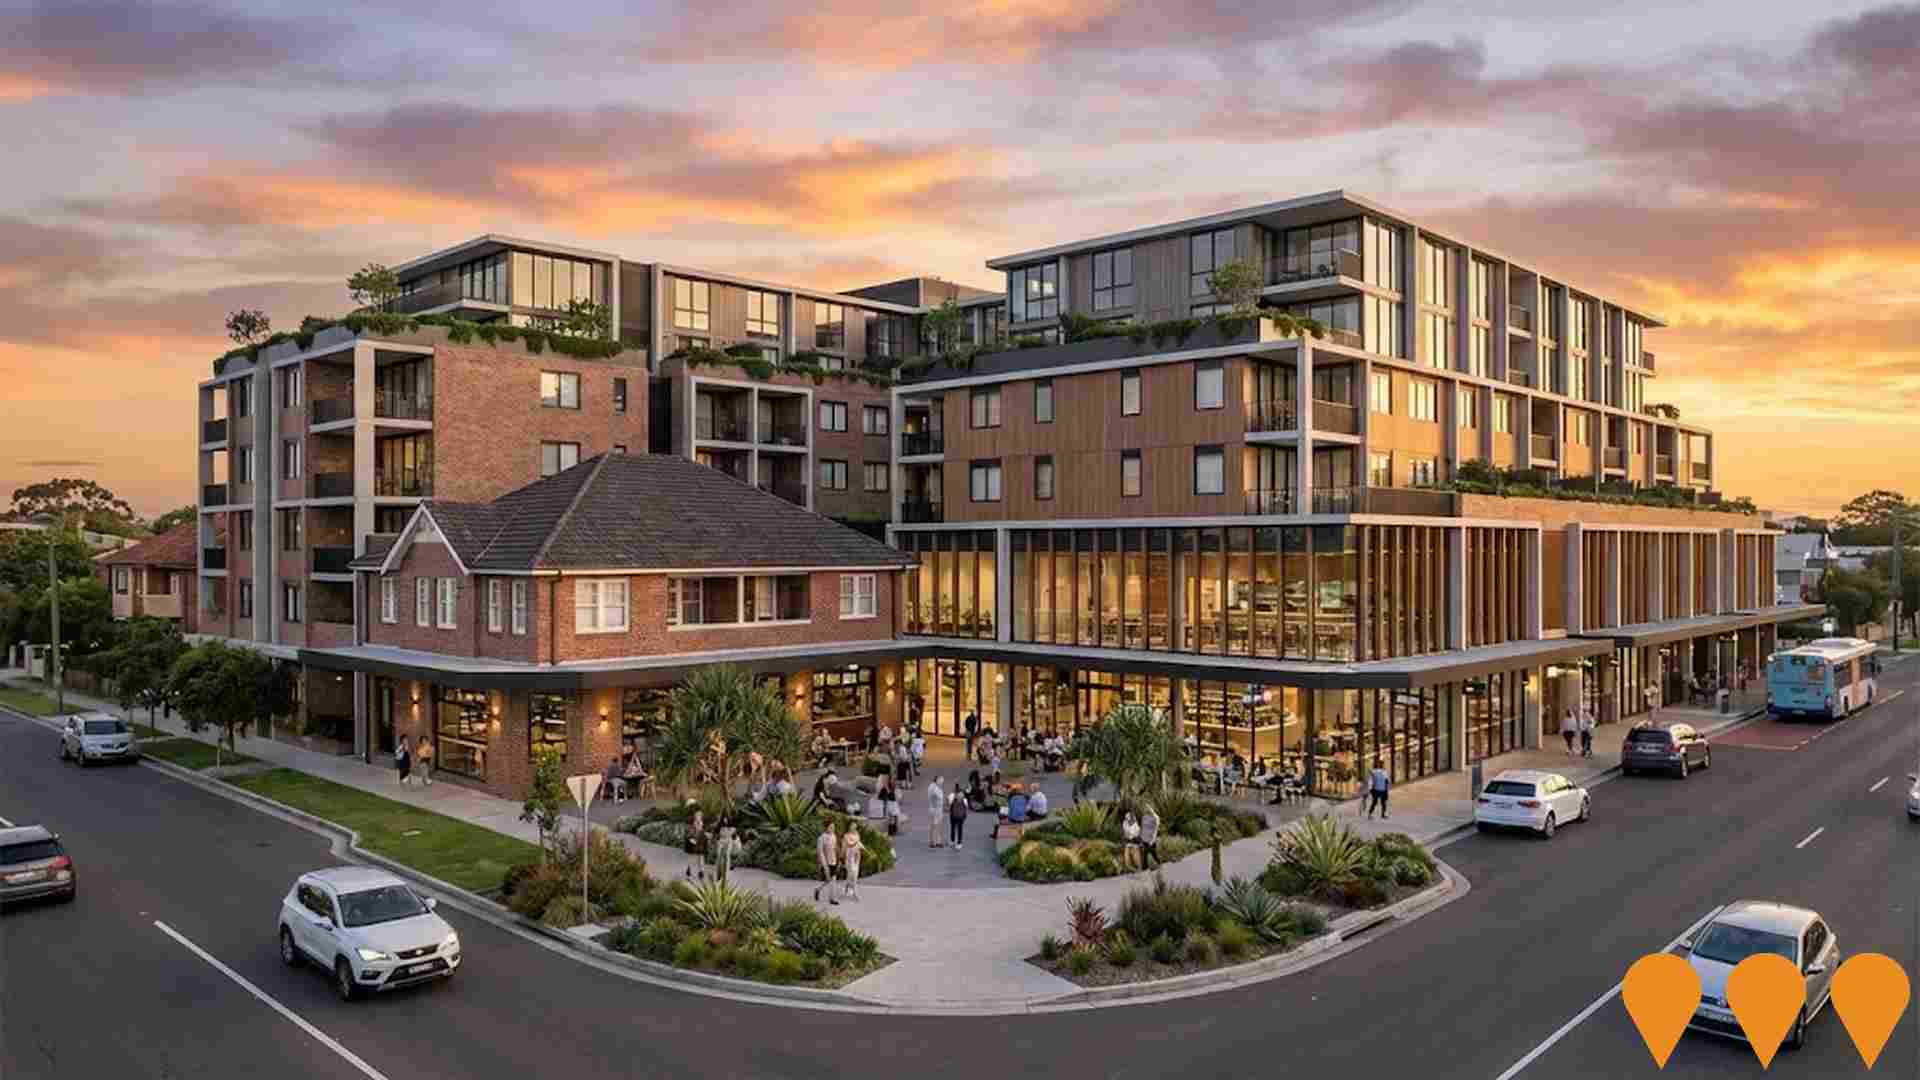
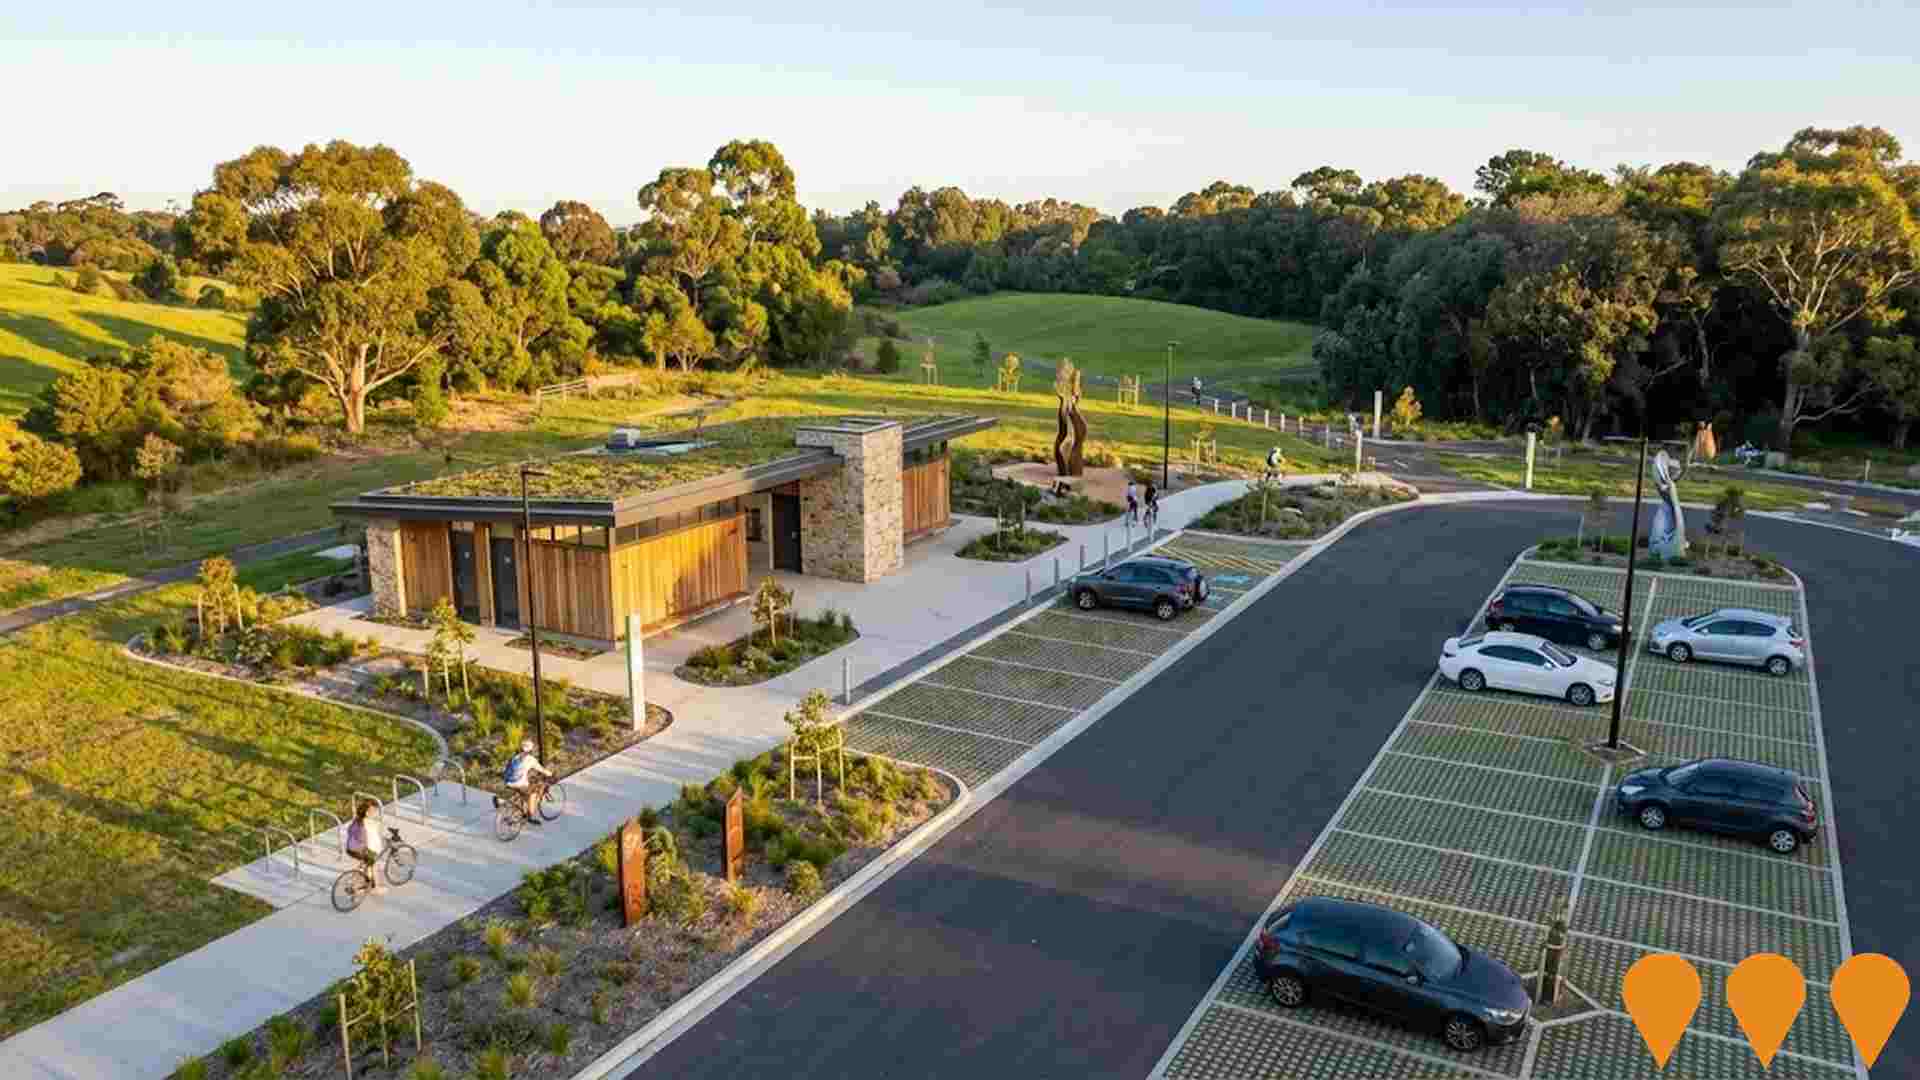
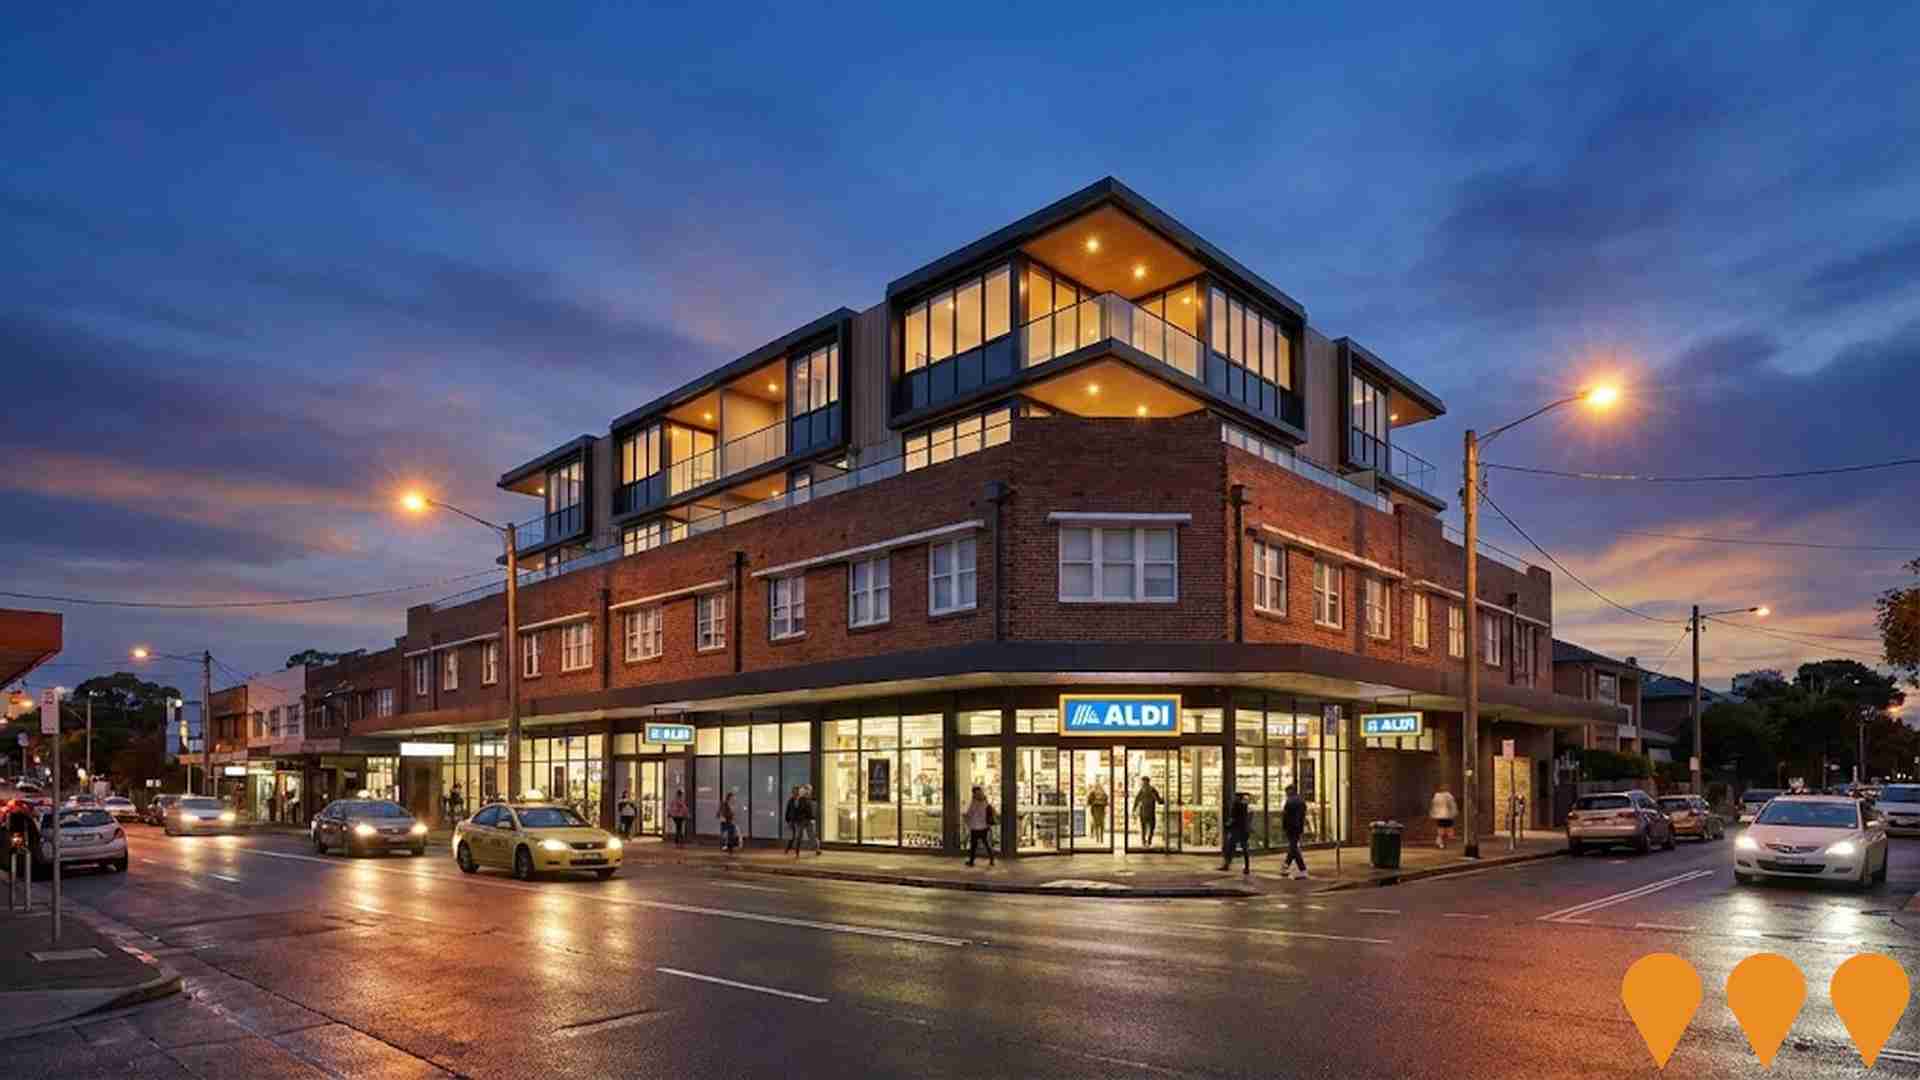
Changes to local infrastructure significantly influence an area's performance. AreaSearch identified 78 projects likely impacting the area. Key projects include Sydney Metro City & Southwest, Botany Aquatic Centre Redevelopment, Bexley North Hotel Mixed-Use Development, and Sir Joseph Banks Carpark and Amenities. The following list details those most relevant.
Professional plan users can use the search below to filter and access additional projects.
INFRASTRUCTURE SEARCH
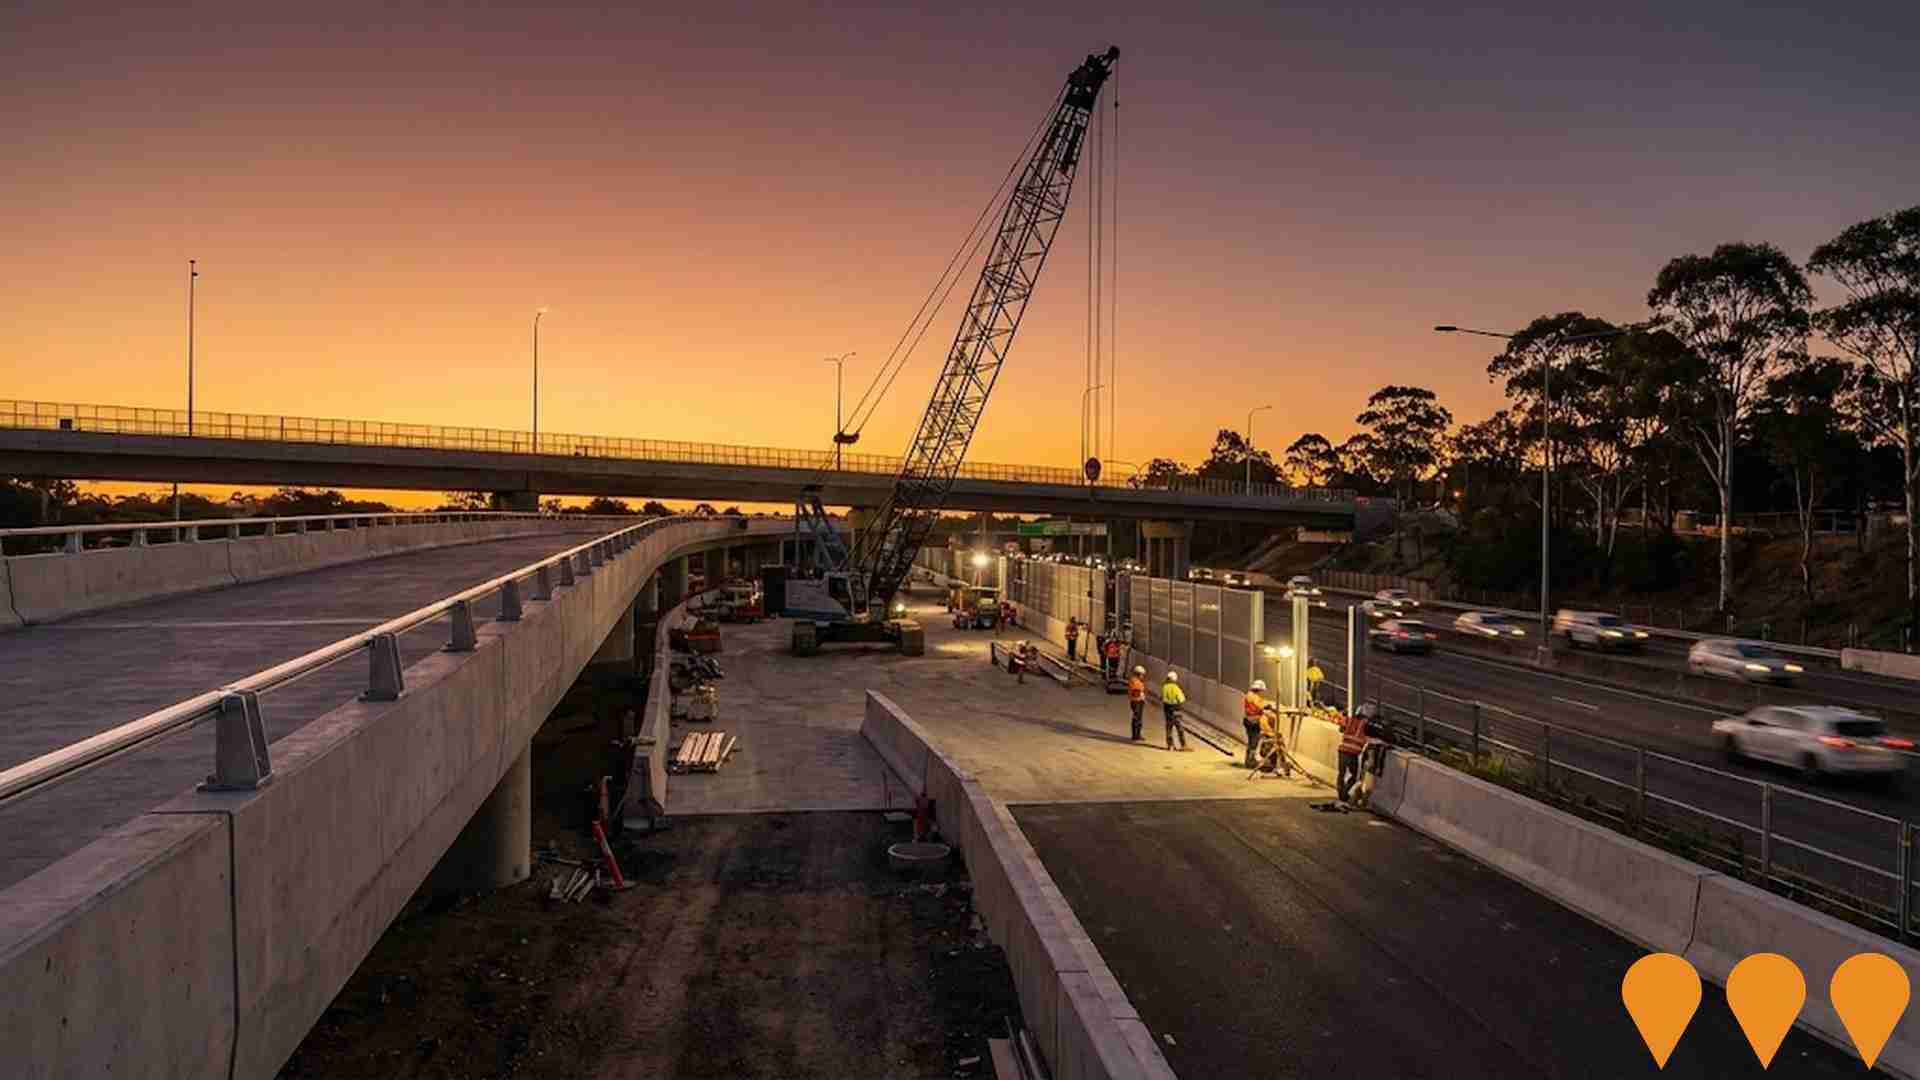
 Denotes AI-based impression for illustrative purposes only, not to be taken as definitive under any circumstances. Please follow links and conduct other investigations from the project's source for actual imagery. Developers and project owners wishing us to use original imagery please Contact Us and we will do so.
Frequently Asked Questions - Infrastructure
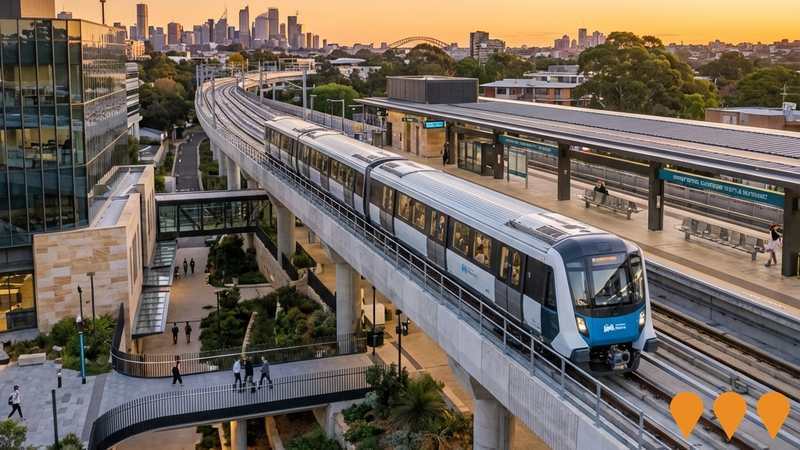
Sydney Metro City & Southwest
30km metro rail extension from Chatswood to Bankstown via the Sydney CBD, including 15.5km of new twin tunnels under Sydney Harbour and the CBD and the upgrade of the existing T3 Bankstown Line to metro standards. The Chatswood to Sydenham section (including new stations at Crows Nest, Victoria Cross, Barangaroo, Martin Place, Pitt Street, Waterloo and upgrade of Central) opened on 19 August 2024. The final Sydenham to Bankstown section is now under construction and scheduled to open in 2026 following resolution of industrial disputes. Features driverless trains, platform screen doors and full accessibility. Total project cost approximately A$21.6 billion (2024 figures).
Campsie Private Hospital
A $150 million, 218-bed private hospital development (11 storeys) delivering inpatient and outpatient services, emergency department, intensive care, maternity, day surgery, cardiac catheterisation labs, dialysis and oncology services. The project will create approximately 400 construction jobs and over 1,100 ongoing operational jobs, significantly increasing acute healthcare capacity in the Canterbury-Bankstown region.
Canterbury Hospital Redevelopment
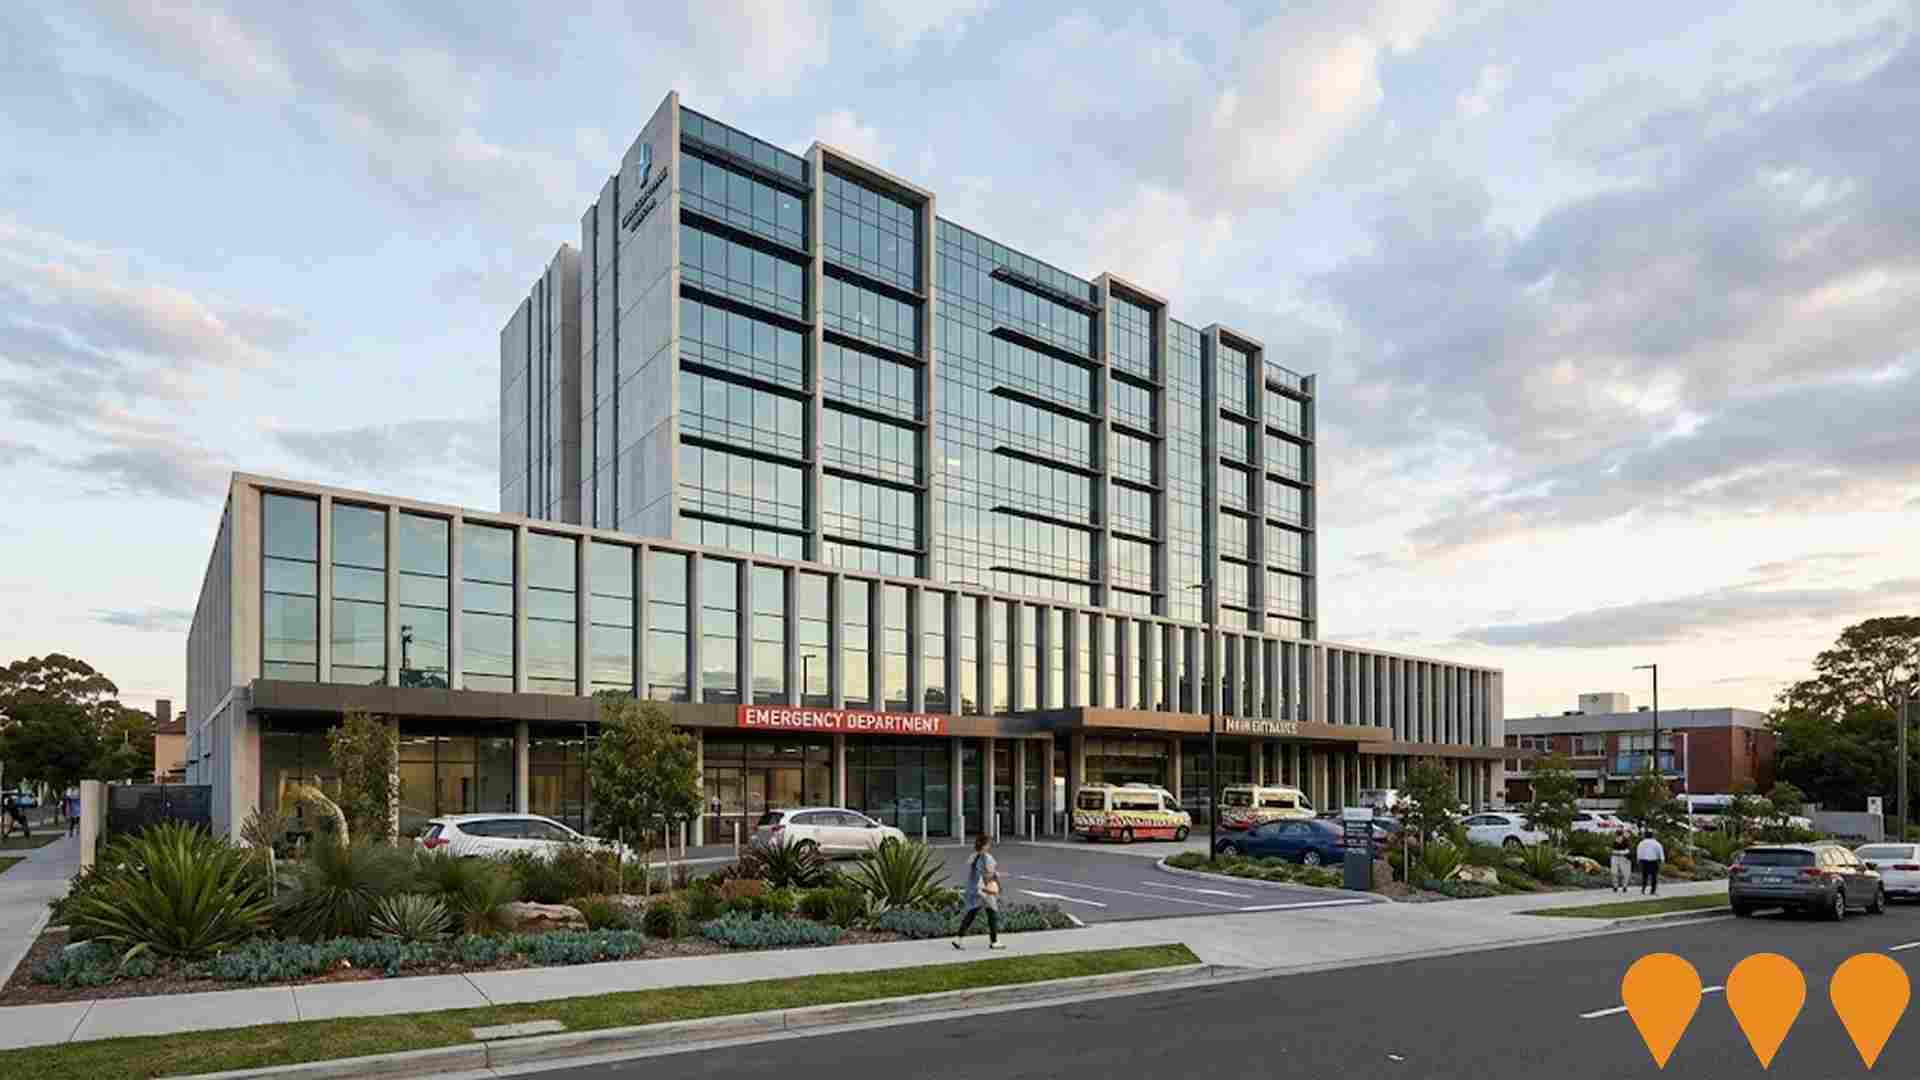
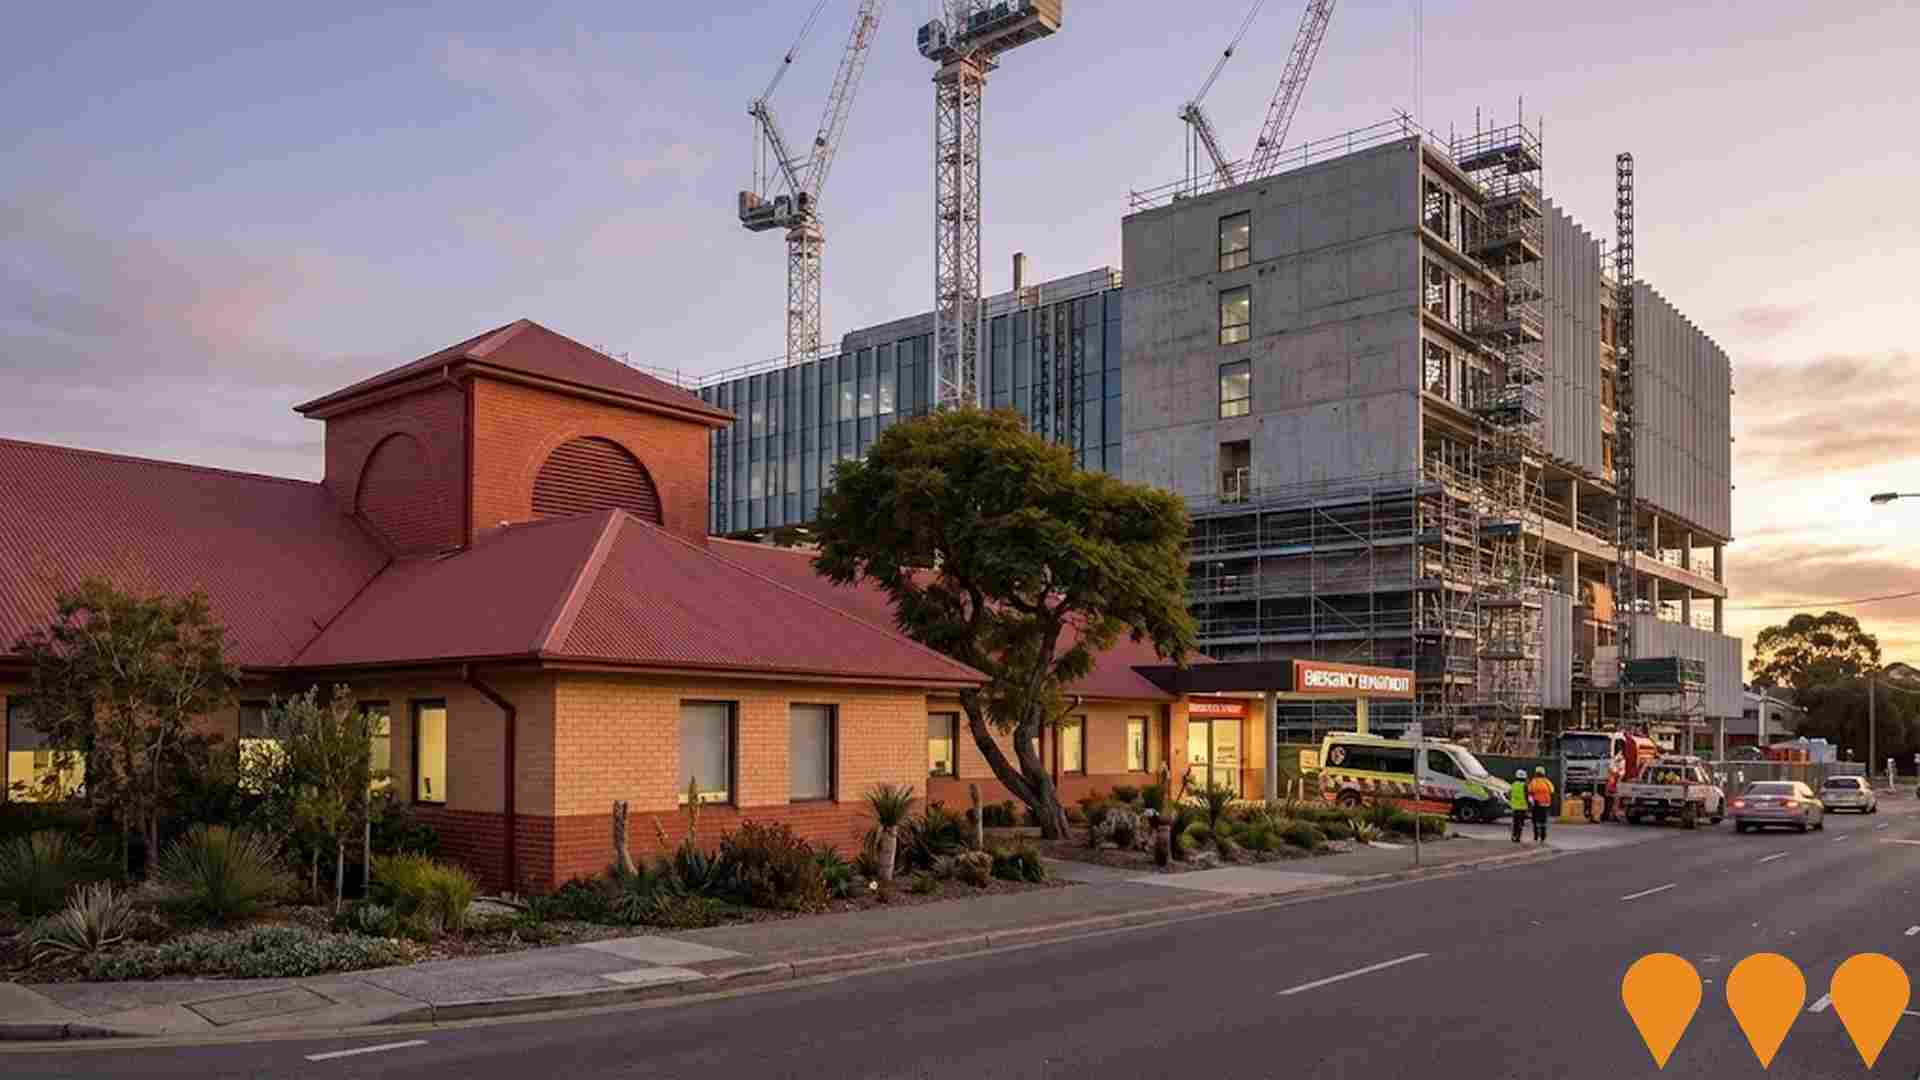
NSW Government is delivering a $470 million redevelopment of Canterbury Hospital (increased from original $350 million budget). The project is the largest expansion in over 25 years and includes a new clinical services building with expanded emergency department, intensive care unit, additional operating theatres, new inpatient units, expanded paediatric and maternity services, medical imaging, and a new main entry, and significant upgrades to existing facilities. Early works commenced in 2024, with main works construction starting in early 2025.
Cooks Cove Trade & Innovation Precinct
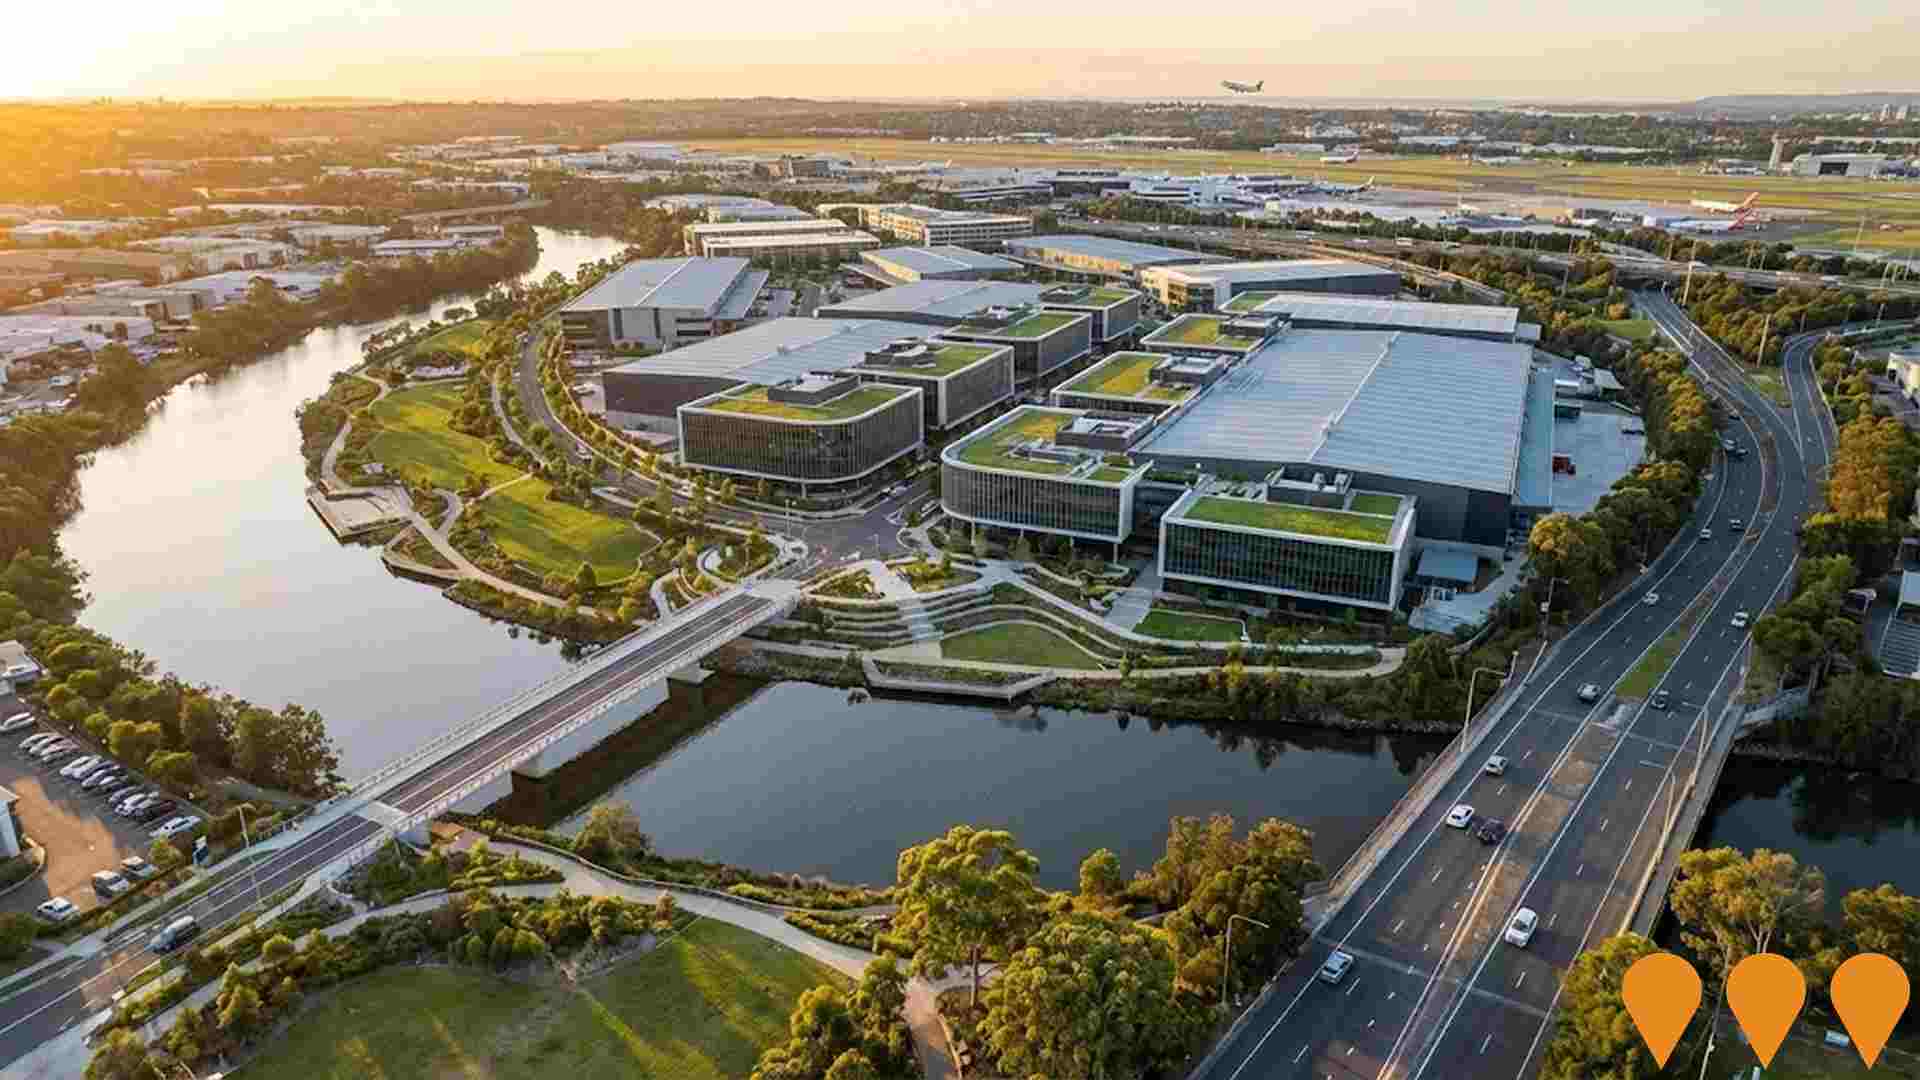
Major mixed-use trade, logistics and innovation precinct on the former Kogarah Golf Club site in Sydney's south. Delivers up to 343,250 sqm of commercial, logistics, warehousing, advanced manufacturing, hotel and supporting retail floorspace, 17.7 ha of public open space, waterfront access and new active transport links. Rezoning approved May 2025. Expected to create approximately 3,300 direct jobs and transform the Bayside West area.
Wolli Creek and Bonar Street Precincts Urban Renewal Area
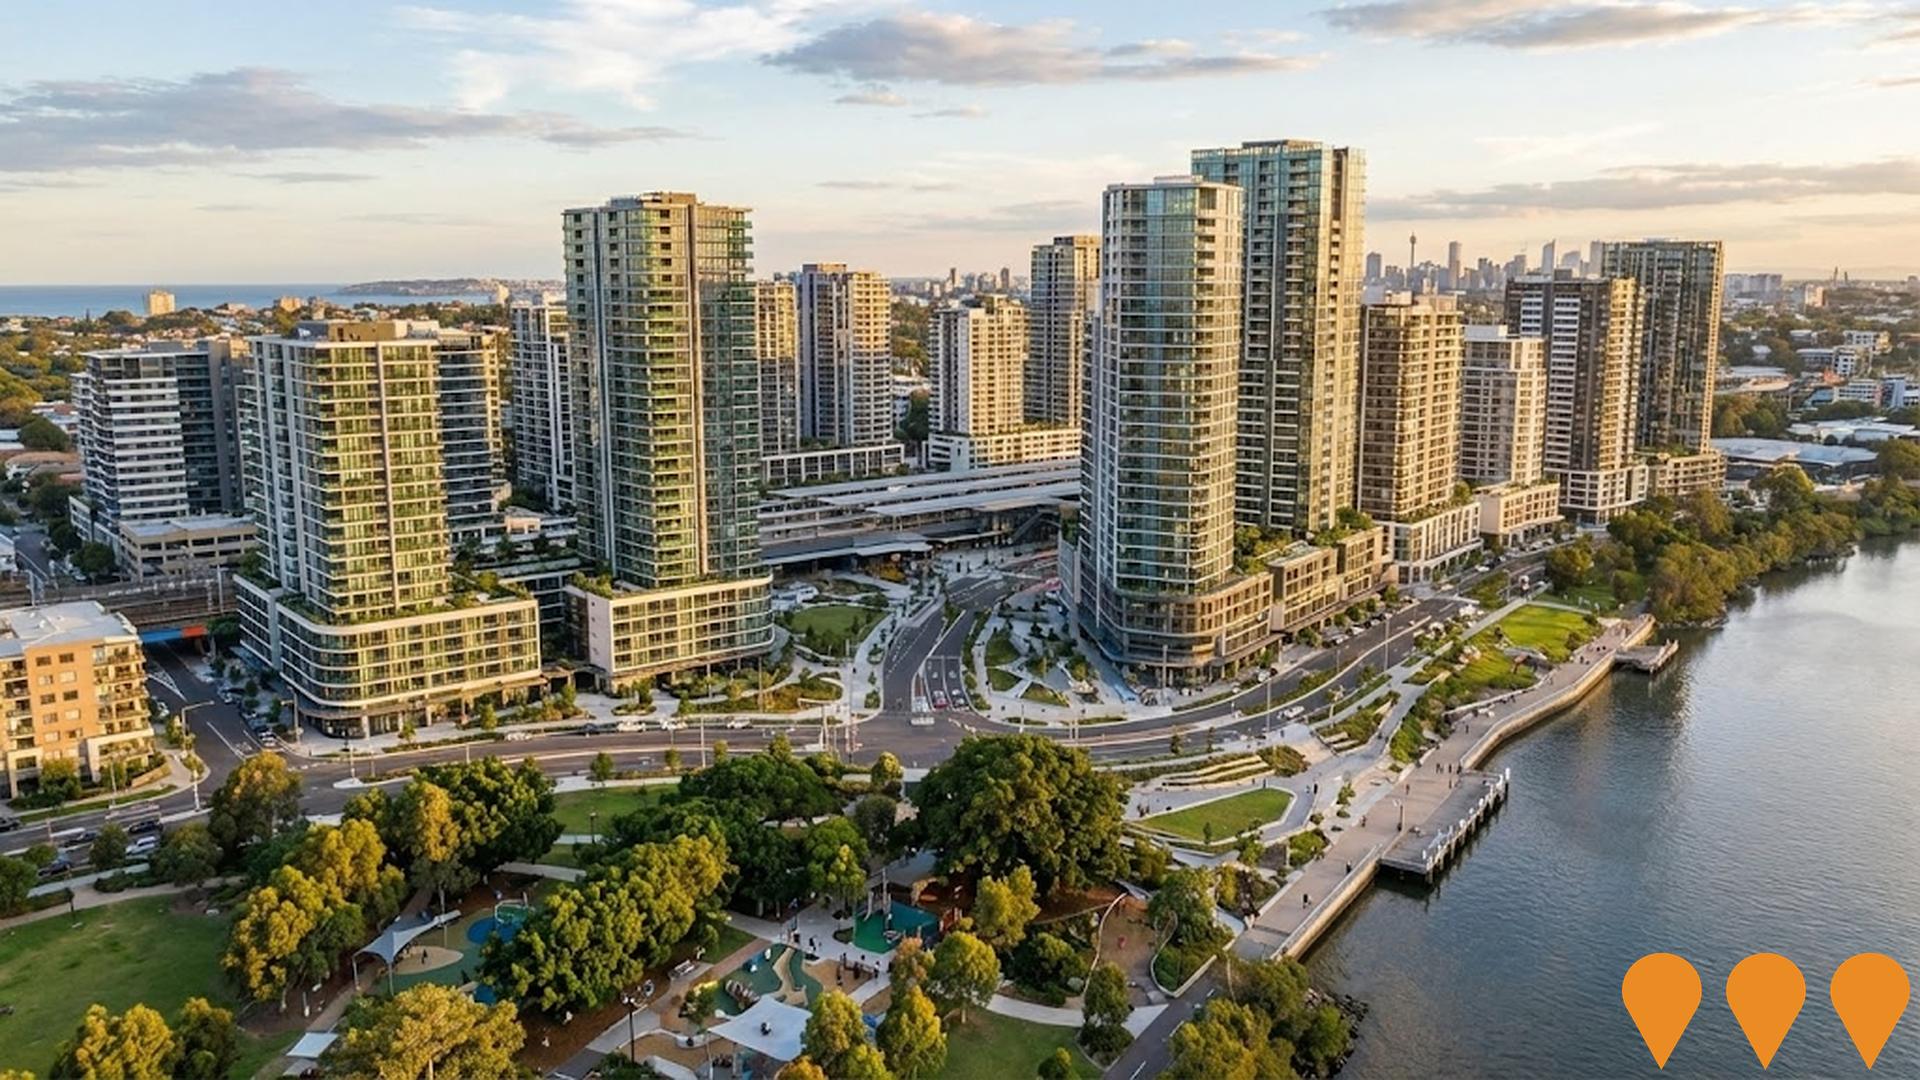
Comprehensive urban renewal area, formerly industrial, being redeveloped into a high-density, mixed-use residential and employment area centered around the Wolli Creek transport hub. The Contributions Plan 2019, adopted by Bayside Council, outlines a schedule of local infrastructure works with a total value of around $217 million (in 2019 dollars), to be funded by development contributions. This infrastructure includes open space, roads, flood mitigation, and community facilities. The plan is effective and enables contributions to fund the required infrastructure for the continuing urban transformation.
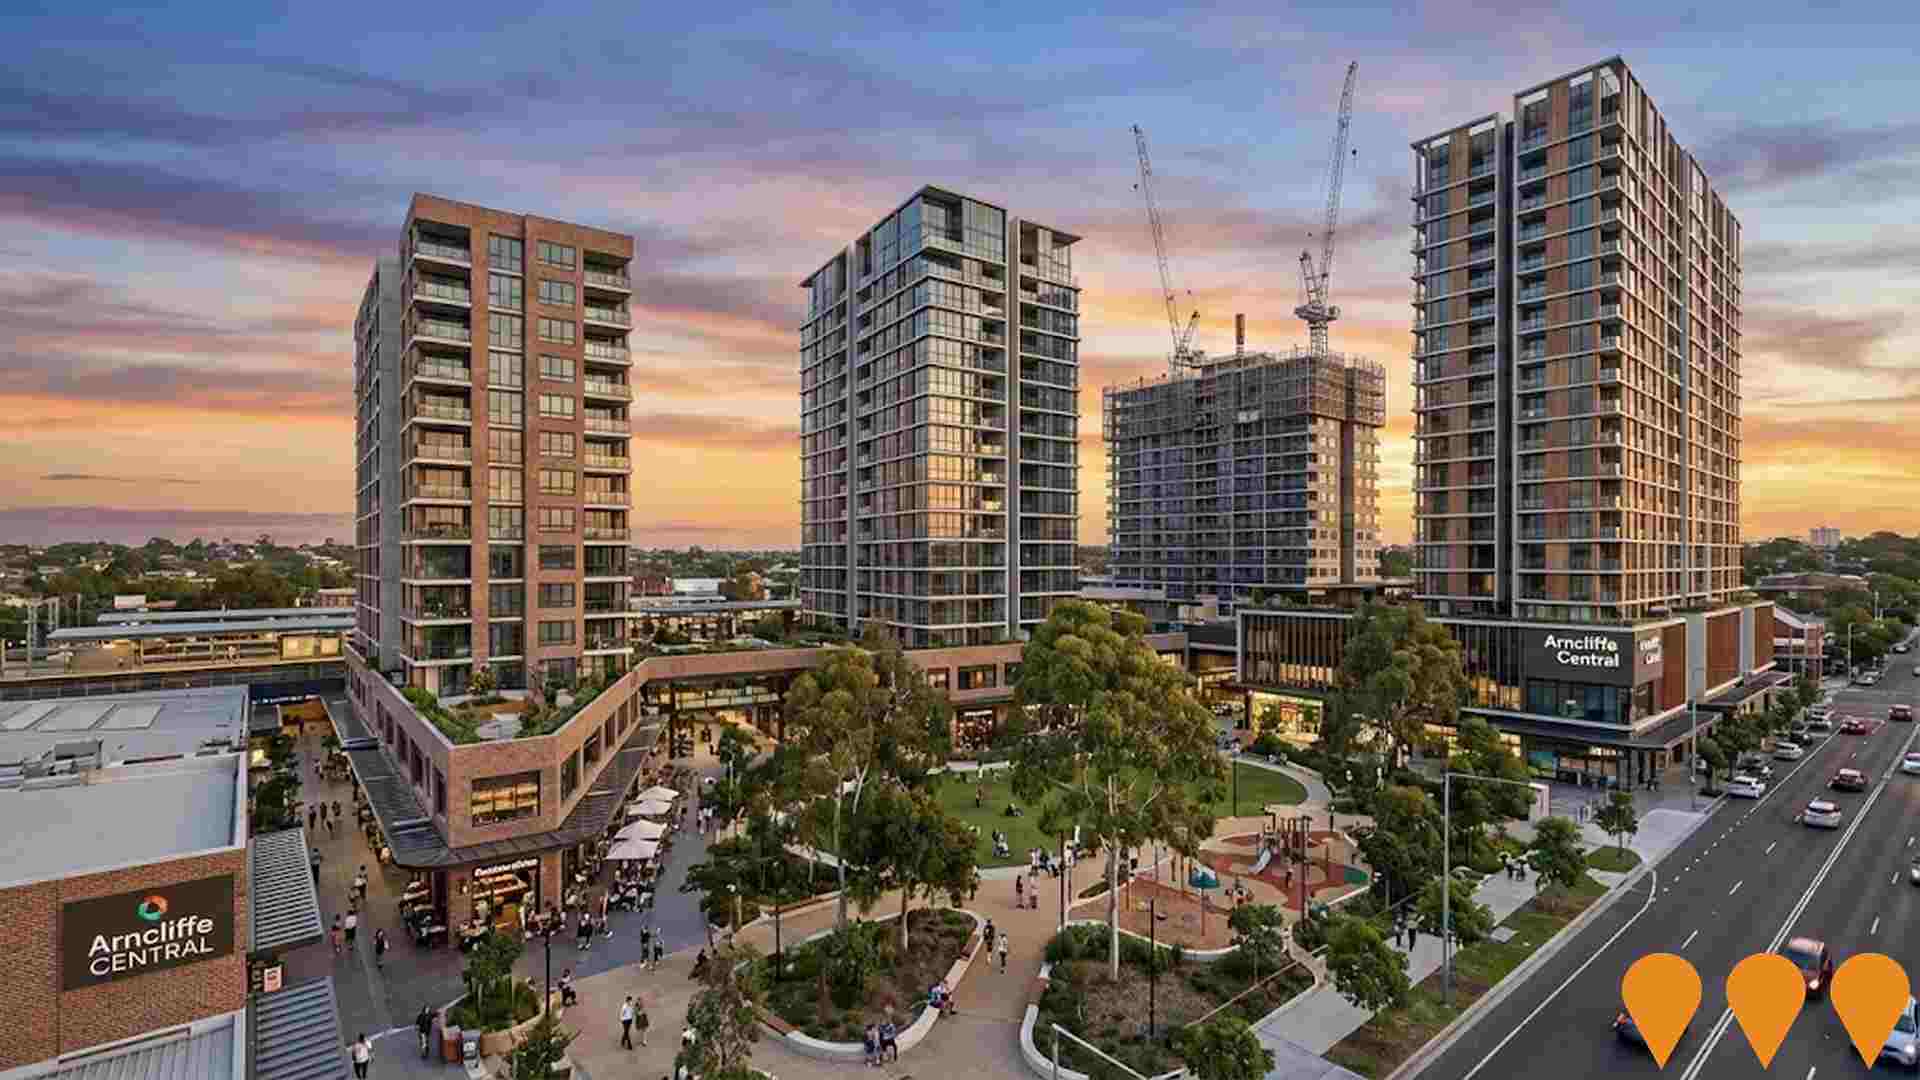
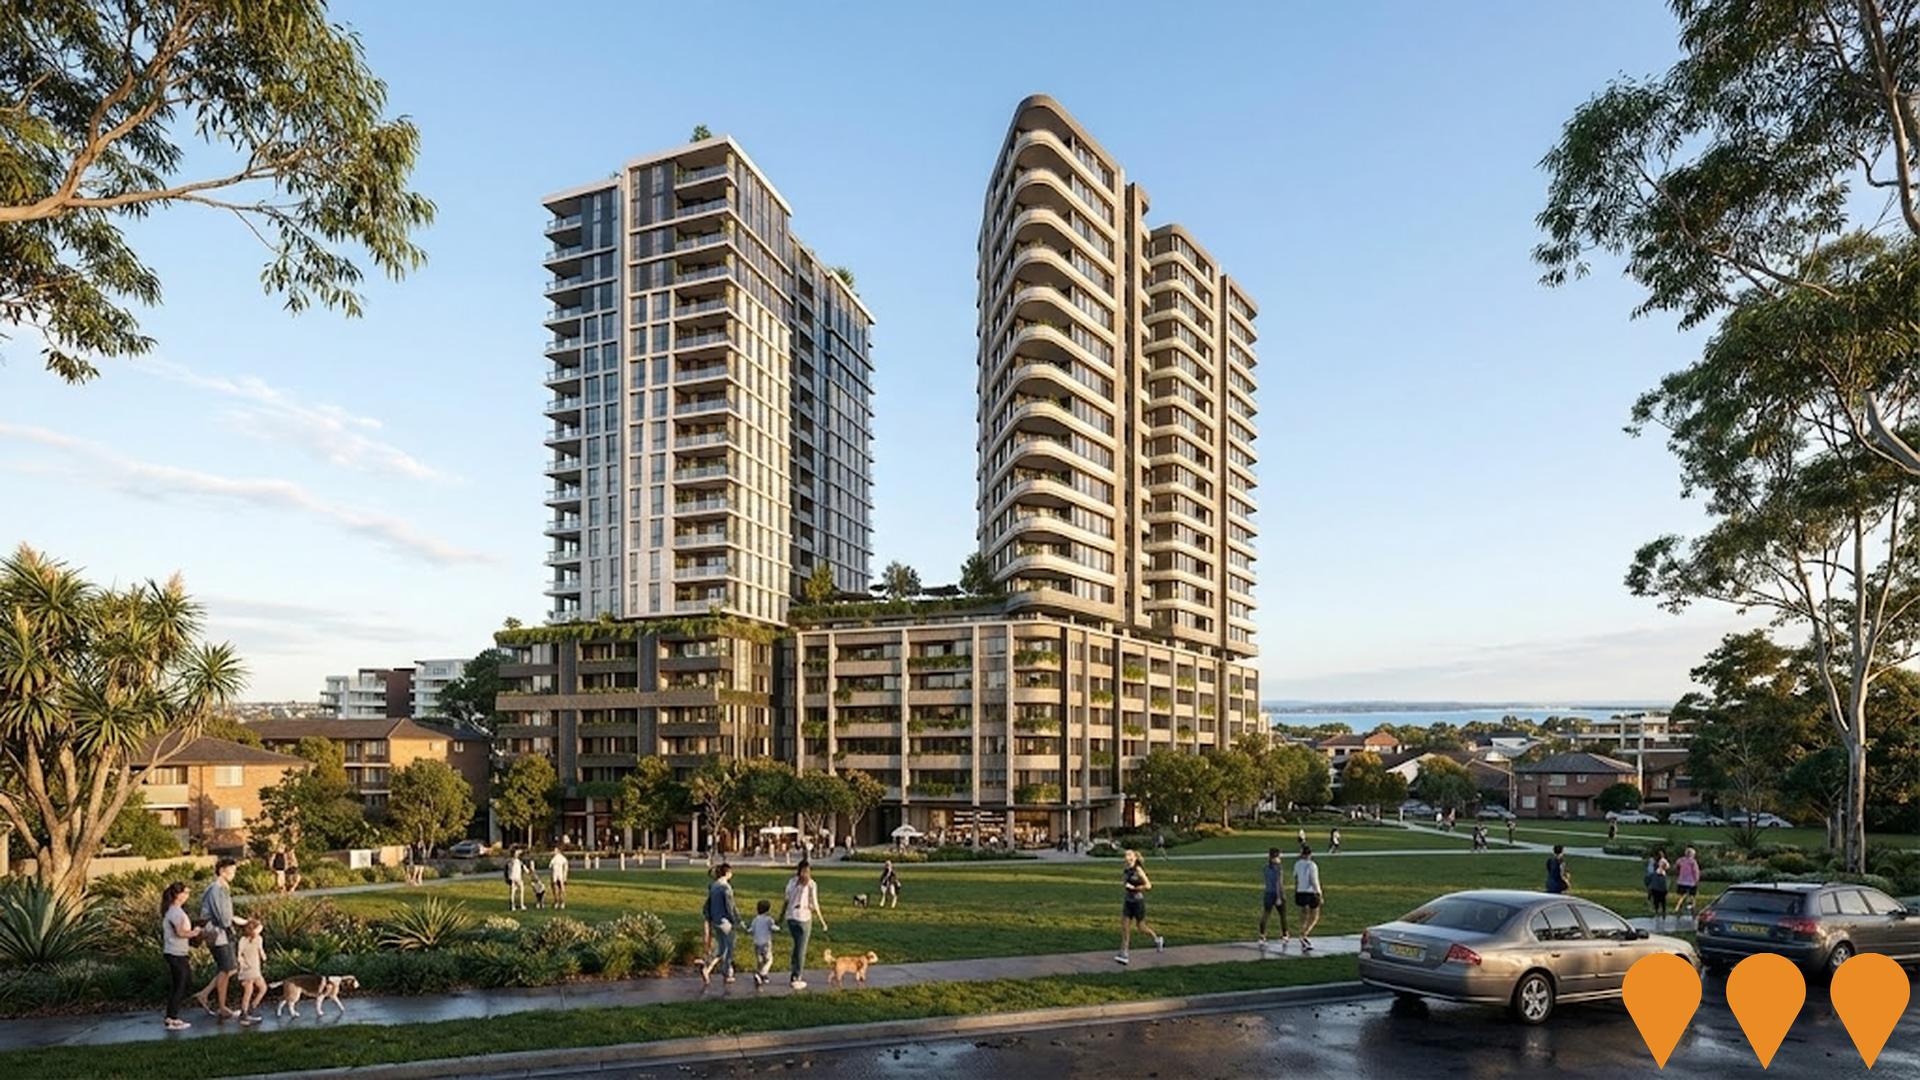
Arncliffe Estate Redevelopment
Arncliffe Central is a transformative mixed-tenure redevelopment replacing 142 ageing dwellings with 806 new residential units comprising four towers ranging from 17 to 21 storeys. The development includes 196 social housing units, affordable housing, and private market apartments integrated with a 4,000 sqm public park, retail precinct featuring supermarket and cafes, childcare centre, community centre and library. Construction commenced in 2023 with the project representing one of the largest mixed-tenure housing developments in NSW, delivered in partnership between NSW Land and Housing Corporation, Billbergia Group, Evolve Housing, and St George Community Housing.
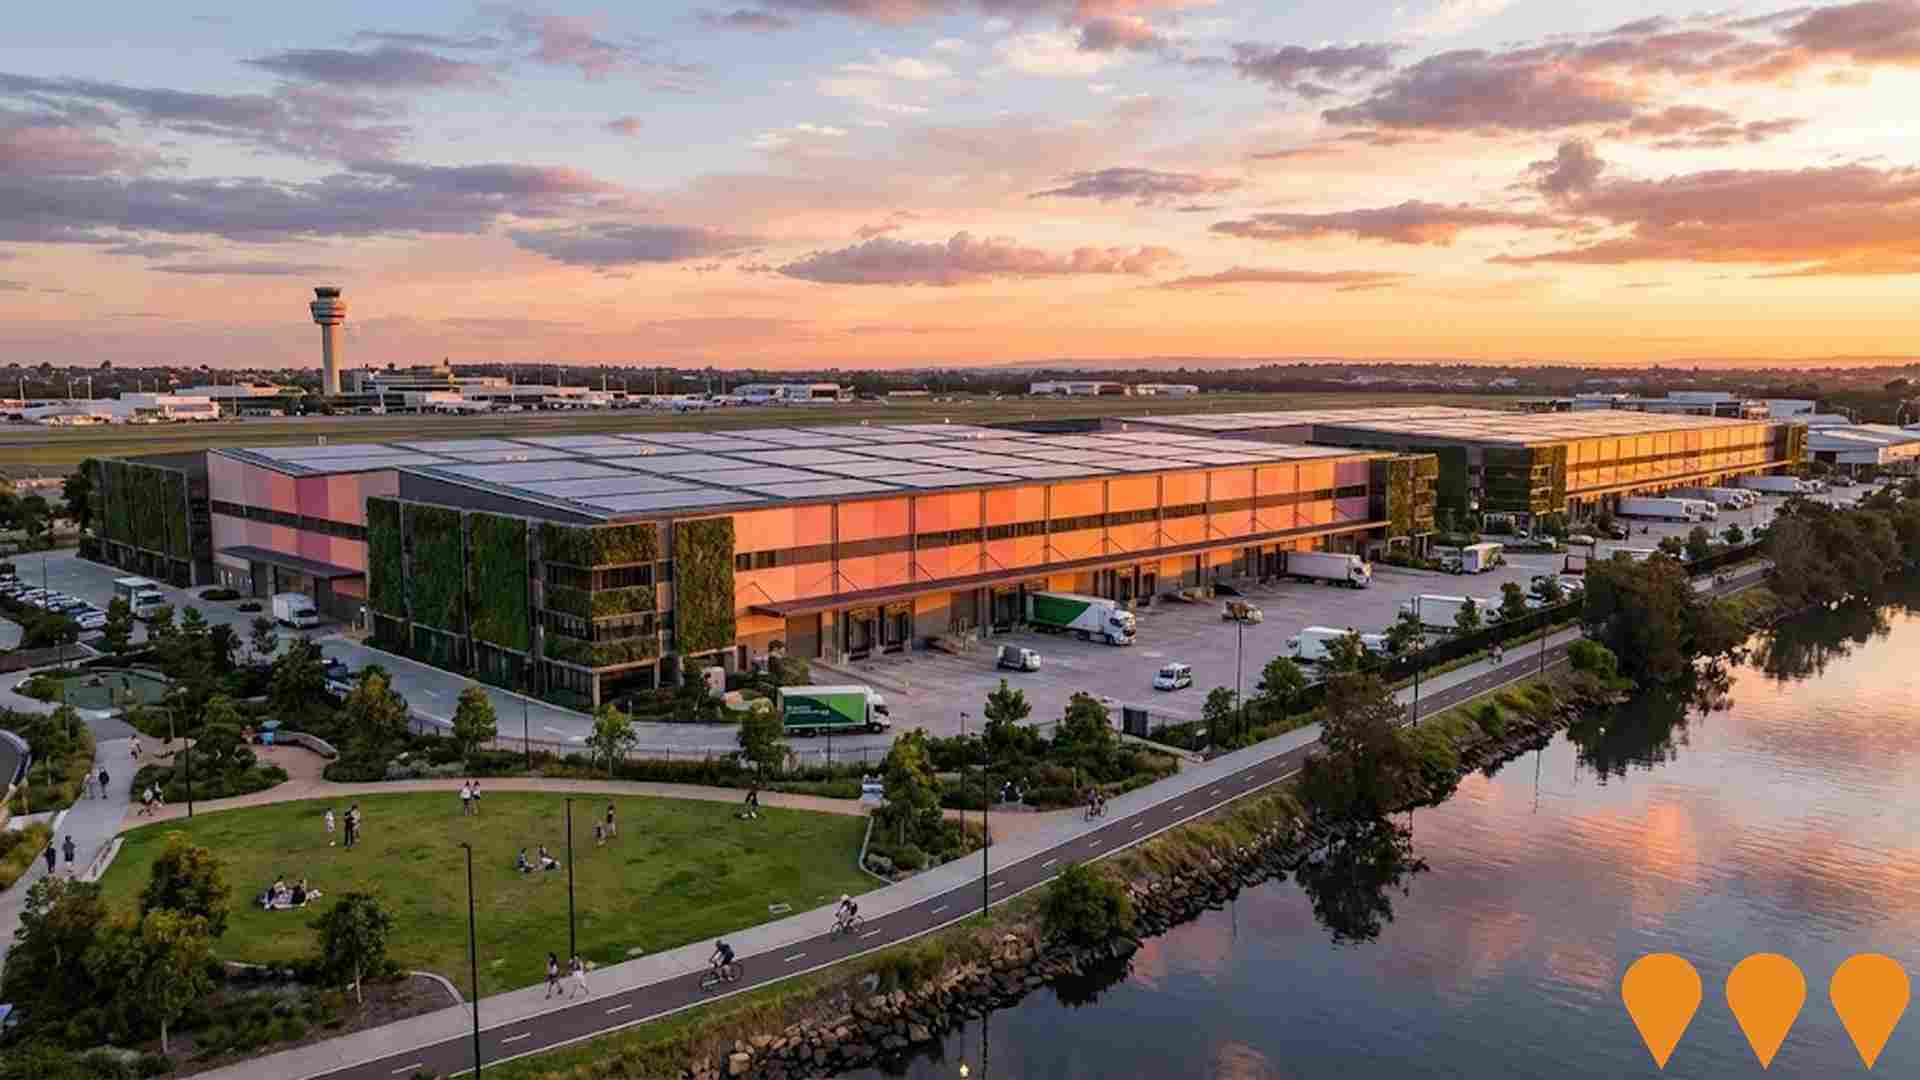
Kogarah Golf Club Redevelopment
Redevelopment of the 18.3-hectare former Kogarah Golf Club site into a world-class multi-storey logistics precinct with up to 340,000 square metres of floor space. The $3.5 billion project will feature aviation-linked logistics, high-value freight distribution for medical, technology and perishable goods, and last mile distribution facilities. The development includes plans for Pemulwuy Park, a 14-hectare public park to be delivered by Bayside Council, and an active transport corridor along the Cooks River. The precinct will incorporate solar power, energy efficient design, EV charging infrastructure, and adapt to evolving freight trends including automation, robotics and AI-driven warehouse management. Expected to generate 4,500 direct and indirect jobs once operational.
Sydney Metro City & Southwest - Sydenham to Bankstown (T3 Bankstown Line Conversion)
Conversion of the existing 13.5km T3 Bankstown Line between Sydenham and Bankstown to fully automated metro standards as the final stage of Sydney Metro City & Southwest. Includes upgrading 10 stations (Marrickville to Bankstown) plus Sydenham interchange with platform screen doors (plus mechanical gap fillers on curved platforms), full accessibility upgrades, line segregation, and enabling turn-up-and-go services every 4 minutes in peak. The line closed on 30 September 2024 for conversion works and intensive testing (high-speed testing commenced November 2025); opening now scheduled for 2026 due to earlier industrial impacts and integration complexity.

Employment
The labour market in Earlwood shows considerable strength compared to most other Australian regions
Earlwood has a highly educated workforce with strong representation in professional services. Its unemployment rate was 2.6% as of September 2025.
This figure is 1.6 percentage points lower than Greater Sydney's rate of 4.2%. The estimated employment growth over the past year was 3.6%. As of September 2025, there were 10,517 residents employed in Earlwood. Workforce participation in Earlwood was 55.7%, somewhat below Greater Sydney's 60.0%.
The dominant employment sectors among Earlwood's residents include health care & social assistance, education & training, and professional & technical services. Notably, the concentration in education & training is high at 1.3 times the regional average. Conversely, health care & social assistance is under-represented, with only 12.1% of Earlwood's workforce compared to Greater Sydney's 14.1%. Limited local employment opportunities are indicated by the lower count of Census working population versus resident population in Earlwood. Between September 2024 and September 2025, employment levels increased by 3.6%, while labour force grew by 4.0%, resulting in a rise of 0.3 percentage points in unemployment rate. In comparison, Greater Sydney recorded employment growth of 2.1% and an unemployment increase of 0.2 percentage points. State-wide, as of 25-Nov-25, NSW employment contracted by 0.03% (losing 2,260 jobs), with the state unemployment rate at 3.9%. This compares favourably to the national unemployment rate of 4.3%. National employment forecasts from Jobs and Skills Australia project a growth of 6.6% over five years and 13.7% over ten years. Applying these projections to Earlwood's employment mix suggests local employment should increase by approximately 6.8% over five years and 13.8% over ten years, assuming constant industry-specific growth rates.
Frequently Asked Questions - Employment
Income
Income metrics indicate excellent economic conditions, with the area achieving higher performance than 75% of national locations assessed by AreaSearch
AreaSearch's latest postcode level ATO data for financial year 2022 shows that income in Earlwood SA2 is among the highest in Australia. The median income is $58,766 and the average income stands at $81,759. This contrasts with Greater Sydney's figures of a median income of $56,994 and an average income of $80,856. Based on Wage Price Index growth of 12.61% since financial year 2022, current estimates would be approximately $66,176 for the median income and $92,069 for the average income as of September 2025. Census data reveals that household income ranks at the 75th percentile ($2,163 weekly), while personal income sits at the 56th percentile. Distribution data shows that the predominant cohort spans 27.9% of locals (5,057 people) in the $1,500 - 2,999 category, mirroring the broader area where 30.9% occupy this bracket. Higher earners represent a substantial presence with 35.7% exceeding $3,000 weekly, indicating strong purchasing power within the community. High housing costs consume 15.5% of income, though strong earnings still place disposable income at the 76th percentile and the area's SEIFA income ranking places it in the 8th decile.
Frequently Asked Questions - Income
Housing
Earlwood is characterized by a predominantly suburban housing profile, with above-average rates of outright home ownership
In Earlwood, as per the latest Census, houses constituted 80.2% of dwellings, with the remaining 19.8% comprising semi-detached homes, apartments, and other types. This differs from Sydney's metropolitan area, where houses accounted for 48.7%, and other dwellings made up 51.3%. Home ownership in Earlwood stood at 45.7%, with mortgaged dwellings at 33.3% and rented ones at 21.1%. The median monthly mortgage repayment was $2,809, exceeding Sydney's average of $2,167. The median weekly rent was $570, higher than Sydney's $390. Nationally, Earlwood's mortgage repayments were significantly higher than the Australian average of $1,863, and rents were substantially above the national figure of $375.
Frequently Asked Questions - Housing
Household Composition
Earlwood features high concentrations of family households, with a lower-than-average median household size
Family households constitute 78.1% of all households, consisting of 41.4% couples with children, 23.7% couples without children, and 11.9% single parent families. Non-family households comprise the remaining 21.9%, with lone person households at 19.3% and group households making up 2.6% of the total. The median household size is 2.8 people, which is smaller than the Greater Sydney average of 2.9.
Frequently Asked Questions - Households
Local Schools & Education
The educational profile of Earlwood exceeds national averages, with above-average qualification levels and academic performance metrics
University qualification levels in Earlwood stand at 33.2%, slightly below the Greater Sydney average of 38.0%. Bachelor degrees are the most common, held by 22.4% of residents. Postgraduate qualifications and graduate diplomas follow, with 8.3% and 2.5% respectively.
Vocational credentials are prominent, with 26.9% of residents aged 15+ holding them, including advanced diplomas (10.6%) and certificates (16.3%). Educational participation is high, with 28.1% currently enrolled in formal education: 8.8% in primary, 8.7% in secondary, and 5.6% pursuing tertiary education.
Frequently Asked Questions - Education
Schools Detail
Nearby Services & Amenities
Transport
Transport servicing is good compared to other areas nationally based on assessment of service frequency, route connectivity and accessibility
The analysis of public transport in Earlwood indicates that there are 91 active transport stops currently operating within the area. These stops primarily serve buses, with a total of 39 individual routes providing service. The collective weekly passenger trips across these routes amount to 3,517.
The accessibility of transport is rated as excellent, with residents in Earlwood typically located just 149 meters from their nearest transport stop. On average, there are 502 trips per day across all routes, which equates to approximately 38 weekly trips per individual stop.
Frequently Asked Questions - Transport
Transport Stops Detail
Health
Earlwood's residents are extremely healthy with both young and old age cohorts seeing low prevalence of common health conditions
Analysis of health metrics shows strong performance throughout Earlwood. Both young and old age cohorts exhibit low prevalence of common health conditions. The rate of private health cover is exceptionally high at approximately 61% of the total population (11,022 people), compared to 49.6% across Greater Sydney.
Nationally, this average stands at 55.3%. The most prevalent medical conditions in the area are arthritis and asthma, affecting 7.3 and 5.6% of residents respectively. Notably, 73.2% of residents declare themselves completely clear of medical ailments, compared to 77.7% across Greater Sydney. Earlwood has 21.4% of residents aged 65 and over (3,875 people), which is higher than the 15.8% in Greater Sydney. Health outcomes among seniors are particularly strong, broadly aligning with the general population's health profile.
Frequently Asked Questions - Health
Cultural Diversity
Earlwood is among the most culturally diverse areas in the country based on AreaSearch assessment of a range of language and cultural background related metrics
Earlwood has a high level of cultural diversity, with 35.9% of its population born overseas and 48.1% speaking a language other than English at home. Christianity is the predominant religion in Earlwood, comprising 66.5% of the population, compared to 45.8% across Greater Sydney. The top three ancestry groups in Earlwood are Greek (17.9%), Other (14.3%), and Australian (13.5%).
Notably, Lebanese people make up 6.3% of Earlwood's population, Vietnamese 2.9%, and Italian 7.2%.
Frequently Asked Questions - Diversity
Age
Earlwood hosts a notably older demographic compared to the national average
Earlwood has a median age of 44, which exceeds Greater Sydney's figure of 37 and is significantly higher than Australia's national norm of 38. The age group of 55-64 years old makes up 13.3% of Earlwood's population, compared to Greater Sydney's percentage. Meanwhile, the 25-34 age group constitutes 10.4%. According to the 2021 Census, the 15-24 age group has increased from 11.5% to 13.3%, while the 5-14 cohort has decreased from 11.8% to 10.2%. The 45-54 age group has also dropped slightly from 15.8% to 14.5%. By 2041, demographic modeling predicts significant changes in Earlwood's age profile. Notably, the 65-74 age group is projected to grow by 38%, reaching 2,382 people from its current figure of 1,724. This growth will be led entirely by those aged 65 and above, who will comprise all of Earlwood's population growth. Conversely, the 25-34 and 45-54 age groups are expected to experience population declines.
