Chart Color Schemes
This analysis uses ABS Statistical Areas Level 2 (SA2) boundaries, which can materially differ from Suburbs and Localities (SAL) even when sharing similar names.
SA2 boundaries are defined by the Australian Bureau of Statistics and are designed to represent communities for statistical reporting (e.g., census and ERP).
Suburbs and Localities (SAL) represent commonly-used suburb/locality names (postal-style areas) and may use different geographic boundaries. For comprehensive analysis, consider reviewing both boundary types if available.
est. as @ -- *
ABS ERP | -- people | --
2021 Census | -- people
Sales Activity
Curious about local property values? Filter the chart to assess the volume and appreciation (including resales) trends and regional comparisons, or scroll to the map below view this information at an individual property level.
Find a Recent Sale
Sales Detail
Population
Wangaratta Surrounds has seen population growth performance typically on par with national averages when looking at short and medium term trends
Wangaratta Surrounds' population is approximately 10,212 as of November 2025. This figure represents an increase of 287 people since the 2021 Census, which recorded a population of 9,925. The growth is inferred from the estimated resident population of 10,100 in June 2024 and an additional 82 validated new addresses since the Census date. This results in a population density of 2.8 persons per square kilometer. Wangaratta Surrounds' 2.9% growth since the census is within 1.1 percentage points of the SA3 area's 4.0%, indicating competitive growth fundamentals. Natural growth contributed approximately 41.0% of overall population gains during recent periods, with all drivers including interstate and overseas migration being positive factors.
AreaSearch uses ABS/Geoscience Australia projections for each SA2 area, released in 2024 with a base year of 2022. For areas not covered by this data, AreaSearch employs the VIC State Government's Regional/LGA projections from 2023, adjusted using a method of weighted aggregation of population growth from LGA to SA2 levels. Growth rates by age group are applied across all areas for years 2032 to 2041. Future demographic trends suggest an above median population growth in Australia's non-metropolitan areas, with Wangaratta Surrounds expected to increase by 2,309 persons to 2041 based on the latest annual ERP population numbers, reflecting a total increase of 21.5% over the 17 years.
Frequently Asked Questions - Population
Development
AreaSearch analysis of residential development drivers sees Wangaratta Surrounds recording a relatively average level of approval activity when compared to local markets analysed countrywide
Wangaratta Surrounds granted around 34 residential property approvals annually over the past five financial years, totalling 173 homes. In FY26 so far, 16 approvals have been recorded. On average, 1.6 new residents arrived per new home each year between FY21 and FY25. The average dwelling value was $398,000.
This financial year saw $4.7 million in commercial development approvals. Compared to Rest of Vic., Wangaratta Surrounds records approximately 56% of building activity per person, placing it at the 47th percentile nationally. New construction comprised entirely of detached houses maintained the area's low density character. As of FY25, there were an estimated 351 people per dwelling approval.
By 2041, Wangaratta Surrounds is forecast to gain 2,197 residents. If current construction levels persist, housing supply may lag population growth, potentially intensifying buyer competition and supporting price growth.
Frequently Asked Questions - Development
Infrastructure
Wangaratta Surrounds has moderate levels of nearby infrastructure activity, ranking in the 41stth percentile nationally
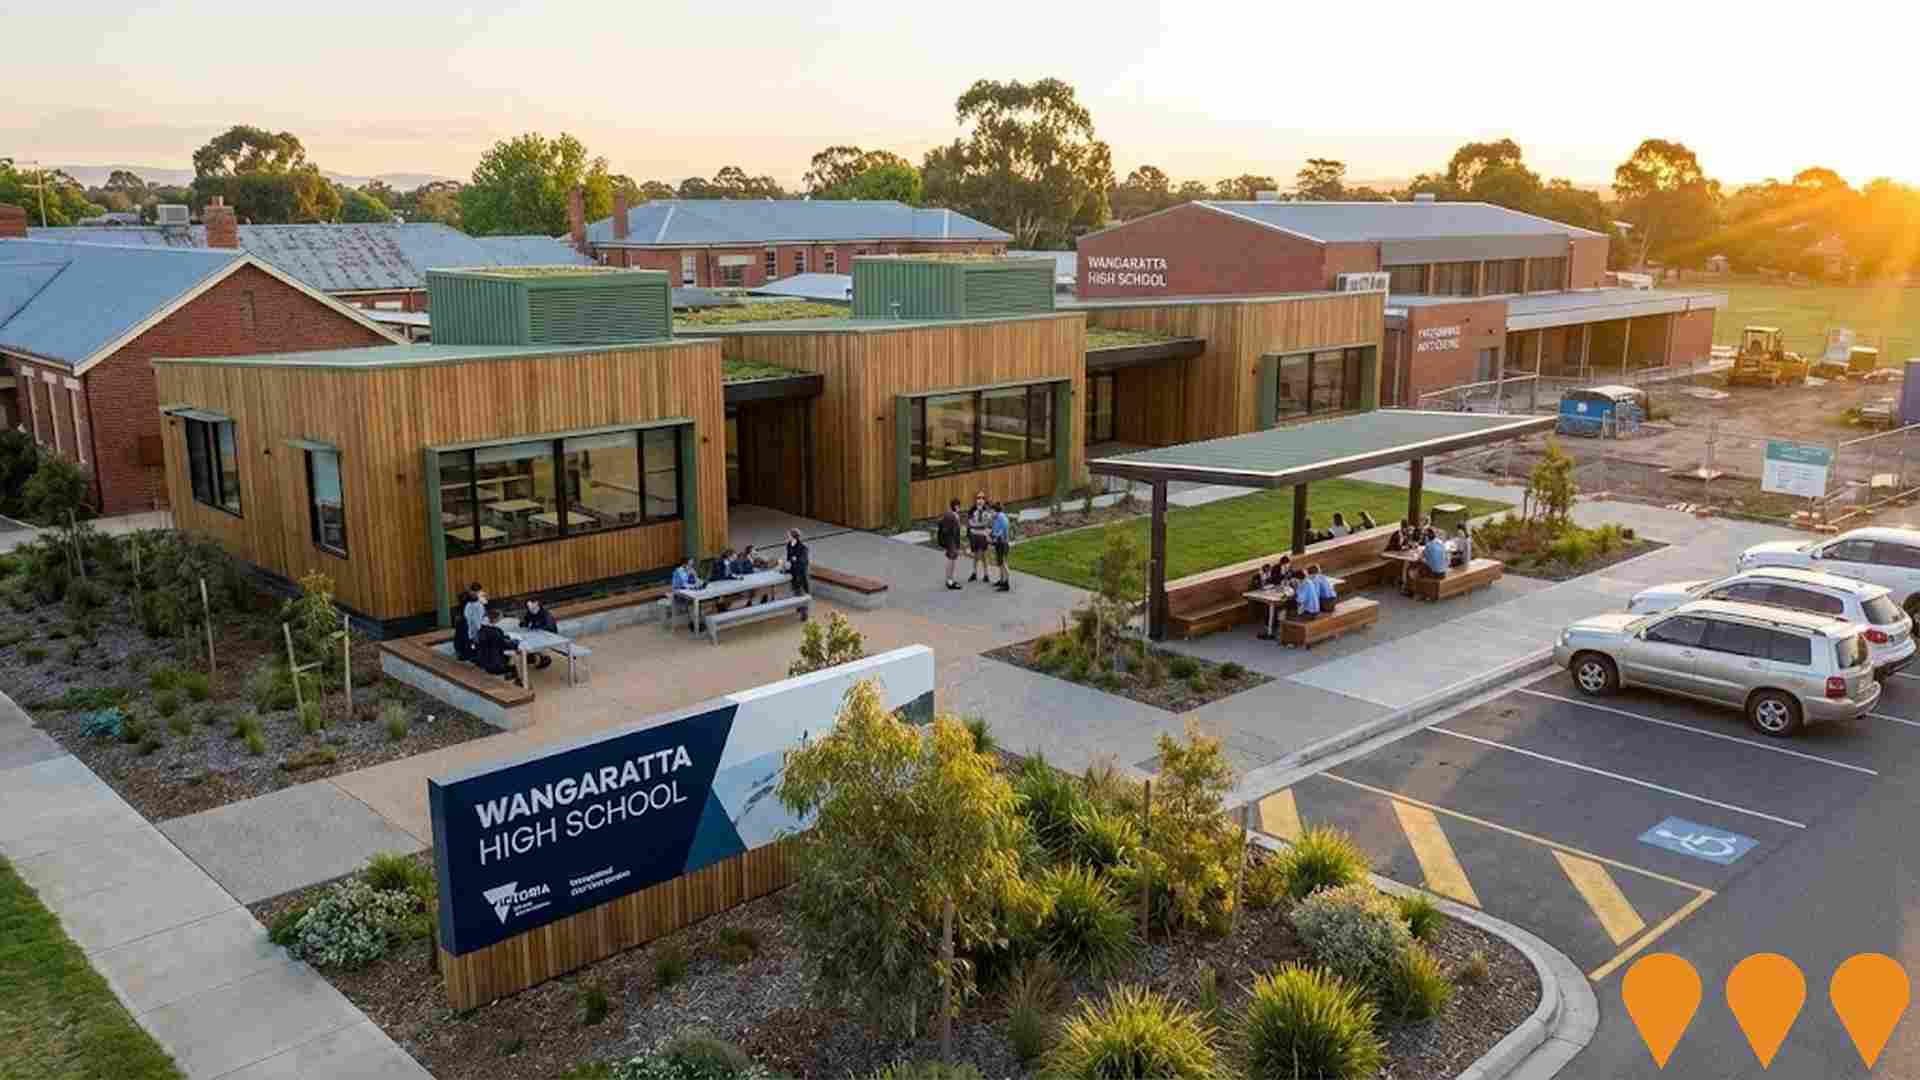
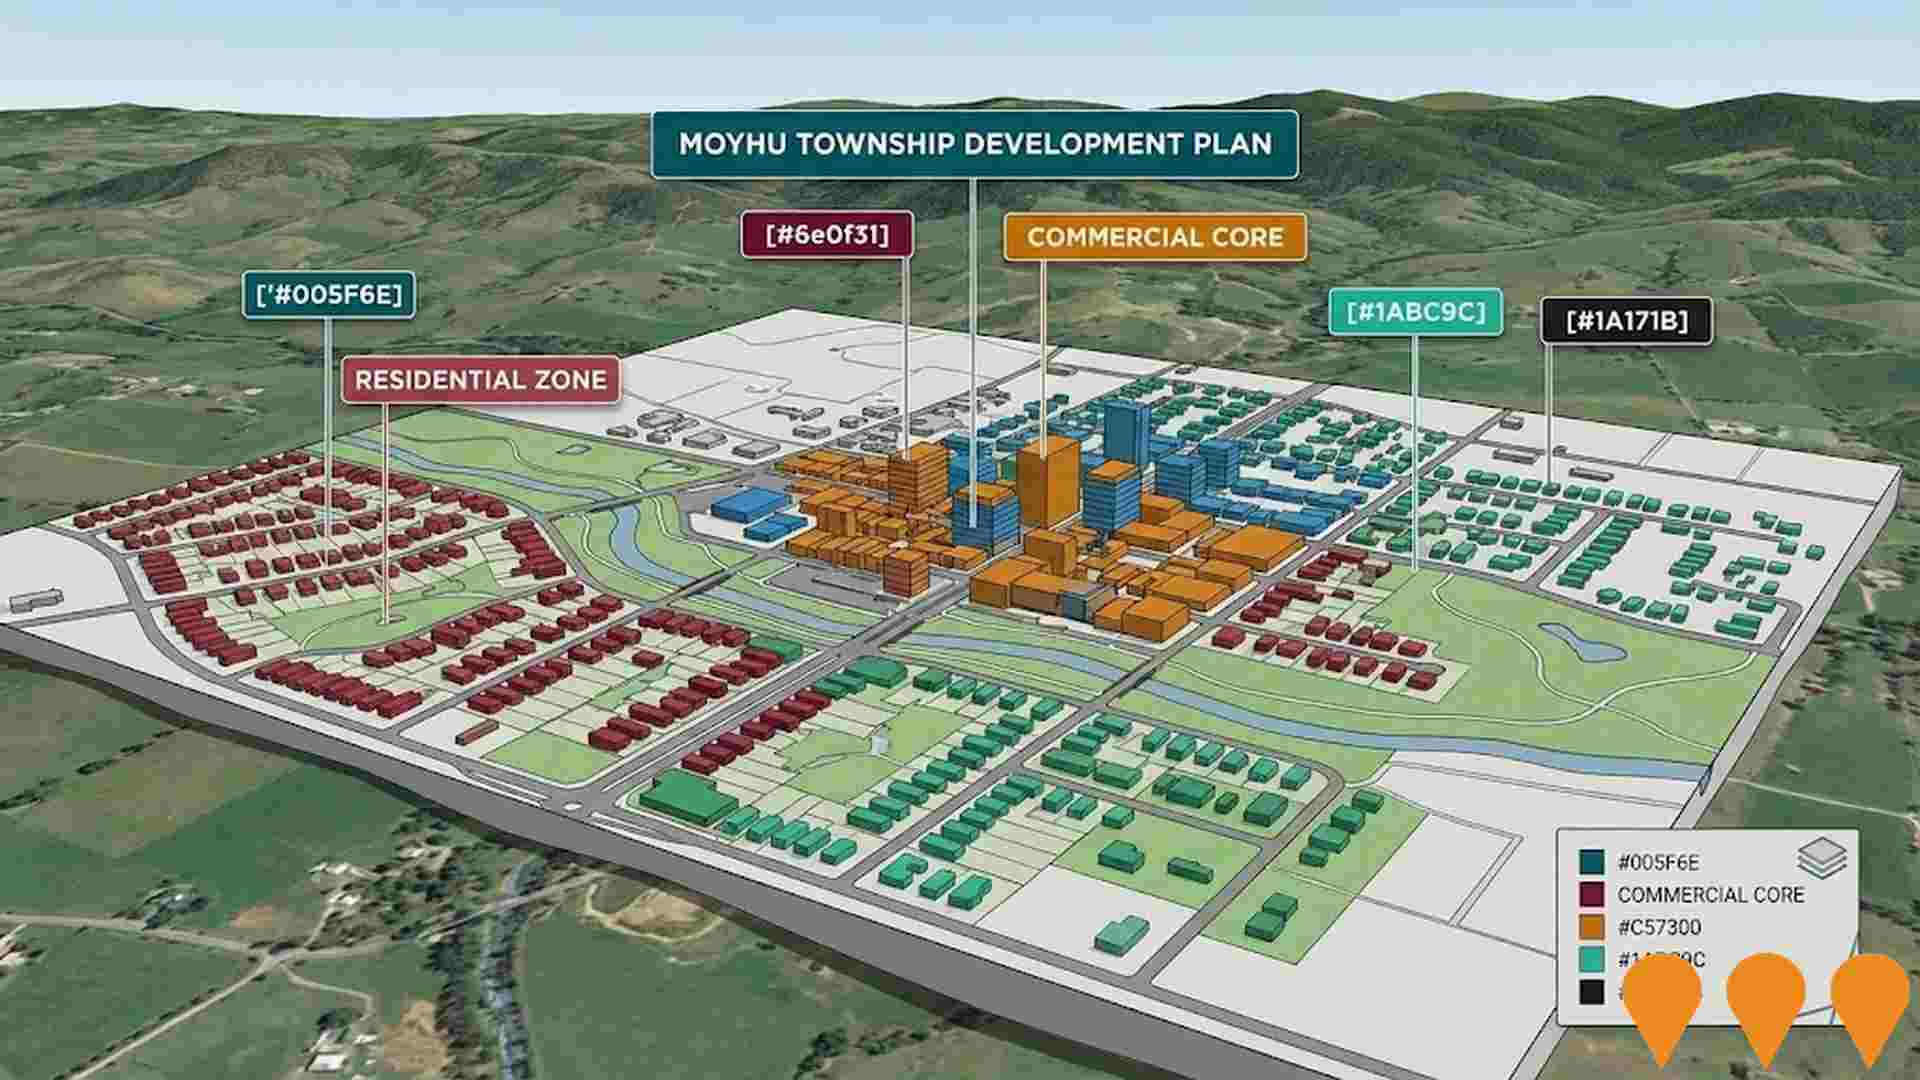
Infrastructure changes significantly influence an area's performance. AreaSearch identified 29 projects likely impacting the region. Notable ones include Moyhu Township Development Plan, South Wangaratta Residential Growth Area, Mason Street Residential Development, and Wangaratta Landmark Retail Development Site.
Professional plan users can use the search below to filter and access additional projects.
INFRASTRUCTURE SEARCH
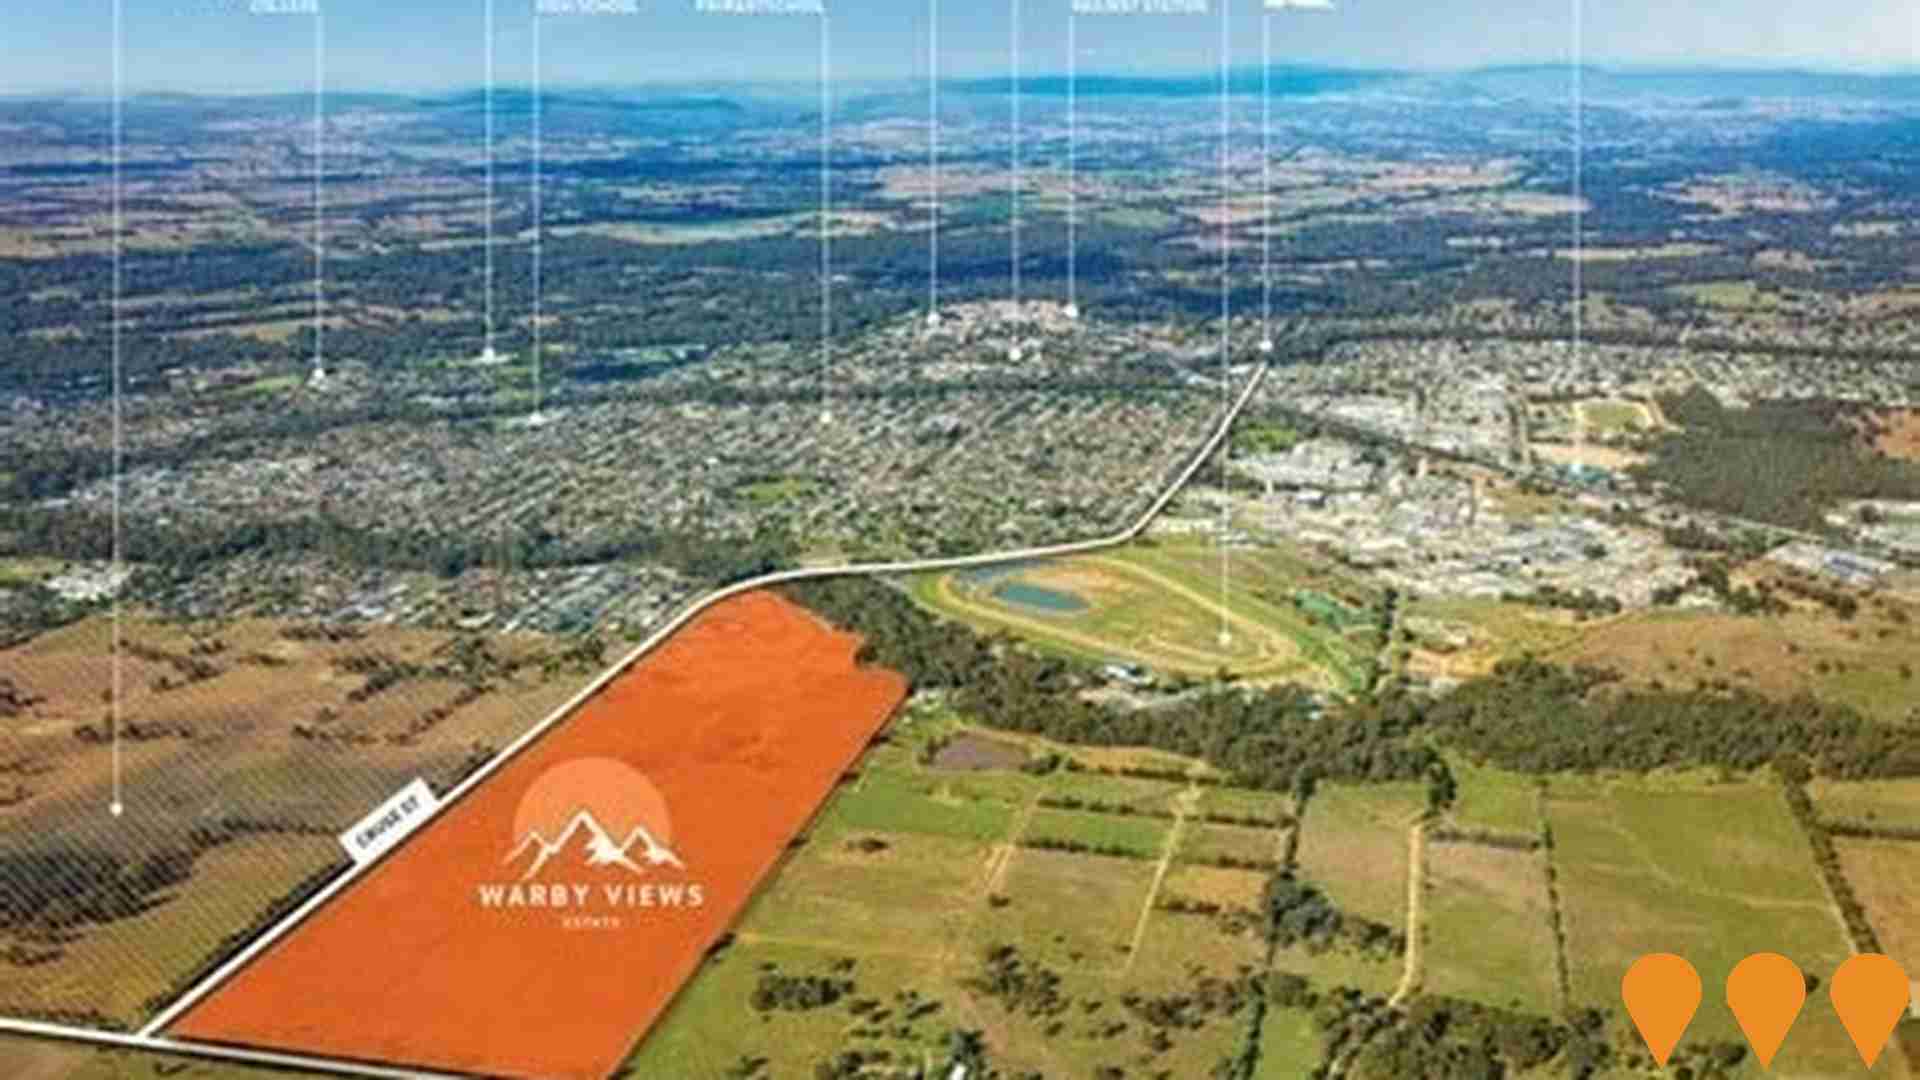
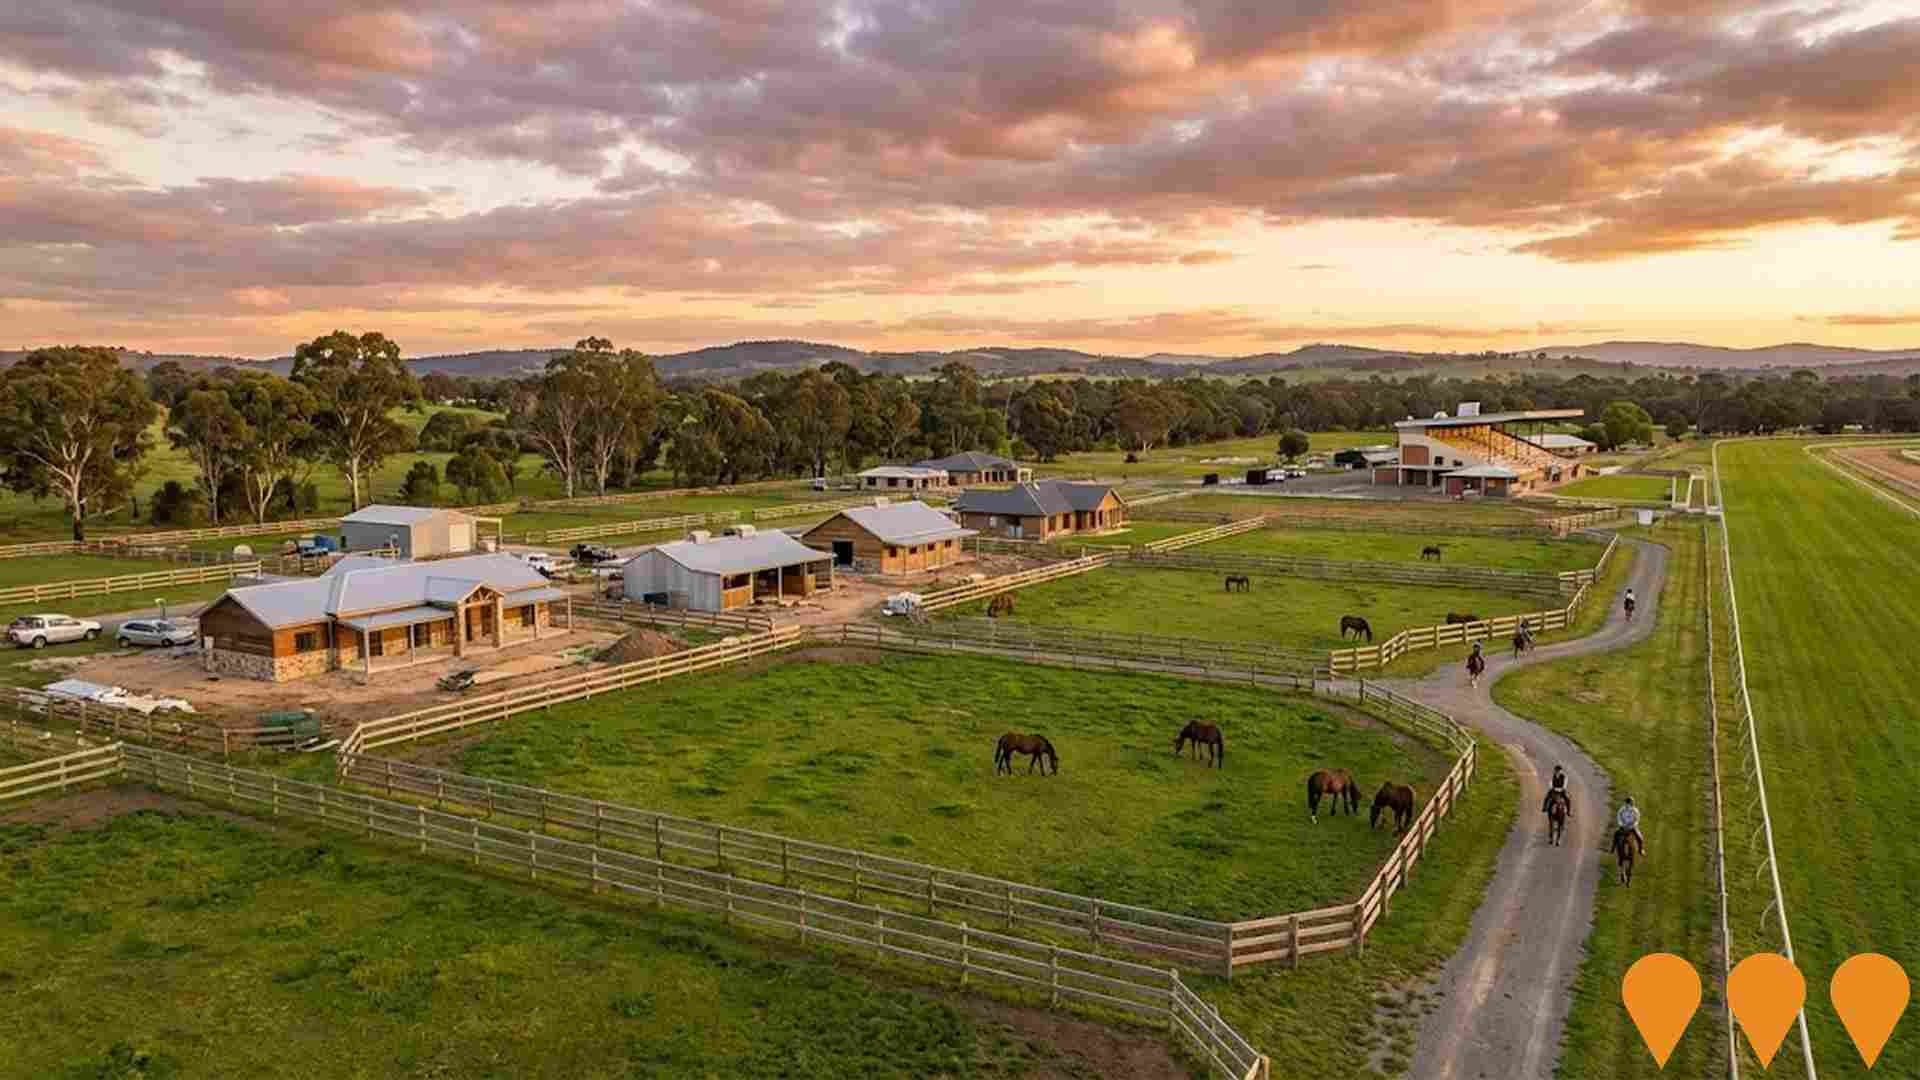
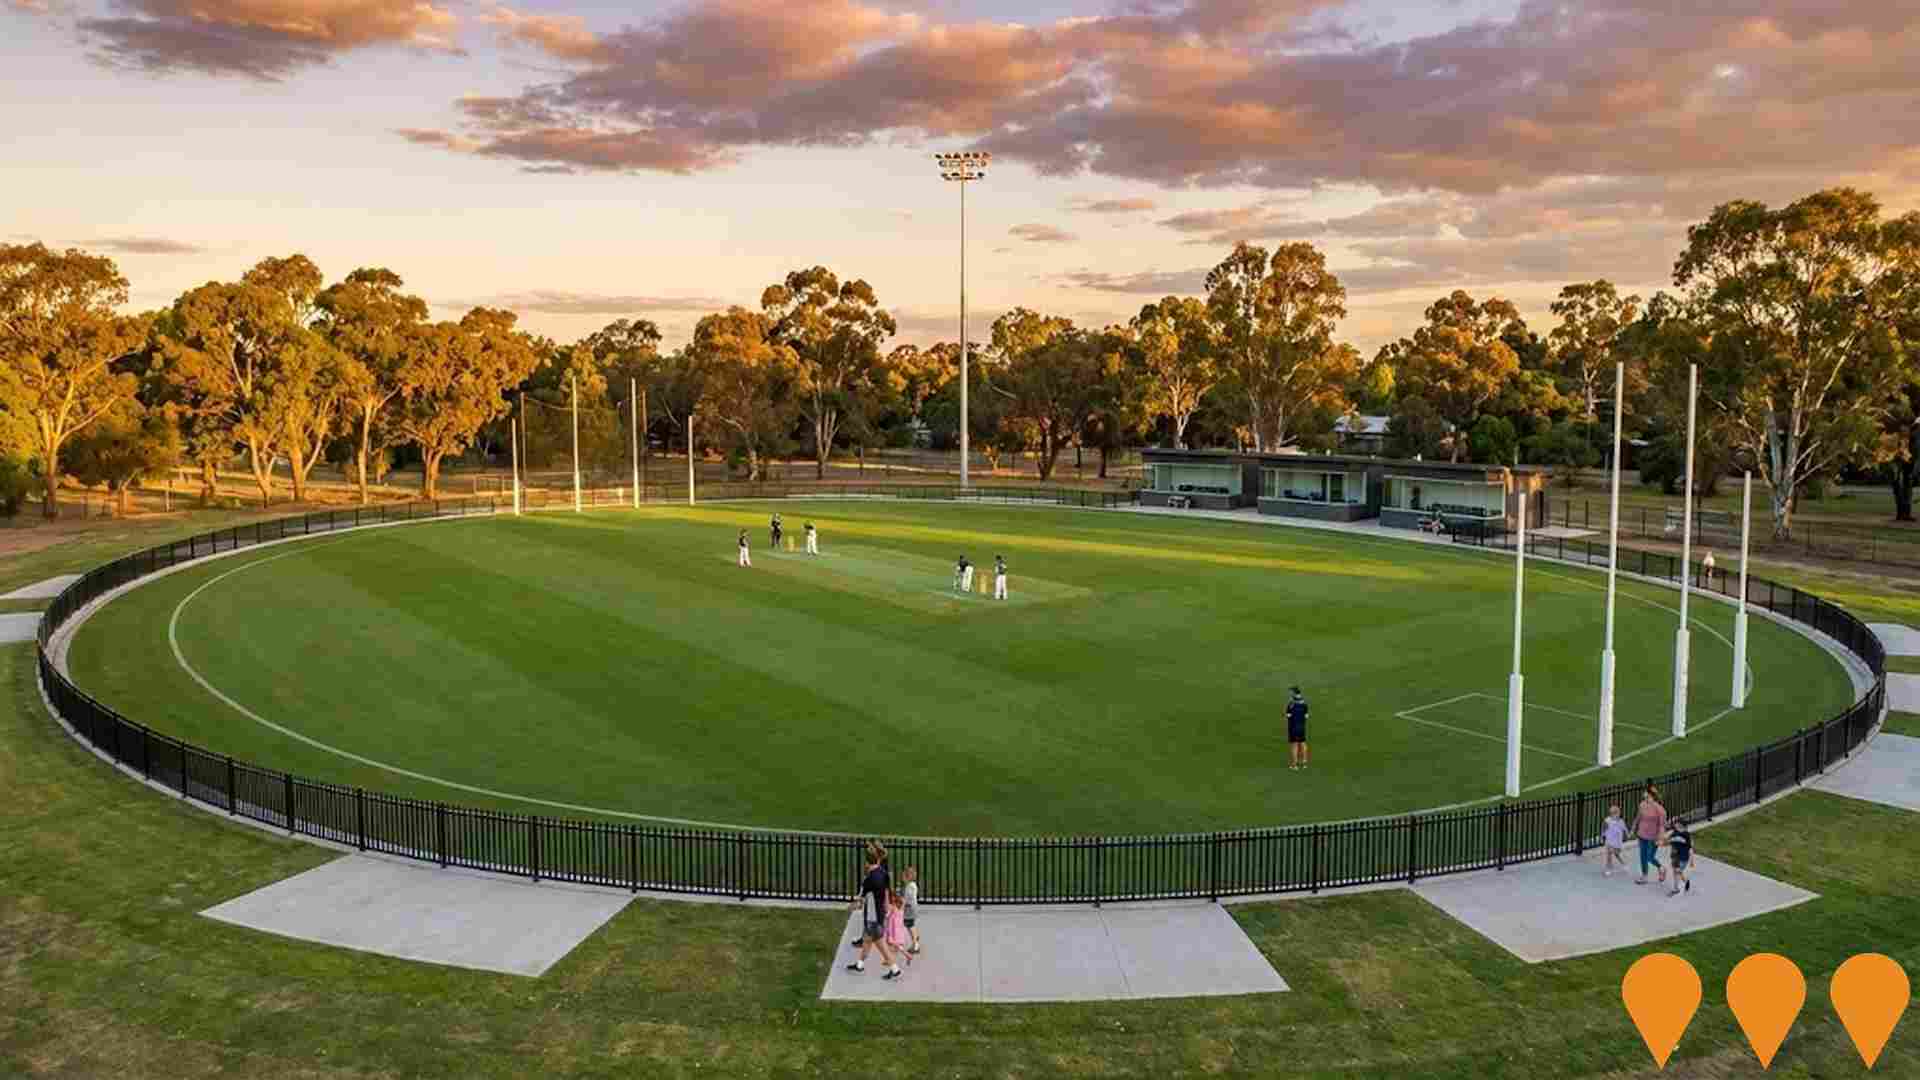
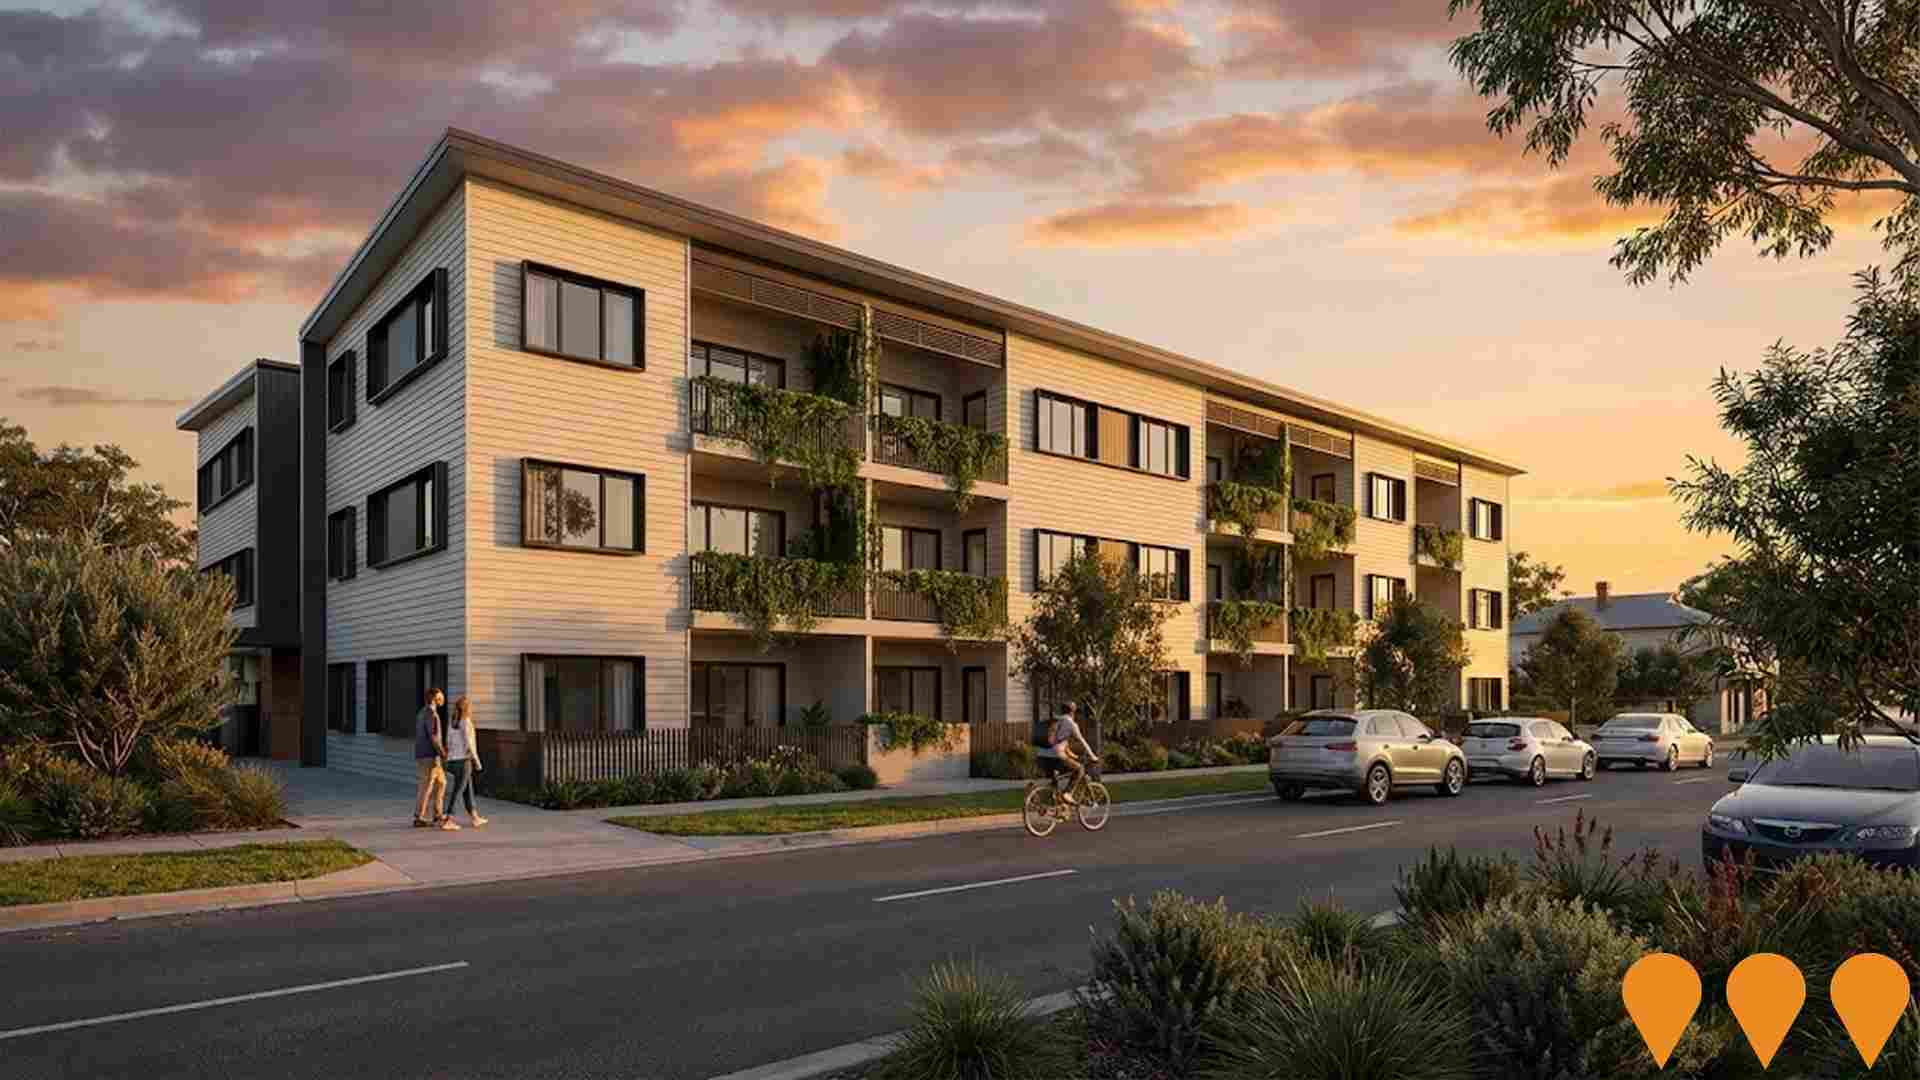
 Denotes AI-based impression for illustrative purposes only, not to be taken as definitive under any circumstances. Please follow links and conduct other investigations from the project's source for actual imagery. Developers and project owners wishing us to use original imagery please Contact Us and we will do so.
Frequently Asked Questions - Infrastructure
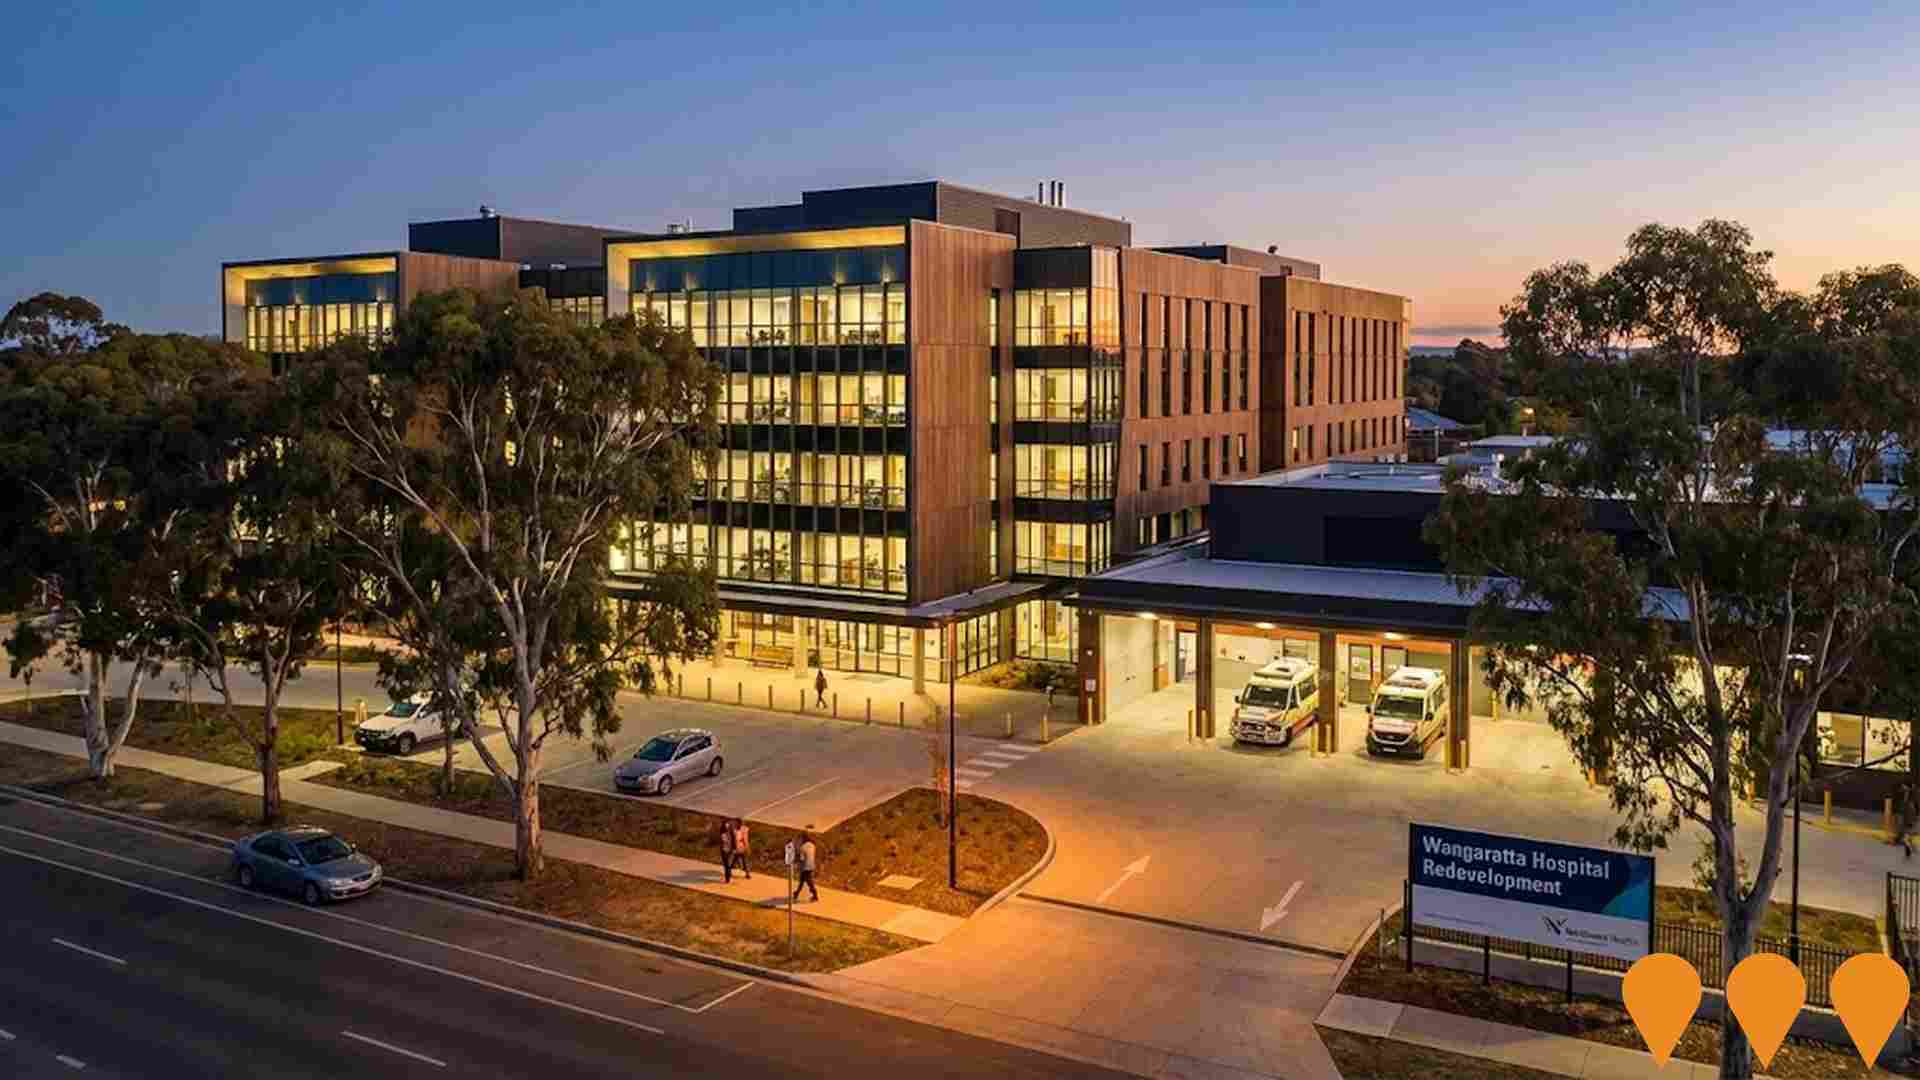
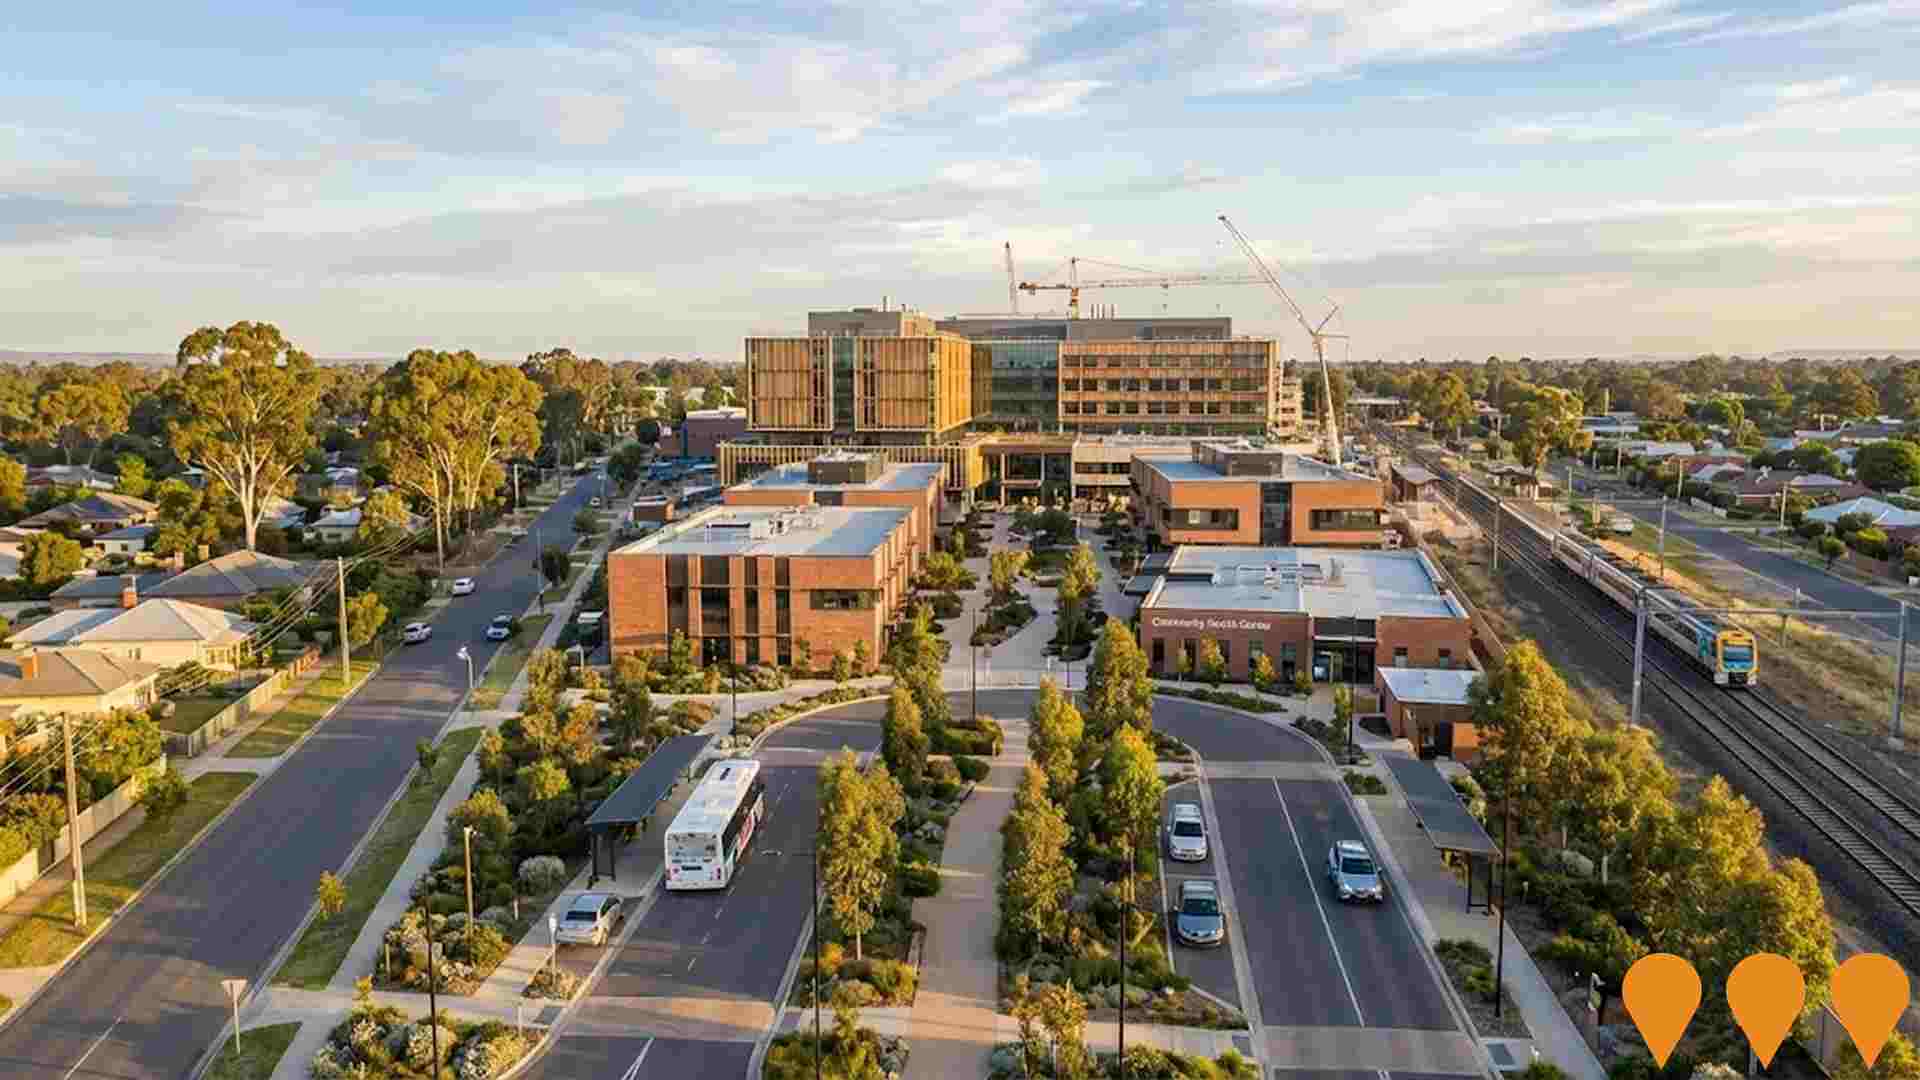
Wangaratta Health Precinct Structure Plan
Structure plan to create a long-term guiding framework for land use and built form within the Wangaratta Hospital and Health Precinct, located between Swan Street and the railway track, bounded by Roy Street West and Rowan Street. The plan's objectives include creating a vision, providing direction for the location of health and allied activities, and meeting the healthcare needs of the municipality. The Structure Plan was adopted by Council in 2019, and Planning Scheme Amendment C79 Part 1 to implement its key directions into the Wangaratta Planning Scheme was approved in November 2023. The precinct is an eclectic mix of urban conditions and is planned to accommodate growth and development of the Health Sector against established residential interfaces and uses.
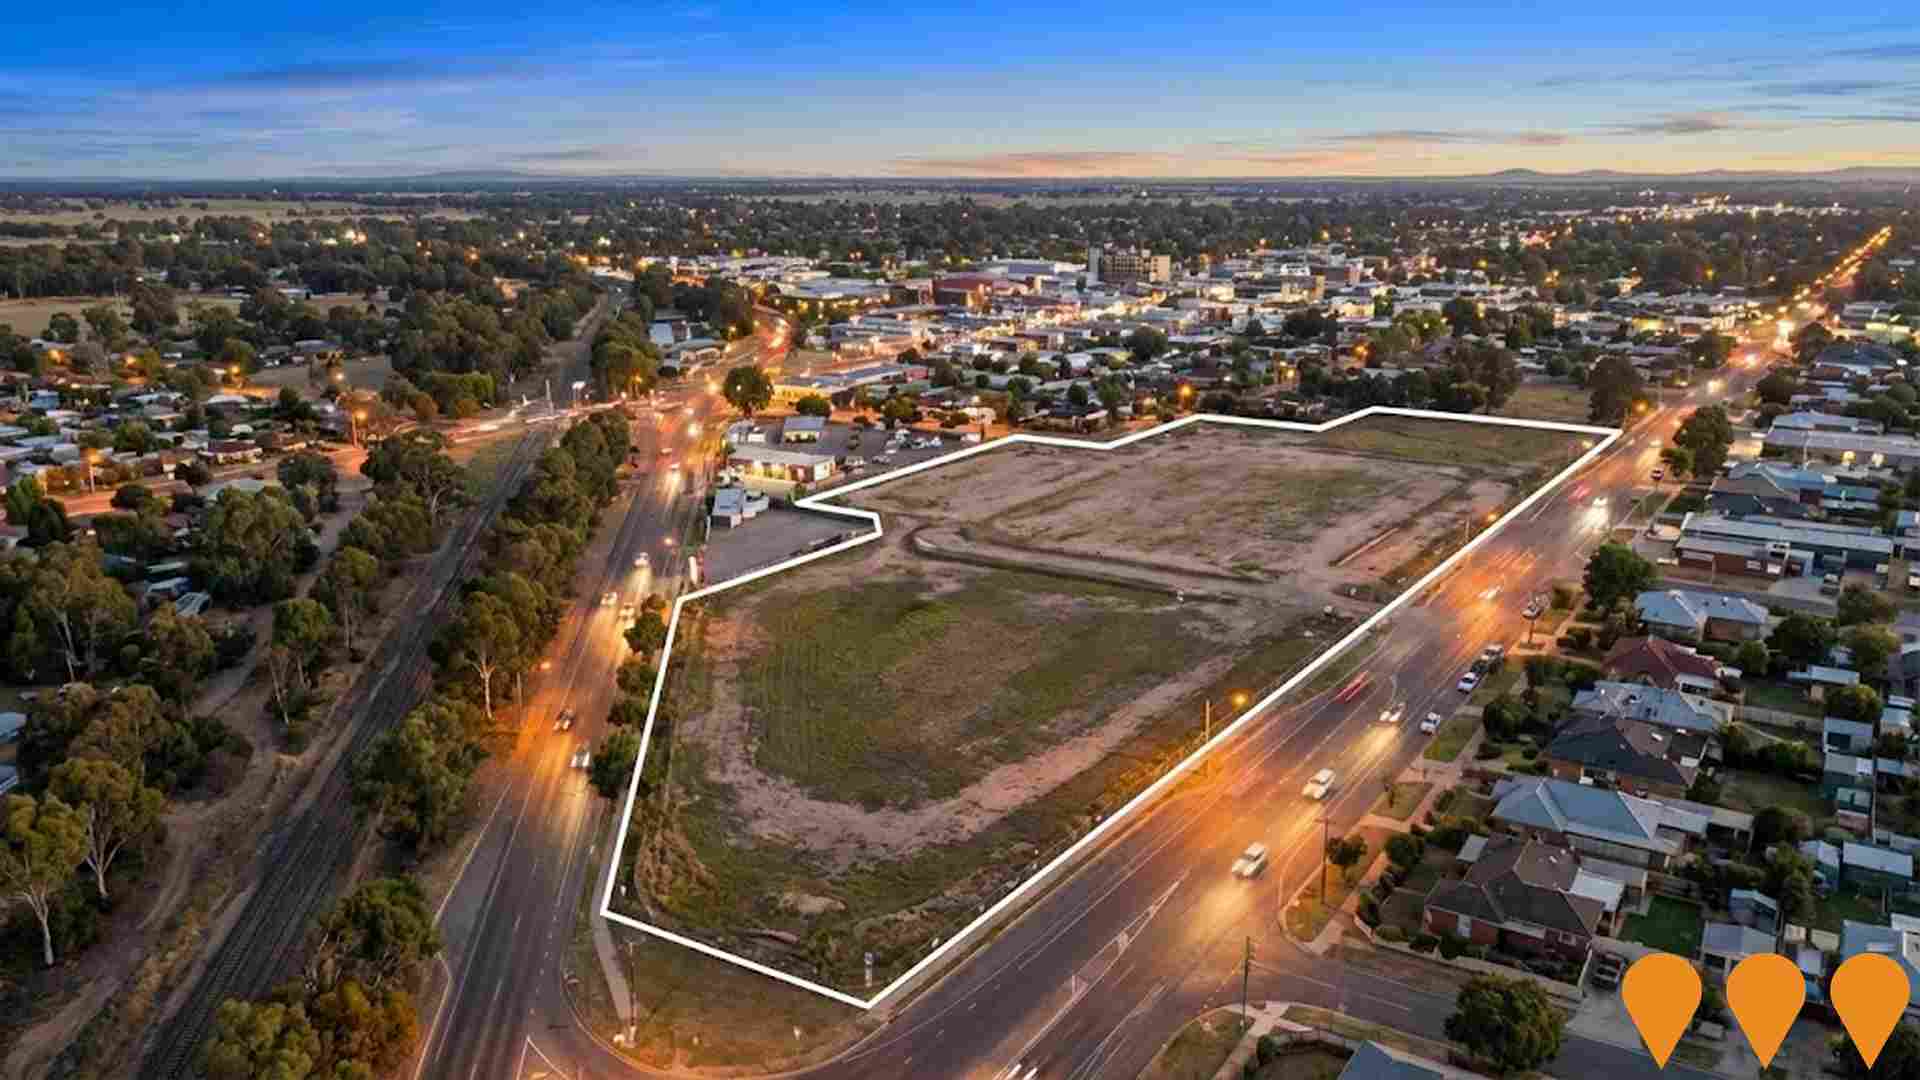
Wangaratta Landmark Retail Development Site
5.77 hectare landmark retail development site with council-endorsed zoning for large-format/bulky goods retail. Located 1.6 km from Wangaratta CBD with 388 m of triple street frontage, multiple access points and strong existing national retailer interest. Serves an undersupplied trade area population of over 70,000 with one of Victorias lowest large-format retail vacancy rates.
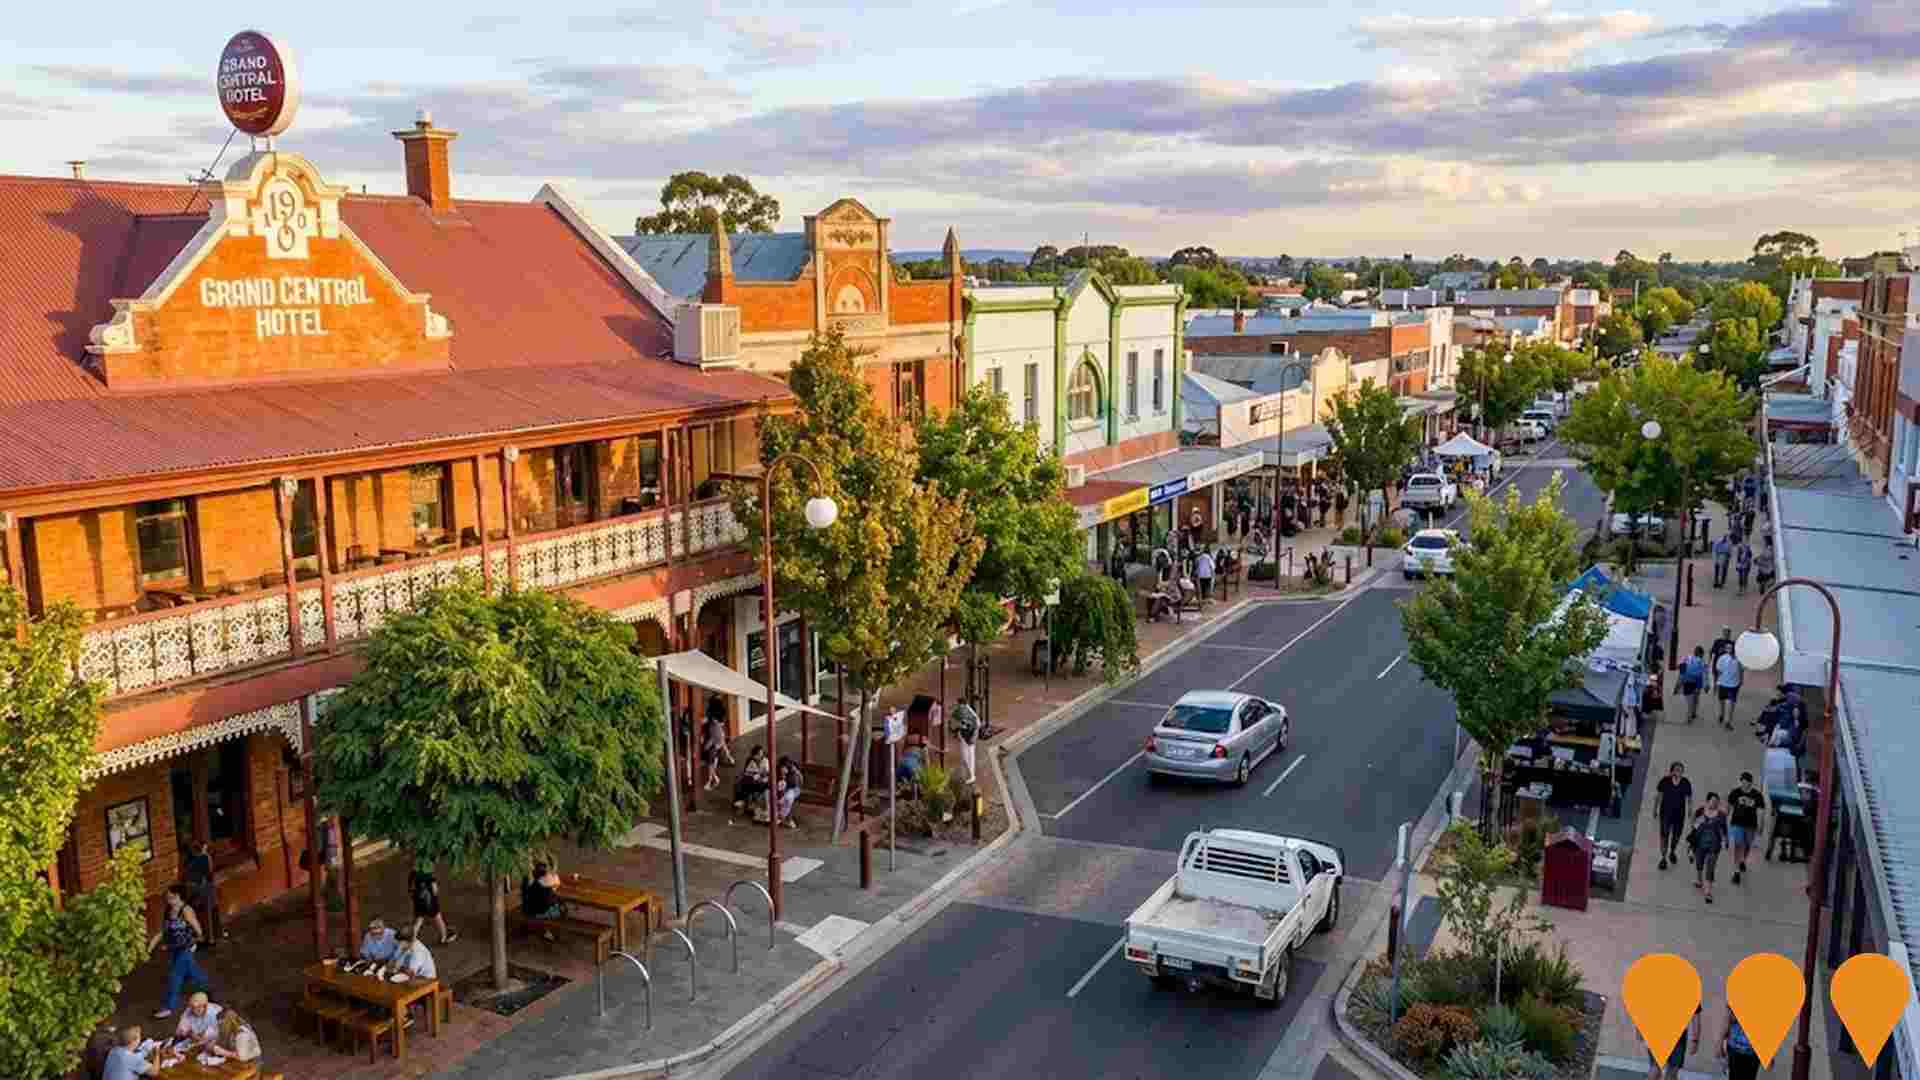
Wangaratta CBD Urban Design Framework
The Urban Design Framework (UDF) for the Wangaratta Central Activities Area (CAA) is a strategic document that sets out an integrated vision for public and private lands, guiding future use and development over a 15-20 year horizon. It implements recommendations from the CBD Masterplan and provides detailed objectives and guidelines for key issues like land uses, economic opportunities, public space improvements, integrated transport, and built form. The UDF includes a framework for the implementation of the CBD Masterplan ideas, including specific capital works and planning scheme recommendations.
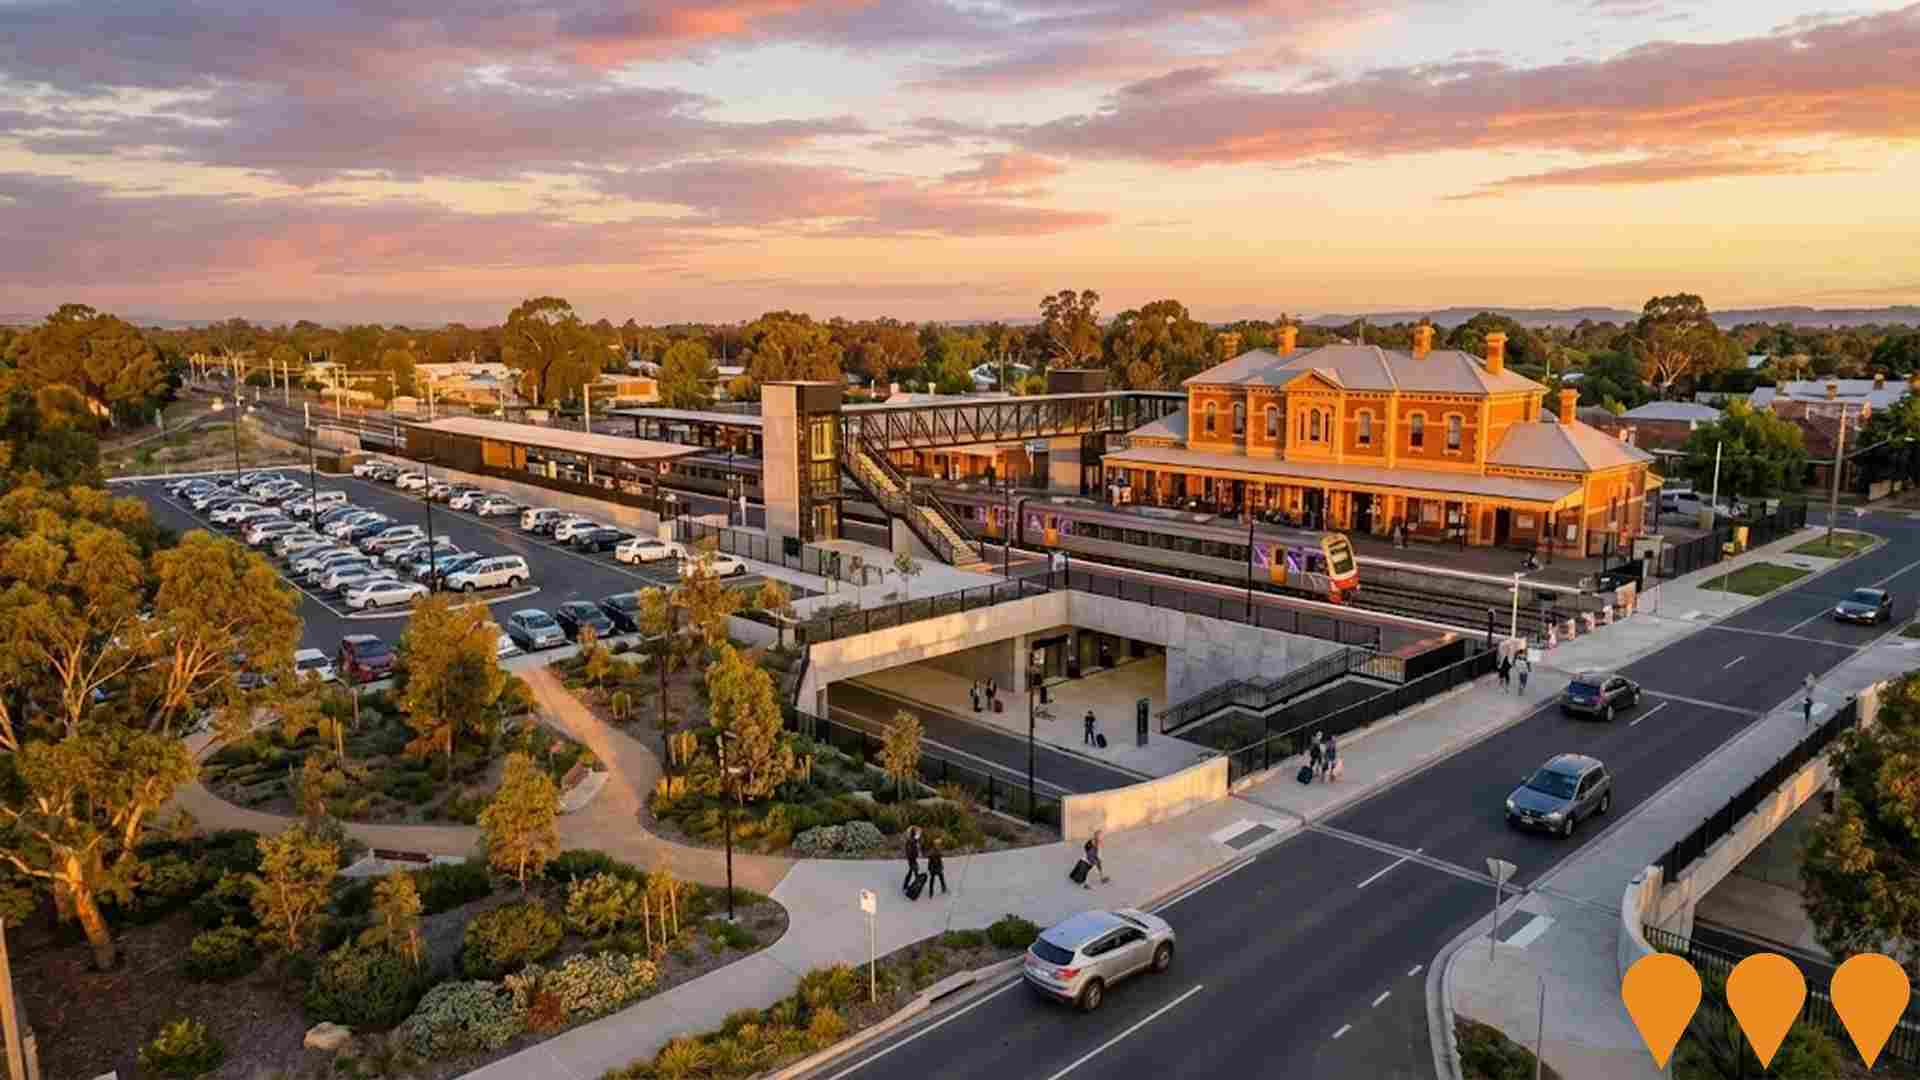
Wangaratta Station Precinct Redevelopment
Redevelopment of the Wangaratta railway station precinct, delivered as part of the Inland Rail Beveridge to Albury section. Works included a new pedestrian underpass with lifts, ramps and stairs; relocation of the east track to form a new west track; a new western platform and car park; replacement of the Green Street bridge; accessibility upgrades; and improved security with additional cameras. Major construction completed May 2025.
North West Wangaratta Residential Growth Area
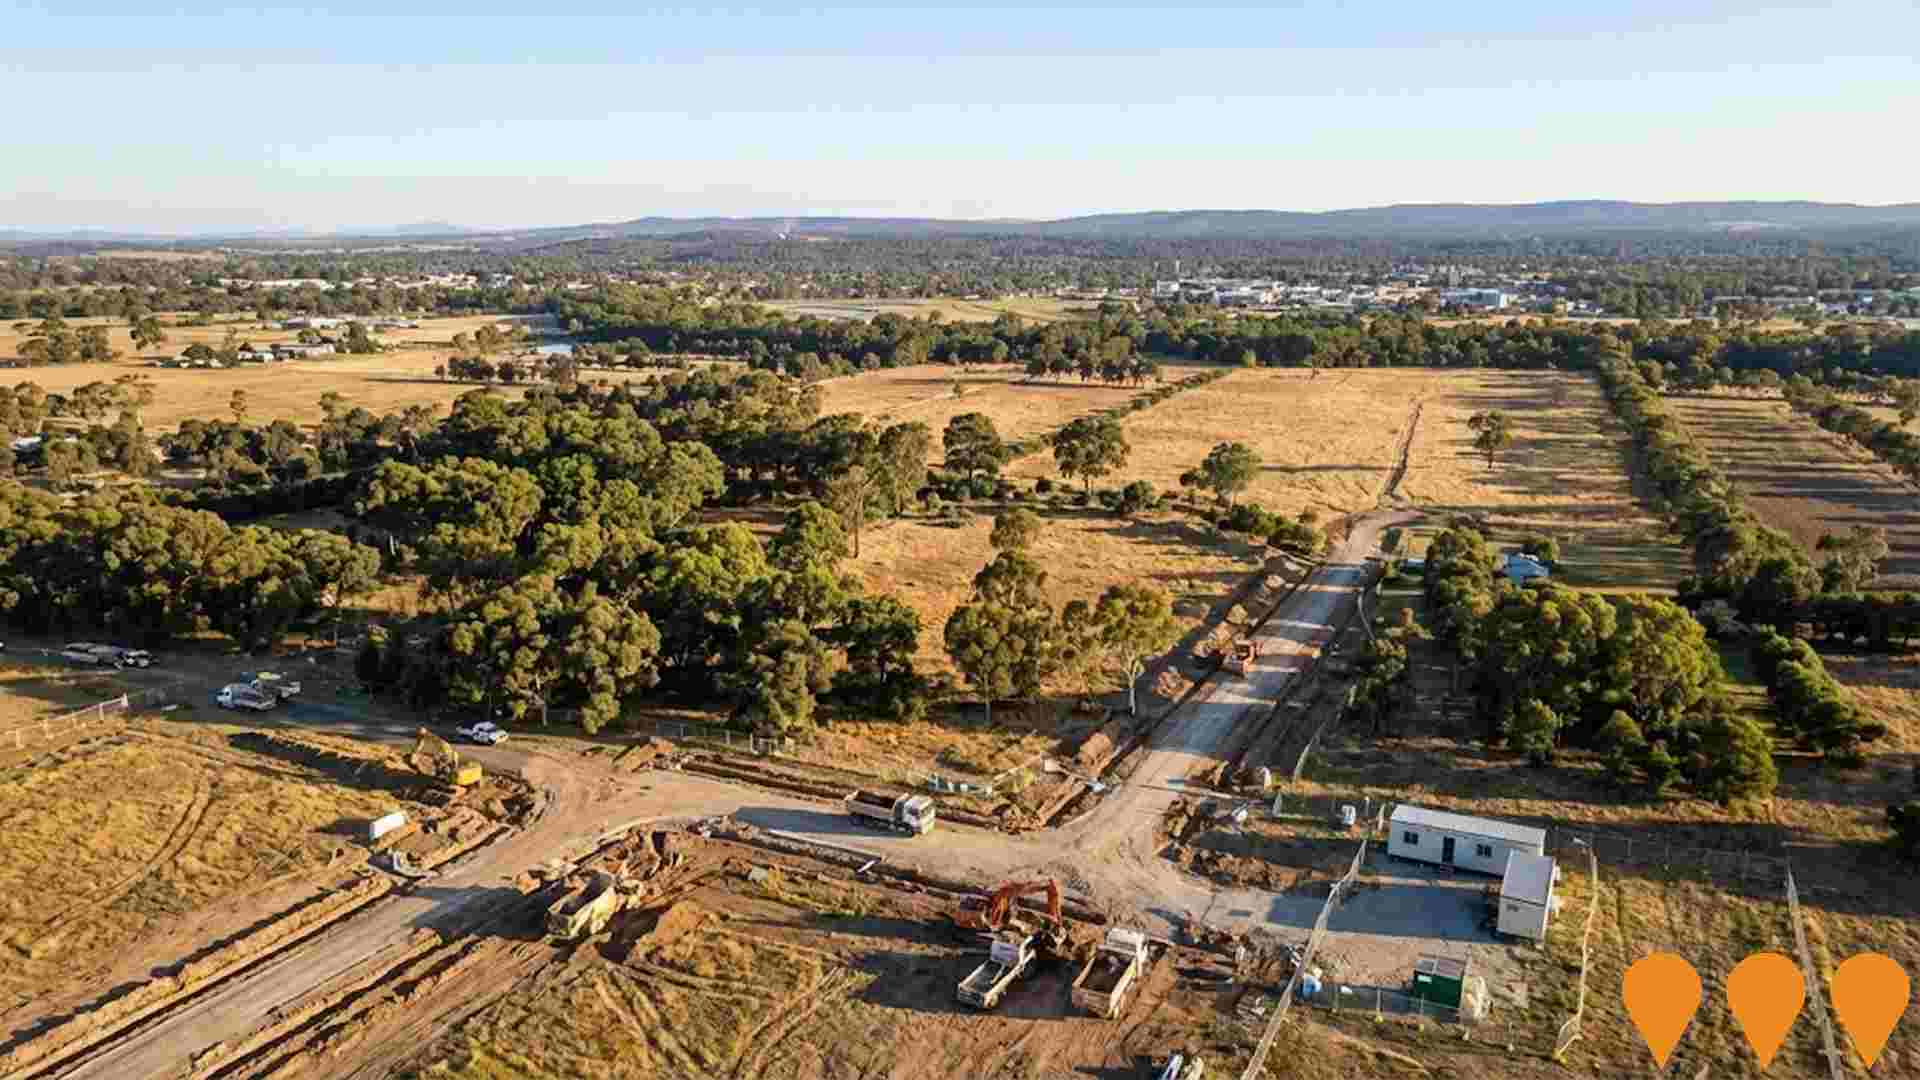
Large residential growth area rezoned from Farming Zone to General Residential in late 2019. Includes multiple precincts with development plans being approved. Sewer infrastructure works underway in 2024. Individual private developers will build within the area.
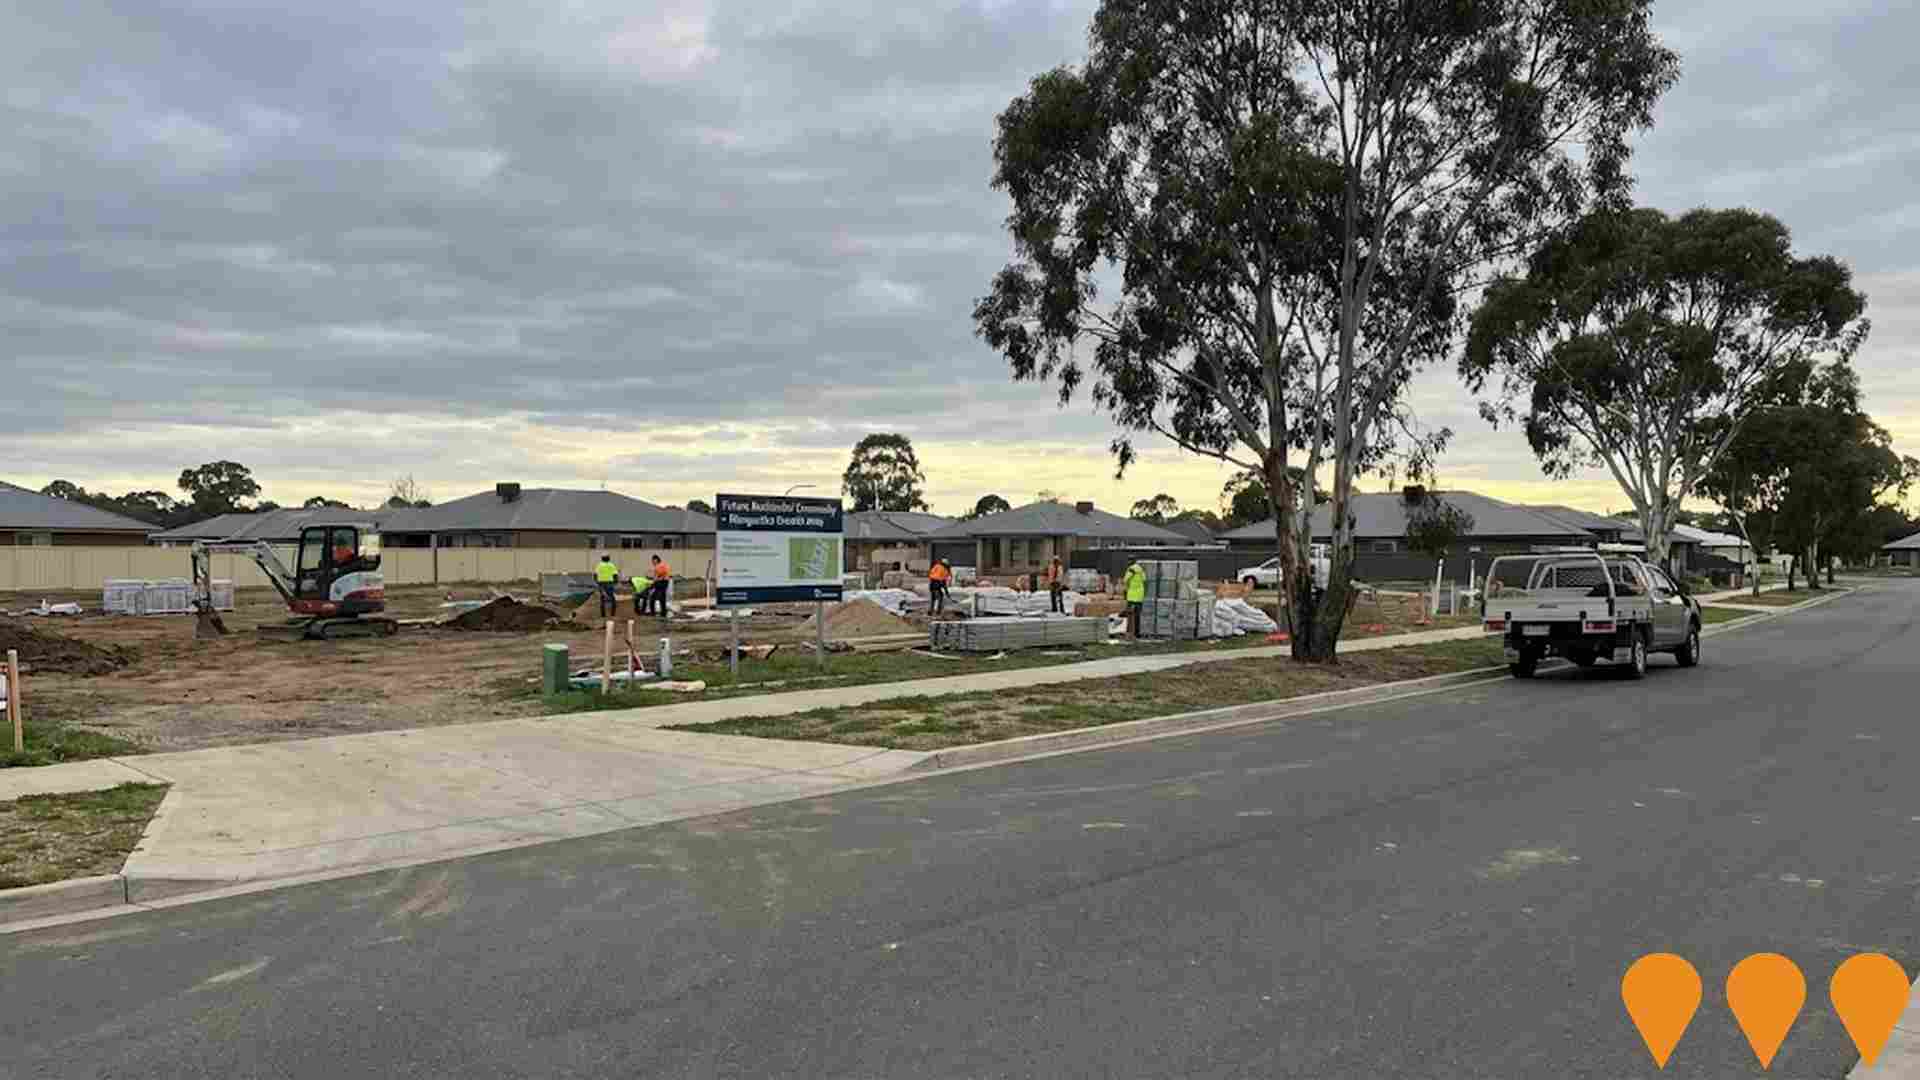
South Wangaratta Residential Growth Area
Southern residential growth area rezoned from Farming Zone to General Residential in late 2019. Sewer infrastructure works planned for 2024 to enable future residential development. Individual private developers will build within the area.
Winton Solar Farm
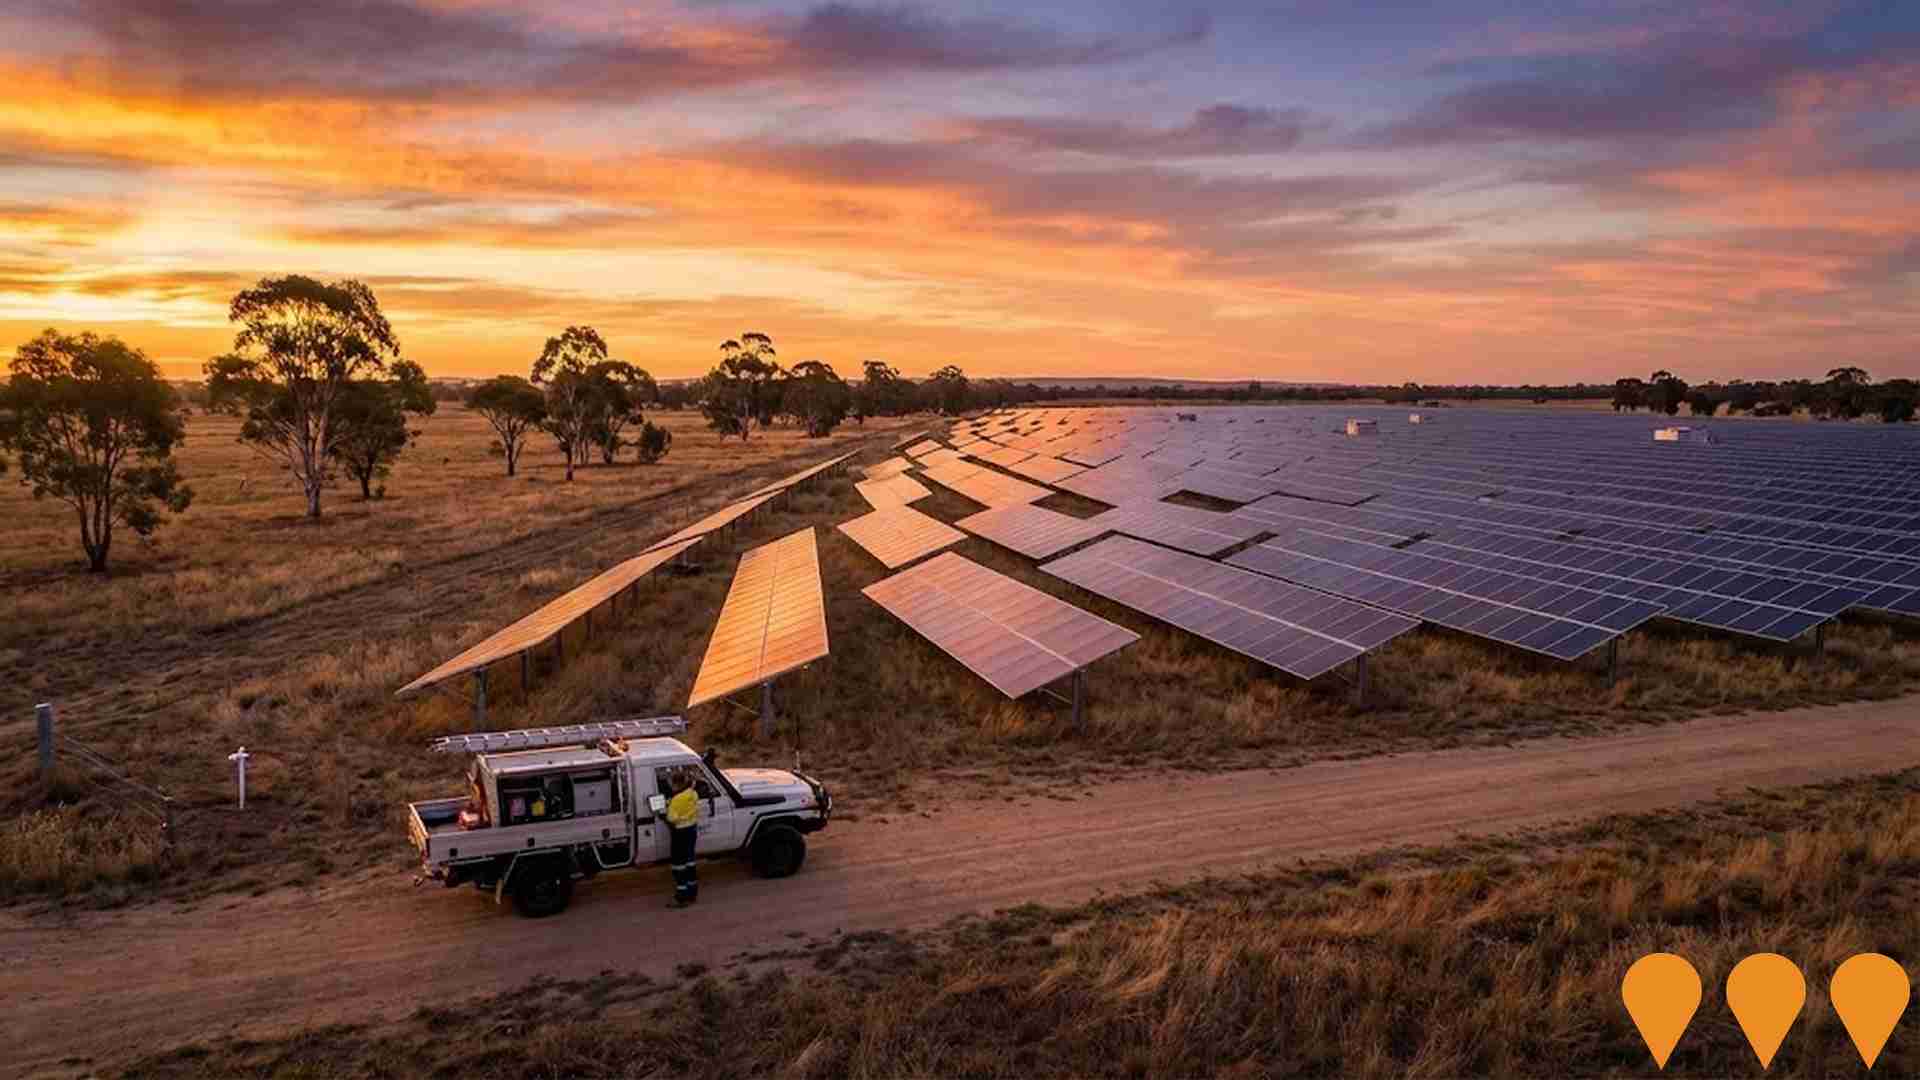
150MW solar farm completed by ENGIE. One of Victoria's significant renewable energy projects supporting 150 construction jobs during development. Powers approximately 65,000 homes annually.
Wangaratta Industrial Land Use Strategy
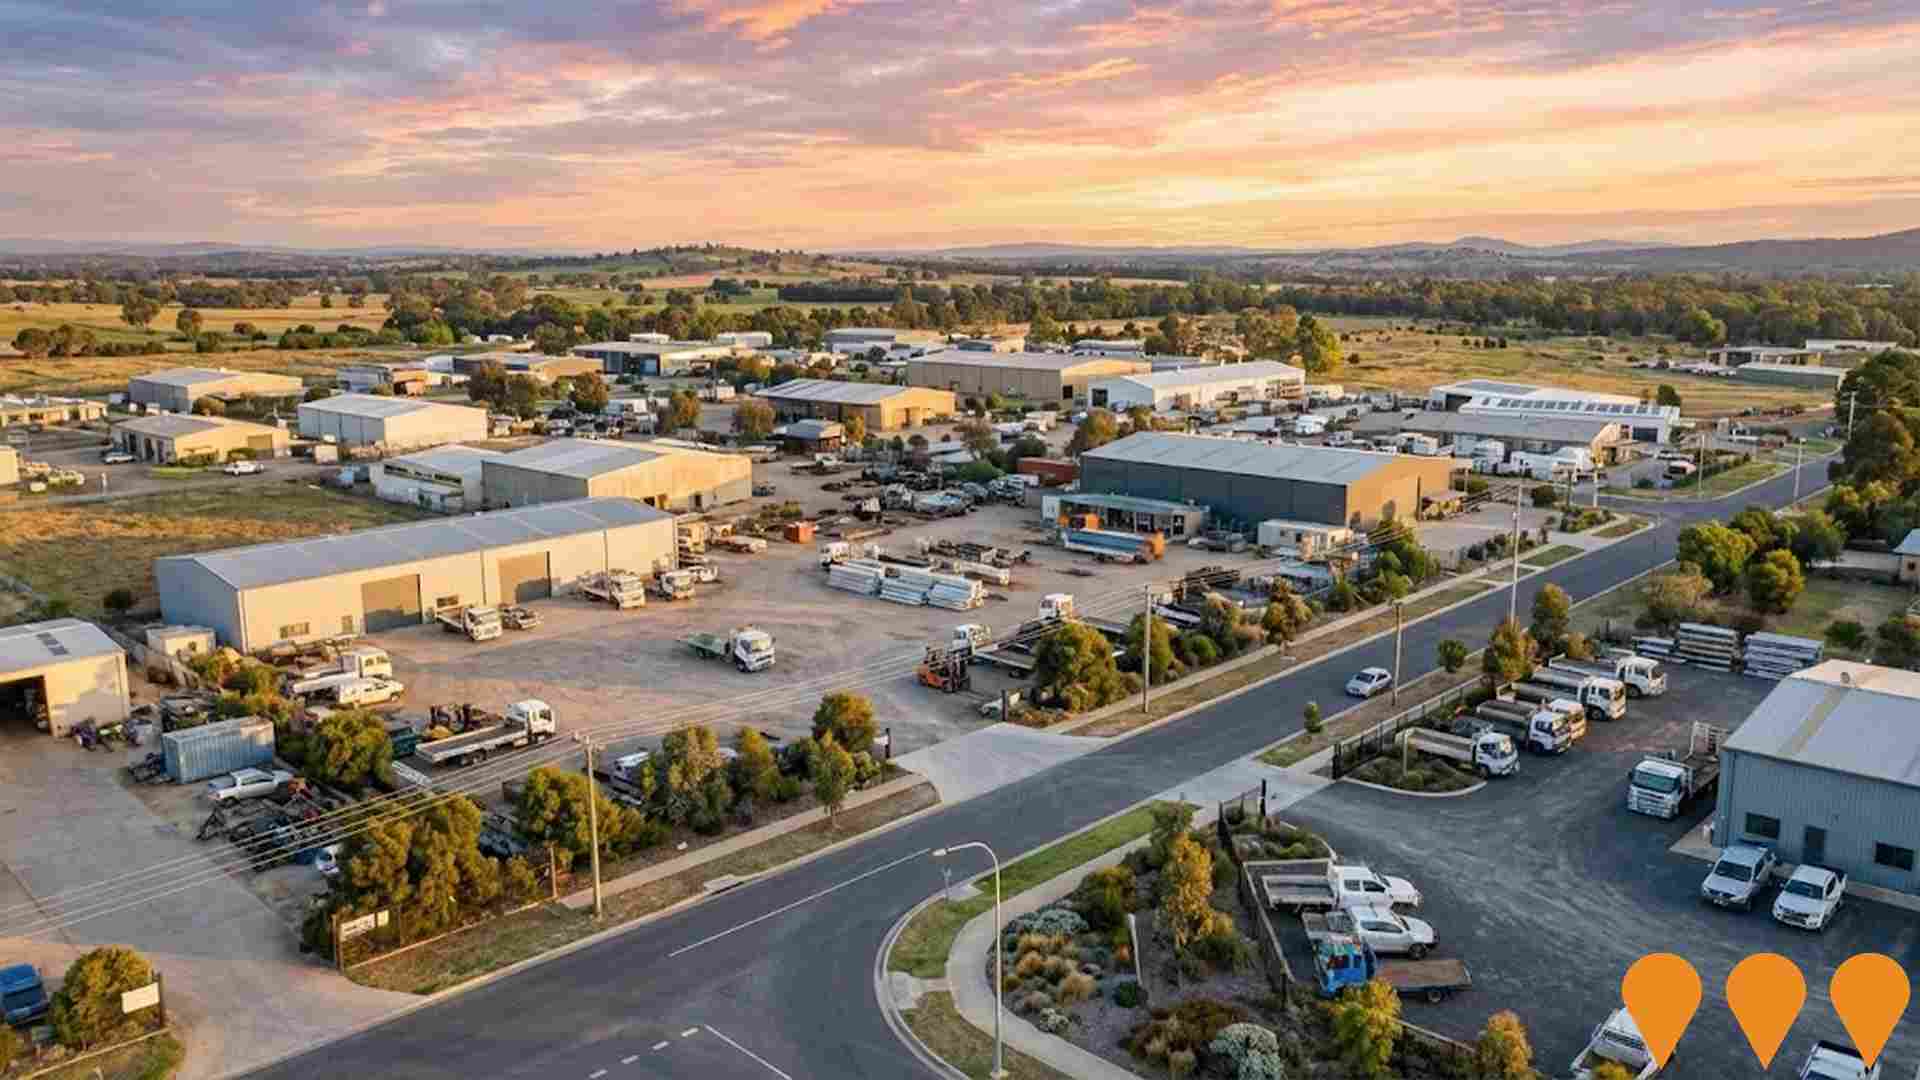
Strategic framework providing vision and planning for Wangaratta's industrial areas. Guides future industrial development and land use planning to support economic growth.
Employment
AreaSearch assessment positions Wangaratta Surrounds ahead of most Australian regions for employment performance
Wangaratta Surrounds has a skilled workforce with an unemployment rate of 2.6% as of September 2025. It has 5,485 residents in work, which is 1.2% below the Rest of Vic.'s rate of 3.8%.
The workforce participation rate is 64.0%, compared to Rest of Vic.'s 57.4%. Leading employment industries are agriculture, forestry & fishing, health care & social assistance, and manufacturing. The area has a strong specialization in agriculture, forestry & fishing with an employment share of 2.3 times the regional level. Retail trade has limited presence at 7.6% compared to the regional level of 9.9%.
Over the year to September 2025, labour force levels decreased by 1.6%, and employment decreased by 2.3%, causing the unemployment rate to rise by 0.7 percentage points. In comparison, Rest of Vic. recorded an employment decline of 0.7% and a labour force decline of 0.6%. State-level data to 25-Nov-25 shows VIC employment grew by 1.13% year-on-year, adding 41,950 jobs, with the state unemployment rate at 4.7%, compared to the national rate of 4.3%. Jobs and Skills Australia's national employment forecasts from May-25 project national employment growth of 6.6% over five years and 13.7% over ten years. Applying these projections to Wangaratta Surrounds' employment mix suggests local employment should increase by 5.5% over five years and 12.2% over ten years, based on a simple weighting extrapolation for illustrative purposes.
Frequently Asked Questions - Employment
Income
Income levels sit below national averages according to AreaSearch assessment
The Wangaratta Surrounds SA2 had a median taxpayer income of $47,345 and an average income of $60,289 in the financial year 2022, according to postcode level ATO data aggregated by AreaSearch. This is lower than the national average, with Rest of Vic.'s median income being $48,741 and average income being $60,693. By September 2025, based on a 12.16% Wage Price Index growth since financial year 2022, estimated incomes would be approximately $53,102 (median) and $67,620 (average). The 2021 Census data shows that household, family, and personal incomes in Wangaratta Surrounds rank modestly, between the 35th and 41st percentiles. Income brackets indicate that 32.5% of the population, equating to 3,318 individuals, fall within the $1,500 - $2,999 income range, similar to the surrounding region where 30.3% occupy this range. Housing costs are manageable with 89.6% retained, but disposable income is below average at the 41st percentile, and the area's SEIFA income ranking places it in the 5th decile.
Frequently Asked Questions - Income
Housing
Wangaratta Surrounds is characterized by a predominantly suburban housing profile, with above-average rates of outright home ownership
In Wangaratta Surrounds, as per the latest Census, 98.9% of dwellings were houses while 1.2% consisted of semi-detached homes, apartments and other types. This contrasts with Non-Metro Vic.'s figures of 89.9% houses and 10.1% other dwellings. Home ownership in Wangaratta Surrounds stood at 51.7%, with mortgaged properties at 37.6% and rented ones at 10.7%. The median monthly mortgage repayment was $1,500, higher than Non-Metro Vic.'s average of $1,300. Median weekly rent in the area was $250, matching Non-Metro Vic.'s figure. Nationally, Wangaratta Surrounds' mortgage repayments were lower at $1,500 compared to Australia's average of $1,863, while rents were also lower at $250 versus the national figure of $375.
Frequently Asked Questions - Housing
Household Composition
Wangaratta Surrounds has a typical household mix, with a higher-than-average median household size
Family households account for 75.4% of all households, including 30.4% couples with children, 37.2% couples without children, and 6.9% single parent families. Non-family households make up the remaining 24.6%, with lone person households at 22.8% and group households comprising 1.9%. The median household size is 2.5 people, larger than the Rest of Vic. average of 2.3.
Frequently Asked Questions - Households
Local Schools & Education
Educational attainment in Wangaratta Surrounds aligns closely with national averages, showing typical qualification patterns and performance metrics
The area's university qualification rate is 21.8%, significantly lower than Victoria's average of 33.4%. Bachelor degrees are the most common at 14.8%, followed by graduate diplomas (3.7%) and postgraduate qualifications (3.3%). Vocational credentials are prevalent, with 42.4% of residents aged 15+ holding them, including advanced diplomas (13.0%) and certificates (29.4%). Educational participation is high, with 27.0% currently enrolled in formal education: 10.3% in primary, 8.8% in secondary, and 2.1% in tertiary education.
Educational participation is notably high, with 27.0% of residents currently enrolled in formal education. This includes 10.3% in primary education, 8.8% in secondary education, and 2.1% pursuing tertiary education.
Frequently Asked Questions - Education
Schools Detail
Nearby Services & Amenities
Transport
Transport servicing is very low compared to other areas nationally based on assessment of service frequency, route connectivity and accessibility
Wangaratta Surrounds has 22 active public transport stops, offering a mix of train and bus services. These stops are served by 13 different routes that together facilitate 146 weekly passenger trips. Transport accessibility is considered limited, with residents on average located 2910 meters from the nearest stop.
The service frequency across all routes averages 20 trips per day, equating to roughly 6 weekly trips per individual stop.
Frequently Asked Questions - Transport
Transport Stops Detail
Health
Health performance in Wangaratta Surrounds is lower than average with common health conditions somewhat prevalent across both younger and older age cohorts
Wangaratta Surrounds faces significant health challenges with common health conditions prevalent across both younger and older age cohorts. The rate of private health cover is relatively low at approximately 50% of the total population (~5,106 people), compared to the national average of 55.3%.
The most common medical conditions in the area are arthritis and asthma, impacting 10.4% and 8.6% of residents respectively. Sixty-five point six percent of residents declared themselves completely clear of medical ailments, compared to 60.4% across Rest of Vic.. Twenty-three point nine percent of residents are aged 65 and over (2,436 people), which is lower than the 25.7% in Rest of Vic.. Health outcomes among seniors in Wangaratta Surrounds are particularly strong, performing even better than the general population in health metrics.
Frequently Asked Questions - Health
Cultural Diversity
The latest Census data sees Wangaratta Surrounds placing among the least culturally diverse areas in the country when compared across a range of language and cultural background related metrics
Wangaratta Surrounds, as per the findings, exhibited below-average cultural diversity. Its population composition was predominantly citizens at 91.1%, with 91.9% born in Australia, and 96.2% speaking English exclusively at home. Christianity emerged as the primary religion in Wangaratta Surrounds, accounting for 51.3% of its inhabitants.
This figure is slightly lower than the regional average of 52.0%. In terms of ancestry, the top three represented groups were English (31.6%), Australian (31.0%), and Irish (10.7%). Notably, certain ethnic groups showed significant variations in their representation: Scottish was overrepresented at 9.7% compared to the regional average of 9.3%, Italian at 4.7% versus 3.9%, and Dutch at 1.4% against a regional average of 1.3%.
Frequently Asked Questions - Diversity
Age
Wangaratta Surrounds hosts an older demographic, ranking in the top quartile nationwide
Wangaratta Surrounds has a median age of 47 years, which is significantly higher than the Rest of Vic average of 43 and exceeds the national average of 38 years. The age profile shows that those aged 55-64 are particularly prominent, comprising 15.4% of the population, while those aged 25-34 make up only 7.5%. Since 2021, the 15 to 24 age group has increased from 9.1% to 10.5%, and the 35 to 44 cohort has grown from 10.8% to 11.8%. Conversely, the 45 to 54 group has declined from 14.8% to 12.9%, and the 55 to 64 age group has dropped from 16.7% to 15.4%. By 2041, Wangaratta Surrounds is expected to see notable shifts in its age composition. The 35 to 44 group is projected to grow by 41%, adding 490 people and reaching a total of 1,698 from the current figure of 1,207. The 15 to 24 age group is expected to display modest growth of 1%, with an increase of only 10 residents.
