Chart Color Schemes
This analysis uses ABS Statistical Areas Level 2 (SA2) boundaries, which can materially differ from Suburbs and Localities (SAL) even when sharing similar names.
SA2 boundaries are defined by the Australian Bureau of Statistics and are designed to represent communities for statistical reporting (e.g., census and ERP).
Suburbs and Localities (SAL) represent commonly-used suburb/locality names (postal-style areas) and may use different geographic boundaries. For comprehensive analysis, consider reviewing both boundary types if available.
est. as @ -- *
ABS ERP | -- people | --
2021 Census | -- people
Sales Activity
Curious about local property values? Filter the chart to assess the volume and appreciation (including resales) trends and regional comparisons, or scroll to the map below view this information at an individual property level.
Find a Recent Sale
Sales Detail
Population
Population growth drivers in Belmont are above average based on AreaSearch's ranking of recent, and medium to long-term trends
Belmont's population was 15,278 as of November 2025. From the 2021 Census, it had increased by 261 people, a 1.7% rise from the previously reported figure of 15,017. This change is inferred from the estimated resident population of 15,136 in June 2024 and an additional 137 validated new addresses since the Census date. The population density was 1,630 persons per square kilometer, higher than the average across national locations assessed by AreaSearch. Overseas migration contributed approximately 73.8% of overall population gains during recent periods.
AreaSearch uses ABS/Geoscience Australia projections for each SA2 area, released in 2024 with a base year of 2022. For areas not covered, it utilises VIC State Government's Regional/LGA projections from 2023, adjusted using weighted aggregation methods to SA2 levels. Growth rates by age group are applied across all areas for years 2032 to 2041. Future population dynamics forecast a significant increase in the top quartile of Australian non-metropolitan areas, with Belmont expected to increase by 3,540 persons to 2041 based on the latest annual ERP population numbers, reflecting a total gain of 22.2% over the 17 years.
Frequently Asked Questions - Population
Development
Residential development activity is lower than average in Belmont according to AreaSearch's national comparison of local real estate markets
Belmont averaged approximately 56 new dwelling approvals annually over the past five financial years, from FY-21 to FY-25, totaling 284 homes. In FY-26 up to present, 15 dwellings have been approved. This averages out to around 0.6 new residents per year per dwelling constructed during these years.
The average construction value of new homes is $255,000, aligning with regional patterns. Commercial approvals this financial year amount to $13.4 million, indicating moderate commercial development. Compared to the rest of Victoria, Belmont shows significantly reduced construction, at 64.0% below the regional average per person. This limited new construction often reinforces demand and pricing for existing homes. The new developments consist of 32.0% standalone homes and 68.0% medium to high-density housing, marking a shift from the area's current housing composition, which is 78.0% houses. This trend may indicate decreasing availability of developable sites and reflects changing lifestyles and demand for diverse, affordable housing options.
Belmont has around 538 people per dwelling approval, suggesting a developed market. By 2041, Belmont is projected to grow by approximately 3,396 residents. At current development rates, housing supply may struggle to keep pace with population growth, potentially intensifying buyer competition and supporting price increases.
Frequently Asked Questions - Development
Infrastructure
Belmont has strong levels of nearby infrastructure activity, ranking in the top 40% nationally
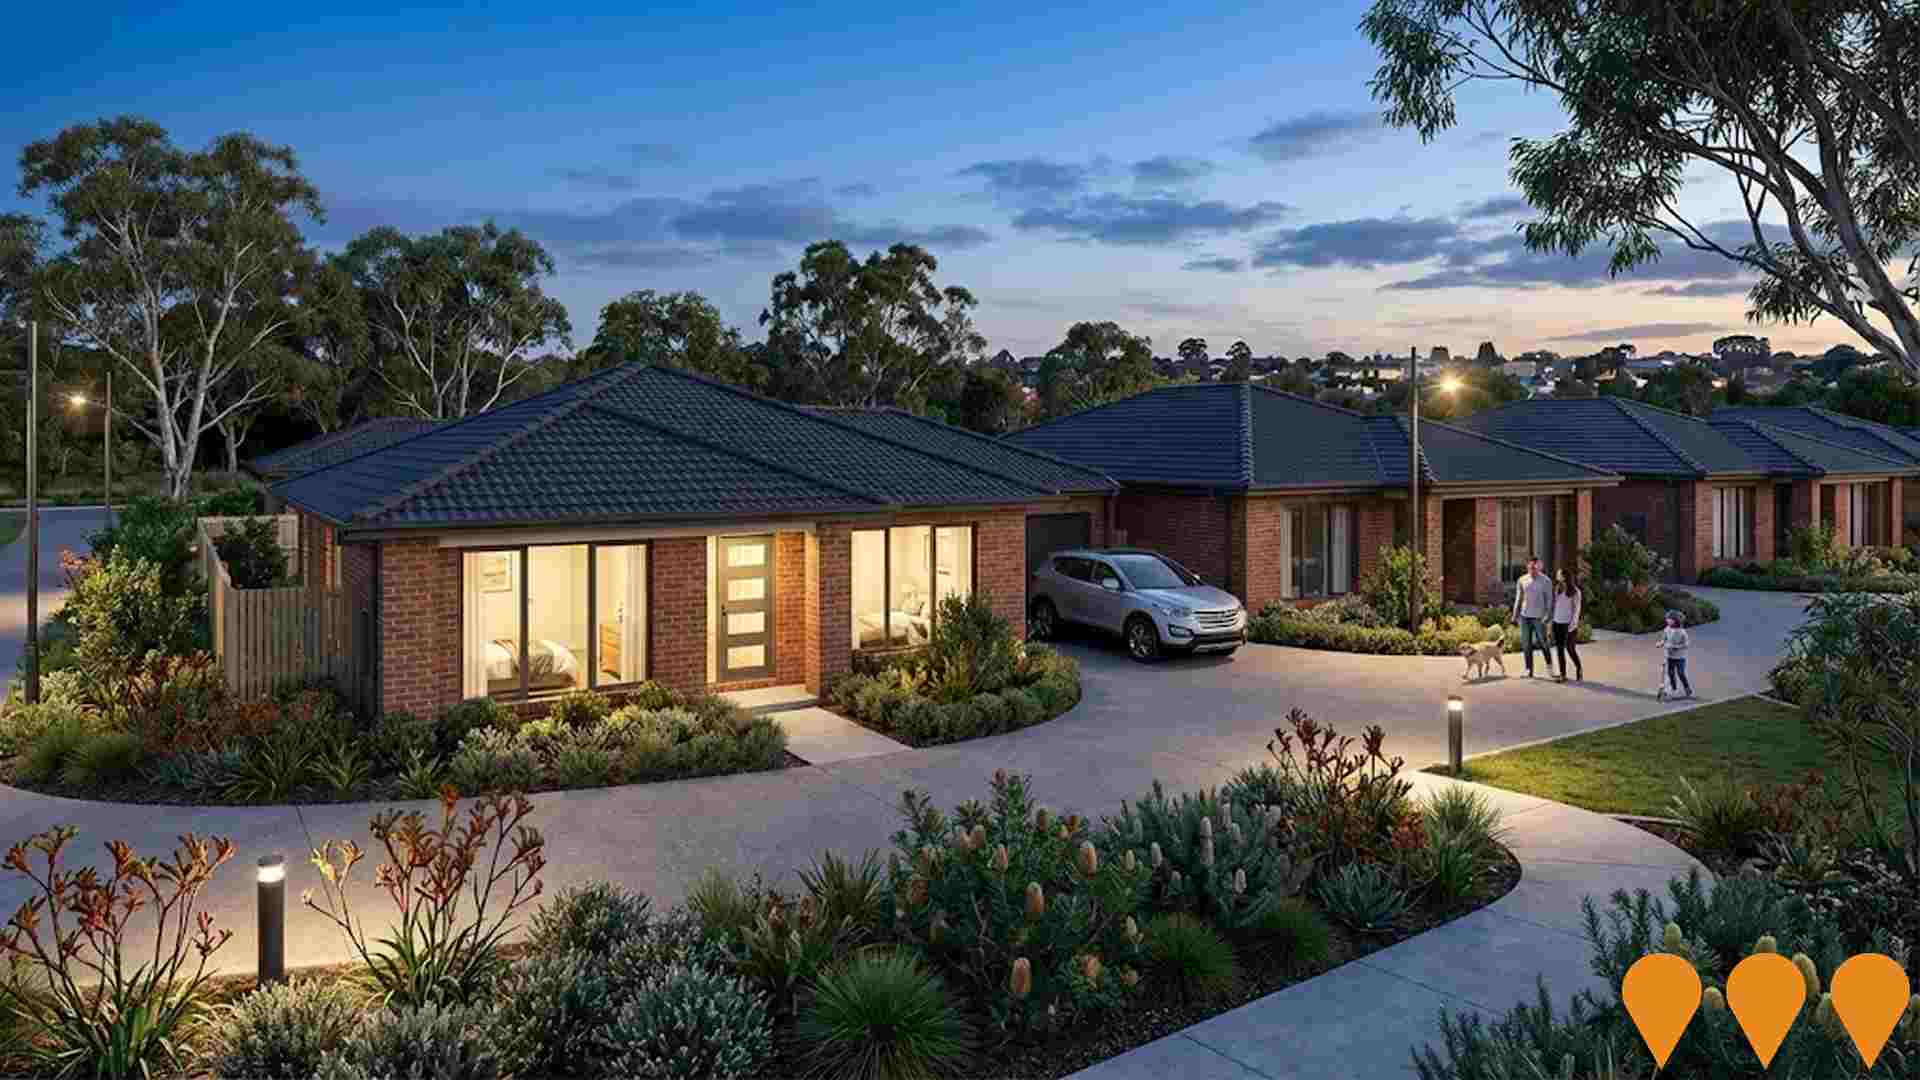
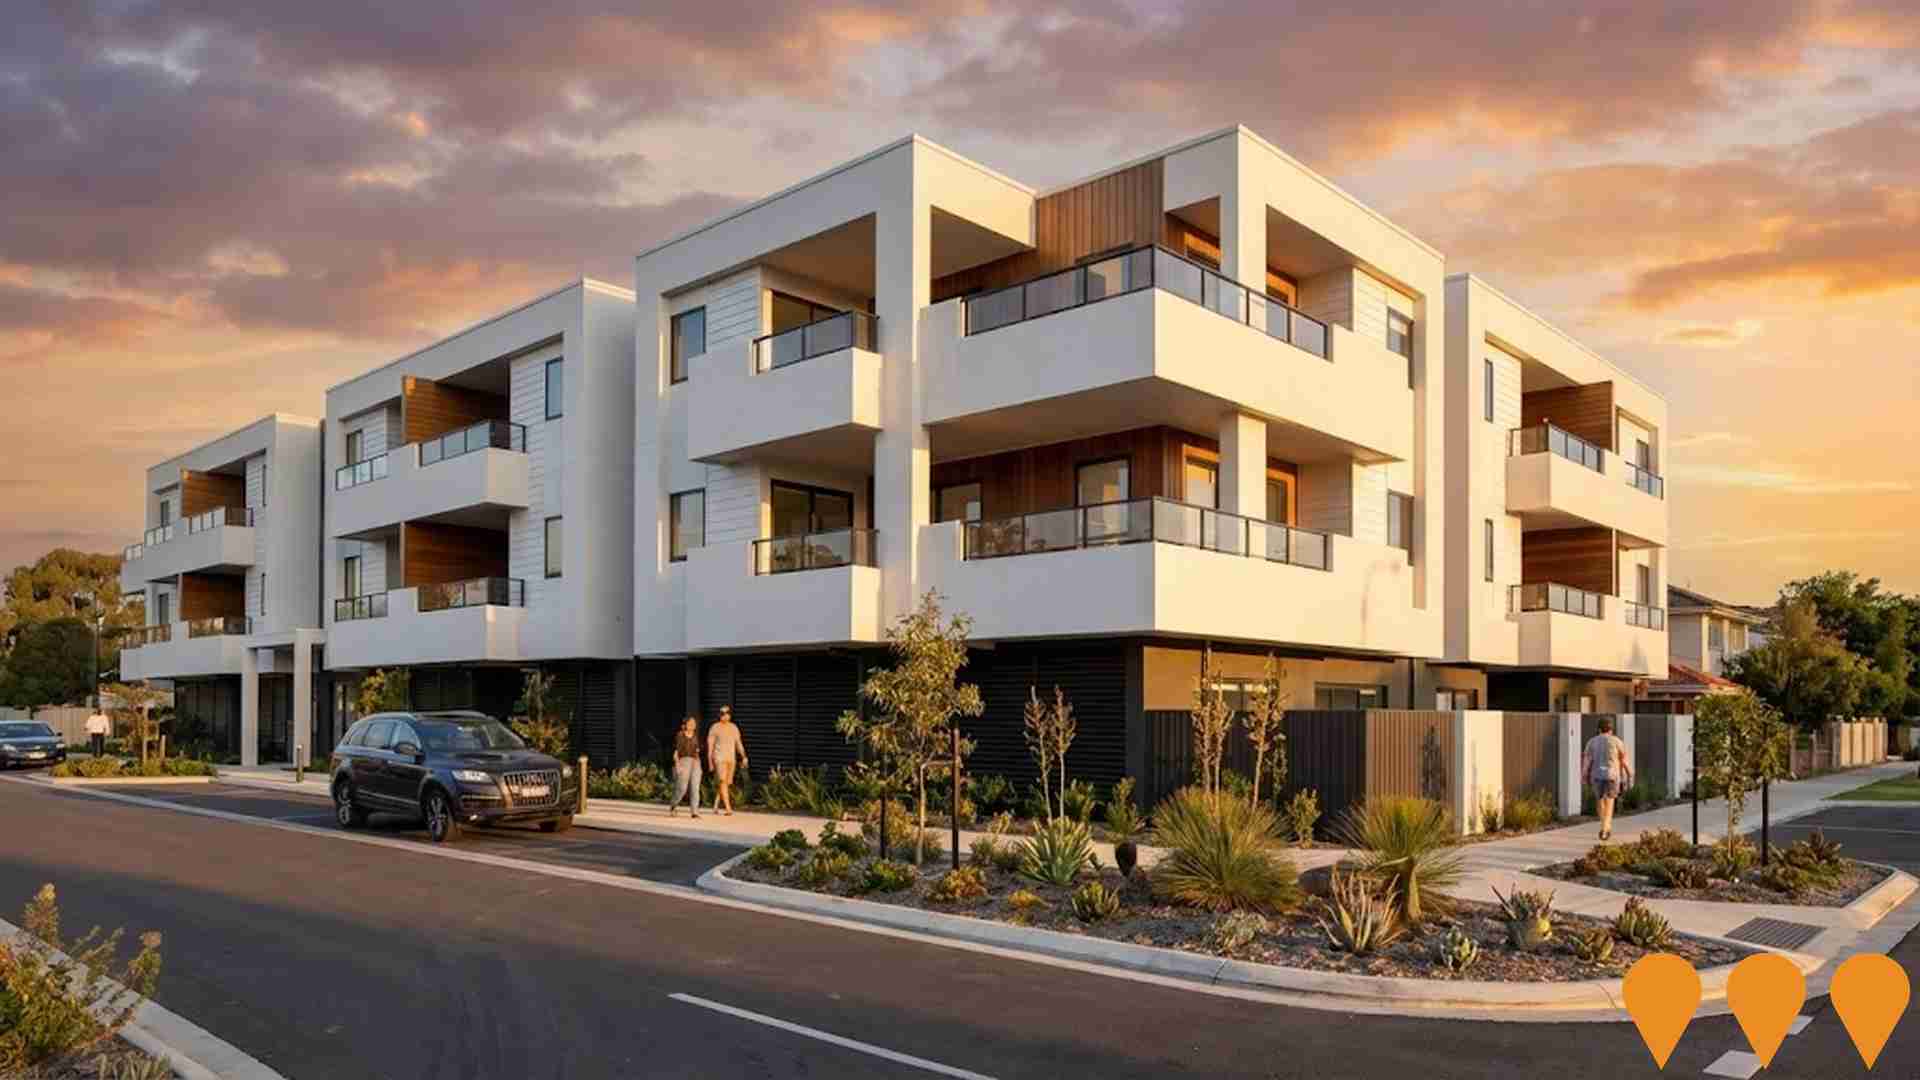
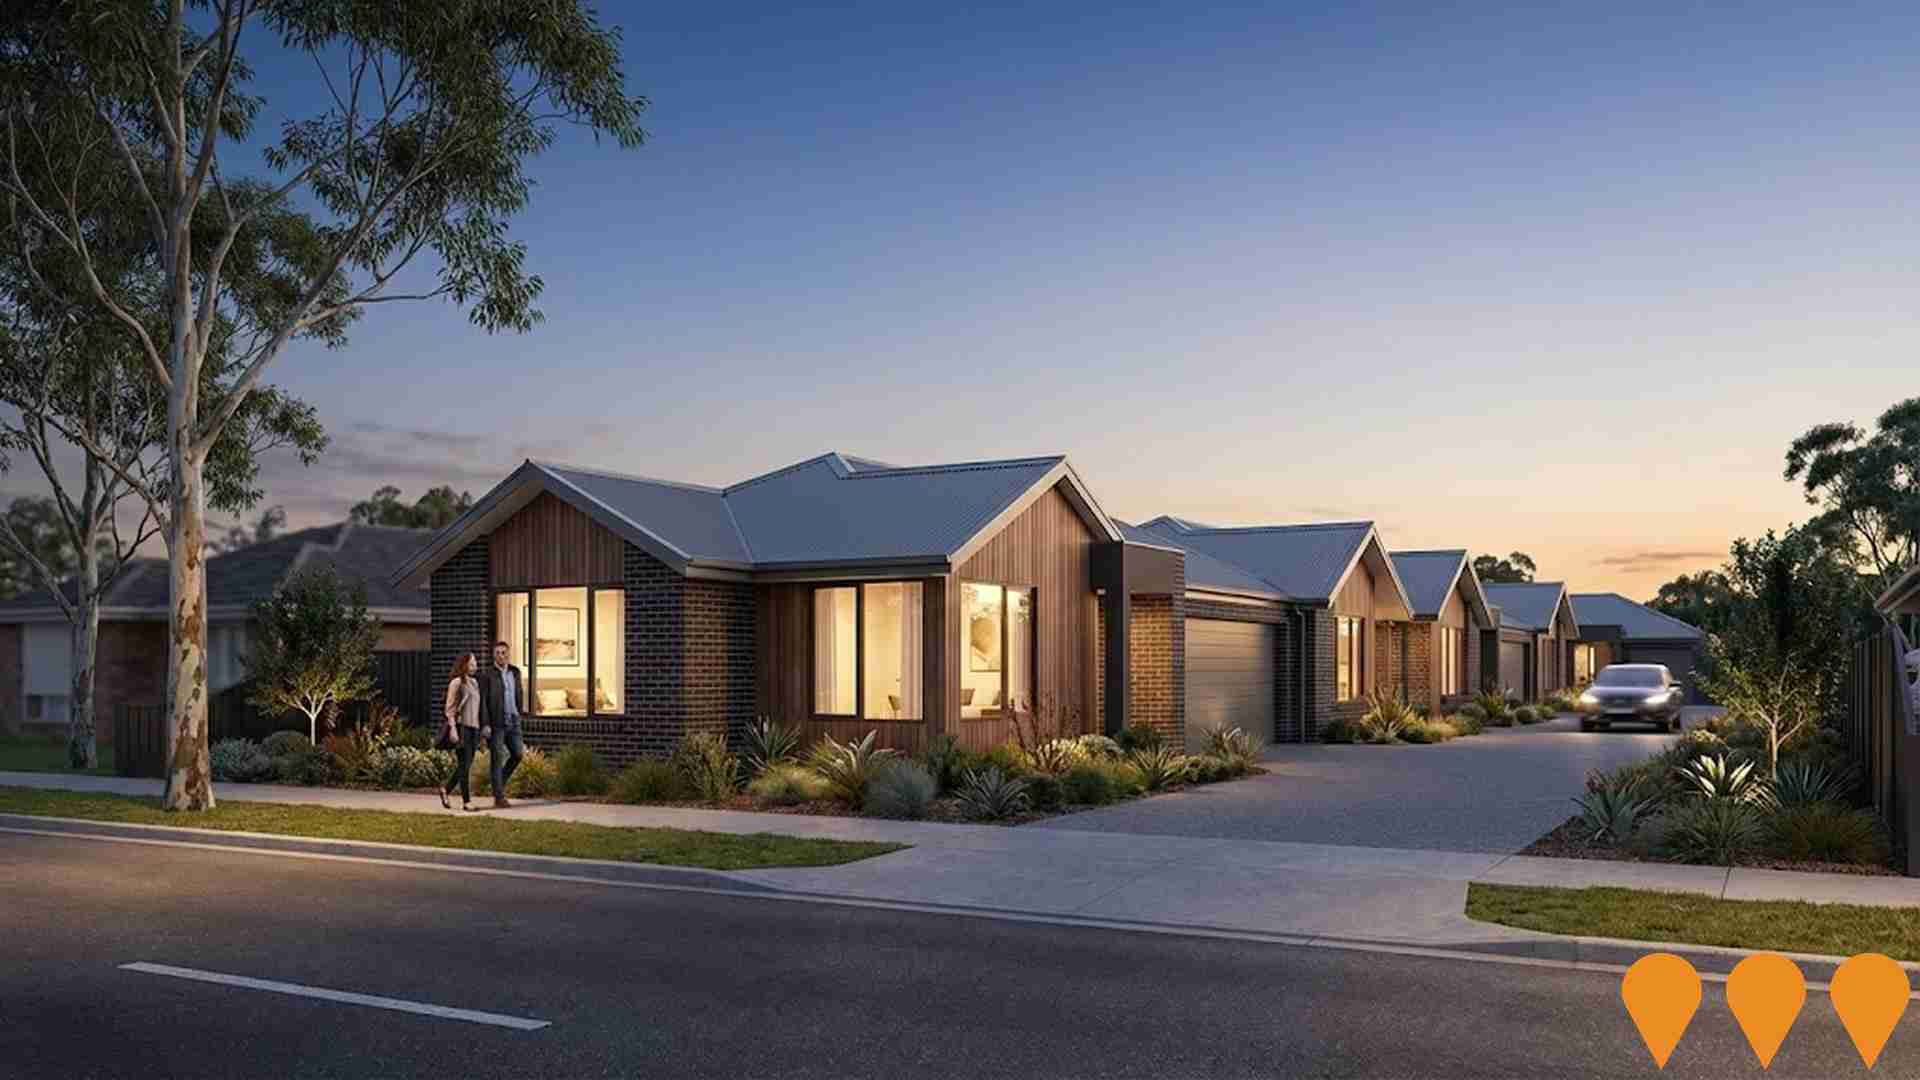
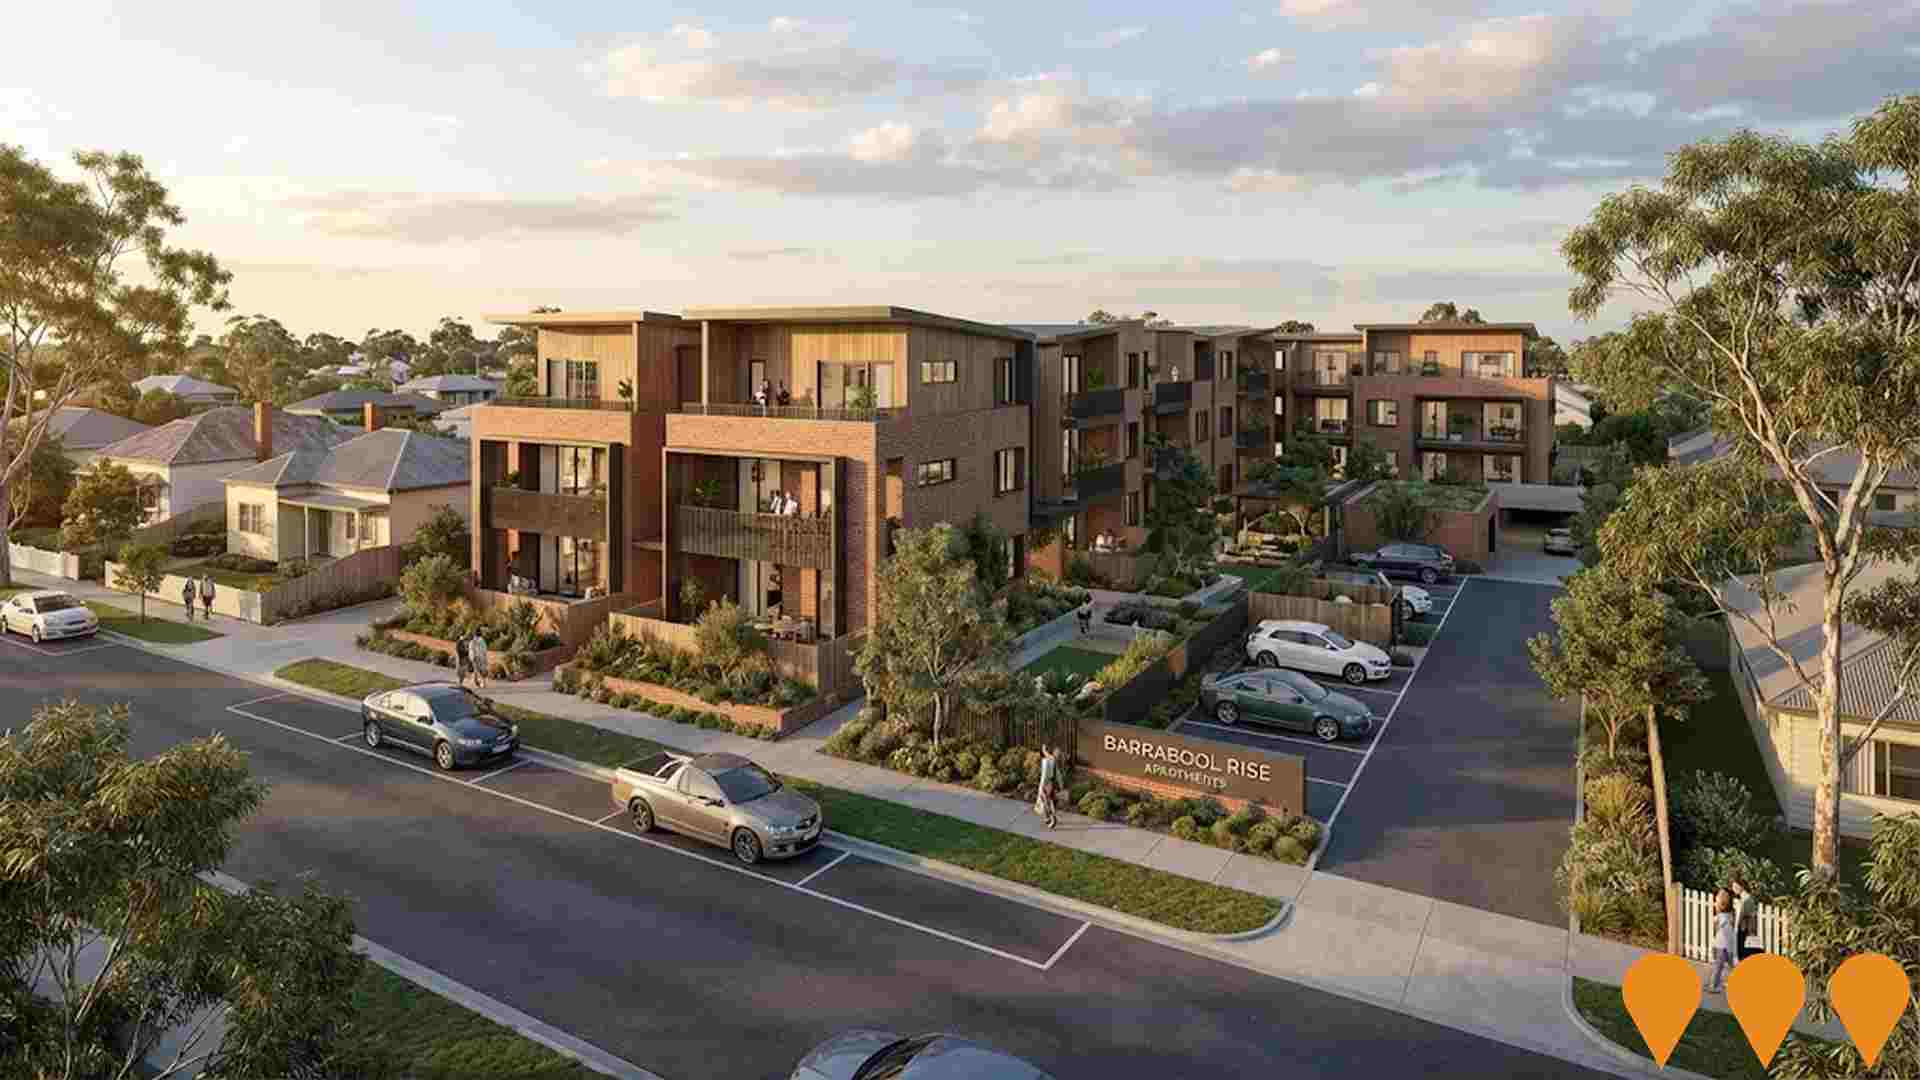
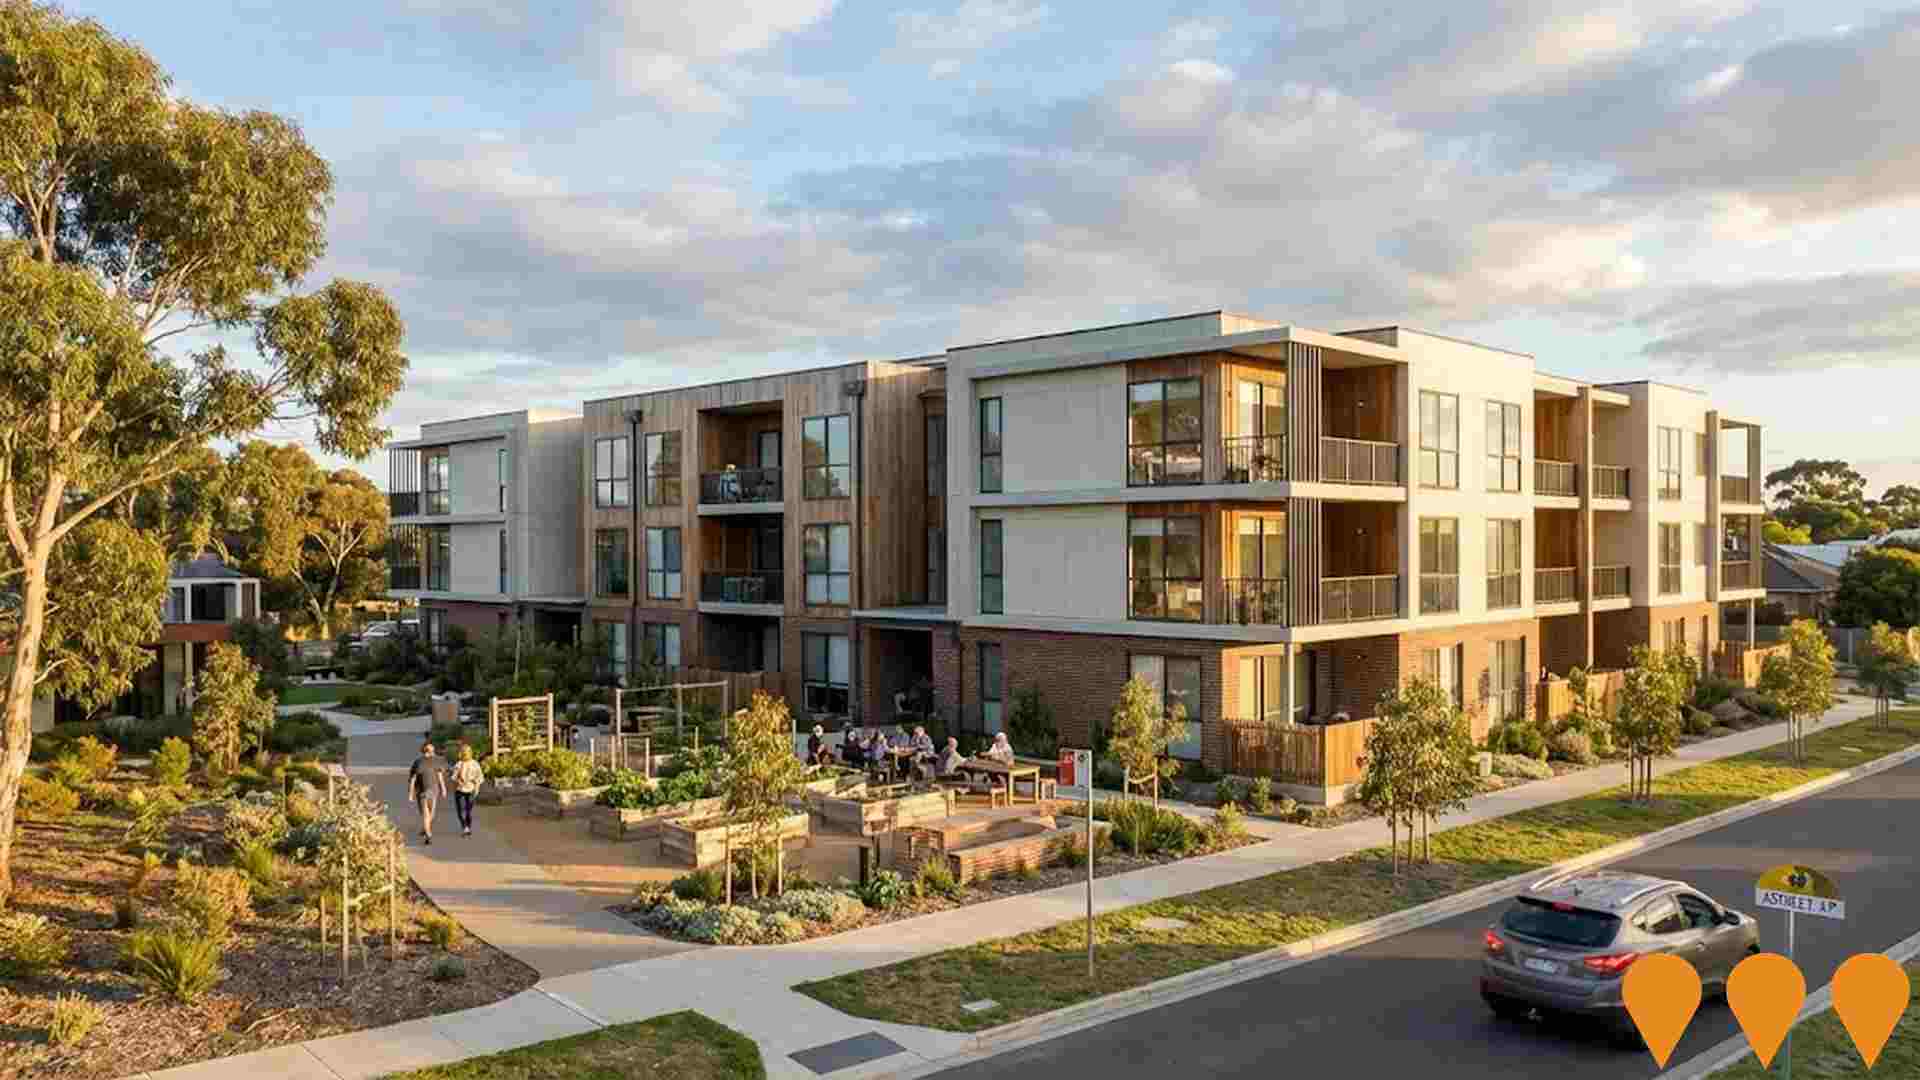
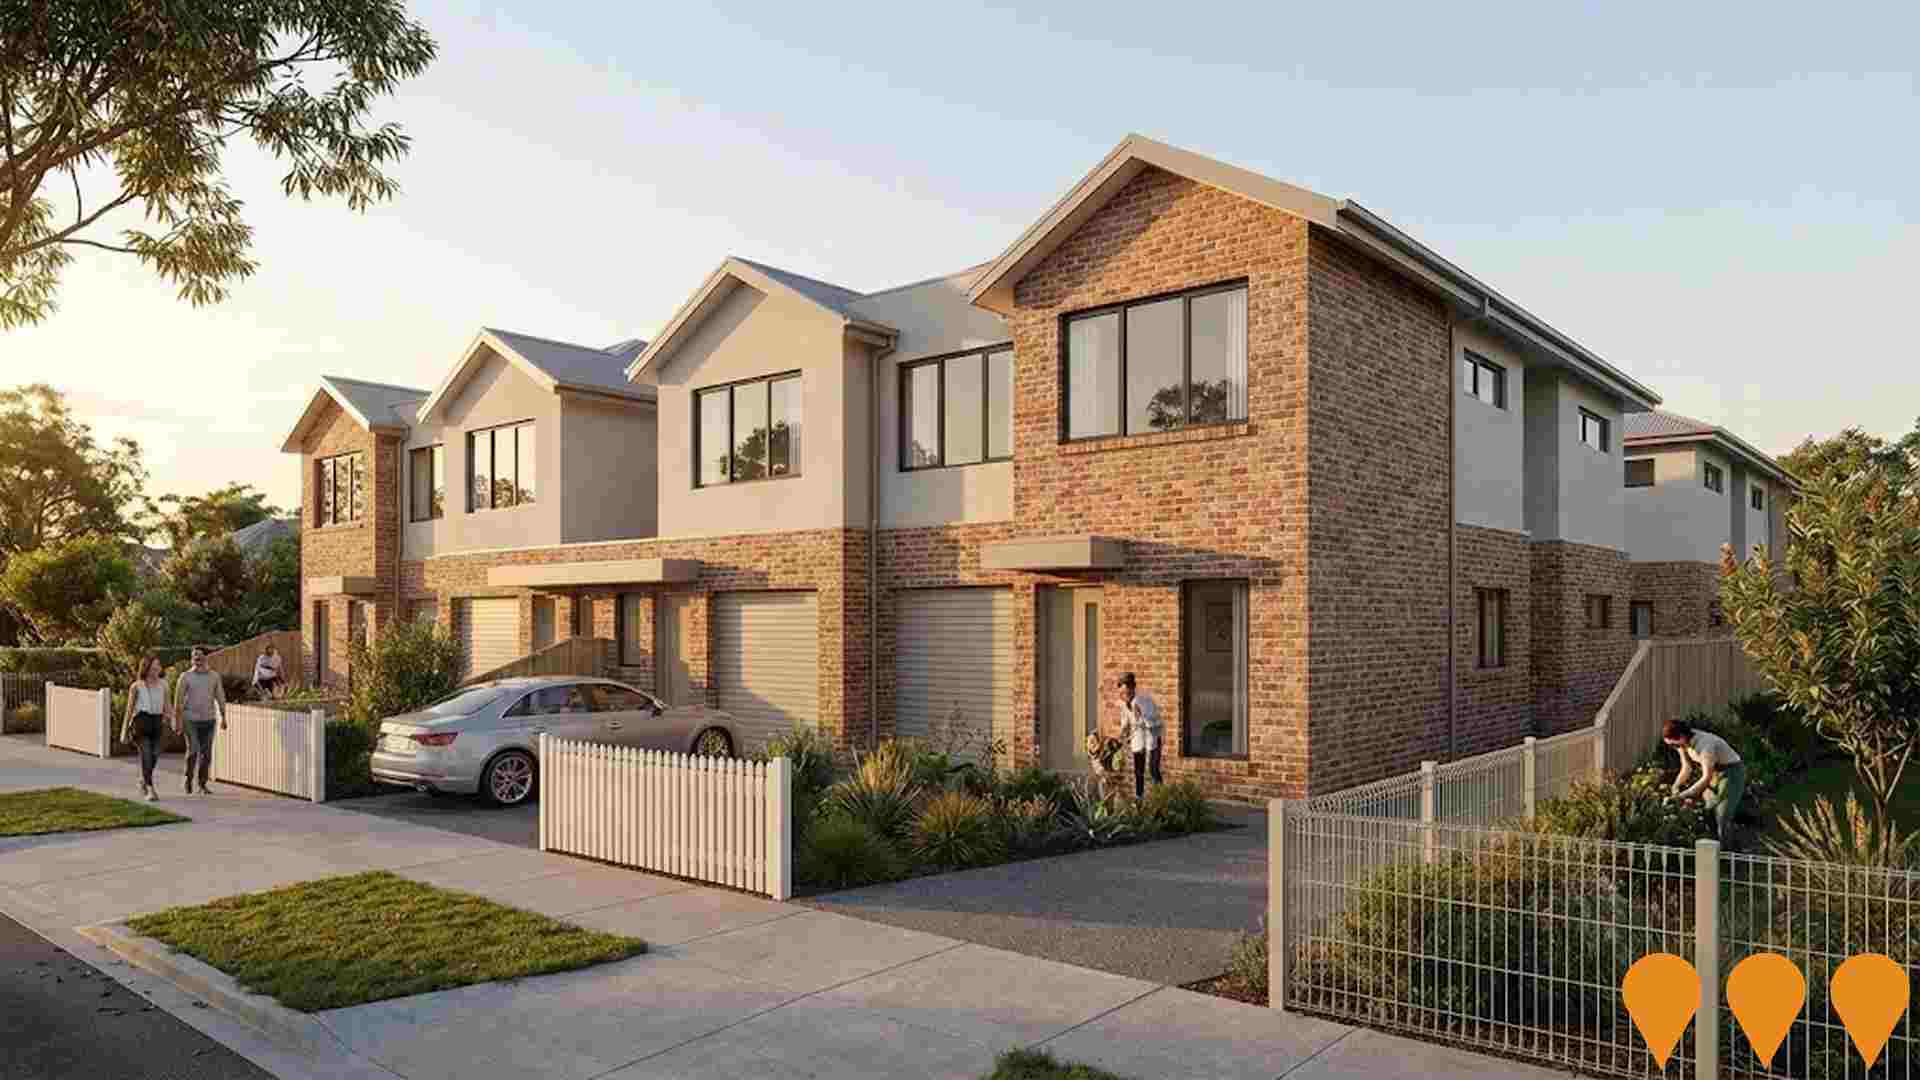
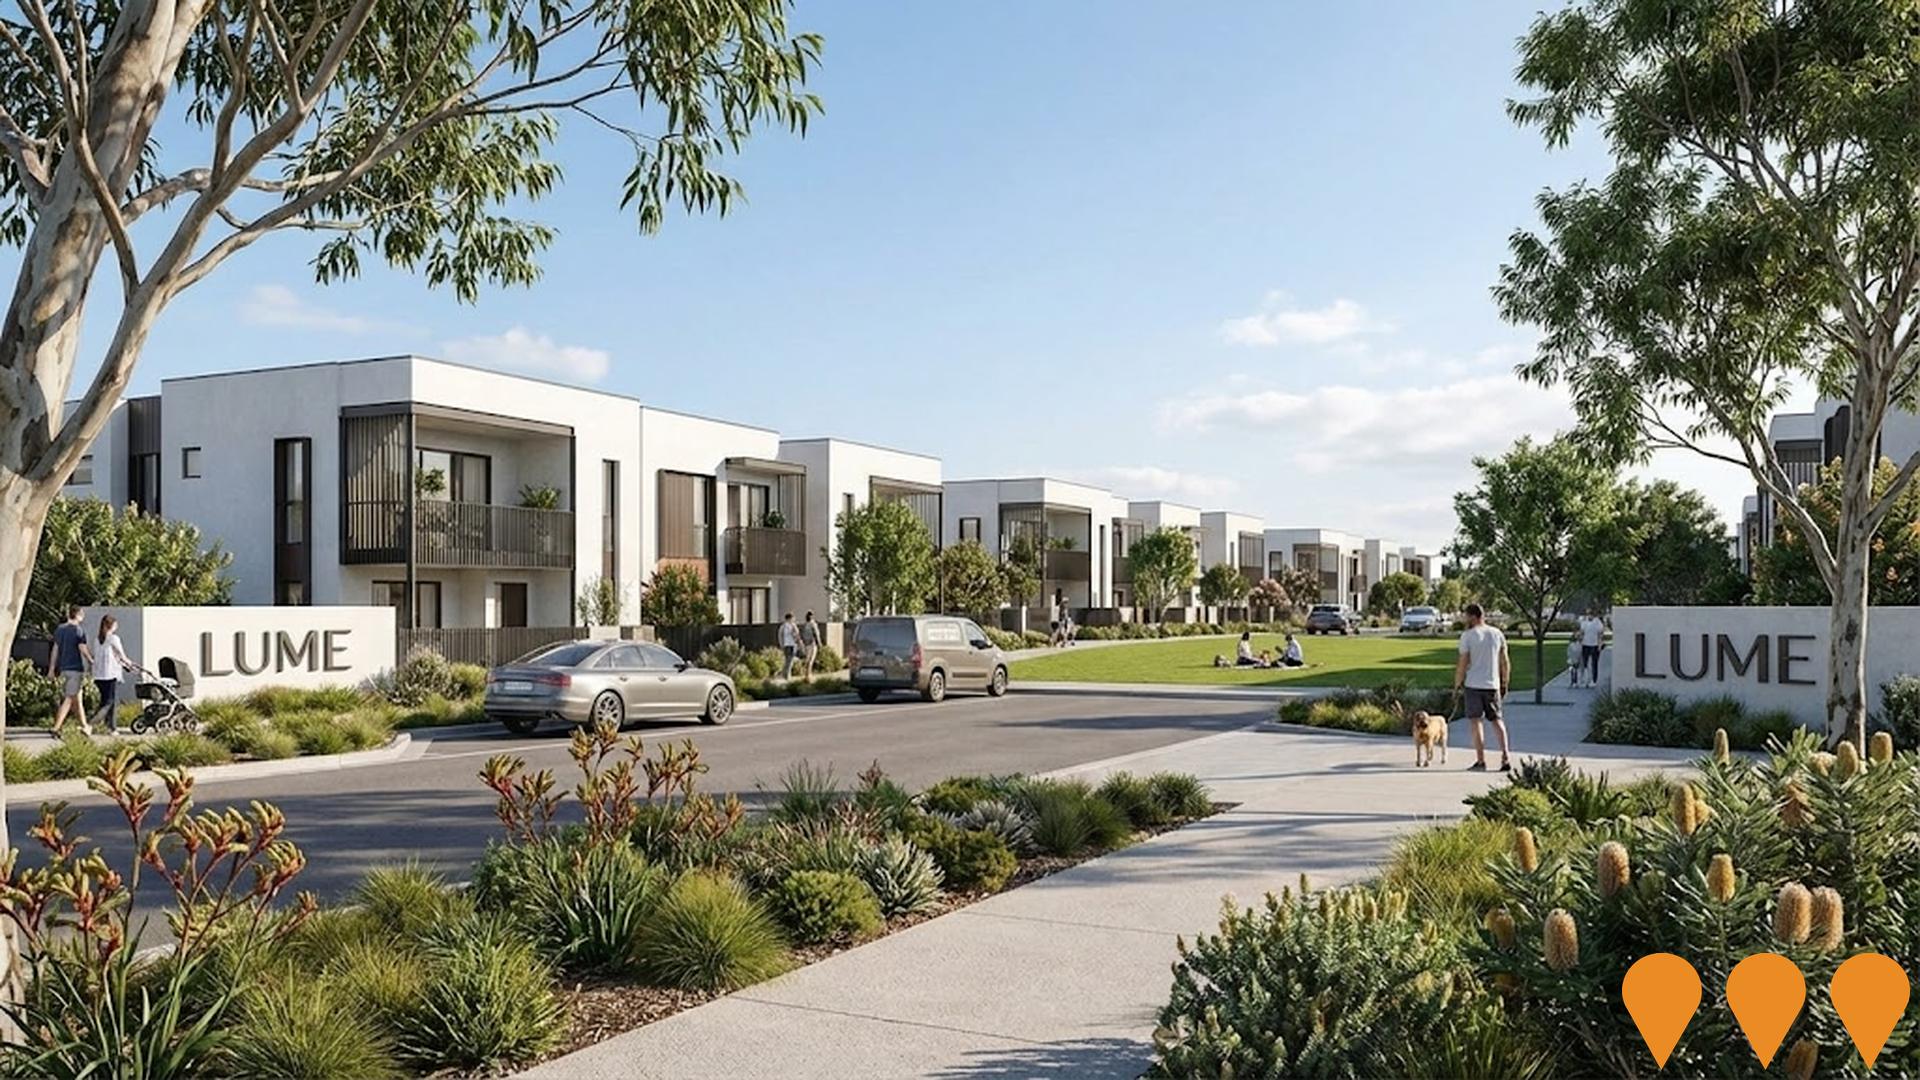
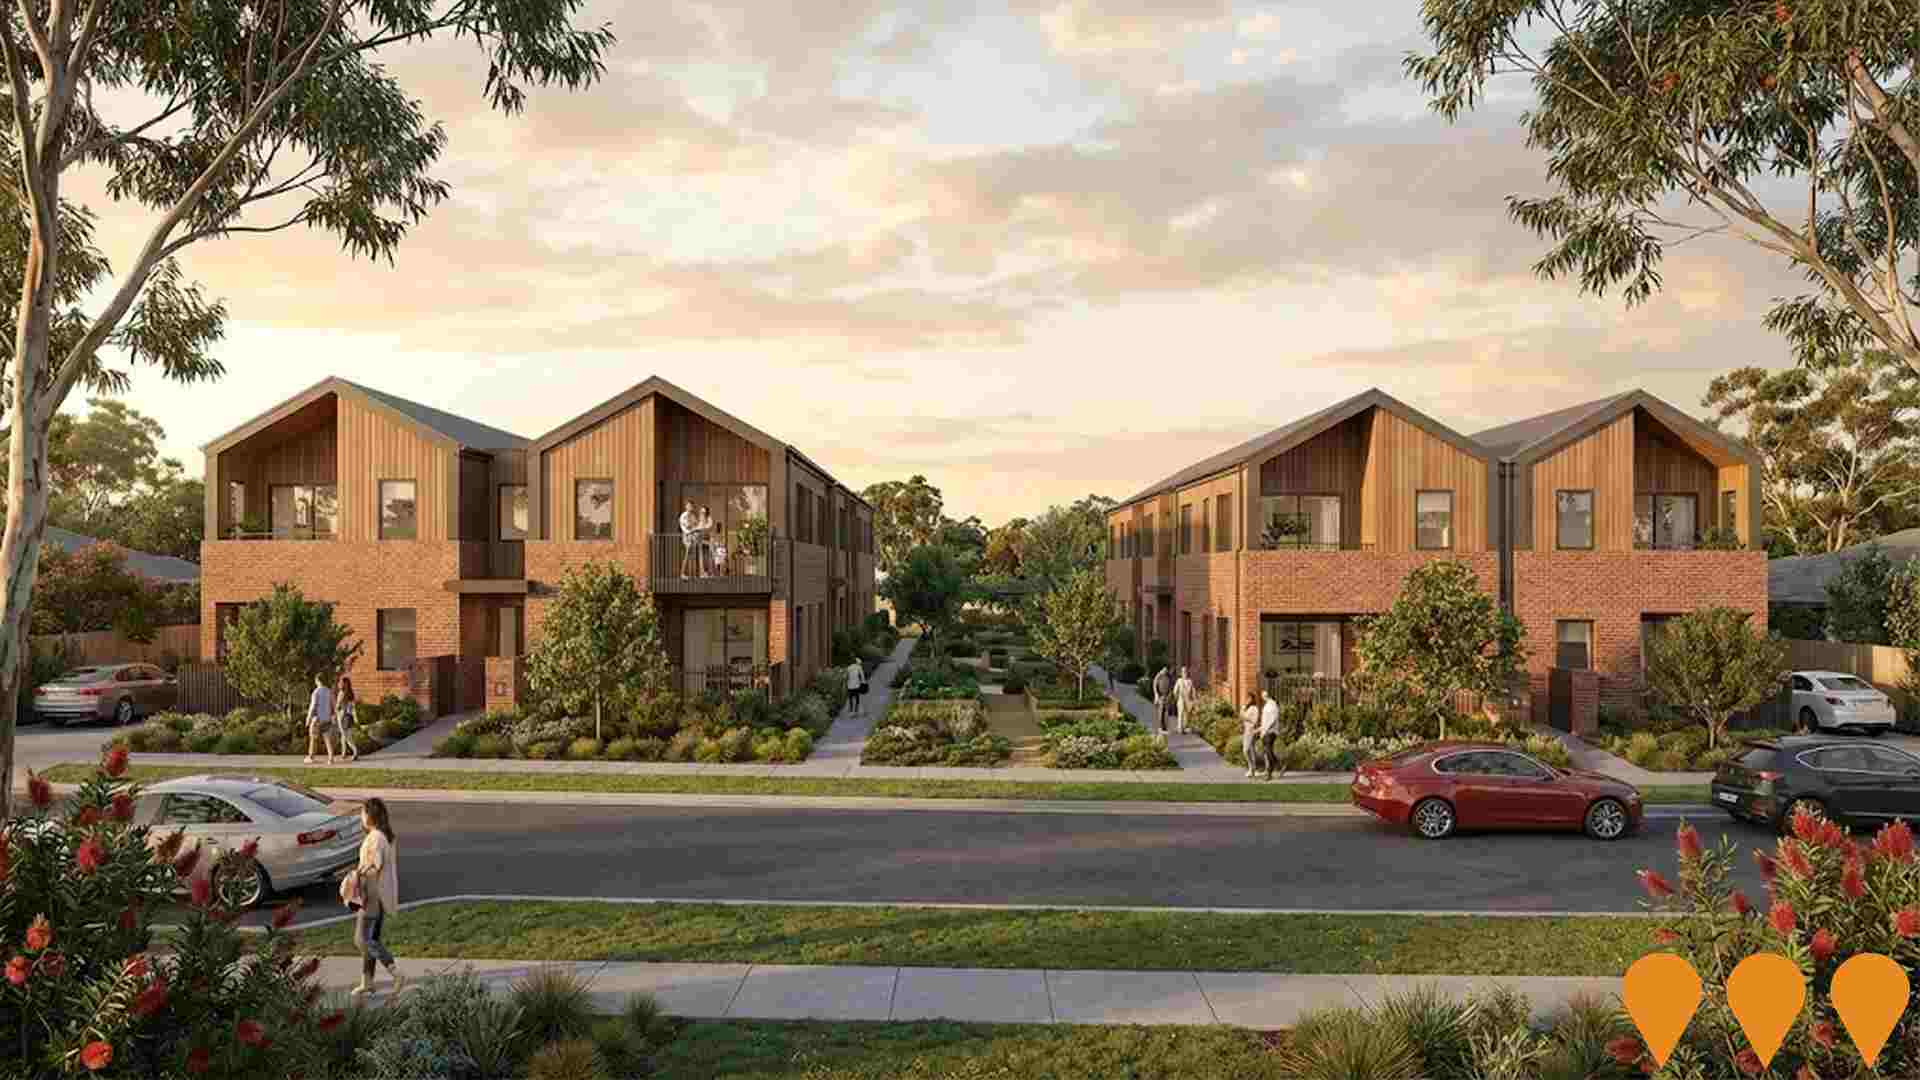
Changes in local infrastructure significantly affect an area's performance. AreaSearch has identified 28 projects that may impact the area. Notable ones include Wandana Estate, Coles Belmont Redevelopment, 29 Evans Street Townhouses, and 5-7 Church Street Townhouses. The following list details those most likely to be relevant.
Professional plan users can use the search below to filter and access additional projects.
INFRASTRUCTURE SEARCH
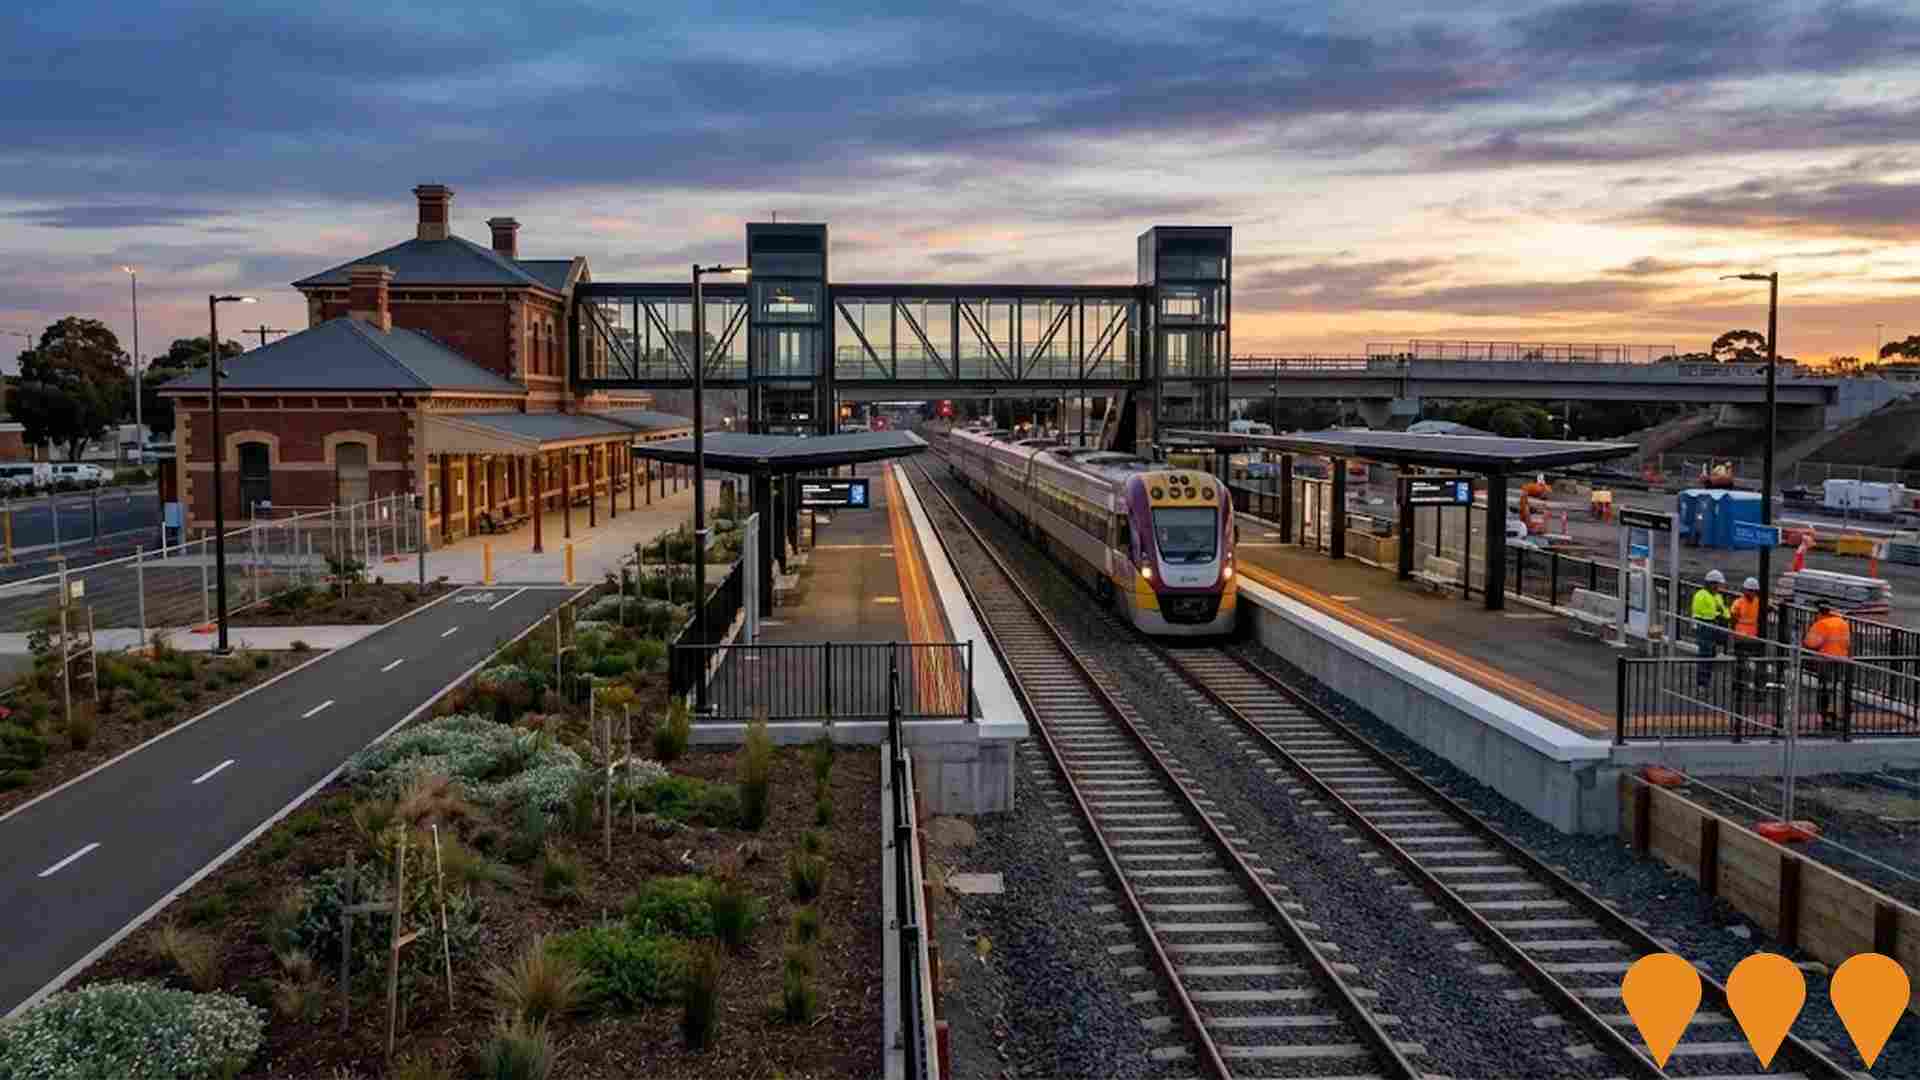
 Denotes AI-based impression for illustrative purposes only, not to be taken as definitive under any circumstances. Please follow links and conduct other investigations from the project's source for actual imagery. Developers and project owners wishing us to use original imagery please Contact Us and we will do so.
Frequently Asked Questions - Infrastructure
South Geelong to Waurn Ponds Duplication (Geelong Line Upgrade)
The South Geelong to Waurn Ponds Duplication project duplicated approximately 8km of track between South Geelong and Waurn Ponds, upgraded South Geelong and Marshall stations, rebuilt Waurn Ponds station precinct, removed level crossings at Fyans Street and Surf Coast Highway with elevated rail bridges, upgraded signalling, added over 500 new/updated car spaces, and constructed approximately 5km of new shared user paths. This enables up to 10-minute peak services, 5 extra services per hour in peaks and 3 interpeak to Marshall and Waurn Ponds, significantly improving capacity, reliability and active transport connections on Victoria's busiest regional rail line. Major construction completed in 2024 with services resumed August 2024.
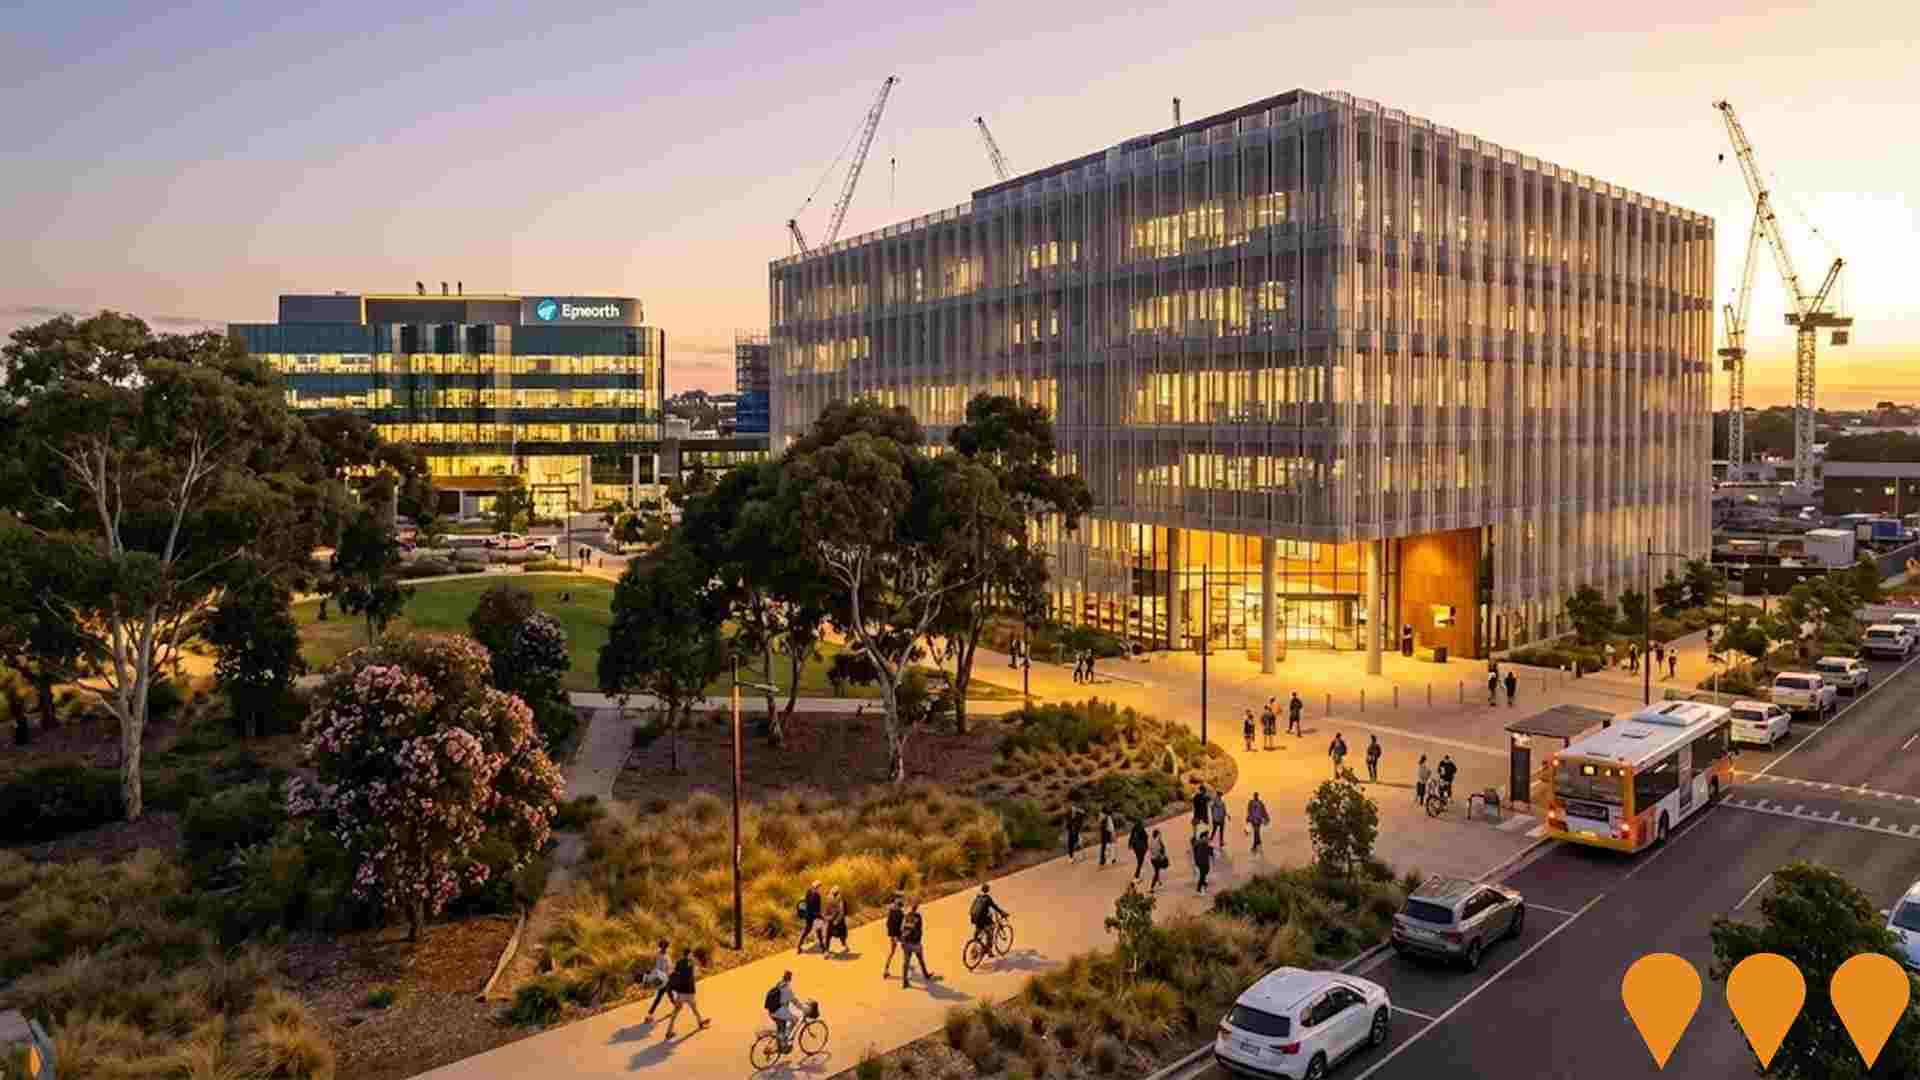
Epworth Geelong Innovation and Education Precinct
A $600 million multi-stage health, innovation and education precinct on 4.2 hectares adjacent to Epworth Geelong hospital in Waurn Ponds. The 10+ year vision will deliver approximately 100,000 sqm GFA comprising expanded private hospital facilities, allied health services, medical research, health education and training spaces in partnership with Deakin University, and potential aged care components. Jointly led by NorthWest Healthcare Properties REIT and Epworth HealthCare.
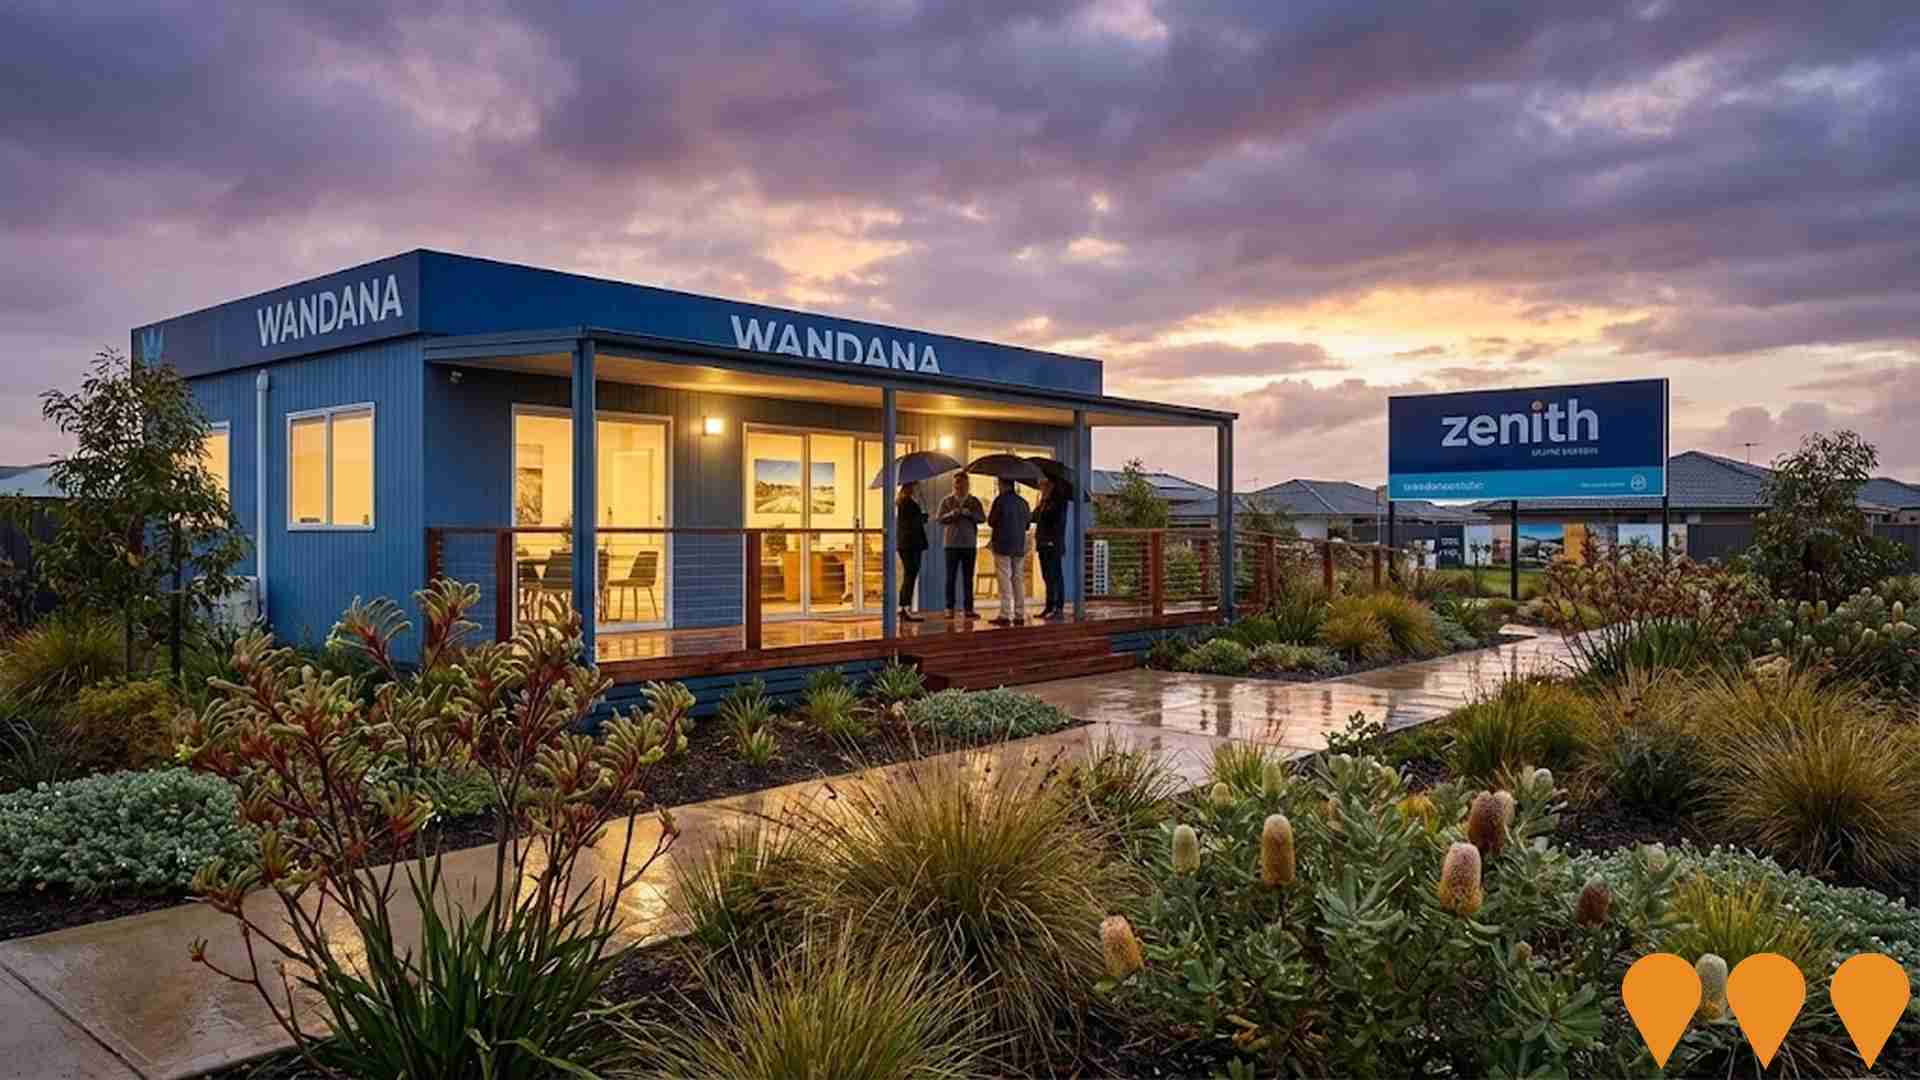
Wandana Estate
197 residential lots ranging from 350m2 to 1,267m2 with commanding views from You Yangs to Corio Bay. Master-planned community by Australia's leading greenfields developer featuring parks, wetlands, walking tracks and $500,000 redevelopment of Drewan Park. Located at corner Barrabool Road & Cityview Drive.
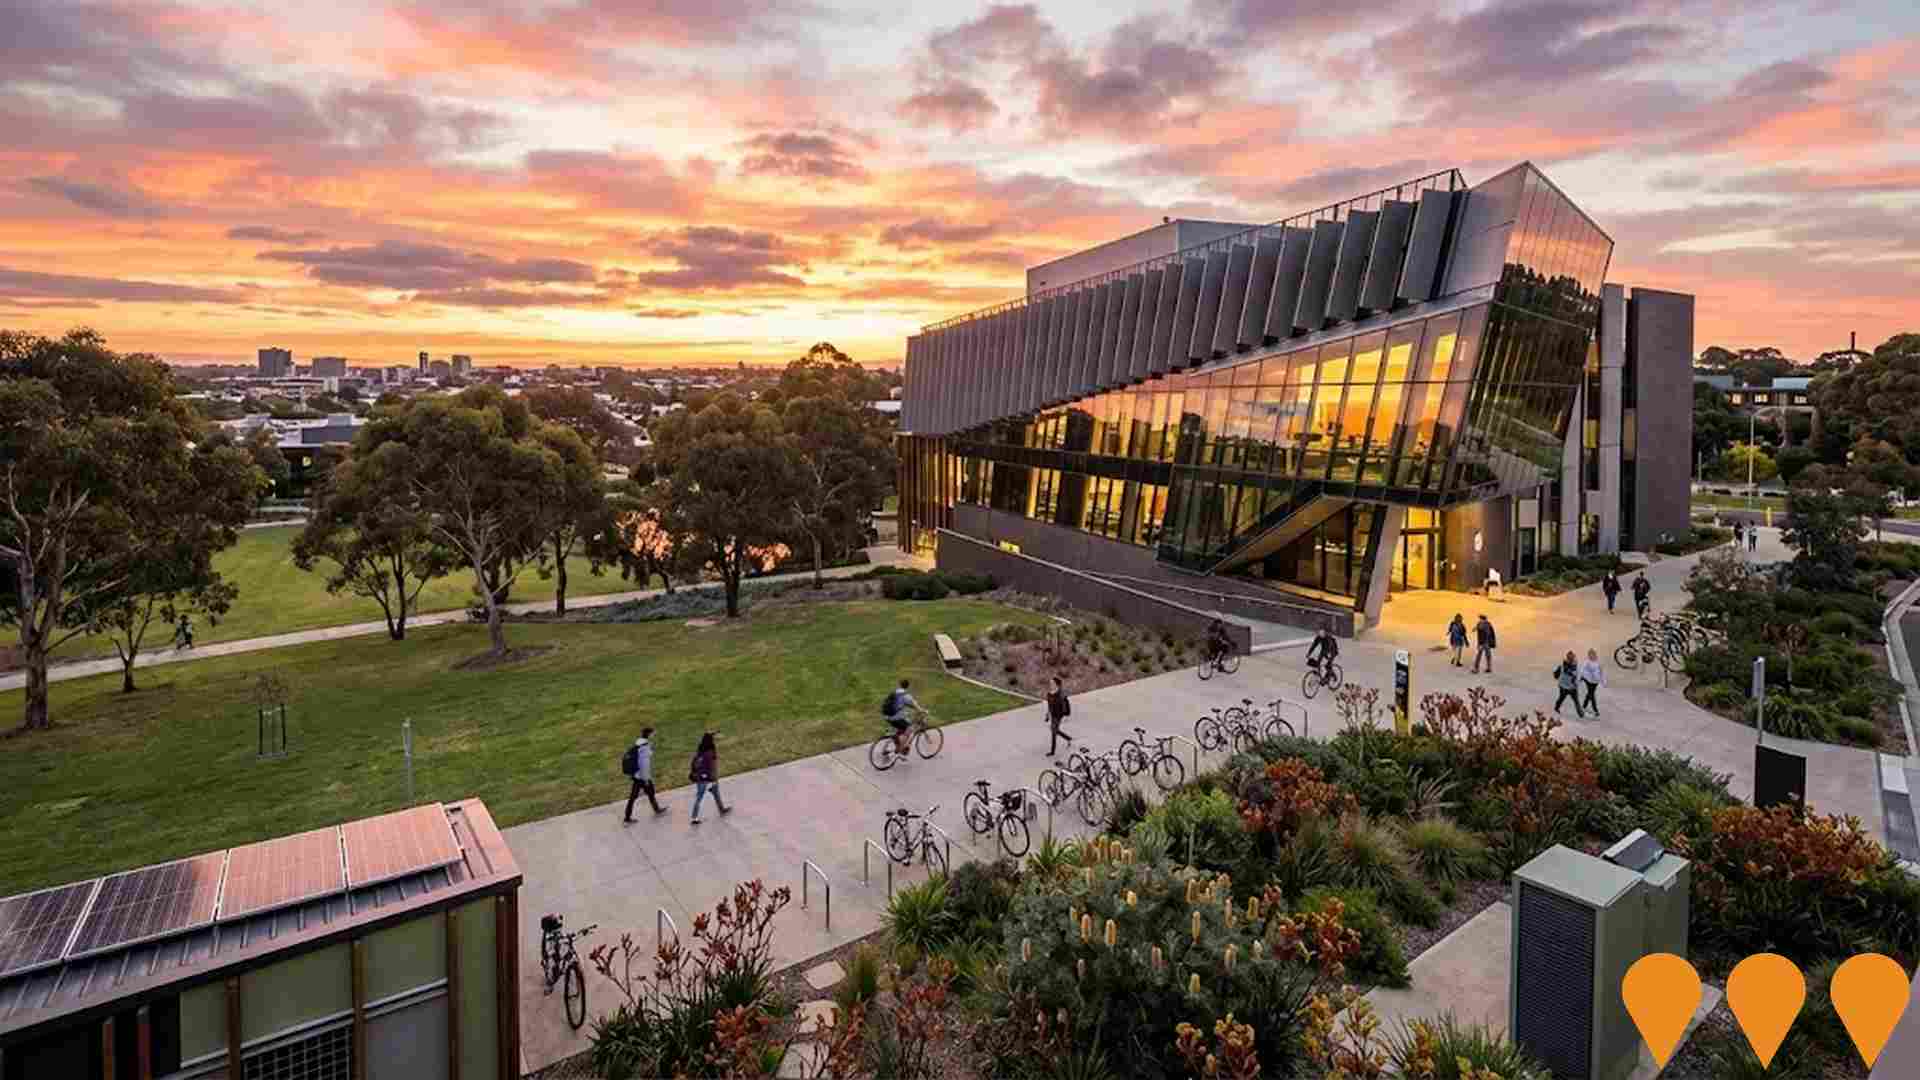
Deakin University Waurn Ponds Expansion
Major campus expansion including Geelong Future Economy Precinct, new student accommodation (320 beds), renewable energy microgrid and state-of-the-art research facilities. Victoria's top 1% ranked university with multiple building projects underway on the Climate Ready Campus.
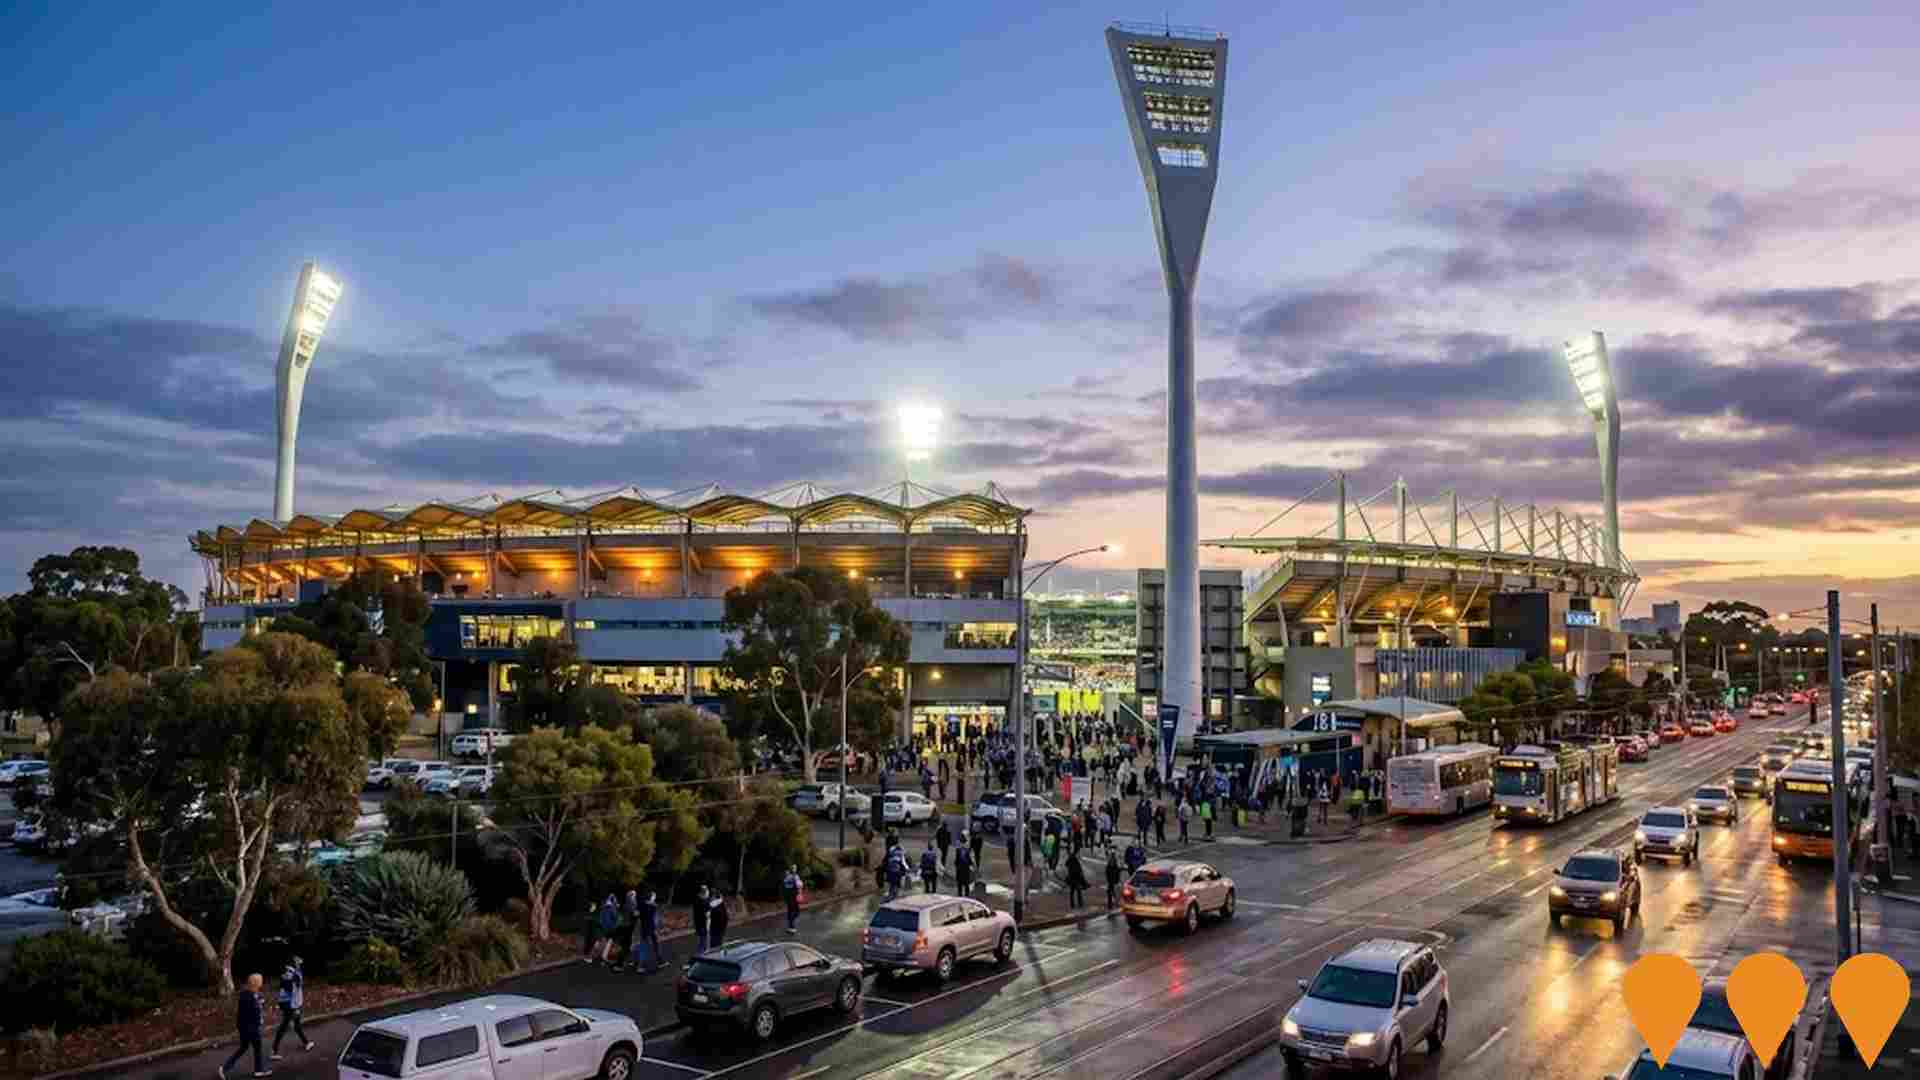
Geelong Regional Sports Precinct
Development of a world-class regional sports precinct centered around Kardinia Park, including stadium upgrades, new training facilities, community sports infrastructure, and integrated commercial and entertainment venues.
1-5 McKenzie Street Social Housing
29 affordable housing apartments across two double-storey buildings by Housing Choices Australia, providing quality homes for low-income households
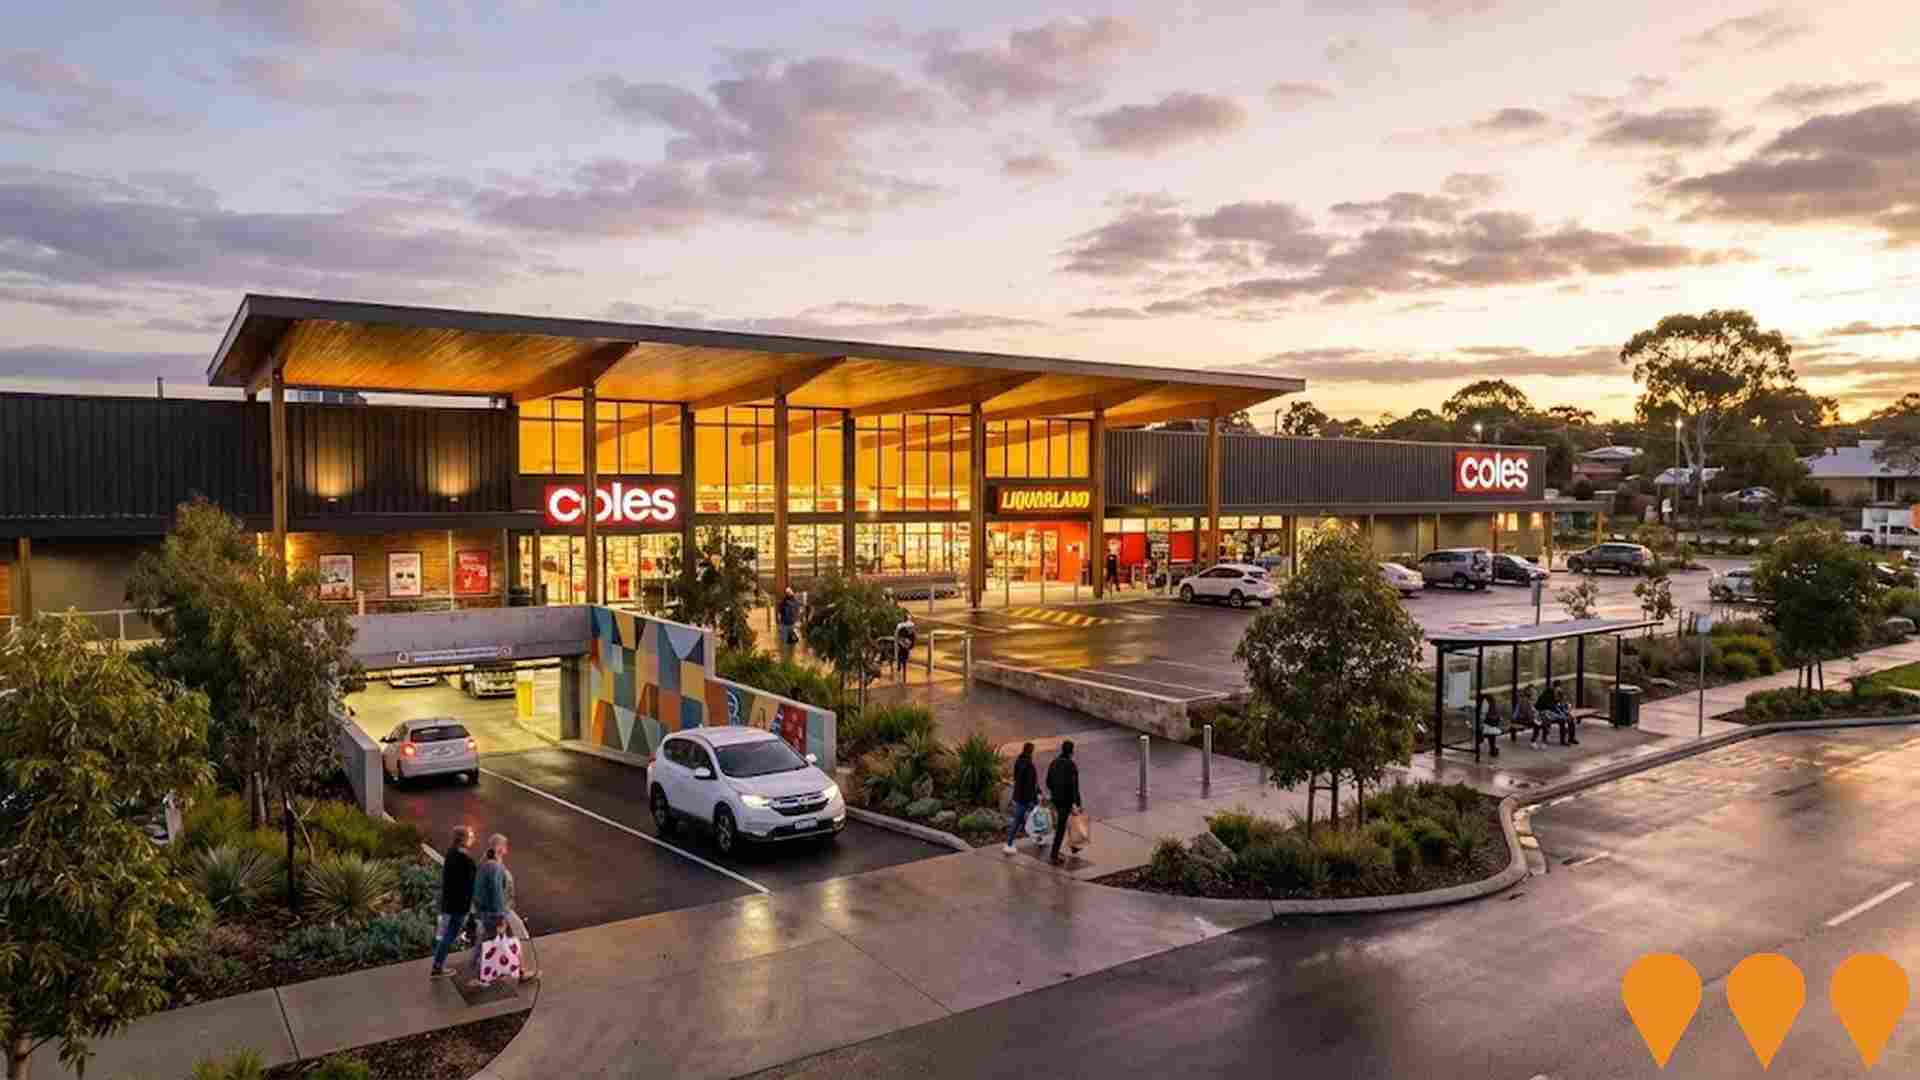
Coles Belmont Redevelopment
Comprehensive redevelopment of existing Coles supermarket featuring construction of a larger contemporary supermarket building, new Liquorland bottle shop, underground car parking with 161 spaces, public art wall showcasing local art, extended forecourt and canopy on High Street, improved bus service amenities, and enhanced pedestrian connectivity. The project includes reduction of existing surface car parking to accommodate expanded building footprint.
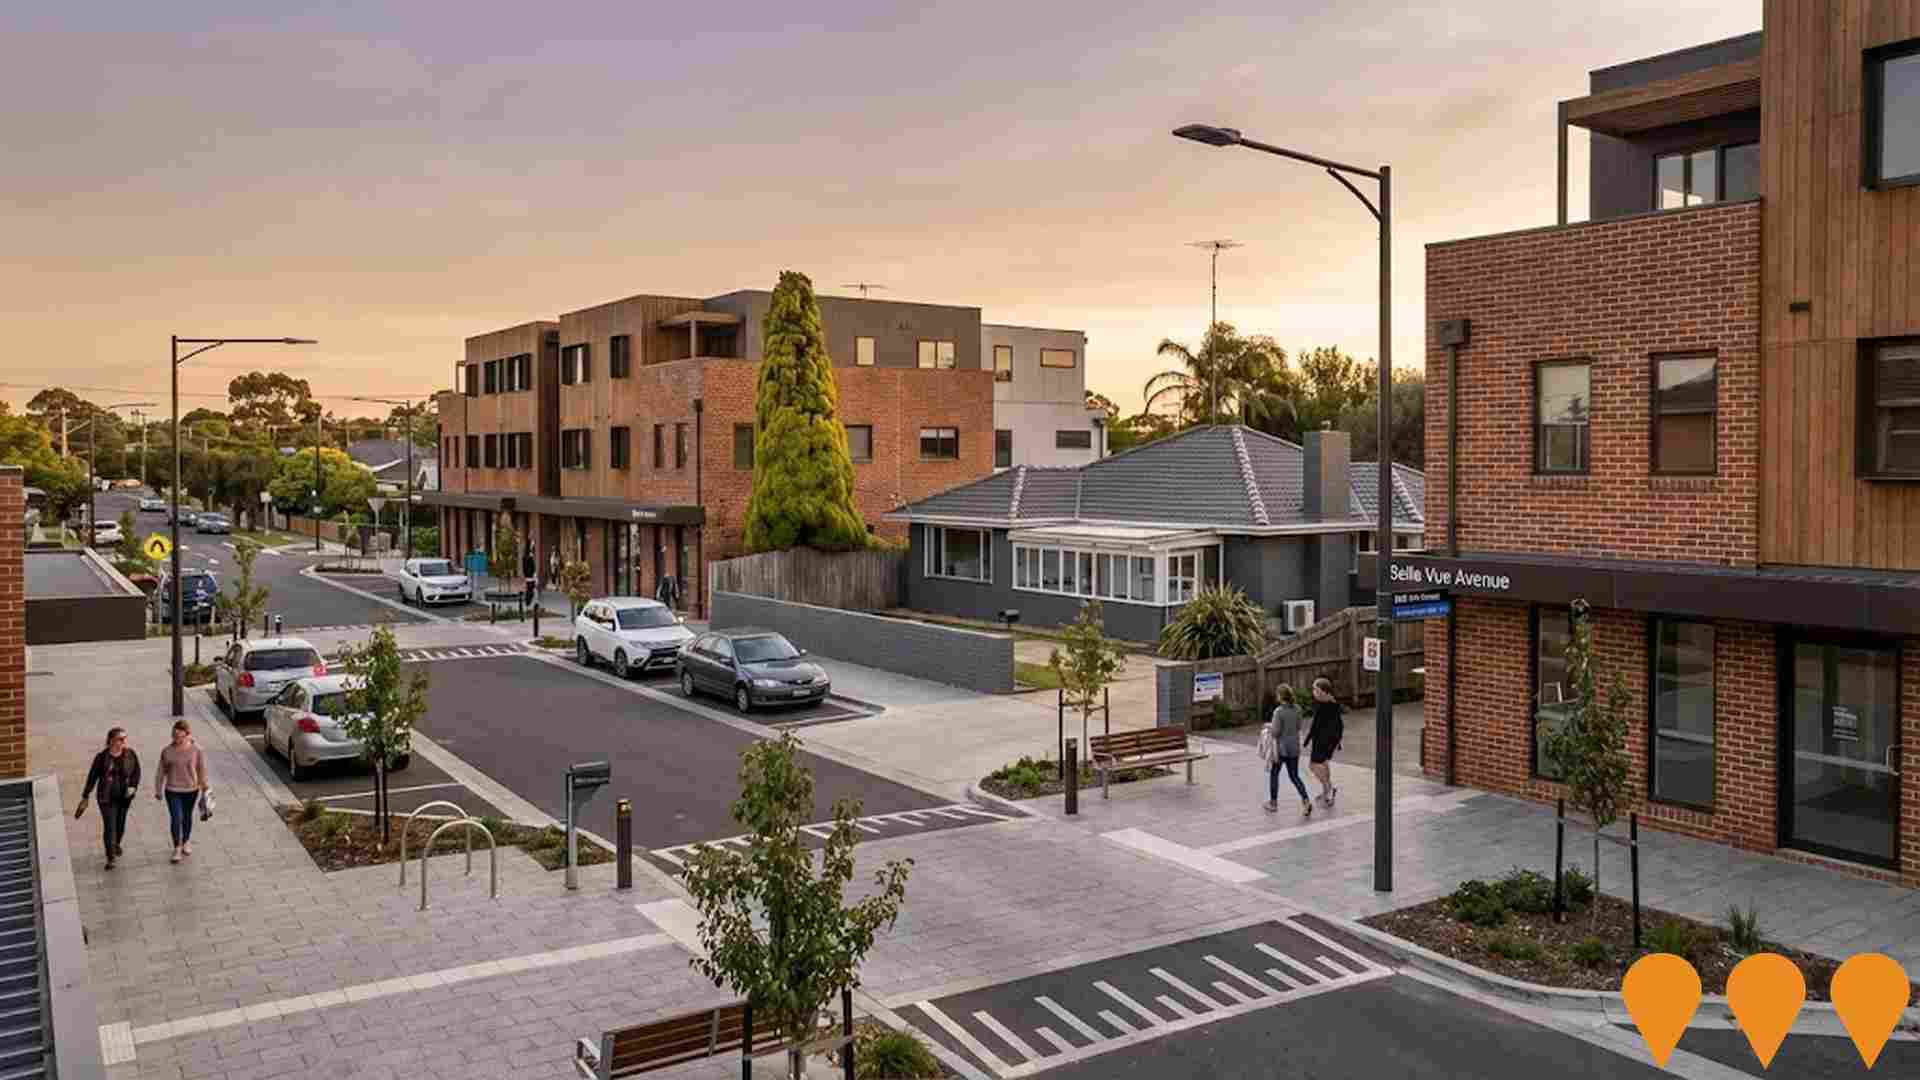
Highton Urban Design Framework
Comprehensive village improvement framework including enhanced streetscapes, building height guidelines (2-4 storeys), improved parking and traffic management, and greater pedestrianisation of Belle Vue Avenue.
Employment
Despite maintaining a low unemployment rate of 3.9%, Belmont has experienced recent job losses, resulting in a below average employment performance ranking when compared nationally
Belmont's workforce is well-educated with prominent representation in essential services sectors. The unemployment rate stands at 3.9%.
As of September 2025, 8,085 residents are employed, with an unemployment rate of 3.9%, slightly higher than Rest of Vic.'s 3.8%. Workforce participation is high at 63.0% compared to Rest of Vic.'s 57.4%. Employment concentration lies in health care & social assistance (21.3%), education & training (18.7%), and construction (16.9%).
Conversely, agriculture, forestry & fishing shows lower representation at 0.6% versus the regional average of 7.5%. Over the year to September 2025, labour force levels decreased by 0.6%, while employment declined by 0.7%, with unemployment remaining stable. State-level data from November 25, 2025 shows VIC employment grew by 1.13% year-on-year, adding 41,950 jobs, with the state unemployment rate at 4.7%. National forecasts project employment growth of 6.6% over five years and 13.7% over ten years. Applying these projections to Belmont's employment mix suggests local employment should increase by 6.9% over five years and 14.3% over ten years, based on a simple weighting extrapolation for illustrative purposes.
Frequently Asked Questions - Employment
Income
The area's income profile falls below national averages based on AreaSearch analysis
According to AreaSearch's aggregation of ATO data released for financial year 2022, Belmont SA2 had a median income among taxpayers of $51,955 and an average level of $67,194. These figures are just above the national average. In comparison, Rest of Vic. had median and average incomes of $48,741 and $60,693 respectively. Based on Wage Price Index growth of 12.16% since financial year 2022, current estimates for Belmont SA2 are approximately $58,273 (median) and $75,365 (average) as of September 2025. According to the 2021 Census, household, family, and personal incomes in Belmont rank modestly, between the 36th and 49th percentiles. Income brackets indicate that 32.4% of the population (4,950 individuals) fall within the $1,500 - $2,999 income range, reflecting patterns seen in the broader area where 30.3% similarly occupy this range. Housing affordability pressures are severe, with only 83.4% of income remaining, ranking at the 36th percentile. The area's SEIFA income ranking places it in the 5th decile.
Frequently Asked Questions - Income
Housing
Belmont is characterized by a predominantly suburban housing profile, with a higher proportion of rental properties than the broader region
The dwelling structure in Belmont, as evaluated at the latest Census, consisted of 77.7% houses and 22.4% other dwellings such as semi-detached homes, apartments, and 'other' dwellings. This compares to Non-Metro Vic.'s 84.6% houses and 15.4% other dwellings. The home ownership level in Belmont was 32.2%, similar to that of Non-Metro Vic., with the remaining dwellings either mortgaged (31.7%) or rented (36.1%). The median monthly mortgage repayment in the area was $1,700, lower than Non-Metro Vic.'s average of $1,712 and the national average of $1,863. The median weekly rent figure in Belmont was recorded at $350, compared to Non-Metro Vic.'s $335 and the national figure of $375.
Frequently Asked Questions - Housing
Household Composition
Belmont features high concentrations of lone person households and group households, with a lower-than-average median household size
Family households account for 60.5% of all households, including 24.9% couples with children, 23.9% couples without children, and 10.4% single parent families. Non-family households constitute the remaining 39.5%, with lone person households at 34.1% and group households comprising 5.5%. The median household size is 2.3 people, which is smaller than the Rest of Vic. average of 2.4.
Frequently Asked Questions - Households
Local Schools & Education
The educational profile of Belmont exceeds national averages, with above-average qualification levels and academic performance metrics
Belmont's educational attainment is notably higher than broader averages. Among residents aged 15 and above, 34.1% hold university qualifications, compared to 21.7% in the rest of Victoria and 27.3% in the SA3 area. This high level of educational attainment positions Belmont favourably for opportunities requiring advanced knowledge. Bachelor degrees are most prevalent at 21.5%, followed by postgraduate qualifications (8.7%) and graduate diplomas (3.9%). Vocational credentials are also common, with 33.6% of residents aged 15 and above holding such qualifications – advanced diplomas account for 11.4%, while certificates make up 22.2%.
Educational participation is high in Belmont, with 28.6% of residents currently enrolled in formal education. This includes 8.6% in primary education, 7.0% in tertiary education, and 6.4% pursuing secondary education.
Frequently Asked Questions - Education
Schools Detail
Nearby Services & Amenities
Transport
Transport servicing is moderate compared to other areas nationally based on assessment of service frequency, route connectivity and accessibility
The analysis of public transport in Belmont shows that there are currently 61 active transport stops operating within the area. These stops serve a mix of bus routes, with a total of 12 individual routes in operation. Collectively, these routes provide for 1,580 weekly passenger trips.
The accessibility of transport in Belmont is rated as good, with residents typically located approximately 233 meters from their nearest transport stop. On average, service frequency across all routes amounts to 225 trips per day, which equates to roughly 25 weekly trips per individual stop.
Frequently Asked Questions - Transport
Transport Stops Detail
Health
Health performance in Belmont is lower than average with common health conditions somewhat prevalent across both younger and older age cohorts
Belmont faces significant health challenges, with common health conditions prevalent among both younger and older age cohorts.
Approximately 53% (~8,158 people) have private health cover, a rate found to be fairly high. The most common medical conditions are mental health issues affecting 10.8% of residents and asthma impacting 8.7%. 66.3% of residents declare themselves completely clear of medical ailments, compared to 65.9% across the Rest of Vic. As of 2021, 16.7% (2,556 people) of Belmont's residents are aged 65 and over, broadly in line with the general population's health profile.
Frequently Asked Questions - Health
Cultural Diversity
In terms of cultural diversity, Belmont records figures broadly comparable to the national average, as found in AreaSearch's assessment of a number of language and cultural background related metrics
Belmont's population, like the wider region, was predominantly Australian-born citizens speaking English at home: 86.9%, 82.2%, and 88.3% respectively. Christianity dominated Belmont's religious landscape at 41.3%. Hinduism was slightly overrepresented in Belmont at 2.4%, compared to the regional average of 1.7%.
The top three ancestral groups were English (28.9%), Australian (25.8%), and Irish (10.8%). Notably, Dutch ancestry was marginally higher in Belmont at 1.9% versus 2.0% regionally, Scottish at 9.0% compared to 8.3%, and Welsh at 0.6% against 0.5%.
Frequently Asked Questions - Diversity
Age
Belmont's population is slightly younger than the national pattern
The median age in Belmont is 36 years, which is significantly lower than Rest of Vic.'s average of 43 years, and somewhat younger than Australia's average of 38 years. The 25-34 age group constitutes 21.1% of the population in Belmont, compared to Rest of Vic., while the 65-74 cohort makes up 8.4%. This concentration of the 25-34 age group is well above the national average of 14.5%. Post-2021 Census data indicates that the area has become younger, with the median age dropping from 37 to 36 years. Specifically, the 25 to 34 age group grew from 17.4% to 21.1%, and the 35 to 44 cohort increased from 13.0% to 14.8%. Conversely, the 45 to 54 cohort declined from 11.2% to 9.8%, and the 55 to 64 group dropped from 10.3% to 9.2%. By 2041, Belmont is projected to experience notable shifts in its age composition. The 25-34 age cohort is expected to grow by 1,609 people (50%), from 3,228 to 4,838. Conversely, population declines are projected for the 65-74 and 55-64 cohorts.
