Chart Color Schemes
This analysis uses ABS Statistical Areas Level 2 (SA2) boundaries, which can materially differ from Suburbs and Localities (SAL) even when sharing similar names.
SA2 boundaries are defined by the Australian Bureau of Statistics and are designed to represent communities for statistical reporting (e.g., census and ERP).
Suburbs and Localities (SAL) represent commonly-used suburb/locality names (postal-style areas) and may use different geographic boundaries. For comprehensive analysis, consider reviewing both boundary types if available.
est. as @ -- *
ABS ERP | -- people | --
2021 Census | -- people
Sales Activity
Curious about local property values? Filter the chart to assess the volume and appreciation (including resales) trends and regional comparisons, or scroll to the map below view this information at an individual property level.
Find a Recent Sale
Sales Detail
Population
Charlemont lies within the top 10% of areas nationally in terms of population growth performance according to AreaSearch analysis of short and medium-term trends
Charlemont's population is around 14,804 as of Nov 2025. This reflects an increase of 4,504 people since the 2021 Census, which reported a population of 10,300 people. The change is inferred from the estimated resident population of 14,030 from the ABS as of June 2024 and an additional 2,455 validated new addresses since the Census date. This level of population equates to a density ratio of 817 persons per square kilometer. Charlemont's growth of 43.7% since the 2021 census exceeded the non-metro area (6.0%). Population growth was primarily driven by interstate migration, contributing approximately 83.3% of overall population gains during recent periods.
AreaSearch is adopting ABS/Geoscience Australia projections for each SA2 area, released in 2024 with a base year of 2022. For areas not covered, AreaSearch utilises VIC State Government's Regional/LGA projections released in 2023, adjusted using weighted aggregation methods to SA2 levels. Growth rates by age group are applied across all areas for years 2032 to 2041. Exceptional growth is predicted over the period, with the area expected to grow by 18,965 persons to 2041 based on latest annual ERP population numbers, reflecting an increase of 122.8% in total over the 17 years.
Frequently Asked Questions - Population
Development
The level of residential development activity in Charlemont was found to be higher than 90% of real estate markets across the country
Charlemont has recorded approximately 528 residential properties granted approval annually. Over the past five financial years, from FY-21 to FY-25, 2,641 homes have been approved, with a further 206 approved in FY-26 as of current figures. Each dwelling built over these years has attracted an average of 2.5 new residents annually, indicating strong demand that supports property values.
The average construction cost value for new homes is $228,000, which is lower than regional levels, offering more affordable housing choices for buyers. In FY-26, $10.4 million in commercial approvals have been registered, reflecting steady commercial investment activity in the area. Compared to the Rest of Vic., Charlemont has 417.0% more development activity per person, providing buyers with greater choice. However, recent periods have seen a moderation in this activity, which remains well above national averages, indicating strong developer confidence. The new development consists of 92.0% detached dwellings and 8.0% medium to high-density housing, preserving the area's low-density nature and attracting space-seeking buyers with its emphasis on detached housing.
With around 26 people per dwelling approval, Charlemont exhibits characteristics of a growth area. According to the latest AreaSearch quarterly estimate, Charlemont is projected to add 18,187 residents by 2041. Building activity appears to be keeping pace with these growth projections, though buyers may face increased competition as the population grows.
Frequently Asked Questions - Development
Infrastructure
Charlemont has moderate levels of nearby infrastructure activity, ranking in the 45thth percentile nationally
Changes to local infrastructure significantly influence an area's performance. AreaSearch has identified 39 projects likely to impact the area. Key projects include Charlemont Rise Estate, Stockland Banksia Armstrong Creek, Armstrong Creek Town Centre, and Yirrama Primary School. The following list details those likely to be most relevant.
Professional plan users can use the search below to filter and access additional projects.
INFRASTRUCTURE SEARCH
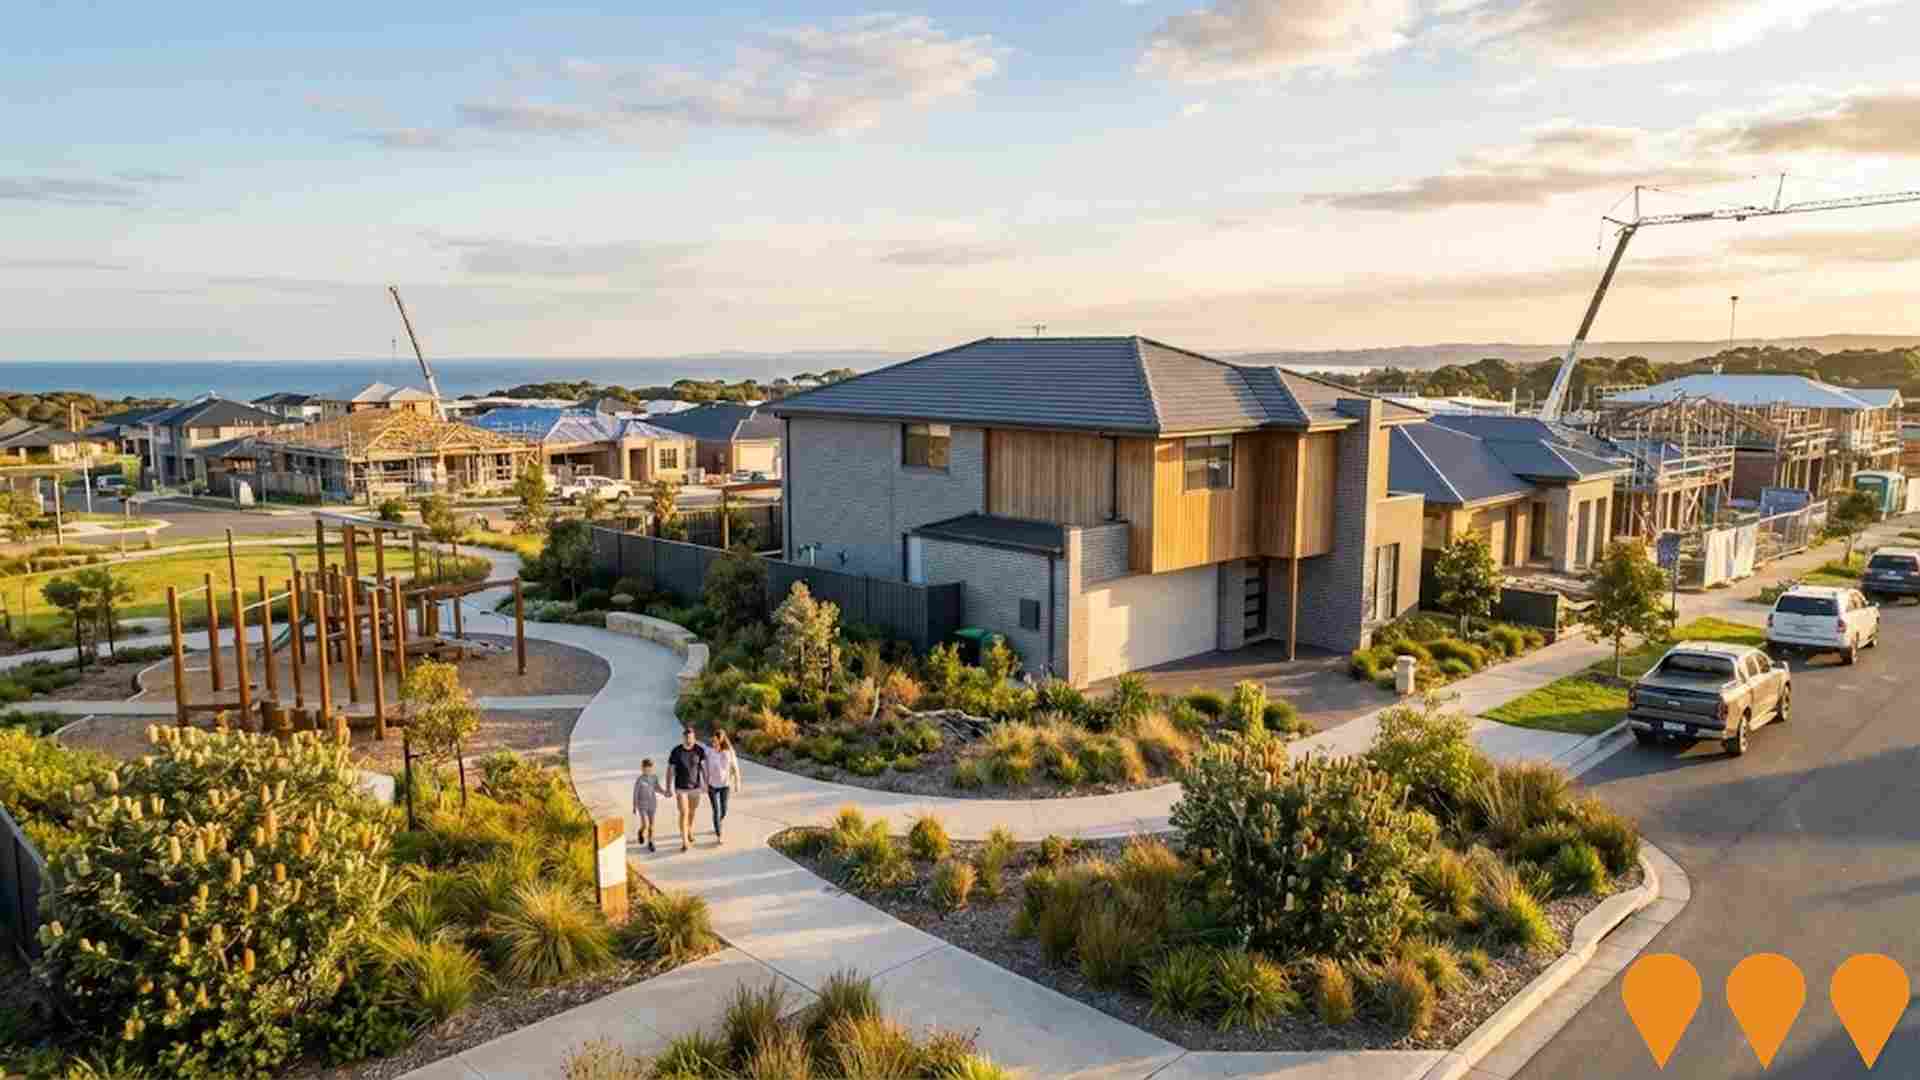
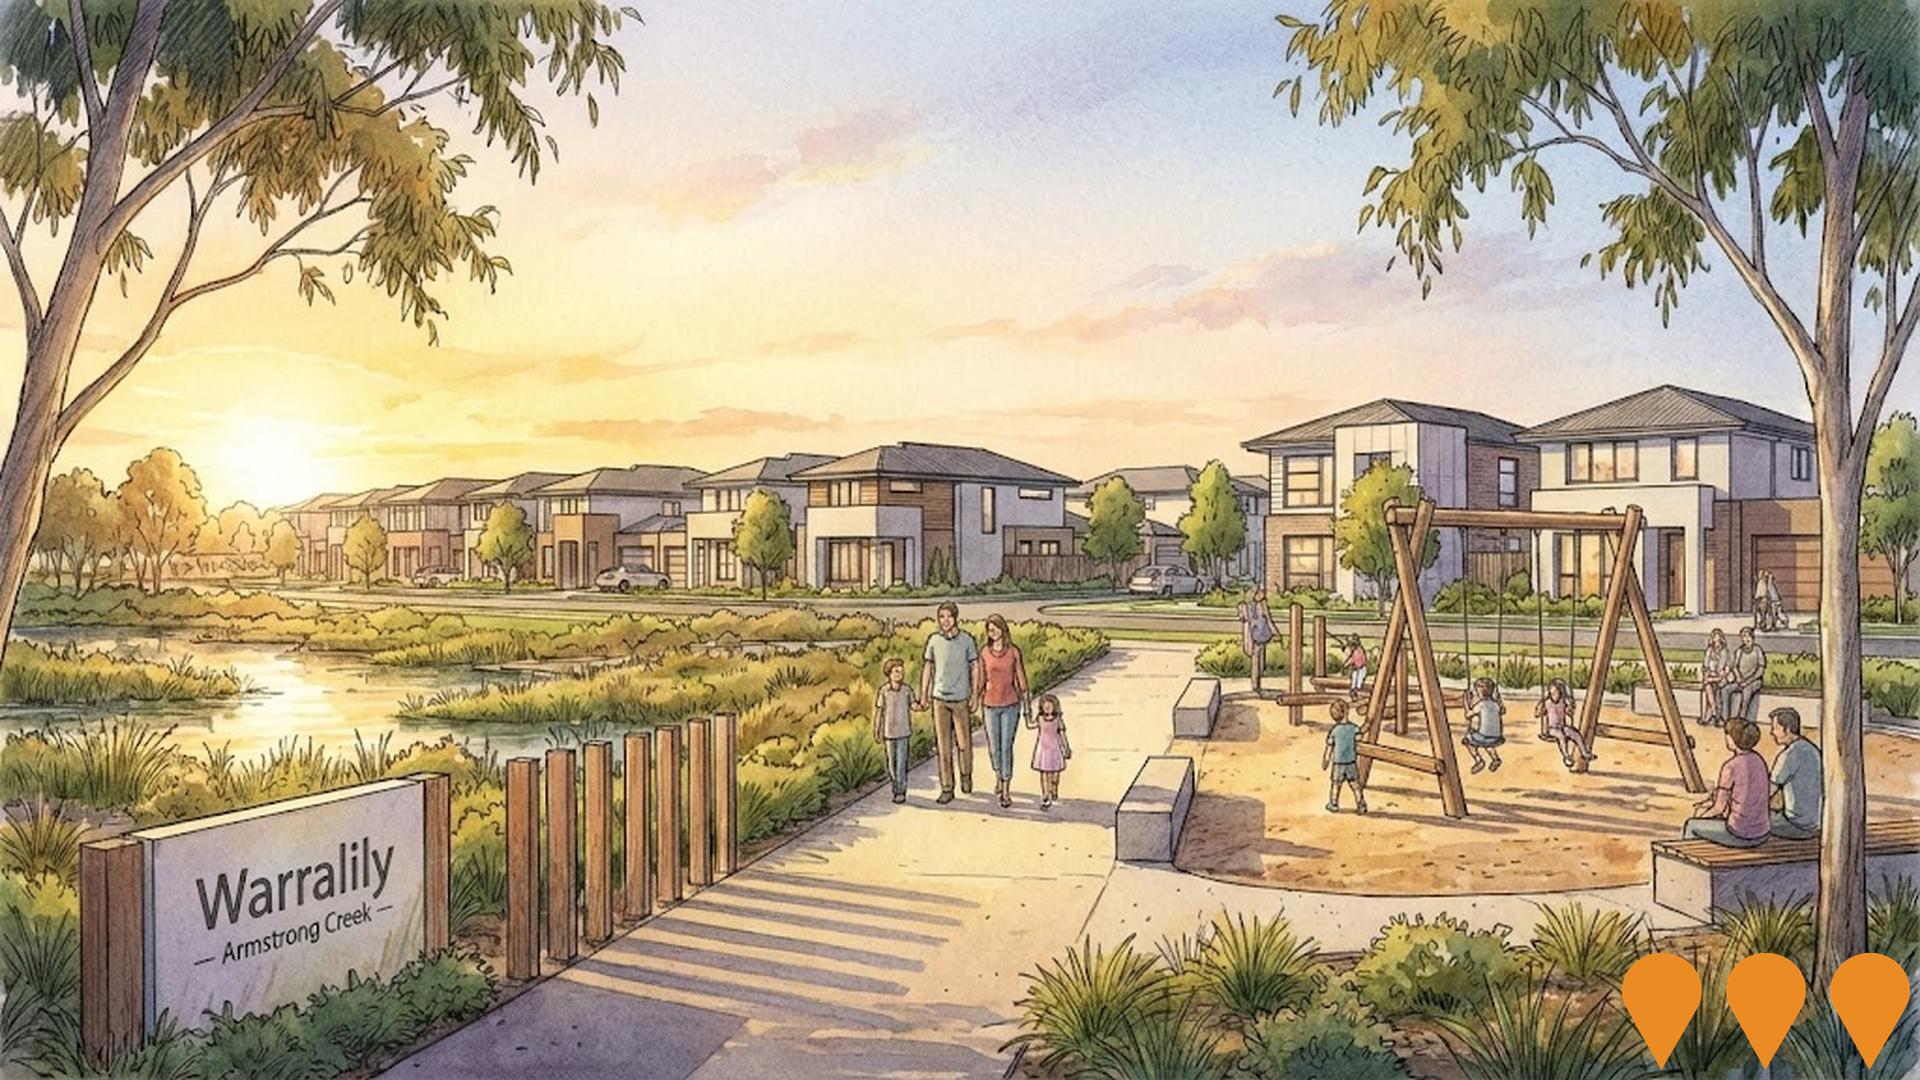
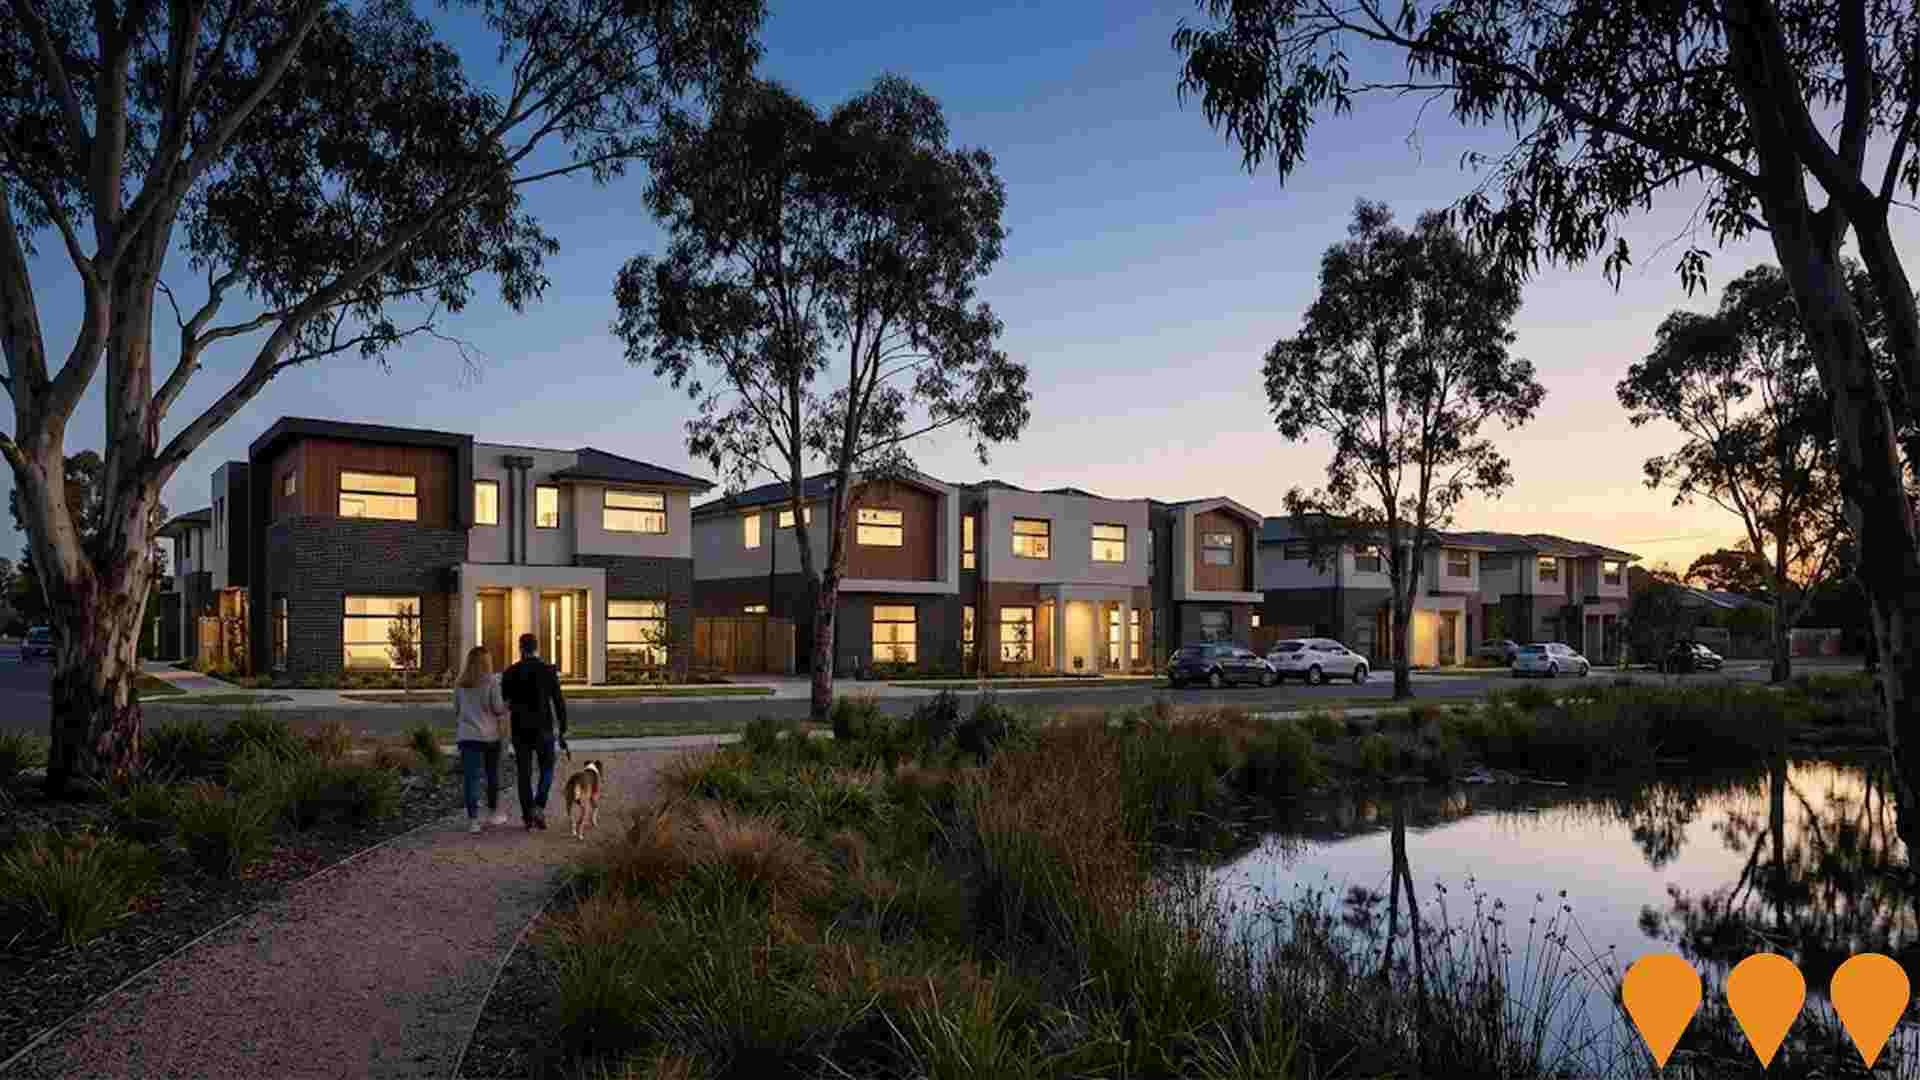
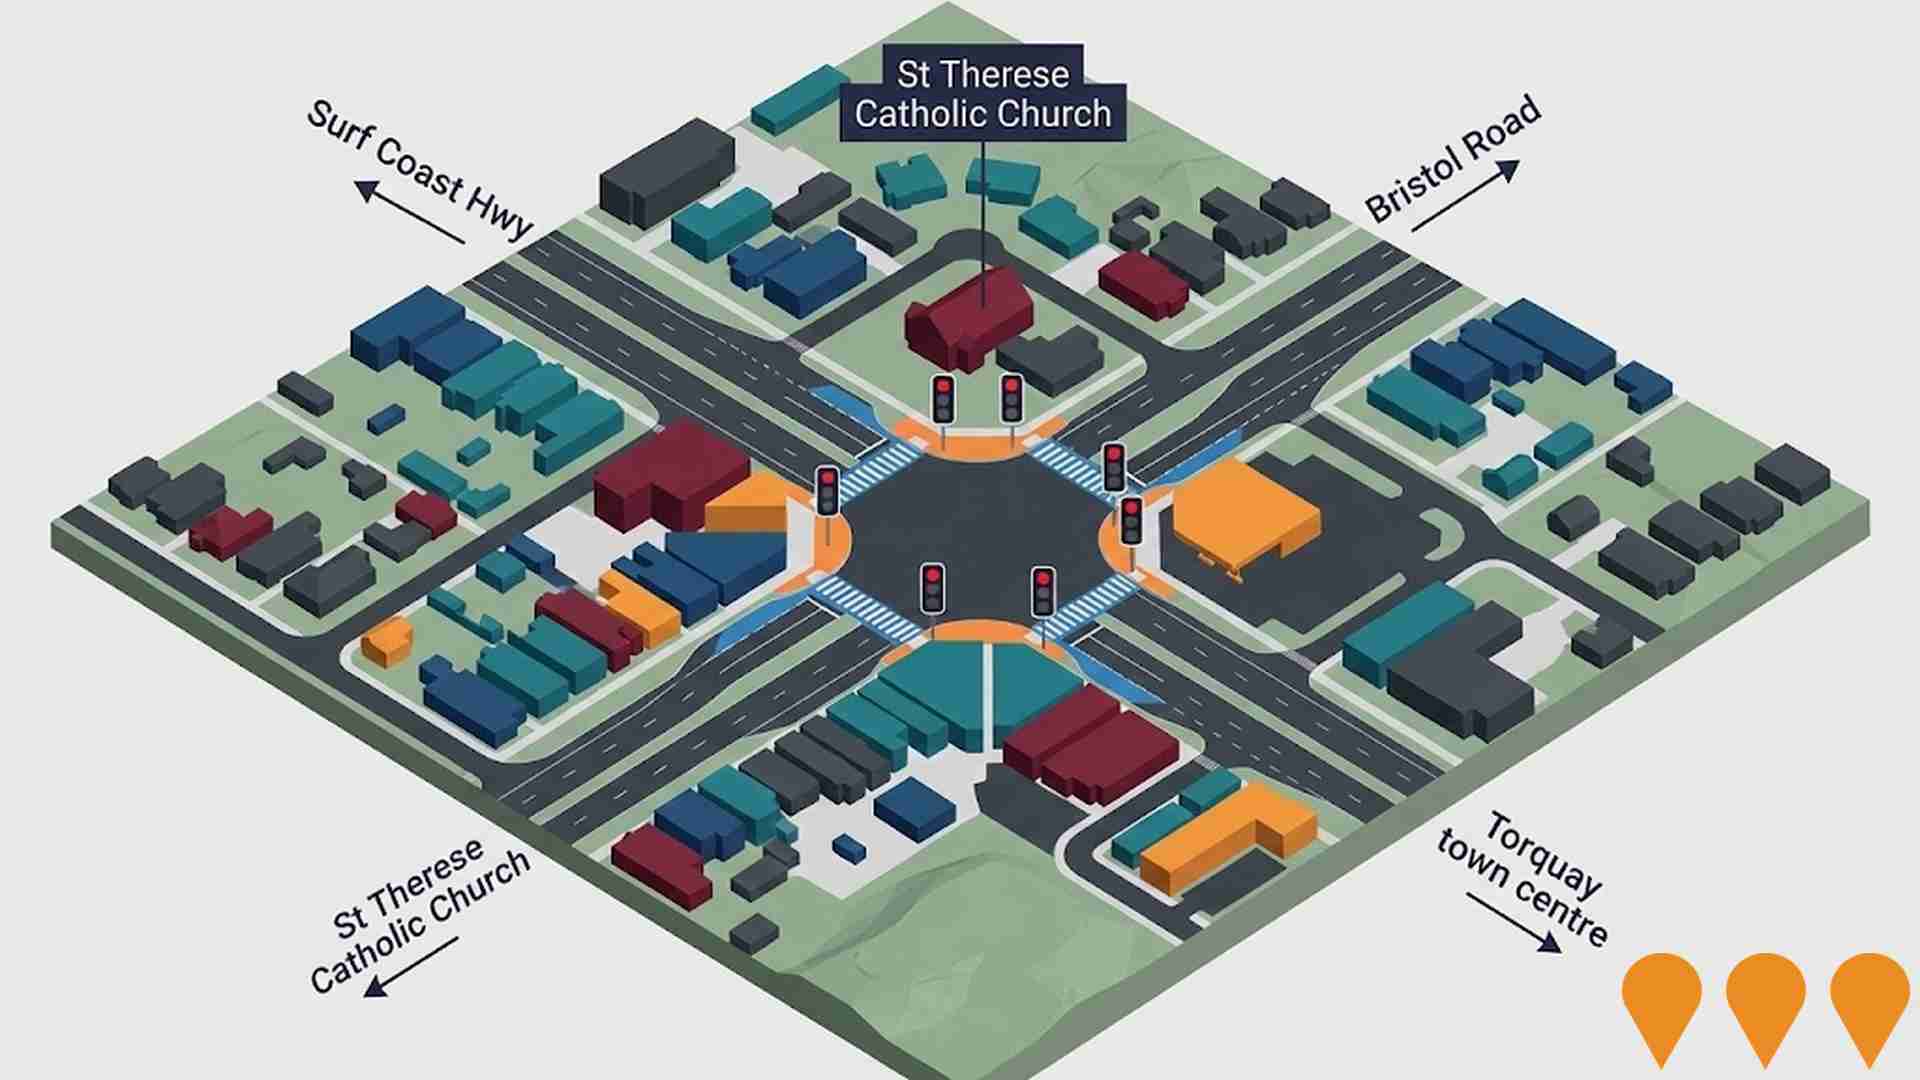
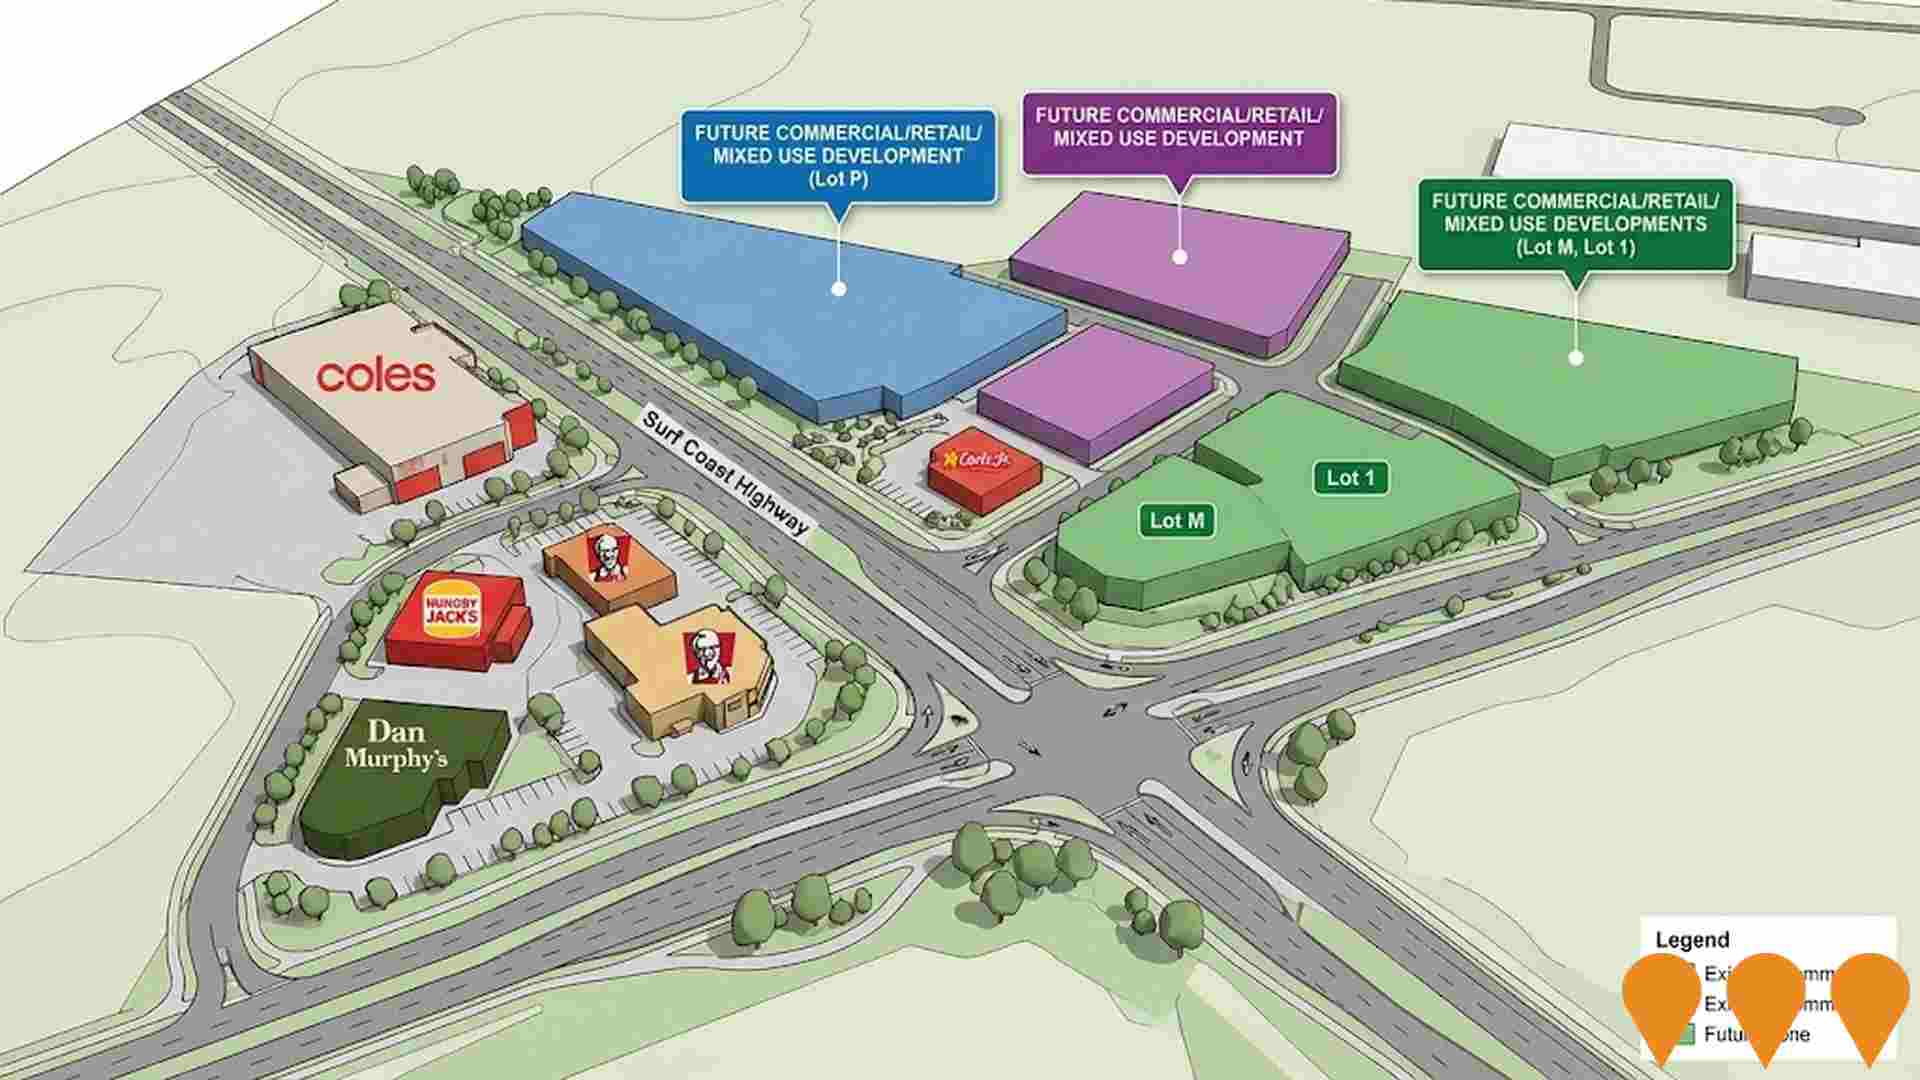
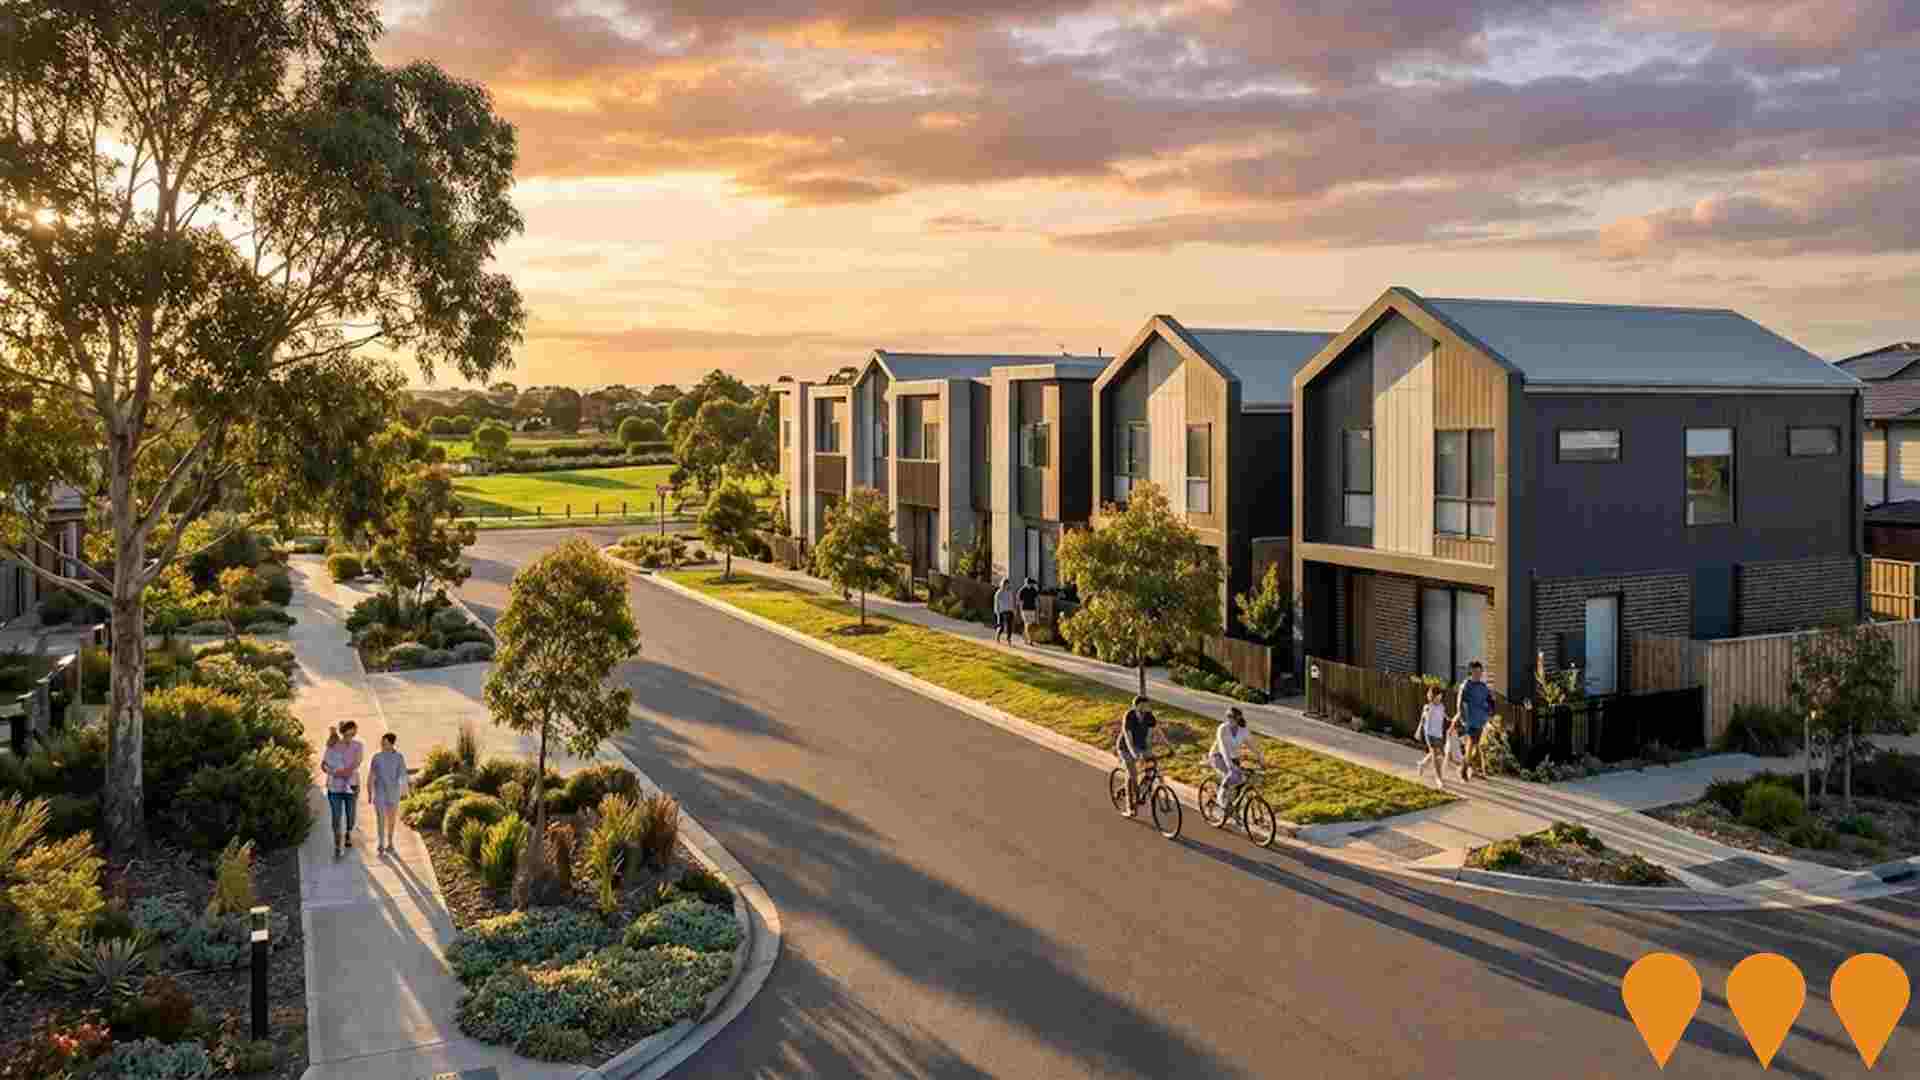
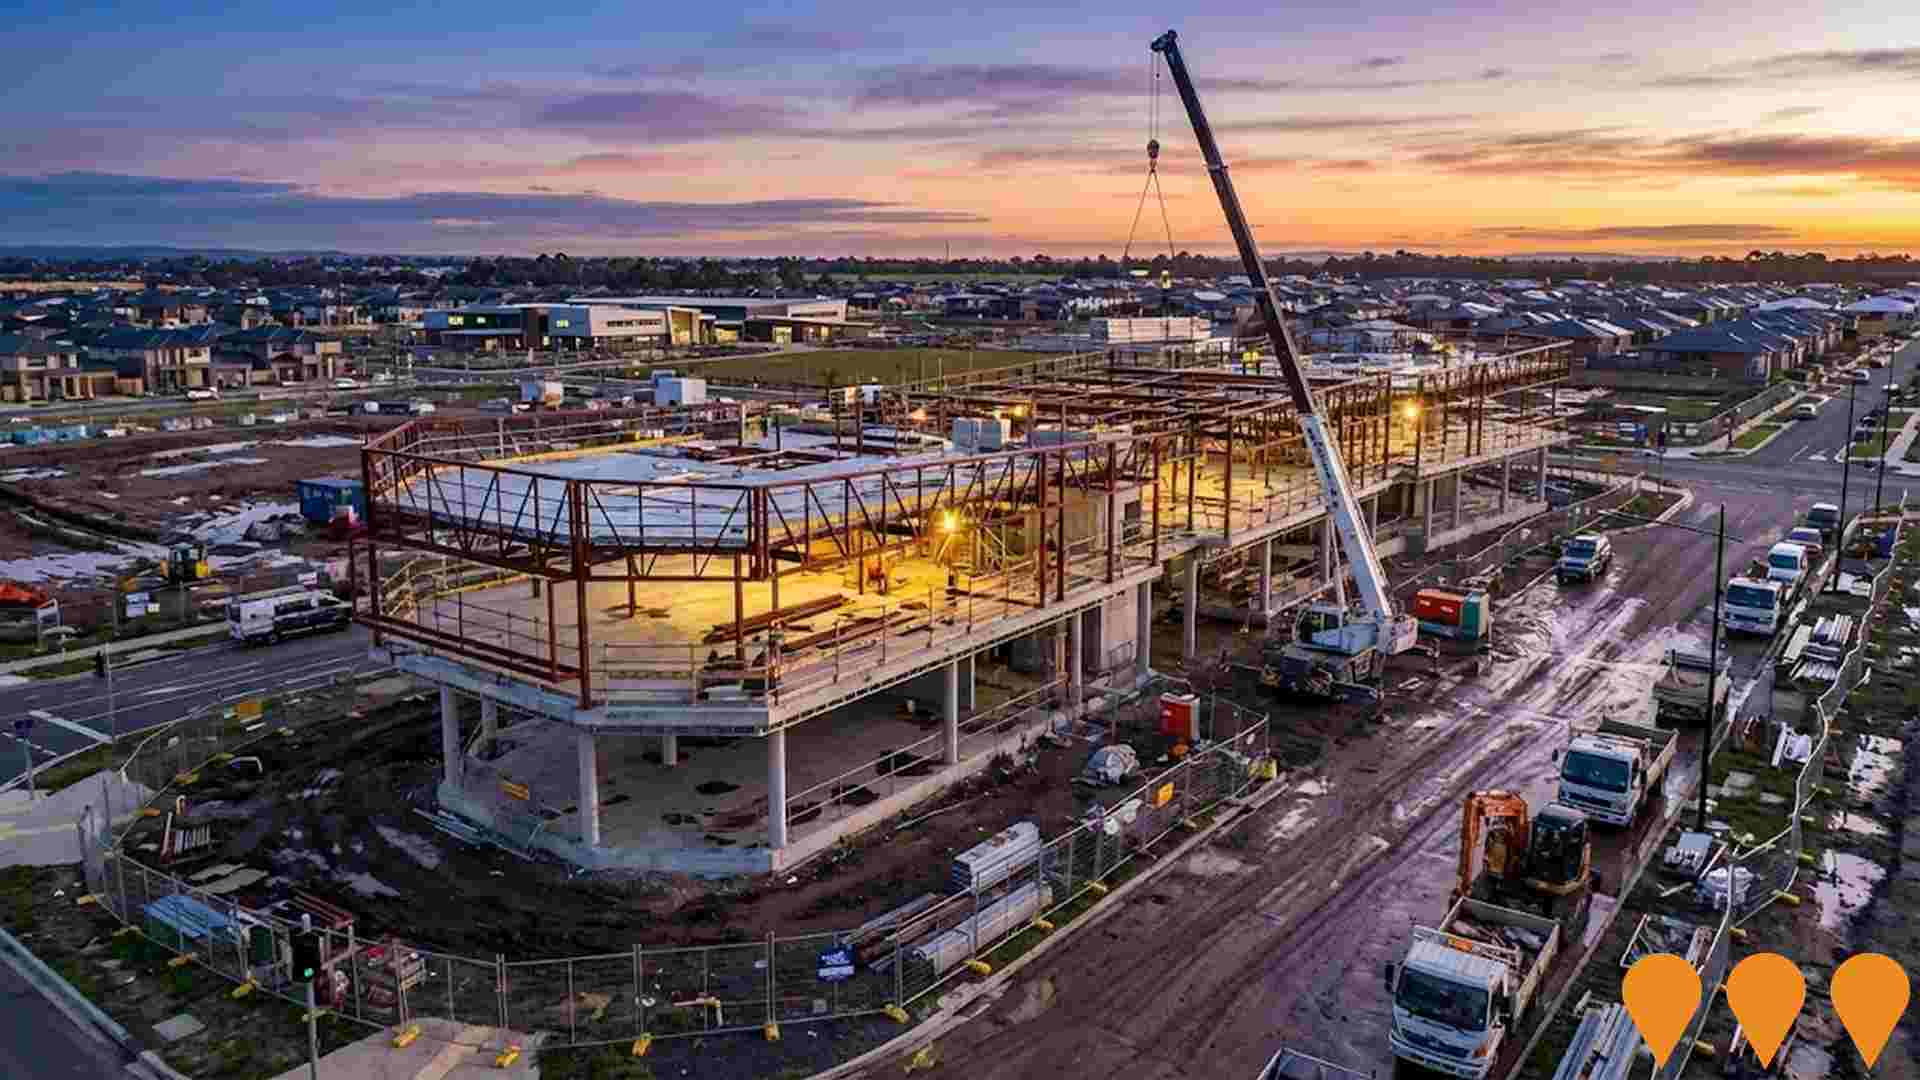
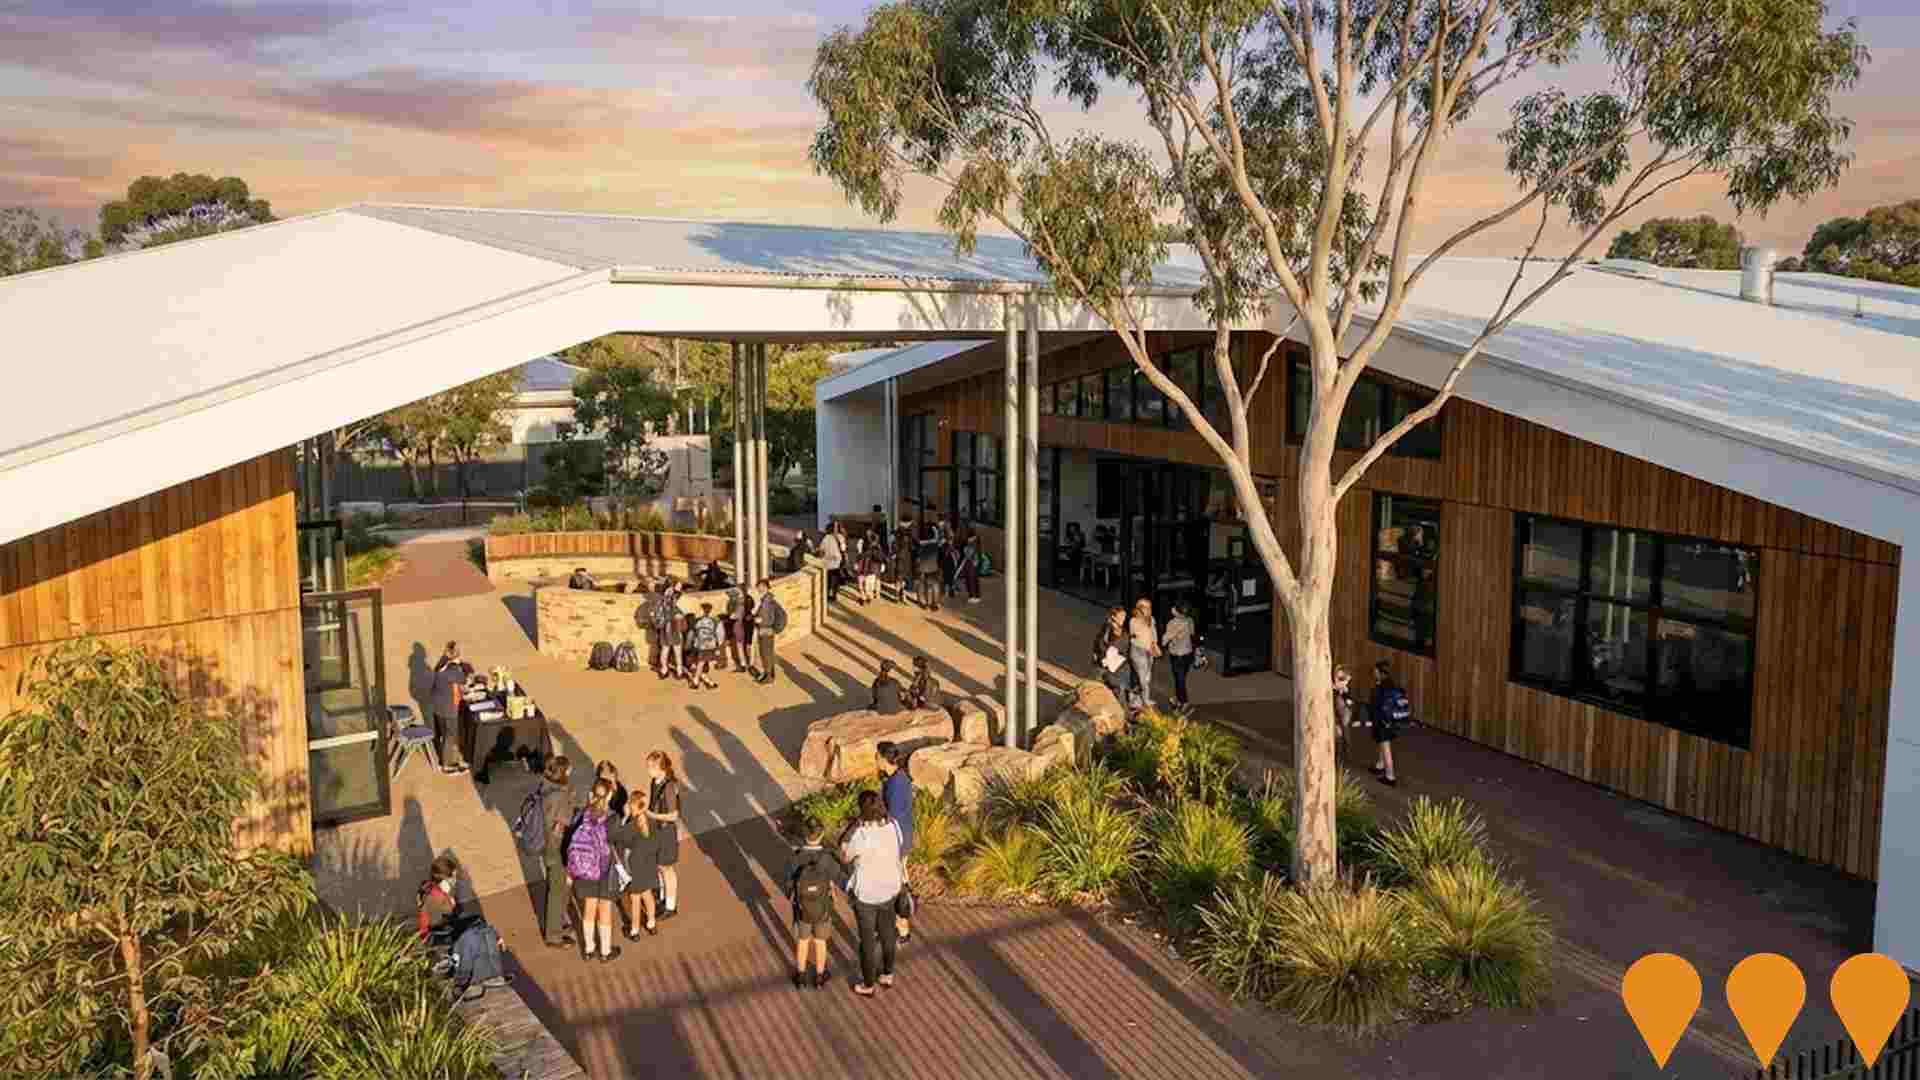
 Denotes AI-based impression for illustrative purposes only, not to be taken as definitive under any circumstances. Please follow links and conduct other investigations from the project's source for actual imagery. Developers and project owners wishing us to use original imagery please Contact Us and we will do so.
Frequently Asked Questions - Infrastructure
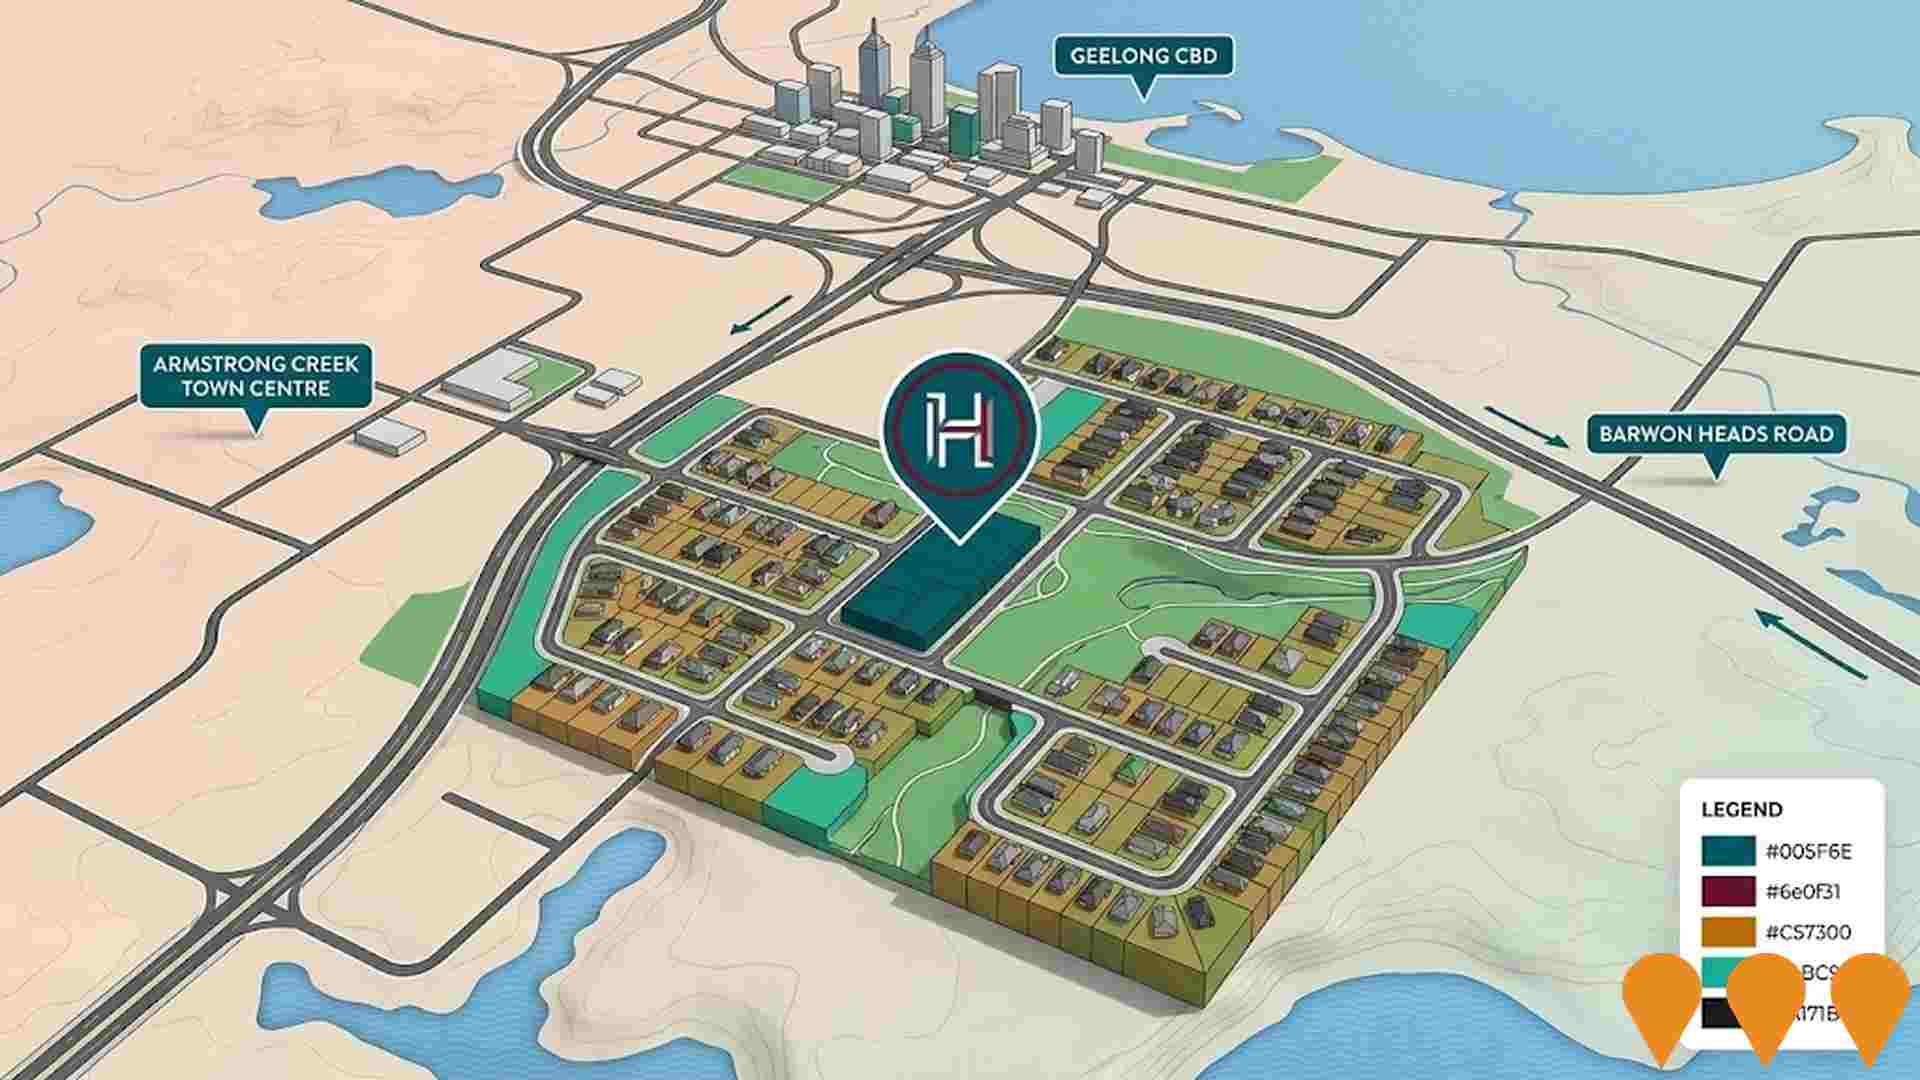
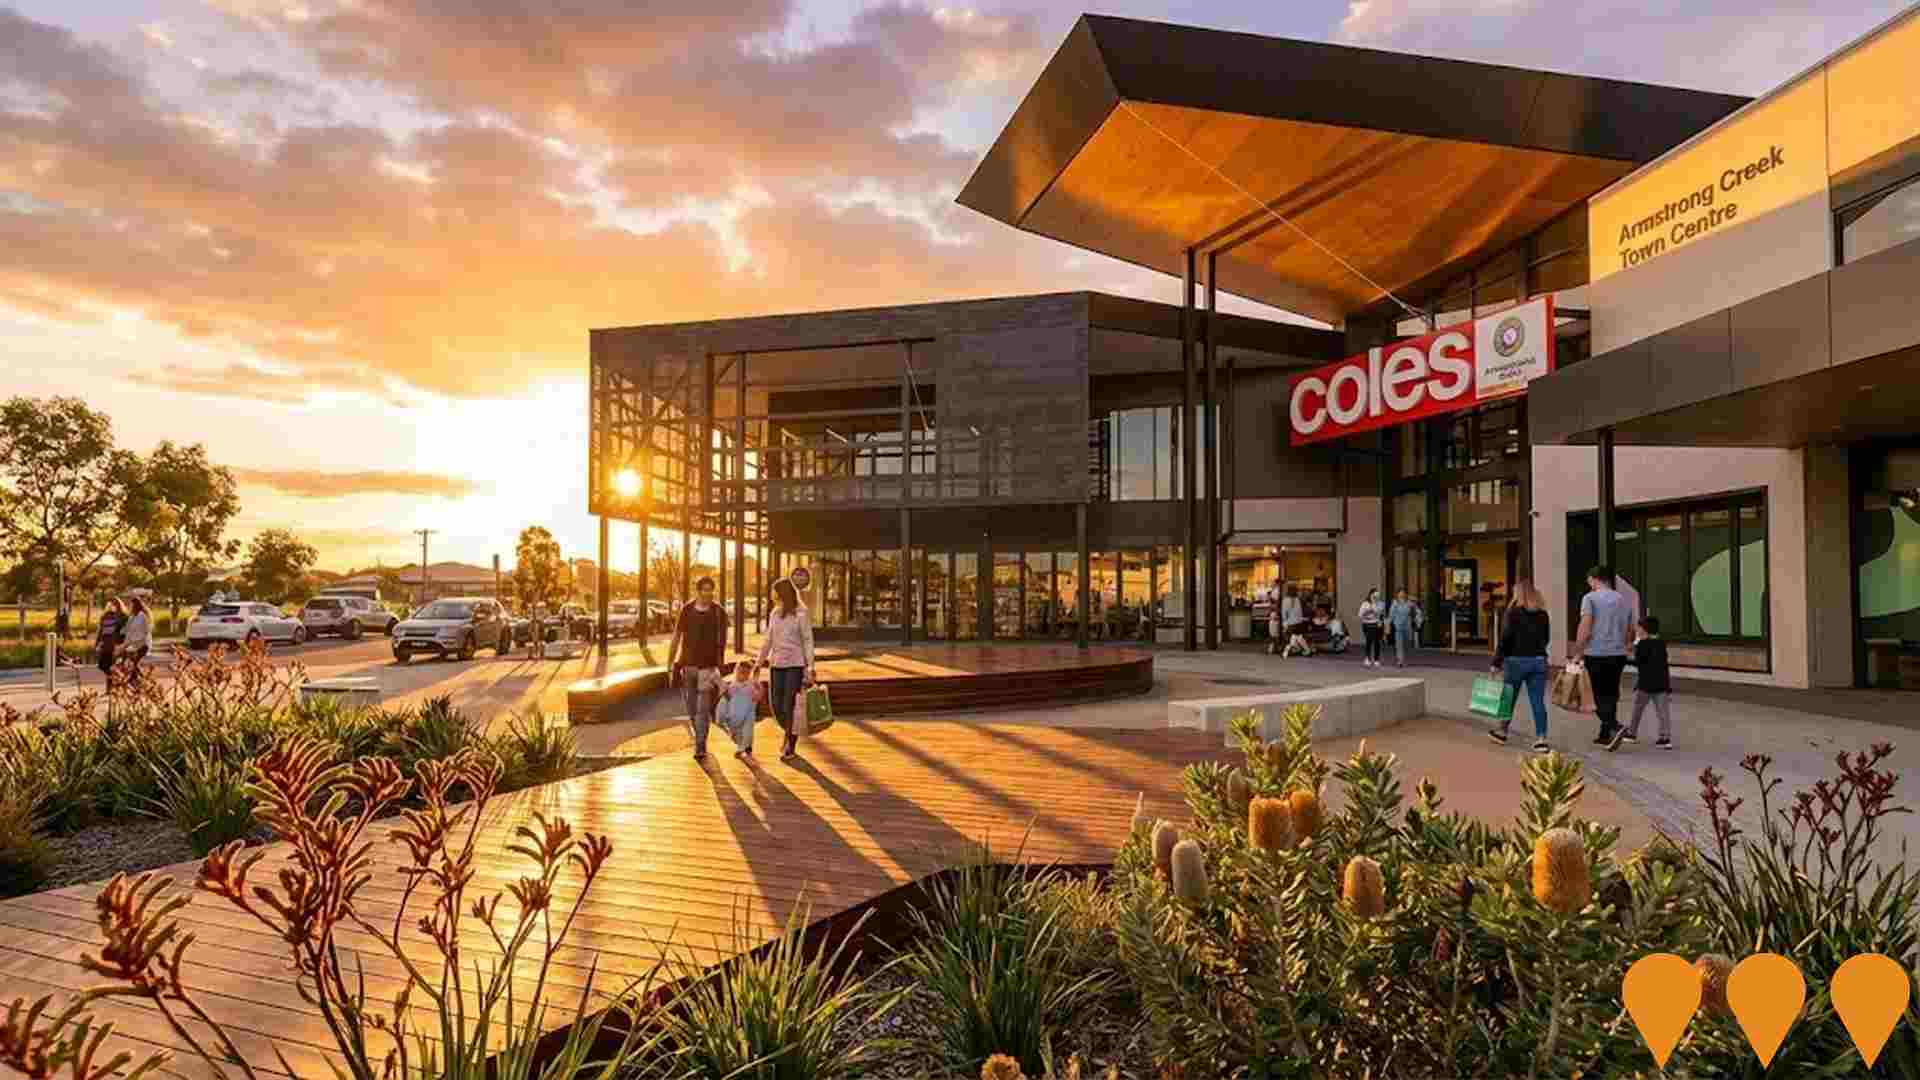
Armstrong Creek Town Centre
A $1 billion, 40-hectare master-planned mixed-use precinct serving as the civic, commercial, and social heart of the Armstrong Creek growth area. Stage 1 (retail) is complete, anchored by Coles and Dan Murphy's. Current works include the $89 million Armstrong Creek Sports Centre (Stage 1 of the civic precinct) and Stage 2 of the retail precinct. The full vision comprises retail, entertainment, commercial, residential, hotel, and wellness facilities, growing to serve 110,000+ residents by 2036.
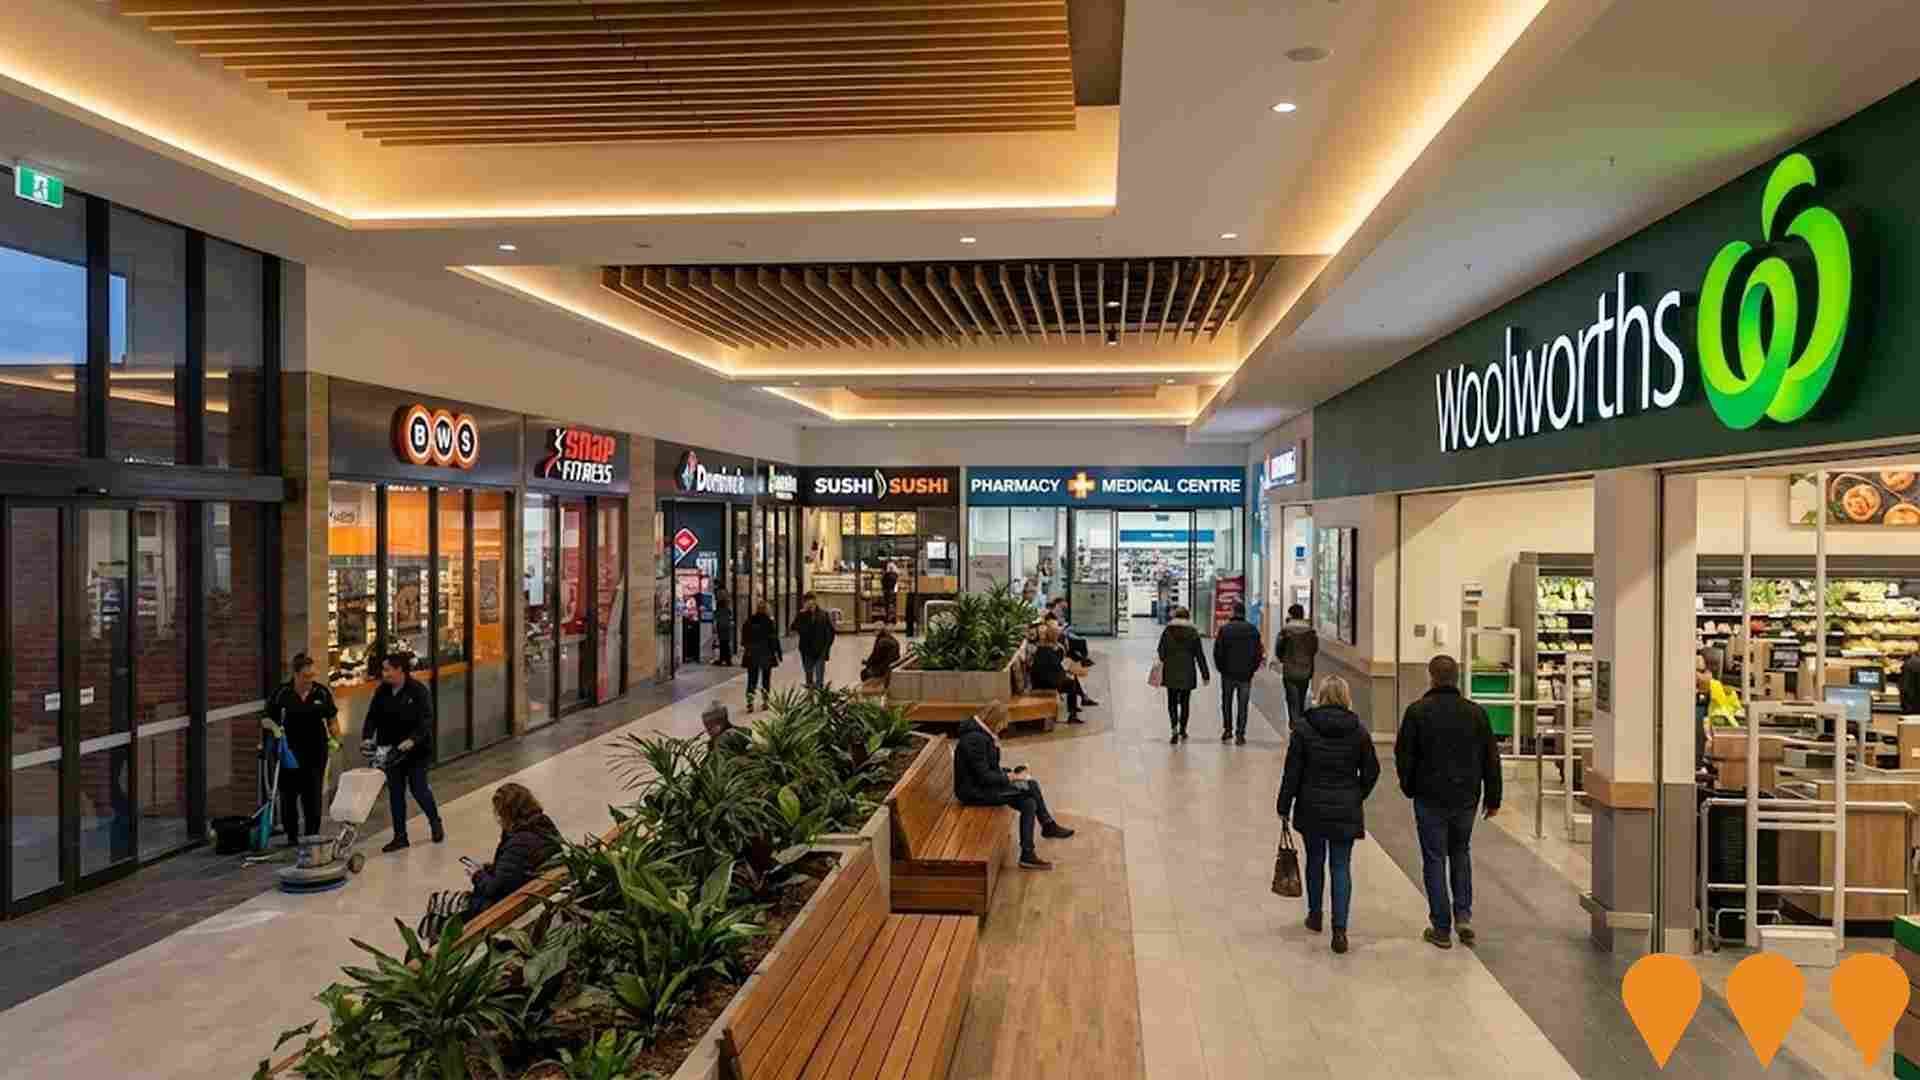
Charlemont Rise Shopping Centre
A 9,424 square metre neighbourhood shopping centre anchored by full-line Woolworths and BWS, featuring 24 specialty tenancies including Snap Fitness, medical centre, pharmacy, Dominos, Sushi Sushi, beauty services, and restaurants. The development includes a 2-storey commercial centre with 6 office tenancies, 241 car parks including undercover options, and a 6-bay drive-through click and collect facility. Opened June 2025 after 14 months of construction, serving the rapidly growing Charlemont Rise Estate in Geelong's growth corridor.
Charlemont Rise Estate
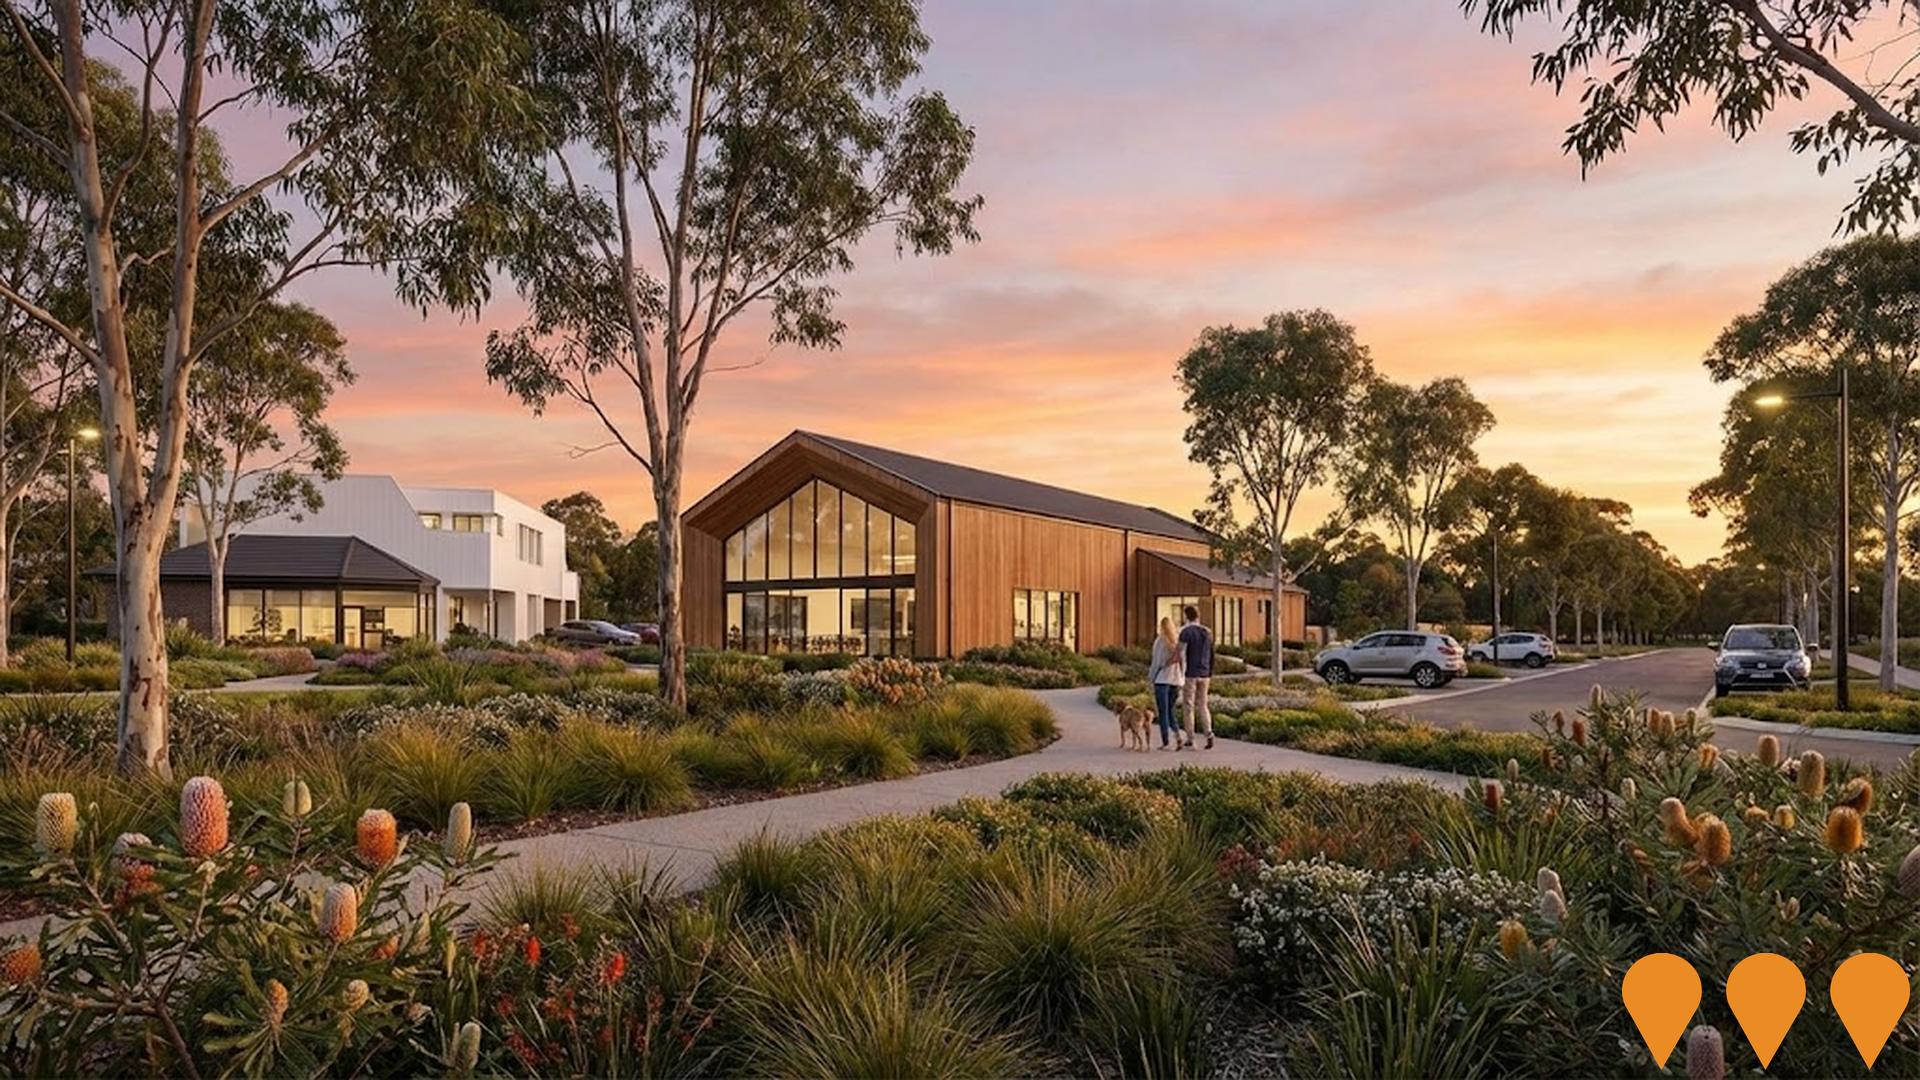
Master-planned residential estate featuring over 1,400 lots with panoramic views over Geelong and the Bellarine Peninsula. Includes tree-lined streets, conservation reserves, community amenities, and Game of Thrones-themed street names.
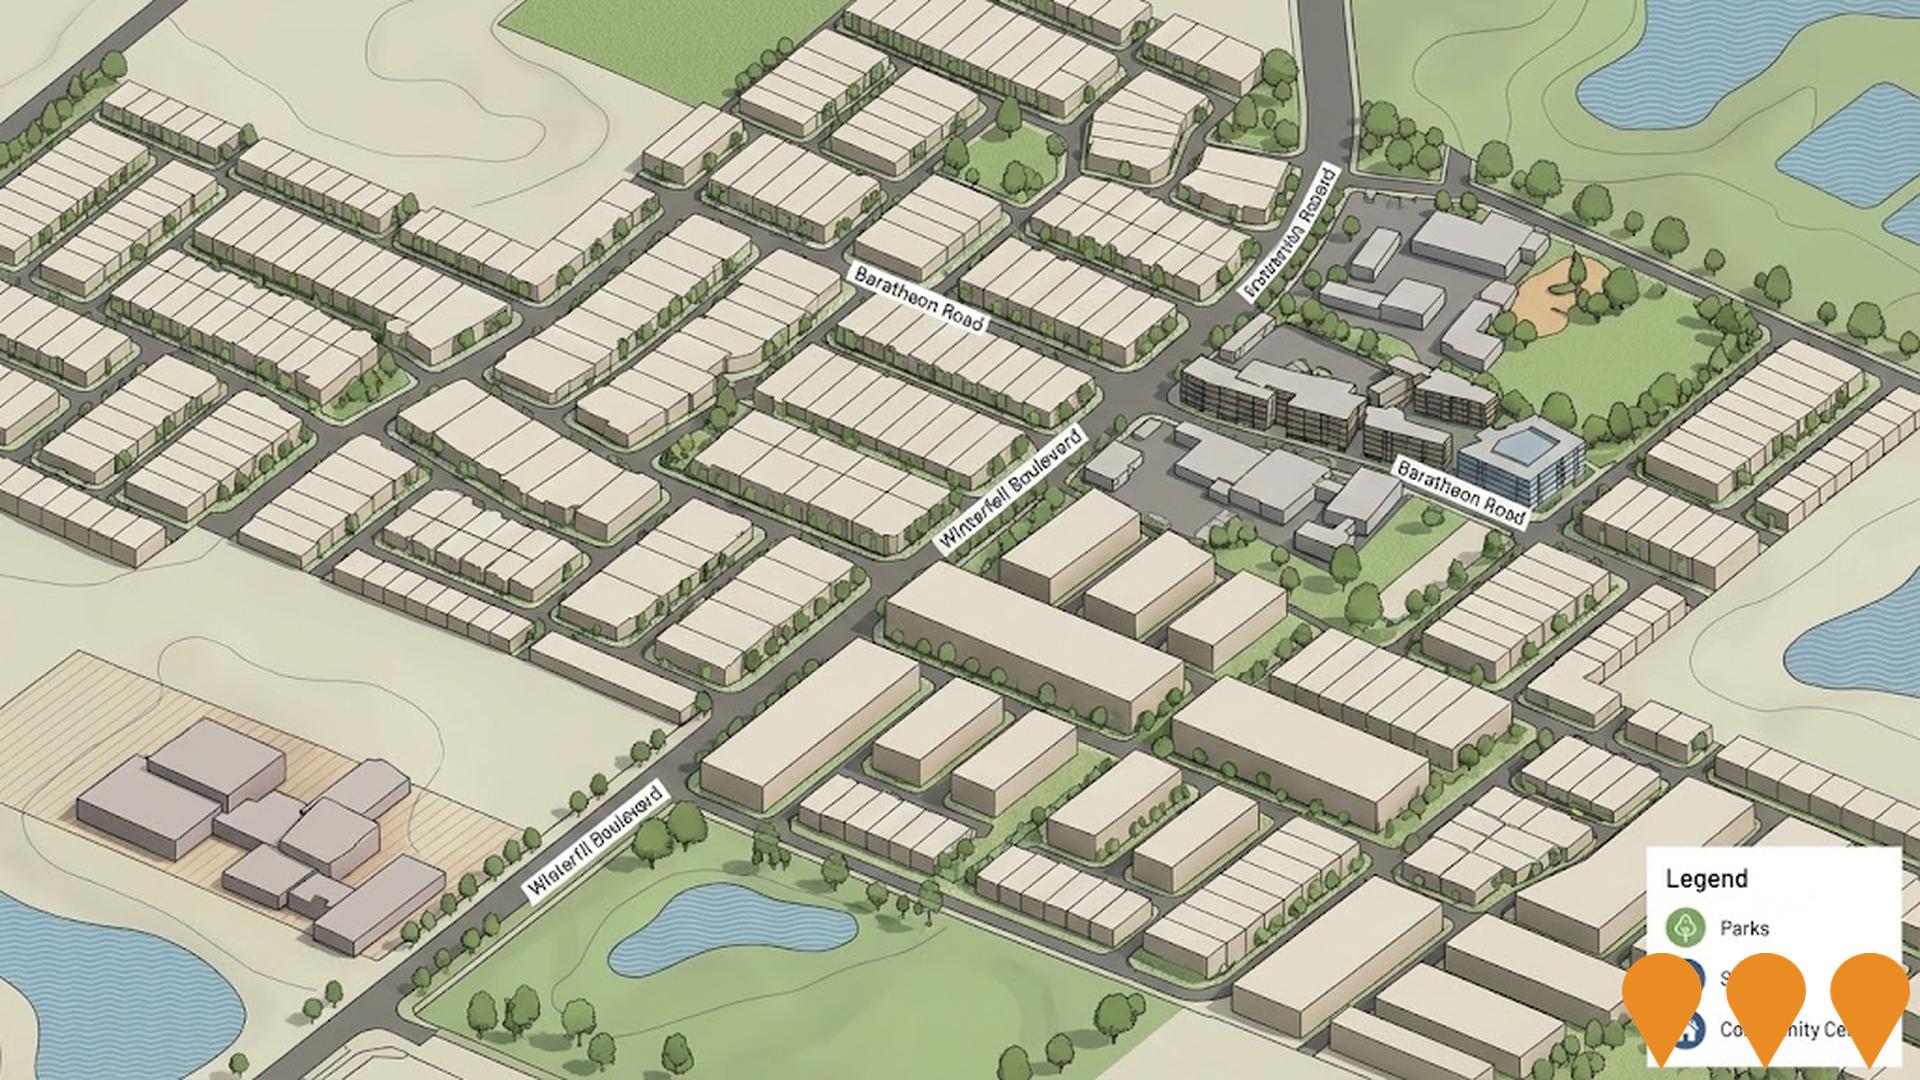
Armstrong Creek Mixed Use Precinct (465 Surf Coast Highway)
4.96 ha mixed-use development site opposite Armstrong Creek Town Centre with 420 m frontage to Surf Coast Highway. Site sold in August 2025 to an undisclosed buyer. Existing development approval for 43 townhouses on two of the three lots. Future development potential for additional residential, retail and commercial uses subject to new planning permits.
Harriott Armstrong Creek
Harriott is a premium masterplanned community in Armstrong Creek, offering titled land and townhomes. Located between The Village Warralily and future Sparrovale Wetlands, it features 721 lots across 13 stages including medium density housing and lifestyle blocks. The development includes Central Park as a green spine, 21 hectares of sporting facilities, 500 hectares of conserved wetlands, and integrated walking trails. Construction has commenced with the first 45 townhomes underway and settlements of stages 1-13 in progress.
Armstrong Creek Sports Centre
As part of the Victorian Government's Regional Sports Infrastructure Program, a new $25 million multi-sport facility is being built in Armstrong Creek to increase sports participation among the Geelong community, support local businesses, and create employment opportunities. Features four indoor multi-sport courts, cafe, changing facilities, sensory room, gymnasium, fitness centre, community spaces, meeting rooms, civic plaza with outdoor activities including basketball/netball hoops, skating areas, parkour, nature play spaces, table tennis, outdoor courts, and car parking with EV charging. Five Star Green Star certified. Being delivered by Development Victoria with Fairbrother contractor and Warren & Mahoney architects.

Horseshoe Bend Community Hub
A purpose-built integrated children's centre and community hub featuring 4 kindergarten rooms for 132 children at a time (237 places per week), 3 maternal and child health rooms, 2 multipurpose community rooms, 2 meeting spaces, outdoor play spaces, amenities, landscaping, and car parking. The hub is co-located next to Yirrama Primary School and designed to mirror the elegant wings of a magpie in consultation with the Wadawurrung Traditional Owners. Opening January 2027.
Yirrama Primary School
A new primary school providing places for up to 525 students from Prep to Year 6, set to open in Term 1, 2026. The school will feature 2 learning neighbourhoods, an administration and library building, outdoor hard courts, a community hub with indoor multi-use court, canteen and arts/music spaces, and a sports field. The school name Yirrama (pronounced yi-rah-mah) is a Wadawurrung word meaning 'in the morning', chosen in consultation with the Wadawurrung Traditional Owner group. Joel Riddle has been appointed as principal. Construction is being undertaken on a 35,000 square meter site to serve the growing Charlemont community in Armstrong Creek.
Employment
AreaSearch analysis places Charlemont well above average for employment performance across multiple indicators
Charlemont's workforce is well-educated with significant representation in essential services sectors. The unemployment rate was 2.7% as of September 2025, with an estimated employment growth of 0.6% over the past year.
There were 8,111 residents employed at this time, with an unemployment rate 1.1% lower than Rest of Vic.'s 3.8%. Workforce participation was higher at 71.8%, compared to Rest of Vic.'s 57.4%. The dominant employment sectors among residents were health care & social assistance, construction, and retail trade. Health care & social assistance had an employment share 1.3 times the regional level, while agriculture, forestry & fishing employed just 0.6% of local workers, below Rest of Vic.'s 7.5%.
The area's predominantly residential nature may limit local employment opportunities, as indicated by the count of Census working population versus resident population. In the 12-month period ending September 2025, employment increased by 0.6%, while the labour force rose by 1.1%, causing the unemployment rate to rise by 0.5 percentage points. This contrasted with Rest of Vic., where employment contracted by 0.7% and the labour force fell by 0.6%. State-level data from 25-Nov-25 showed VIC employment grew by 1.13% year-on-year, adding 41,950 jobs, with the state unemployment rate at 4.7%, compared to the national rate of 4.3%. Jobs and Skills Australia's national employment forecasts from May-25 suggested national employment would expand by 6.6% over five years and 13.7% over ten years. Applying these projections to Charlemont's employment mix indicated local employment should increase by 6.9% over five years and 14.2% over ten years, though these are simple extrapolations for illustrative purposes and do not account for localized population projections.
Frequently Asked Questions - Employment
Income
Income analysis reveals strong economic positioning, with the area outperforming 60% of locations assessed nationally by AreaSearch
AreaSearch's data for financial year ending June 30, 2022 shows median income in Charlemont SA2 was $57,406, with average income at $66,375. This compares to Rest of Vic.'s median income of $48,741 and average income of $60,693. By September 2025, estimated median income in Charlemont is approximately $64,387, and average income is $74,446, based on Wage Price Index growth since June 2022. The 2021 Census data indicates household incomes in Charlemont are at the 66th percentile nationally. The dominant earnings bracket is $1,500 - 2,999, with 43.8% of locals earning within this range. High housing costs consume 17.3% of income, but strong earnings place disposable income at the 62nd percentile. Charlemont's SEIFA income ranking places it in the 6th decile.
Frequently Asked Questions - Income
Housing
Charlemont is characterized by a predominantly suburban housing profile, with ownership patterns similar to the broader region
Charlemont's dwelling structure, as per the latest Census, consisted of 90.5% houses and 9.5% other dwellings. In comparison, Non-Metro Vic.'s dwelling structure was 84.6% houses and 15.4% other dwellings. Home ownership in Charlemont stood at 16.2%, with mortgaged dwellings at 53.8% and rented ones at 30.1%. The median monthly mortgage repayment in the area was $1,755, higher than Non-Metro Vic.'s average of $1,712. The median weekly rent figure in Charlemont was $420, compared to Non-Metro Vic.'s $335. Nationally, Charlemont's mortgage repayments were lower than the Australian average of $1,863, while rents were substantially higher at $420 versus the national figure of $375.
Frequently Asked Questions - Housing
Household Composition
Charlemont features high concentrations of group households, with a higher-than-average median household size
Family households constitute 71.2% of all households, including 32.7% couples with children, 27.9% couples without children, and 9.6% single parent families. Non-family households comprise the remaining 28.8%, with lone person households at 22.2% and group households making up 6.6%. The median household size is 2.6 people, larger than the Rest of Vic. average of 2.4.
Frequently Asked Questions - Households
Local Schools & Education
Educational achievement in Charlemont places it within the top 10% nationally, reflecting strong academic performance and high qualification levels across the community
The area's educational profile is notable regionally, with university qualification rates of 29.9% among residents aged 15+, surpassing the Rest of Vic. average of 21.7%. This reflects the community's emphasis on higher education. Bachelor degrees are most prevalent at 20.8%, followed by postgraduate qualifications (5.8%) and graduate diplomas (3.3%).
Trade and technical skills are prominent, with 38.0% of residents aged 15+ holding vocational credentials – advanced diplomas (13.7%) and certificates (24.3%). Educational participation is high, with 28.9% of residents currently enrolled in formal education. This includes 9.2% in primary education, 6.7% in tertiary education, and 4.7% pursuing secondary education.
Frequently Asked Questions - Education
Schools Detail
Nearby Services & Amenities
Transport
Transport servicing is moderate compared to other areas nationally based on assessment of service frequency, route connectivity and accessibility
Charlemont has 57 active public transport stops, serving a mix of train and bus routes. These stops are covered by 17 individual routes, collectively facilitating 2,455 weekly passenger trips. The average distance from residents to the nearest stop is 234 meters, indicating good transport accessibility.
Service frequency averages 350 trips per day across all routes, translating to approximately 43 weekly trips per individual stop.
Frequently Asked Questions - Transport
Transport Stops Detail
Health
Health performance in Charlemont is lower than average with common health conditions somewhat prevalent across the board, though to a considerably higher degree among older age cohorts
Charlemont faces significant health challenges with common health conditions somewhat prevalent across the board, particularly among older age cohorts.
The rate of private health cover in Charlemont is approximately 52%, which is higher than the average SA2 area's rate (~7,757 people). The most common medical conditions are mental health issues and asthma, impacting 10.8% and 8.9% of residents respectively. Conversely, 68.5% of residents declared themselves completely clear of medical ailments compared to 65.9% across Rest of Vic.. Charlemont has a lower proportion of seniors aged 65 and over at 10.4% (1,535 people) compared to the 16.8% in Rest of Vic.. Health outcomes among seniors require more attention than those among the broader population.
Frequently Asked Questions - Health
Cultural Diversity
In terms of cultural diversity, Charlemont records figures broadly comparable to the national average, as found in AreaSearch's assessment of a number of language and cultural background related metrics
Charlemont's population showed above-average cultural diversity, with 19.1% born overseas and 14.5% speaking a language other than English at home. Christianity was the predominant religion, comprising 41.8%. The 'Other' category had a higher representation in Charlemont at 2.4%, compared to 1.2% regionally.
For ancestry, the top three groups were English (28.0%), Australian (27.3%), and Irish (8.9%). Notably, Dutch (1.9%) was slightly overrepresented compared to the regional average of 2.0%. Similarly, Indian (3.2%) and Filipino (1.6%) groups had higher representations than their respective regional averages of 1.6% and 0.9%.
Frequently Asked Questions - Diversity
Age
Charlemont hosts a very young demographic, ranking in the bottom 10% of areas nationwide
Charlemont's median age is 30 years, which is lower than both the Rest of Vic. average of 43 and the Australian median of 38. Compared to Rest of Vic., Charlemont has a higher concentration of 25-34 year-olds at 25.0%, but fewer 65-74 year-olds at 5.0%. This concentration of 25-34 year-olds is well above the national average of 14.5%. Between the 2021 Census and the present, the 35 to 44 age group has grown from 15.2% to 18.6%, while the 25 to 34 cohort increased from 23.8% to 25.0%. Conversely, the 15 to 24 cohort has declined from 12.4% to 10.3%, and the 85+ group dropped from 3.4% to 2.0%. Demographic modeling suggests that Charlemont's age profile will evolve significantly by 2041, with the 25-34 cohort projected to grow by 126%, adding 4,681 residents to reach a total of 8,382 in this age group.
